Interpipe IFRS Consol 2011 FINAL tuning21052012...INTERPIPE LIMITED CONSOLIDATED STATEMENT OF...
55
INTERPIPE LIMITED Consolidated Financial Statements Year ended 31 December 2011 together with Independent Auditor’s Report
Transcript of Interpipe IFRS Consol 2011 FINAL tuning21052012...INTERPIPE LIMITED CONSOLIDATED STATEMENT OF...

INTERPIPE LIMITED
Consolidated Financial Statements Year ended 31 December 2011 together with
Independent Auditor’s Report

INTERPIPE LIMITED
TABLE OF CONTENTS
DIRECTORS’ REPORT ............................................................................................................................................... 3 STATEMENT OF DIRECTORS’ AND MANAGEMENT’S RESPONSIBILITIES .................................................. 6 INDEPENDENT AUDITOR’S REPORT ................................................................................................................... 7 CONSOLIDATED FINANCIAL STATEMENTS FOR THE YEAR ENDED 31 December 2011 Consolidated statement of financial position ................................................................................................................ 9 Consolidated statement of comprehensive income ..................................................................................................... 10 Consolidated statement of changes in equity .............................................................................................................. 11 Consolidated statement of cash flows ......................................................................................................................... 12 NOTES TO CONSOLIDATED FINANCIAL STATEMENTS 1. Corporate information ....................................................................................................................................... 13 2. Basis of preparation ........................................................................................................................................... 13 3. Summary of significant accounting policies ...................................................................................................... 14 4. Significant accounting judgements and estimates ............................................................................................. 24 5. Segment information ......................................................................................................................................... 26 6. Property, plant and equipment ........................................................................................................................... 30 7. Intangible assets and goodwill ........................................................................................................................... 32 8. Investments in associates ................................................................................................................................... 33 9. Income tax ......................................................................................................................................................... 34 10. Prepaid current income tax ................................................................................................................................ 37 11. Inventories ......................................................................................................................................................... 37 12. Trade and other accounts receivable .................................................................................................................. 37 13. Prepayments and other current assets ................................................................................................................ 38 14. Taxes recoverable, other than income tax ......................................................................................................... 38 15. Other financial assets ......................................................................................................................................... 38 16. Cash and cash equivalents ................................................................................................................................. 38 17. Borrowings ........................................................................................................................................................ 39 18. Provisions .......................................................................................................................................................... 42 19. Trade and other accounts payable...................................................................................................................... 45 20. Taxes payable, other than income tax ................................................................................................................ 45 21. Advances and other current liabilities ............................................................................................................... 45 22. Cost of sales ....................................................................................................................................................... 46 23. Selling and distribution expenses ...................................................................................................................... 46 24. General and administrative expenses ................................................................................................................. 46 25. Other operating income and expenses ............................................................................................................... 47 26. Operating and non-operating foreign exchange difference................................................................................ 47 27. Finance income .................................................................................................................................................. 47 28. Finance costs ..................................................................................................................................................... 48 29. Equity ................................................................................................................................................................ 48 30. Business combination ........................................................................................................................................ 49 31. Principal subsidiaries ......................................................................................................................................... 50 32. Related party transactions .................................................................................................................................. 51 33. Commitments, contingencies and operating risks ............................................................................................. 52 34. Financial risk management ................................................................................................................................ 53 35. Events after the reporting period ....................................................................................................................... 55

INTERPIPE LIMITED DIRECTORS’ REPORT FOR THE YEAR ENDED 31 DECEMBER 2011
3
The Directors present their Report together with the accompanying consolidated financial statements (the “Consolidated Financial Statements”) of Interpipe Limited (referred to herein as the “Company”) and its subsidiaries (collectively referred to herein as the “Group”), which comprise the consolidated statement of financial position as at 31 December 2011, and the consolidated statements of comprehensive income, changes in equity and cash flows for the year then ended, and a summary of significant accounting policies and other explanatory notes.
Principal Activity and Subsidiaries
The Company was incorporated under the Companies Law of Cyprus under the name of Ramelton Holdings Limited as a limited liability company on 30 December 2005 and changed its name to Interpipe Limited on 15 May 2007. The registered office and the principal place of business of the Company is Mykinon 12, Lavinia Court, 6th floor, P.C. 1065 Nicosia, Cyprus.
The Company operates through a number of subsidiaries in various jurisdictions (the list of the subsidiaries is disclosed in Note 31 to the accompanying Consolidated Financial Statements) and has concentration of its business in Ukraine, where its production subsidiaries are located.
The principal activity of the Company is holding ownership interests in its subsidiaries, their financing and strategic management. The Group’s activities comprise design, manufacture and distribution of steel tubes and solid-rolled railway wheels.
Development and Performance of the Business
The Group is the largest manufacturer of steel pipes and railway wheels in Ukraine.
Its products are exported to 64 countries and sold domestically.
In 2011, the Group generated revenue from sales of USD 1.7 billion and net profit attributable to the equity holders of the Company amounted to USD 35.7 million. The pipe business segment accounted for 73 per cent of the revenue from sales and 81 per cent of the gross profit and the wheel business segment accounted for 19 per cent of the revenues and 19 per cent of the gross profit in 2011. Further segment information is disclosed in Note 5 to the accompanying Consolidated Financial Statements.
Issued Capital and Capital Distributions
Upon its incorporation on 30 December 2005, the Company issued to the subscribers of its Memorandum of Association 1,000 ordinary shares of CY£1 each at par. On 22 December 2006 the Company issued 4,000 additional ordinary shares of CY£1 each at a premium of CY£ 41,033 each for a total premium of CY£164,132 thousand, which is equivalent to USD 361,091 thousand.
During the period from March to June 2008 a set of amendments was made to the authorised share capital of the Company, including conversion of the authorised share capital into euro, a subdivision of existing shares, a merge of the Company’s shares and two additional issues of shares both before the merging and after it.
In December 2011 the Company issued 1,950,000 additional ordinary shares of EUR 0.01 each (equivalent of USD 26 thousand) at a premium of EUR 25 each for a total premium of EUR 48,591 thousand, which is equivalent of USD 64,974 thousand.
As a result of the above mentioned transactions, as at 31 December 2011, the number of shares equalled to 4,001,950 thousand ordinary shares of EUR 0.01 each and the authorised, issued and fully paid capital of the Company amounted to EUR 40,019 thousand (equivalent of USD 62,304 thousand).
During the year ended 31 December 2011, the Company did not declare any dividends.
Information relating to dividends payable by the subsidiaries is disclosed in Notes 19 and 29 to the accompanying Consolidated Financial Statements.
Principal Risks and Uncertainties
The Group has significant operations in Ukraine and Russia, whose economies continue to display certain characteristics consistent with that of economies in transition. Further discussion about operating risks and uncertainties is presented in Note 33 to the accompanying Consolidated Financial Statements.
Principal financial risks of the Group are discussed in Note 34 to the accompanying Consolidated Financial Statements.

INTERPIPE LIMITED DIRECTORS’ REPORT FOR THE YEAR ENDED 31 DECEMBER 2011
4
Likely Future Developments
The Group’s key strategic objectives are to diversify its geographical presence and product mix in order to enhance its position as a leading producer of pipes and wheels in the CIS region and to expand presence of its products in the global markets. The Group intends to pursue this strategy by increasing its seamless pipe and wheel production, enhancing its product mix and decreasing its costs to improve its profit margins, expanding its global presence and working more closely with its customers to deliver higher value-added products and services.
Research and Development
The Company did not carry out any material research and development activities in 2011.
Events after the Reporting period
Events after the reporting period date are disclosed in Note 35 to the accompanying Consolidated Financial Statements.
Board of Directors
The changes to the Directors during the year and up to the date of this report are:
Name Function Date of appointment
Date of resignation
Gennady Gazin Chairman of the Board of Directors of Interpipe Limited, Chief Executive Officer of EastOne Group 15 October 2007
Olexandr Kirichko Chief Executive Officer of Interpipe Limited 15 October 2007
Andrii Dudnyk Non-Executive Director, Chief Financial Officer of EastOne Group 15 October 2007
Vitaly Sadykov Independent Non-Executive Director, Chief Executive Officer of State Transportation Leasing Company
19 July 2010
Jean Pierre Saltiel Independent Non-Executive Director, Co-Chairman of Ukrainian Economic Advisory Council of Yalta European Strategy
30 November 2007
Ganna Khomenko Non-Executive Director, Fiduciana Trust (Cyprus) Limited
9 December 2009
Yakiv Konstantynivs’ky
Non-Executive Director, Director of the Dnipropetrovsk Affiliate of EastOne Group
20 June 2011
Michael Tsarev Non-Executive Director, Chief Operational Officer of EastOne Group 11 May 2011
Artem Sirazutdinov Non-Executive Director, Chief Investment Officer of EastOne Group
1 October 2008 13 May 2010
Richard Norris Independent Non-Executive Director 3 March 2008 13 January 2010 There being no requirement in the Company's Articles of Association for the retirement of the Directors by rotation, the remaining Directors presently members of the Board continue in the office. There were no significant changes in the assignment of responsibilities and remuneration of the Board of Directors during the year and up to the date of this report.


INTERPIPE LIMITED CONSOLIDATED STATEMENT OF COMPREHENSIVE INCOME FOR THE YEAR ENDED 31 DECEMBER 2011 (in US dollars and in thousands)
10
Notes 2011 2010
Revenue 5 1,669,673 1,257,890 Cost of sales 22 (1,359,633) (1,054,211)
Gross profit 310,040 203,679
Selling and distribution expenses 23 (105,955) (88,458) General and administrative expenses 24 (53,850) (45,382) Other operating income and expenses 25 5,760 (18,219) Operating foreign exchange difference 26 2,031 1,878
Operating profit 158,026 53,498 Finance income 27 2,754 1,400 Finance costs 28 (95,516) (76,261) Non-operating foreign exchange difference 26 (3,093) 3,268 Share of profit / (losses) of associates 8 244 (107)
Profit / (loss) before tax 62,415 (18,202)
Income tax expense 9 (21,397) (6,139) Profit / (loss) for the year 41,018 (24,341)
Profit / (loss) attributable to:
Equity holders of the parent 43,121 (21,535) Non-controlling interests (2,103) (2,806)
41,018 (24,341) Other comprehensive income / (loss), net of tax:
Exchange differences on translation of foreign operations (4,260) (1,627) Income tax relating to components of other comprehensive income 9 - 76,320
(4,260) 74,693 Total comprehensive income for the year, net of tax 36,758 50,352 Total comprehensive income / (loss) attributable to:
Equity holders of the parent 38,930 48,557 Non-controlling interests (2,172) 1,795
36,758 50,352
The Notes presented on pages 13 –55 form an integral part of the consolidated financial statements

INTERPIPE LIMITED
CONSOLIDATED STATEMENT OF CHANGES IN EQUITY FOR THE YEAR ENDED 31 DECEMBER 2011
(in US dollars and in thousands)
11
The Notes presented on pages 13 –55 form an integral part of the consolidated financial statements.
Attributable to equity holders of the parent
Issued capital
Share premium
Revaluation reserve
Accumulated (deficits)
Foreign currency translation
reserve Total
Non-controlling
interests Total equity At 1 January 2010 62,278 361,091 255,822 (129,817) (284,152) 265,222 32,428 297,650 Loss for the year - - - (21,535) - (21,535) (2,806) (24,341) Other comprehensive income / (loss) - - 71,830 - (1,738) 70,092 4,601 74,693 Total comprehensive income / (loss) - - 71,830 (21,535) (1,738) 48,557 1,795 50,352 Depreciation transfer - - (36,008) 36,008 - - - - Acquisition of non-controlling interest - - - (17) - (17) (108) (125) At 31 December 2010 62,278 361,091 291,644 (115,361) (285,890) 313,762 34,115 347,877 Profit / (loss) for the year - - - 43,121 - 43,121 (2,103) 41,018 Other comprehensive loss - - - - (4,191) (4,191) (69) (4,260) Total comprehensive income / (loss) - - - 43,121 (4,191) 38,930 (2,172) 36,758 Depreciation transfer - - (41,914) 41,914 - - - - Issue of share capital (Note 29) 26 64,974 - - - 65,000 - 65,000 At 31 December 2011 62,304 426,065 249,730 (30,326) (290,081) 417,692 31,943 449,635

INTERPIPE LIMITED CONSOLIDATED STATEMENT OF CASH FLOWS FOR THE YEAR ENDED 31 DECEMBER 2011
(in US dollars and in thousands)
12
Notes
2011 2010 Profit / (Loss) before tax 62,415 (18,202) Adjustments for: Depreciation and amortisation 22,23,24 91,460 100,201 Impairment of property, plant and equipment and intangible assets 6,7 19,150 3,015 (Gain) / Loss on disposal of property, plant and equipment and intangible assets 25 (959) 615
Finance costs 28 95,516 76,261 Finance income 27 (2,754) (1,400) Movement in provisions less interest cost (20,694) 7,963 Loss on disposal of non-current assets held for disposal 91 - Share of (profit) / losses of associates 8 (244) 107 Translation difference and foreign exchange difference 3,429 (12,657) Operating cash flows before working capital changes 247,410 155,903 Decrease / (Increase) in inventories (117,690) (27,894) Decrease / (Increase) in trade and other accounts receivable (119,374) (27,450) Decrease / (Increase) in prepayments and other assets (63,707) 5,742 Decrease / (Increase) in taxes recoverable, other than income tax (23,150) 4,181 Increase / (Decrease) in trade and other accounts payable 88,894 64,257 Increase / (Decrease) in taxes payable, other than income tax (1,766) (803) Increase / (Decrease) in advances and other current liabilities 102,261 13,666 Cash generated from operations 112,878 187,602 Income tax paid (7,400) (4,613) Interest and other finance costs paid (135,503) (67,906) Net cash (outflow) / inflow from operating activities (30,025) 115,083
Cash flow from investing activities Purchases of property, plant and equipment and intangible assets (151,012) (91,840) Proceeds from sale of property, plant and equipment 2,111 518 Acquisition of subsidiaries, net of cash of acquired 30 (327) - Interest received 2,643 1,108 Net cash outflow from investing activities (146,585) (90,214)
Cash flows from financing activities Proceeds from borrowings 180,555 - Repayments of borrowings (6,049) (2,815) Release from restricted cash accounts 20,695 - Proceeds from share issue 29 65,000 - Dividends paid to non-controlling interest holders (1,839) (65) Net cash inflow / (outflow) from financing activities 258,362 (2,880)
Net change in cash and cash equivalents 81,752 21,989 Net foreign exchange difference (694) (181) Cash and cash equivalents at period beginning 55,939 34,131
Cash and cash equivalents at period end 16 136,997 55,939
The Notes presented on pages 13-55 form an integral part of the consolidated financial statements.

INTERPIPE LIMITED NOTES TO THE CONSOLIDATED FINANCIAL STATEMENTS FOR THE YEAR ENDED 31 DECEMBER 2011 (in US dollars and in thousands)
13
1. Corporate information
These consolidated financial statements include the financial statements of Interpipe Limited (referred to as the “Company”) and its subsidiaries (together referred to as the “Group”).
The Company was incorporated as a limited liability company under the name of Ramelton Holdings Limited in accordance with the Companies Law of Cyprus on 30 December 2005. It was renamed to Interpipe Limited on 15 May 2007. The registered office and principal place of business of the Company is Mykinon 12, Lavinia Court, 6th floor, P.C. 1065 Nicosia, Cyprus.
The Company holds ownership interests in a number of subsidiaries registered in various jurisdictions as detailed in Note 31 with a concentration of the Group’s business in Ukraine, where its production facilities are located. The principal business activities of the Group are described in more detail in Note 5.
The consolidated financial statements of the Group as at 31 December 2011 and for the year then ended were authorised for issue in accordance with a resolution of the Board of Directors on 21 May 2012.
2. Basis of preparation
Statement of Compliance
The Group’s consolidated financial statements have been prepared in accordance with International Financial Reporting Standards (“IFRS”) as adopted by the European Union (EU) as well as in accordance with the requirements of the Cyprus Company Law, Cap.113. The entities composing the Group maintain their accounting records in accordance with the accounting and reporting regulations of the countries of their incorporation. Local statutory accounting principles and procedures may differ from those generally accepted under IFRS. Accordingly, the consolidated financial statements, which have been prepared from the Group entities’ local statutory accounting records, reflect adjustments necessary for such financial statements to be presented in accordance with IFRS.
The consolidated financial statements have been prepared on a historical cost basis except for property, plant and equipment and construction in progress, which have been measured at fair value as at 1 July 2008, investment in associates accounted for using the equity method, post-employment benefits measured in accordance with the requirements of IAS 19 “Employee benefits” and certain financial instruments measured in accordance with the requirements of IAS 39 “Financial instruments: recognition and measurement”. The carrying values of recognised assets and liabilities that are hedged items in fair value hedges, and are otherwise carried at cost, are adjusted to record changes in fair values attributable to the risks that are being hedged.
The preparation of the consolidated financial statements requires management to make estimates and assumptions that affect the reported amounts of assets and liabilities, the disclosure of contingent assets and liabilities and reported amounts of revenues and expenses during the reporting period.
Due to the inherent uncertainty in making those estimates, actual results reported in future periods could differ from such estimates. The areas involving a higher degree of judgement or complexity, or areas where assumptions and estimates are significant to the consolidated financial statements are disclosed in Note 4.
These IFRS consolidated financial statements are presented in US Dollars (“USD”) and all values are rounded to the nearest thousand except when otherwise indicated; all expenses are shown in brackets.
Going concern
These consolidated financial statements have been prepared on a going concern basis that contemplates the realisation of assets and satisfaction of liabilities and commitments in the normal course of business. New and amended standards and interpretations
The accounting policies adopted are consistent with those of the previous financial year, except for the following new and amended IFRS and IFRIC interpretations adopted for the annual period beginning on 1 January 2011:
IAS 24 Related Party Disclosures (revised);
IAS 32 Financial Instruments: Presentation (amendment) effective 1 February 2010;
IFRIC 14 Prepayments of a Minimum Funding Requirement (amendment);
IFRIC 19 Extinguishing Financial Liabilities with Equity Instruments;
Improvements to IFRSs (May 2010).

INTERPIPE LIMITED NOTES TO THE CONSOLIDATED FINANCIAL STATEMENTS FOR THE YEAR ENDED 31 DECEMBER 2011 (in US dollars and in thousands)
14
The principal effect of these changes is described below:
IAS 24 Related Party Transactions (Revised)
The International Accounting Standards Board (“IASB”) issued an amendment to IAS 24 that clarifies the definitions of a related party. The new definitions emphasise a symmetrical view of related party relationships and clarifies the circumstances in which persons and key management personnel affect related party relationships of an entity. In addition, the amendment introduces an exemption from the general related party disclosure requirements for transactions with government and entities that are controlled, jointly controlled or significantly influenced by the same government as the reporting entity. The adoption of the amendment did not have any impact on the financial position or performance of the Group.
IAS 32 Financial Instruments: Presentation (Amendment)
The IASB issued an amendment that alters the definition of a financial liability in IAS 32 to enable entities to classify rights issues and certain options or warrants as equity instruments. The amendment is applicable if the rights are given pro rata to all of the existing owners of the same class of an entity’s non-derivative equity instruments, to acquire a fixed number of the entity’s own equity instruments for a fixed amount in any currency. The amendment has had no effect on the financial position or performance of the Group.
IFRIC 14 Prepayments of a Minimum Funding Requirement (Amendment)
The amendment removes an unintended consequence when an entity is subject to minimum funding requirements and makes an early payment of contributions to cover such requirements. The amendment permits a prepayment of future service cost by the entity to be recognised as a pension asset. The amendment has no effect on the financial position or performance of the Group.
IFRIC 19 Extinguishing Financial Liabilities with Equity Instruments
The new interpretation addresses the accounting by an entity when the terms of a financial liability are renegotiated and result in the entity issuing equity instruments to a creditor of the entity to extinguish all or part of the financial liability. The interpretation had no effect on the financial position or performance of the Group. Improvements to IFRSs
In May 2010, the International Accounting Standards Board issued “Improvements to IFRSs”, primarily with a view to removing inconsistencies and clarifying wording. These are separate transitional provisions for each standard. The document sets out amendments to International Financial Reporting Standards, which are mainly related to changes for presentation, recognition or management purposes terminology or editorial changes. These amendments did not have any impact on the financial position or performance of the Group.
Basis of consolidation
The IFRS consolidated financial statements comprise the financial statements of the Company and its subsidiaries at 31 December 2011 and for the year then ended.
Subsidiaries are fully consolidated from the date of acquisition, being the date on which the Group obtains control, and continue to be consolidated until the date that such control ceases. The financial statements of the subsidiaries are prepared as at the same reporting date as the Company, using consistent accounting policies. Adjustments are made to bring into line any dissimilar accounting policies that may exist. All intra-group balances, transactions, income and expenses and unrealised profits and losses resulting from intra-group transactions that are recognised in assets, are eliminated in full.
Non-controlling interests represent the interest in subsidiaries not held by the Group. Non-controlling interests at the reporting date represent the non-controlling shareholders’ portion of the fair value of the identifiable assets and liabilities of the subsidiary at the acquisition date and the non-controlling shareholders’ portion of changes in net assets since the date of the combination. Non-controlling interests are presented within the shareholders’ equity, except for those interests, which meet definition of the financial liabilities as referred to below in Note 3 under Financial liabilities.
3. Summary of significant accounting policies
Foreign currency translation
The IFRS consolidated financial statements are presented in the US Dollars (“USD”), which is the Company’s functional and presentation currency. Items in the financial statements of each entity included in the consolidated financial statements are measured using the functional currency determined for that entity. Transactions in foreign currencies are initially recorded in the functional currency at the rate ruling at the date of transaction. Monetary assets and liabilities denominated in foreign currencies are retranslated at the functional currency rate of exchange ruling at the reporting date. All differences upon re-measurement are

INTERPIPE LIMITED NOTES TO THE CONSOLIDATED FINANCIAL STATEMENTS FOR THE YEAR ENDED 31 DECEMBER 2011 (in US dollars and in thousands)
15
recognised in statement of comprehensive income. Non-monetary items that are measured at historical cost in a foreign currency are translated using the exchange rates as at the dates of the initial transactions.
Ukrainian hryvnia is the functional currency of the subsidiaries domiciled in Ukraine. The functional currencies of the subsidiaries domiciled outside of Ukraine are as follows: the United States dollar for those registered in Switzerland, United Arab Emirates, Republic of Cyprus and the United States of America, Russian rouble for a subsidiary in Russia, and Kazakhstani tenge for a subsidiary in Kazakhstan.
As at the reporting date, the assets and liabilities of these companies are translated into the presentation currency of the Group at the rate of exchange at the reporting date. For the reporting year, the amounts presented in their statements of comprehensive income and cash flows are translated at the quarterly weighted average exchange rates. All equity transactions and significant transactions relating to the statement of comprehensive income such as revaluation and impairment of property, plant and equipment and write down of inventories to net realisable value were translated using the exchange rate ruling at the date of transaction. The exchange differences arising on the translation are taken directly to a separate component of equity.
On disposal of a foreign entity, the deferred cumulative amount recognised in equity relating to that particular foreign operation is recognised in the statement of comprehensive income.
Business combinations and goodwill
Business combinations are accounted for using the acquisition method. The cost of an acquisition is measured as the fair value of the assets given, equity instruments issued and liabilities incurred or assumed at the date of exchange, plus costs directly attributable to the acquisition. Identifiable assets acquired and liabilities and contingent liabilities assumed in a business combination are measured initially at fair values at the date of acquisition, irrespective of the extent of any non-controlling interest.
Goodwill is initially measured at cost being the excess of the cost of the business combination over the Group’s share in the net fair value of the acquiree’s identifiable assets, liabilities and contingent liabilities. If the cost of acquisition is less than the fair value of the net assets of the subsidiary acquired, the difference is recognised directly in the statement of comprehensive income.
After initial recognition, goodwill is measured at cost less any accumulated impairment losses. For the purpose of impairment testing, goodwill acquired in a business combination is, from the acquisition date, allocated to each of the Group’s cash generating units that are expected to benefit from the synergies of the combination, irrespective of whether other assets or liabilities of the acquiree are assigned to those units.
Where goodwill forms part of a cash-generating unit and a part of the operation within that unit is disposed of, the goodwill associated with the operation disposed of is included in the carrying amount of the operation when determining the gain or loss on disposal of the operation. Goodwill disposed of in this circumstance is measured based on the relative values of the operation disposed of and the portion of the cash-generating unit retained.
Property, plant and equipment
During the year ended 31 December 2008, management of the Company adopted the revaluation model of accounting for property, plant and equipment. This change in accounting policy, in management’s view, allows for a more fair presentation of property, plant and equipment in accordance with the industry specifics. The revaluation was performed by an independent appraisal as at 1 July 2008. Subsequently, property, plant and equipment are carried at revalued amounts, being their fair value at the date of the revaluation less any subsequent accumulated depreciation and subsequent accumulated impairment losses. When no market values are available, fair value of specific machinery and equipment is determined by using depreciated replacement cost approach. Fair values of other items of property, plant and equipment are determined by reference to market-based evidence, which are the amounts for which the assets could be exchanged between a knowledgeable willing buyer and a knowledgeable willing seller in an arm’s length transaction as at the valuation date. Prior to the revaluation property, plant and equipment were stated at cost or deemed cost at the date of transition to IFRS (hereinafter referred as “cost”), excluding the costs of day-to-day servicing, less accumulated depreciation and accumulated impairment in value. Such cost included the cost of replacing part of such plant and equipment, when that cost was incurred and if the recognition criteria were met.
Revaluations of property, plant and equipment are to be performed with sufficient regularity such that the carrying amount does not differ materially from that which would be determined using fair values at the reporting date.
Any accumulated depreciation at the date of revaluation is eliminated against the gross carrying amount of the asset, and the net amount is restated to the revalued amount of the asset.
Increases in carrying amount arising on revaluation of property, plant and equipment are credited to revaluation reserve in equity. However, such increase is to be recognised in profit and loss to the extent that it reverses a revaluation decrease of the same asset previously recognised in the consolidated statement of comprehensive income. If the asset’s carrying amount is decreased as a result of the revaluation, the decrease is recognised the consolidated statement of comprehensive income. However, such decrease is taken directly to equity to the extent of any credit balance existing in the revaluation surplus in respect of that asset.

INTERPIPE LIMITED NOTES TO THE CONSOLIDATED FINANCIAL STATEMENTS FOR THE YEAR ENDED 31 DECEMBER 2011 (in US dollars and in thousands)
16
As the asset is used by an entity, the difference between depreciation based on the revalued carrying amount of the asset and depreciation based on the asset's original cost is transferred to retained earnings. On the subsequent sale or retirement of a revalued property, the respective revaluation surplus carried in equity is transferred directly to retained earnings.
Depreciable amount is the cost or revalued amount of the item of property, plant and equipment less estimated residual value at the end of the useful life. Depreciation is calculated on a straight-line basis over the estimated remaining useful life of the assets, determined at the date of revaluation, or estimated useful life of the assets, determined at the date the asset is available for use.
The asset’s residual values, useful lives and methods are reviewed, and adjusted, if appropriate, at each financial year end. Depreciation is calculated over the estimated remaining useful life of the assets as follows:
After revaluation Before revaluation Buildings and structures 3-50 years 5-78 years Machinery and equipment 1-25 years 2-25 years Transport and motor vehicles 1-10 years 5-20 years Fixtures and office equipment 1-7 years 5-25 years
Construction in progress comprises prepayments made and letters of credit issued for purchases of property, plant and equipment, as well as property, plant and equipment which have not yet been completed. No depreciation is recorded on such assets until they are available for use.
An item of property, plant and equipment is derecognised upon disposal or when no future economic benefits are expected to arise from the continued use of the asset. Any gain or loss arising on derecognition of the asset (calculated as the difference between the net disposal proceeds and the carrying amount of the item) is included in the consolidated statement of comprehensive income in the year when the item is derecognised.
The Group has the title to certain non-production and social assets, primarily buildings and social infrastructure facilities held by production subsidiaries in Ukraine. The items of social infrastructure facilities do not meet the definition of an asset according to IFRS; therefore, these items are not included in these IFRS consolidated financial statements. Construction and maintenance costs of social infrastructure facilities are expensed as incurred.
Borrowing costs
Borrowing costs directly attributable to the acquisition, construction or production of an asset that necessarily takes a substantial period of time to get ready for its intended use are capitalised as part of the cost of the respective assets. All other borrowing costs are expensed in the period they are incurred. Borrowing costs consist of interest and other costs that an entity incurs in connection with the borrowing of funds.
Intangible assets
Intangible assets include patents and trademark, accounting and other software acquired separately from business combination and measured on initial recognition at cost. Following initial recognition, intangible assets are carried at cost less any accumulated amortisation and any accumulated impairment losses. Intangible assets with finite lives are amortised over the useful economic life and assessed for impairment whenever there is an indication that the intangible asset may be impaired. The amortisation period and the amortisation method for an intangible asset with a finite useful life are reviewed at least at each financial year-end. Changes in the expected useful life or the expected pattern of consumption of future economic benefits embodied in the asset is accounted for by changing the amortisation period or method, as appropriate, and treated as changes in accounting estimates. Intangible assets are amortised using straight line method over estimated useful lives from three to ten years.
Investments in associates
The Group’s investments in associates are accounted for under the equity method of accounting. An associate is an entity in which the Group has significant influence and which is neither a subsidiary nor a joint venture.
Under the equity method, the investment in the associate is carried in the statement of financial position at cost plus post acquisition changes in the Group’s share of net assets of the associate. Goodwill relating to the associate is included in the carrying amount of the investment. The consolidated statement of comprehensive income reflects the share of the results of operations of the associate. Where there has been a change recognised directly in the equity of the associate, the Group recognises its share of any changes and discloses this, when applicable, in the statement of changes in equity. Unrealised gains and losses resulting from transactions between the Group and the associate are eliminated to the extent of the interest in the associate.
The reporting dates of the associate and the Group are identical and the associates’ accounting policies conform to those used by the Group for the like transactions and events in similar circumstances.

INTERPIPE LIMITED NOTES TO THE CONSOLIDATED FINANCIAL STATEMENTS FOR THE YEAR ENDED 31 DECEMBER 2011 (in US dollars and in thousands)
17
Impairment of non-financial assets
At each reporting date, the Group assesses whether there is any indication that an asset may be impaired. If any such indication exists, or when annual impairment testing for an asset is required, the Group makes an estimate of the asset’s recoverable amount. An asset’s recoverable amount is the higher of an asset’s or cash generating unit’s fair value less costs to sell and its value in use and is determined for an individual asset, unless the asset does not generate cash inflows that are largely independent of those from other assets or groups of assets. Where the carrying amount of an asset exceeds its recoverable amount, the asset is considered impaired and is written down to its recoverable amount. In assessing value in use, the estimated future cash flows are discounted to their present value using a pre-tax discount rate that reflects current market assessments of the time value of money and the risks specific to the asset for which the future cash flow estimates have not been adjusted.
Impairment losses on non-revalued assets are recognised in statement of comprehensive income. However, an impairment loss on a revalued asset is recognised directly against any revaluation surplus attributable to the asset to the extent that the impairment loss does not exceed the amount of the revaluation surplus for that same asset.
An assessment is made at each reporting date as to whether there is any indication that previously recognised impairment losses may no longer exist or may have decreased. If such indication exists, the recoverable amount is estimated. A previously recognised impairment loss is reversed only if there has been a change in the estimates used to determine the asset’s recoverable amount since the last impairment loss was recognised. If that is the case, the carrying amount of the asset is increased to its recoverable amount. That increased amount cannot exceed the carrying amount that would have been determined, net of depreciation, had no impairment loss been recognised for the asset in the prior years in the consolidated statement of comprehensive income. After such the reversal, the depreciation charge in future periods is adjusted to allocate the asset’s revised carrying amount, less any residual value, on a systematic basis over its remaining useful life.
Financial assets
Initial recognition
Financial assets in the scope of IAS 39 are classified as either financial assets at fair value through profit or loss, loans and receivables, held-to-maturity investments, or available-for-sale financial assets, as appropriate. When financial assets are recognised initially, they are measured at their fair value, plus, in the case of investments not at fair value through profit or loss, directly attributable transaction costs. The Group determines the classification of its financial assets at their initial recognition and, where allowed and appropriate, re-evaluates this designation at each financial year end.
All regular way purchases and sales of financial assets are recognised on the trade date, which is the date on which the Group commits to purchase or sell the asset. Regular way purchases or sales are purchases or sales of financial assets that require delivery of assets within the period generally established by regulation or convention in the marketplace.
Subsequent measurement
The subsequent measurement of financial assets depends on their classification as follows:
Financial assets at fair value through profit or loss
Financial assets at fair value through profit or loss include financial assets held for trading and financial assets designated upon their initial recognition at fair value through profit or loss. Financial assets are classified as held for trading, if they are acquired for the purpose of selling in the near term. Derivatives, including separated embedded derivatives are also classified as held for trading unless they are designated as effective hedging instruments. Financial assets at fair value through profit and loss are carried in the statement of financial position at fair value with gains or losses recognised as finance income or finance costs, respectively, in the consolidated statement of comprehensive income. The Group has not designated any financial asset at fair value through profit or loss.
Loans and receivables
Loans and receivables are non-derivative financial assets with fixed or determinable payments that are not quoted in an active market. Such assets are carried at amortised cost using the effective interest method. Gains and losses are recognised as finance income or finance costs, respectively, in the consolidated statement of comprehensive income when the loans and receivables are derecognised or impaired, as well as through the amortisation process.
Held-to-maturity and available for sale financial investments
The Group did not have any financial asset held to maturity or available for sale during the years ended 31 December 2011 and 2010.

INTERPIPE LIMITED NOTES TO THE CONSOLIDATED FINANCIAL STATEMENTS FOR THE YEAR ENDED 31 DECEMBER 2011 (in US dollars and in thousands)
18
Inventories
Inventories are recorded at the lower of cost and net realisable value. Cost of inventory is determined on the first-in, first-out (“FIFO”) basis, except for cost of work-in-process (comprising unfinished products and metal billets) which is determined on weighted average basis. The cost of finished goods and work in progress comprises raw material, direct labour, other direct costs and related production overheads (based on normal operating capacity) but excluding borrowing costs. Net realisable value is the estimated selling price in the ordinary course of business, less estimated costs of completion and the estimated costs necessary to make the sale.
Cash and cash equivalents
Cash and cash equivalents in the consolidated statement of financial position comprise cash in hand, cash at bank and highly liquid demand deposits (with original maturity date of less than 90 days) free from contractual encumbrances which are readily convertible to known amounts of cash and which are subject to insignificant risk of changes in value.
For the purpose of the consolidated statement of cash flows, cash and cash equivalents consist of the cash and cash equivalents as defined above less outstanding bank overdrafts, if any.
Financial liabilities
Initial recognition
Financial liabilities within the scope of IAS 39 are classified as financial liabilities at fair value through profit or loss, loans and borrowings, or as derivatives designated as hedging instruments in an effective hedge, as appropriate. The Group determines the classification of its financial liabilities at initial recognition. Financial liabilities are recognised initially at fair value plus, in the case of loans and borrowings, directly attributable transaction costs. The Group’s financial liabilities include trade and other payables, bank overdrafts, loans and borrowings, financial guarantee contracts, and derivative financial instruments.
Subsequent measurement
The measurement of financial liabilities depends on their classification as follows:
Financial liabilities at fair value through profit or loss
Financial liabilities at fair value through profit or loss include financial liabilities held for trading and financial liabilities designated upon initial recognition at fair value through profit or loss. Financial liabilities are classified as held for trading, if they are acquired for the purpose of selling in the near term. This category includes derivative financial instruments entered into by the Group that do not meet the hedge accounting criteria as defined by IAS 39. Gains or losses on liabilities held for trading are recognised as finance income or finance costs, respectively, in the consolidated statement of comprehensive income.
Trade and other payables
Trade and other payables are initially recognised at cost being the fair value of the consideration received, net of transaction costs incurred. Subsequently, instruments with fixed maturity are re-measured at amortised cost using the effective interest method. Amortised cost is calculated by taking into account any transaction costs, and any discount or premium on settlement.
Borrowings
Borrowings are initially recognised at the fair value of the consideration received less directly attributable transaction costs, and any discount or premium on settlement. After initial recognition, such instruments are subsequently measured at amortised cost using the effective interest method. Gains and losses are recognised as finance income or finance costs, respectively, in the consolidated statement of comprehensive income when the liabilities are derecognised as well as through the amortisation process.
Liability attributable to non-controlling participants
Some non-controlling interests in the Group subsidiaries established in the form of a limited liability company do not satisfy the conditions of an equity instrument. Such non-controlling interests are treated as financial liability attributable to non-controlling participants and are reclassified from equity. At initial recognition and subsequently at each reporting date, liability attributable to non-controlling participants is measured at the present value of the amount payable at exercise, with any change in value reflected in the consolidated statement of comprehensive income as finance income or expense.
Guarantees issued
The guarantee contract is measured at the higher of the amount determined in accordance with the principles discussed in Provisions below and the amount initially recognised less cumulative amortisation at the reporting date.

INTERPIPE LIMITED NOTES TO THE CONSOLIDATED FINANCIAL STATEMENTS FOR THE YEAR ENDED 31 DECEMBER 2011 (in US dollars and in thousands)
19
Fair value of financial instruments
The fair value of financial instruments that are actively traded in organised financial markets is determined by reference to quoted market bid prices at the close of business day on the reporting date. For financial instruments where there is no active market, fair value is determined using valuation techniques. Such techniques may include using recent arm’s length market transactions; reference to the current fair value of another instrument that is substantially the same; discounted cash flow analysis or other valuation models.
Amortised cost of financial instruments
Amortised cost is computed using the effective interest method less any allowance for impairment and principal repayment or reduction. The calculation takes into account any premium or discount on acquisition and includes transaction costs and fees that are an integral part of the effective interest rate.
Derecognition of financial assets and liabilities
Financial assets
A financial asset (or, where applicable a part of a financial asset or part of a group of similar financial assets) is derecognised where:
• the rights to receive cash flows from the asset have expired;
• the Group retains the right to receive cash flows from the asset, but has assumed an obligation to pay them in full without material delay to a third party under a “pass-through” arrangement; or
• the Group has transferred its rights to receive cash flows from the asset and either (a) has transferred substantially all the risks and rewards of the asset, or (b) has neither transferred nor retained substantially all the risks and rewards of the asset, but has transferred control of the asset.
Where the Group has transferred its rights to receive cash flows from an asset and has neither transferred nor retained substantially all the risks and rewards of the asset nor transferred control of the asset, the asset is recognised to the extent of the Group’s continuing involvement in the asset.
Financial liabilities
A financial liability is derecognised when the obligation under the liability is discharged or cancelled or expires.
Where an existing financial liability is replaced by another from the same lender on substantially different terms, or the terms of an existing liability are substantially modified, such an exchange or modification is treated as a derecognition of the original liability and the recognition of a new liability, and the difference in the respective carrying amounts is recognised as finance income or finance costs in the consolidated statement of comprehensive income.
Impairment of financial assets
The Group assesses at each reporting date whether a financial asset or group of financial assets is impaired.
Assets carried at amortised cost
If there is objective evidence that an impairment loss on loans and receivables carried at amortised cost has been incurred, the amount of the loss is measured as the difference between the asset’s carrying amount and the present value of estimated future cash flows discounted at the financial asset’s original effective interest rate. The carrying amount of the asset is reduced either directly or through use of an allowance account. The amount of the loss is recognised as expenses in the consolidated statement of comprehensive income.
The Group first assesses whether objective evidence of impairment exists individually for financial assets that are individually significant, and individually or collectively for financial assets that are not individually significant. If it is determined that no objective evidence of impairment exists for an individually assessed financial asset, whether significant or not, the asset is included in a group of financial assets with similar credit risk characteristics and that group of financial assets is collectively assessed for impairment. Assets that are individually assessed for impairment and for which an impairment loss is or continues to be recognised are not included in a collective assessment of impairment.
If, in a subsequent period, the amount of the impairment loss decreases and the decrease can be related objectively to an event occurring after the impairment was recognised, the previously recognised impairment loss is reversed. Any subsequent reversal of an impairment loss is recognised against the respective expenses in the consolidated statement of comprehensive income, to the extent that the carrying value of the asset does not exceed its amortised cost at the reversal date.
INTERPIPE LIMITED NOTES TO THE CONSOLIDATED FINANCIAL STATEMENTS FOR THE YEAR ENDED 31 DECEMBER 2011 (in US dollars and in thousands)
20
For trade and other receivables, an allowance for impairment is made when there is an objective evidence (such as probability of insolvency or significant financial difficulties of the debtor) that the Group will not be able to collect all of the amounts due under the original terms of the invoice. When trade and other receivables are uncollectible, they are written off against the allowance account. Changes in the carrying amount of the allowance account and subsequent recoveries of amounts previously written off are recognised as expenses in the consolidated statement of comprehensive income.
Derivative financial instruments and hedge accounting
Initial recognition and subsequent measurement
The Group uses derivative financial instruments such as forward currency contracts to hedge its foreign currency risks. Such derivative financial instruments are initially recognised at fair value on the date on which a derivative contract is entered into and are subsequently re-measured at fair value. Derivatives are carried as financial assets when the fair value is positive and as financial liabilities when the fair value is negative.
Any gains or losses arising from changes in fair value on derivatives during the year that do not qualify for hedge accounting and the ineffective portion of an effective hedge, are taken to finance income or finance costs, respectively, in the consolidated statement of comprehensive income.
The fair value of forward currency contracts is the difference between the forward exchange rate and the contract rate. The forward exchange rate is referenced to current forward exchange rates for contracts with similar maturity profiles.
At the inception of a hedge relationship, the Group formally designates and documents the hedge relationship to which the Group wishes to apply hedge accounting and the risk management objective and strategy for undertaking the hedge. The documentation includes identification of the hedging instrument, the hedged item or transaction, the nature of the risk being hedged and how the entity will assess the hedging instrument’s effectiveness in offsetting the exposure to changes in the hedged item’s fair value or cash flows attributable to the hedged risk. Such hedges are expected to be highly effective in achieving offsetting changes in fair value or cash flows and are assessed on an ongoing basis to determine that they actually have been highly effective throughout the financial reporting periods for which they were designated.
For the purpose of hedge accounting, hedges are classified as:
• fair value hedges when hedging the exposure to changes in the fair value of a recognised asset or liability or an unrecognised firm commitment; or
• cash flow hedges when hedging exposure to variability in cash flows that is either attributable to a particular risk associated with a recognised asset or liability or a highly probable forecast transaction or the foreign currency risk in an unrecognised firm commitment; or
• hedges of a net investment in a foreign operation.
The Group uses forward currency contracts as hedges of its exposure to foreign currency risk in firm capital commitments. These hedges are accounted for as fair value hedges.
Fair value hedges of unrecognised firm commitment
When an unrecognised firm commitment is designated as a hedged item, the subsequent cumulative change in the fair value of the firm commitment attributable to the hedged risk is recognised as an asset or liability with a corresponding gain or loss recognised as finance income or finance costs, respectively, in the consolidated statement of comprehensive income.
The Group discontinues fair value hedge accounting if the hedging instrument expires, is sold, terminated or exercised, or no longer meets the criteria for hedge accounting, or the Group revokes the designation. The Group discontinues fair value hedge accounting from the last date on which compliance with the hedge effectiveness was demonstrated.
When hedge relationship no longer meets the criteria for hedge accounting the hedged item ceases to be adjusted for changes in its fair value attributable to the risk being hedged and continues to be accounted for in a manner that was applicable prior to it being hedged. The basis adjustment on the hedged item is frozen and continues as part of the carrying amount of the asset up to the date the carrying value is recovered through use or sale of the asset becomes impaired. The hedged instrument continues to be accounted as derivative at fair value through profit and loss.
Provisions
Provisions are recognised when the Group has a present obligation (legal or constructive) as a result of a past event, it is probable that an outflow of resources embodying economic benefits will be required to settle the obligation and a reliable estimate can be made of the amount of the obligation. Where the Group expects a provision to be reimbursed, for example, under an insurance contract, the reimbursement is recognised as a separate asset but only when the reimbursement is virtually certain. If the effect of

INTERPIPE LIMITED NOTES TO THE CONSOLIDATED FINANCIAL STATEMENTS FOR THE YEAR ENDED 31 DECEMBER 2011 (in US dollars and in thousands)
21
the time value of money is material, provisions are determined by discounting the expected future cash flows at a pre-tax rate that reflects current market assessments of the time value of money and, where appropriate, the risks specific to the liability.
Pension obligations
In the normal course of business the Group contributes to the Ukrainian, Russian and Kazakhstani state pension schemes at the statutory rates in force during the year, based on gross salary payments; such expense is charged in the period the related salaries are earned. The Group has also agreed to provide certain defined contribution pension benefits in Switzerland and the USA. The Group has no legal or constructive obligations to pay further contributions in respect of those benefits. Its only obligation is to pay contributions as they fall due. These contributions are expensed as incurred.
In addition, the Group’s Ukrainian production subsidiaries provide other post-employment benefits to their employees. There are two significant defined benefit post-employment plans in Ukraine, both of which are unfunded. These plans comprise:
• the Group’s legal contractual obligation to its employees to make one-off payment on retirement to employees with long service and other benefits according to the collective agreements, and
• the Group’s legal obligation to compensate the Ukrainian state pension fund for additional pensions paid to certain categories of the eligible employees of the Group. The cost of providing benefits under defined benefit plans is determined separately for each plan using the projected unit credit method in respect of those employees entitled to such payments. Management uses actuarial techniques in calculating the liability related to these retirement obligations at each reporting date. Actual results could vary from estimates made to the date.
Past service cost resulting from introduction of pension benefits is recognised as expense on a straight-line basis over the average period until the benefits become vested.
Gains and losses resulting from the use of actuarial valuation methodologies are recognised when the cumulative unrecognised actuarial gains or losses for the scheme exceed 10% of defined benefit obligation. These gains or losses are recognised over the expected average remaining working lives of the employees participating in the plan.
Contingent liabilities
Contingent liabilities are recognised in the consolidated financial statements if their fair value can be measured reliably and if it is a present obligation that arises from past events. They are disclosed unless the possibility of an outflow of resources embodying economic benefits is remote.
Income tax
Current tax
Current tax assets and liabilities for the current and prior periods are measured at the amount expected to be recovered from or paid to the taxation authorities. Current tax expense is calculated by each entity on the pre-tax income determined in accordance with the tax law of a country in which the entity is incorporated, using tax rates enacted during the tax period when the respective transaction arises.
Deferred tax
Deferred income tax is recognised, using the balance sheet liability method, on all temporary differences at the reporting date between the tax bases of assets and liabilities and their carrying amounts in the consolidated financial statements.
Deferred income tax liabilities are recognised for all taxable temporary differences, except:
• where the deferred income tax liability arises from the initial recognition of goodwill or of an asset or liability in a transaction that is not a business combination and, at the time of the transaction, affects neither the accounting profit nor taxable profit or loss; and
• in respect of taxable temporary differences associated with investments in subsidiaries and associates, where the timing of the reversal of the temporary differences can be controlled and it is probable that the temporary differences will not reverse in the foreseeable future.
Deferred income tax assets are recognised for all deductible temporary differences, carry forward of unused tax credits and unused tax losses, to the extent that it is probable that taxable profit will be available against which the deductible temporary differences, and the carry forward of unused tax credits and unused tax losses can be utilised except:
• where the deferred income tax asset relating to the deductible temporary difference arises from the initial recognition of an asset or liability in a transaction that is not a business combination and, at the time of the transaction, affects neither the accounting profit nor taxable profit or loss; and

INTERPIPE LIMITED NOTES TO THE CONSOLIDATED FINANCIAL STATEMENTS FOR THE YEAR ENDED 31 DECEMBER 2011 (in US dollars and in thousands)
22
• in respect of deductible temporary differences associated with investments in subsidiaries and associates, deferred income tax assets are recognised only to the extent that it is probable that the temporary differences will reverse in the foreseeable future and taxable profit will be available against which the temporary differences can be utilised.
The carrying amount of deferred tax assets is reviewed at each reporting date and reduced to the extent that it is no longer probable that sufficient taxable profit will be available to allow all or part of the deferred tax asset to be utilised. Unrecognised deferred income tax assets are reassessed at each reporting date and are recognised to the extent that it has become probable that future taxable profit will allow the deferred tax asset to be recovered.
Deferred tax assets and liabilities are measured at the tax rates that are expected to apply to the period when the asset is realised or the liability is settled, based on tax rates and tax laws that have been enacted or substantively enacted by the reporting date.
Deferred tax assets and liabilities are offset, if a legally enforceable right exists to set off current tax assets against current tax liabilities and the deferred taxes relate to the same taxable entity and the same taxation authority.
Revenue recognition
Revenue is recognised to the extent that it is probable that the economic benefits will flow to the Group and revenue can be reliably measured. Revenue from sale of goods is recognised when the significant risks and rewards of ownership of the goods have passed to the buyer and the amount of revenue can be measured reliably. Advances from customers represent cash receipts from the buyer before significant risks and rewards of ownership of the goods have passed to the buyer. Revenue from rendering of services is recognised when services are rendered.
Cost of sales and other expenses recognition
Cost of revenue that relates to the same transaction is recognised simultaneously with the respective revenue. Expenses also include warranties and other costs which are to be incurred after the shipment of the goods is made and which can be measured reliably.
Reclassifications
Certain insignificant reclassifications have been made in the accompanying Notes to the consolidated financial statements in respect of information relating to the year ended 31 December 2010 to enhance the disclosures made therein in line with 2011 presentation.
IFRSs and IFRIC Interpretations not yet effective
Standards issued but not yet effective up to the date of the issuance of the Group’s consolidated financial statements are listed below. This listing of standards and interpretations issued are those that the Group reasonably expects to have an impact on disclosures, financial position or performance when applied at a future date. The Group intends to adopt these standards when they become effective.
IAS 1 Financial Statement Presentation – Presentation of Items of Other Comprehensive Income
The amendments to IAS 1 change the grouping of items presented in other comprehensive income. Items that could be reclassified (or ‘recycled’) to profit or loss at a future point in time (for example, upon derecognition or settlement) would be presented separately from items that will never be reclassified. The amendment affects presentation only and has no impact on the Group’s financial position or performance. The amendment becomes effective for annual periods beginning on or after 1 July 2012.
IAS 12 Income Taxes – Recovery of Underlying Assets
The amendment clarified the determination of deferred tax on investment property measured at fair value. The amendment introduces a rebuttable presumption that deferred tax on investment property measured using the fair value model in IAS 40 should be determined on the basis that its carrying amount will be recovered through sale. Furthermore, it introduces the requirement that deferred tax on non-depreciable assets that are measured using the revaluation model in IAS 16 always be measured on a sale basis of the asset. The amendment becomes effective for annual periods beginning on or after 1 January 2012.
IAS 19 Employee Benefits (Amendment)
The IASB has issued numerous amendments to IAS 19. These range from fundamental changes such as removing the corridor mechanism and the concept of expected returns on plan assets to simple clarifications and re-wording. The Group is currently assessing the full impact of the amendments introduced. The amendment becomes effective for annual periods beginning on or after 1 January 2013.
IAS 27 Separate Financial Statements (as revised in 2011)
As a consequence of the new IFRS 10 and IFRS 12, what remains of IAS 27 is limited to accounting for subsidiaries, jointly controlled entities, and associates in separate financial statements. The revision will have no impact on the consolidated financial statements of the Group. The amendment becomes effective for annual periods beginning on or after 1 January 2013.
IAS 28 Investments in Associates and Joint Ventures (as revised in 2011)

INTERPIPE LIMITED NOTES TO THE CONSOLIDATED FINANCIAL STATEMENTS FOR THE YEAR ENDED 31 DECEMBER 2011 (in US dollars and in thousands)
23
As a consequence of the new IFRS 11 and IFRS 12, IAS 28 has been renamed to IAS 28 Investments in Associates and Joint Ventures, and describes the application of the equity method to investments in joint ventures in addition to associates. The Group expects that the adoption of the amended standard will not have a significant impact on its financial position or performance in the period of initial application. The amendment becomes effective for annual periods beginning on or after 1 January 2013.
IFRS 7 Financial Instruments: Disclosures — Enhanced Derecognition Disclosure Requirements
The amendment requires additional disclosure about financial assets that have been transferred but not derecognised to enable the user of the Group’s consolidated financial statements to understand the relationship with those assets that have not been derecognised and their associated liabilities. In addition, the amendment requires disclosures about continuing involvement in derecognised assets to enable the user to evaluate the nature of, and risks associated with, the entity’s continuing involvement in those derecognised assets. In December 2011, the International Accounting Standards Board further amended IFRS 7 by clarifying requirements for offsetting financial assets and financial liabilities. The amendment affects disclosure only and has no impact on the Group’s financial position or performance. The amendment becomes effective for annual periods beginning on or after 1 July 2011.
IFRS 9 Financial Instruments: Classification and Measurement
IFRS 9 as issued reflects the first phase of the IASBs work on the replacement of IAS 39 and applies to classification and measurement of financial assets and financial liabilities as defined in IAS 39. In subsequent phases, the IASB will address hedge accounting and impairment of financial assets. The completion of this project is expected over the course of 2011 or the first half of 2012. The adoption of the first phase of IFRS 9 will have an effect on the classification and measurement of the Group’s financial assets and financial liabilities. The Group will quantify the effect in conjunction with the other phases, when issued, to present a comprehensive picture. The standard is effective for annual periods beginning on or after 1 January 2015. IFRS 10 Consolidated Financial Statements
IFRS 10 replaces the portion of IAS 27 Consolidated and Separate Financial Statements that addresses the accounting for consolidated financial statements. It also includes the issues raised in SIC-12 Consolidation — Special Purpose Entities. IFRS 10 establishes a single control model that applies to all entities including special purpose entities. The changes introduced by IFRS 10 will require management to exercise significant judgement to determine which entities are controlled, and therefore, are required to be consolidated by a parent, compared with the requirements that were in IAS 27. The Group expects that the adoption of the new standard will not have a significant impact on its financial position or performance in the period of initial application. This standard becomes effective for annual periods beginning on or after 1 January 2013.
IFRS 11 Joint Arrangements
IFRS 11 replaces IAS 31 Interests in Joint Ventures and SIC-13 Jointly-controlled Entities — Non-monetary Contributions by Ventures. IFRS 11 removes the option to account for jointly controlled entities (JCEs) using proportionate consolidation. Instead, JCEs that meet the definition of a joint venture must be accounted for using the equity method. The Group expects that the adoption of the new standard will not have a significant impact on its financial position or performance. This standard becomes effective for annual periods beginning on or after 1 January 2013.
IFRS 12 Disclosure of Involvement with Other Entities
IFRS 12 includes all of the disclosures that were previously in IAS 27 related to consolidated financial statements, as well as all of the disclosures that were previously included in IAS 31 and IAS 28. These disclosures relate to an entity’s interests in subsidiaries, joint arrangements, associates and structured entities. A number of new disclosures are also required. The amendment affects disclosures only and will have no impact on the Group’s financial position or performance. This standard becomes effective for annual periods beginning on or after 1 January 2013.
IFRS 13 Fair Value Measurement
IFRS 13 establishes a single source of guidance under IFRS for all fair value measurements. IFRS 13 does not change when an entity is required to use fair value, but rather provides guidance on how to measure fair value under IFRS when fair value is required or permitted. The Group is currently assessing the impact that this standard will have on the financial position and performance. This standard becomes effective for annual periods beginning on or after 1 January 2013.

INTERPIPE LIMITED NOTES TO THE CONSOLIDATED FINANCIAL STATEMENTS FOR THE YEAR ENDED 31 DECEMBER 2011 (in US dollars and in thousands)
24
4. Significant accounting judgements and estimates
Estimation of uncertainty
The key assumptions concerning the future and other key sources of estimation uncertainty at the reporting date, that have a significant risk of causing a material adjustment to the carrying amounts of assets and liabilities within the next financial year are discussed below:
Pension obligations under defined benefit plan
The Group collects information relating to its employees in service and pensioners receiving pension benefits and uses the actuarial valuation method for measurement of the present value of post-employment benefit obligations and related current service cost. These calculations require the use of demographic assumptions about the future characteristics of current and former employees who are eligible for benefits (mortality, both during and after employment, rates of employee turnover, disability and early retirement, etc.) as well as financial assumptions (discount rate and future projected salary). More details are provided in Note 18.
Valuation of property, plant and equipment
As at 1 July 2008, the valuation of property, plant and equipment was made by independent professionally qualified appraisers. Fair values of specialised machinery and equipment owned by these subsidiaries and representing the main part of property, plant and equipment were determined by using depreciated replacement cost approach as no market values were available for such items. The fair value of items other than specialised property, plant and equipment was determined by reference to market values of those items at the valuation date. Under depreciated replacement cost approach the fair value of specific items of property, plant and equipment was determined based on their replacement cost, which is the estimated amount required to reproduce a duplicate or a replica of the item of property, plant and equipment in accordance with current market prices for materials, labour, and manufactured equipment, contractor’s overhead and profit, and fee, but without provision for overtime, bonuses for labour, or premiums for material and equipment, less allowances for physical deterioration and functional (or technical) obsolescence and economic (or external) obsolescence.
The fair value of assets determined on the basis of depreciated replacement cost approach was subjected to an adequate profitability test using discounted cash flow techniques, for the purposes of which the assets were allocated to several cash generating units based on the product lines. The discount rate representing pre tax weighted average cost of capital was estimated at 15.4%.
Certain items, which primary relate to the electric arc furnace under construction (Note 6), were not subject to the valuation. As the cost of the electric arc furnace mostly includes newly purchased items of machinery and equipment, site preparation costs, and prepayments to suppliers, the cost is believed to approximate the fair value.
As at 31 December 2011 and 2010, the carrying amount of property, plant and equipment does not significantly differ from its fair value.
Useful life of property, plant and equipment and residual value
The Group assesses the remaining useful lives of items of property, plant and equipment at least at each financial year-end. If expectations differ from previous estimates, the changes are accounted for as a change in an accounting estimate in accordance with IAS 8 “Accounting Policies, Changes in Accounting Estimates and Errors”. These estimates may have a material impact on the amount of the carrying values of property, plant and equipment and on depreciation recognised in statement of comprehensive income (Note 6). In 2011, the residual value of the Group’s property, plant and equipment was re-estimated and the updated estimates were used for determining depreciable amount and related depreciation charge. The change in estimate resulted in the decrease of depreciation expenses for the year ended 31 December 2011 by USD 2,125 thousand. There were no changes in estimates of useful lives.
Impairment of property, plant and equipment
The Group assesses at each reporting date whether there is any indication that an asset may be impaired. If any such indication exists, the Group estimates the recoverable amount of the asset. This requires an estimation of the value in use of the cash generating units (“CGU”) to which the item is allocated. Estimating the value in use requires the Group to make an estimate of the expected future cash flows from the cash generating unit and also to choose a suitable discount rate in order to calculate the present value of those cash flows.
The Group also assesses at each reporting date whether there is any indication that an impairment loss recognised in prior periods for an asset other than goodwill may no longer exist or may have decreased. If any such indication exists, the Group estimates the recoverable amount of that asset.

INTERPIPE LIMITED NOTES TO THE CONSOLIDATED FINANCIAL STATEMENTS FOR THE YEAR ENDED 31 DECEMBER 2011 (in US dollars and in thousands)
25
Impairment of Goodwill
For the purpose of impairment testing, goodwill acquired in a business combination is allocated to two individual CGUs, which are also reportable segments irrespective of whether other assets or liabilities of the acquiree are assigned to those units.
An impairment of goodwill exists when the carrying value of the cash generating units exceeds its recoverable amounts, which are the higher of its fair value less costs to sell and its value in use. The fair value less costs to sell calculation is based on available data from binding sales transactions in an arm’s length transaction of similar assets or observable market prices less incremental costs for disposing of the asset. The value in use calculation is based on a discounted cash flow model. The cash flows are derived from the budget for the next two years and do not include restructuring activities or significant future investments that will enhance the asset’s performance of the cash generating unit being tested. The recoverable amount is most sensitive to the discount rate used for the discounted cash flow model as well as the expected gross margins, raw materials price inflation and the growth rate used for extrapolation purposes. The key assumptions used to determine the recoverable amount for the different CGUs, including comments on sensitivity, are further presented in Note 7.
Allowances and net realisable value
The Group makes allowances for doubtful accounts receivable (Note 12). Significant judgment is used to determine doubtful accounts. In determining doubtful accounts and estimating impairment allowance such factors are considered as current overall economic conditions, industry-specific economic conditions, historical and anticipated customer performance. Changes in the economy, industry, or specific customer conditions may require adjustments to the allowance for doubtful accounts recorded in the financial statements.
Inventory is carried at lower of cost and net realisable value. Estimates of net realisable value of raw materials, work in progress and finished goods are based on the most reliable evidence available at the time the estimates are made. These estimates take into consideration fluctuations of price or cost directly relating to events occurring subsequent to the reporting date to the extent that such events confirm conditions existing at the end of the period (Note 11).
Taxes
Uncertainties may exist with respect to the interpretation of complex tax regulations, changes in tax laws, and the amount and timing of future taxable income. Given the wide range of international business relationships and the long-term nature and complexity of existing contractual agreements, differences arising between the actual results and the assumptions made, or future changes to such assumptions, could necessitate future adjustments to tax income and expense already recorded. The Group establishes provisions or discloses contingent liability, based on reasonable estimates, for probable or, respectively, possible consequences of audits to be conducted by the tax authorities of the respective countries in which it operates. The amount of such provisions is based on various factors, such as experience of previous tax audits and differing interpretations of the tax regulations by the taxable entity and the respective tax authority. Such differences in interpretations may arise relative to a wide variety of issues depending on the conditions prevailing in the respective Group company domicile. When the Group assesses the probability of litigation and subsequent cash outflow with respect to taxes as remote, no contingent liability has been recognised.
Deferred tax assets are reviewed at each reporting date and reduced to the extent that it is no longer probable that sufficient taxable profit will be available to allow all or part of the deferred tax asset to be utilised. The estimation of that probability includes judgments based on the expected future performance
Further details on taxes are disclosed in Note 9 and Note 33.
Value-added tax recoverable
Value-added tax (“VAT”) recoverable is reviewed at each reporting date and reduced to the extent that it is no longer probable that a refund or VAT liabilities for netting will be available. The Group considers that the amount due from the state as at the reporting date will be either recovered in cash or reclaimed against the VAT liabilities related to sales.
Judgements
Litigations
The Group exercises considerable judgment in measuring and recognising provisions and the exposure to contingent liabilities related to pending litigations or other outstanding claims subject to negotiated settlement, mediation or arbitration, as well as other contingent liabilities. Judgement is necessary in assessing the likelihood that a pending claim will succeed, or a liability will arise, as well as in determining a possible range of any final settlement. Because of the inherent uncertainties in this evaluation process, actual losses may be different from the originally estimated provision. These estimates are subject to change as any new information becomes available, primarily with the support of, as appropriate, internal specialists or outside consultants, such as legal counsel. Revisions to the estimates may significantly affect future operating results (Notes 18 and 33).

INTERPIPE LIMITED NOTES TO THE CONSOLIDATED FINANCIAL STATEMENTS FOR THE YEAR ENDED 31 DECEMBER 2011 (in US dollars and in thousands)
26
5. Segment information
For management purposes, the Group is organised into business units based on their products and services, and has four reportable operating segments as follows:
1. Seamless pipes segment – production and distribution of:
• Seamless oil country tubular goods (“OCTG”), used in oil and gas exploration and production;
• Seamless transportation line pipes, used in oil and gas transportation in severe pressure and temperature conditions;
• Seamless industrial pipes, used in a large variety of infrastructure and industrial applications;
• Seamless special applications pipes, used in various applications by machine-building, power and heat generation and petrochemical industries, among others.
2. Welded pipes segment - production and distribution of:
• Industrial welded pipes, used mainly in the construction industry and in local water distribution networks;
• Transportation line welded pipes, used to transport water, crude oil and natural gas in moderate pressure and temperature conditions.
3. Railway wheels segment - production and distribution of a wide range of forged wheels used for freight cars, passenger carriages, locomotives and underground trains as well as tyres for wheel sets used on locomotives, underground trains and trams.
4. Other operations segment - production and sales of enamel ware, lime, scrap metal collection and processing, and other by-products and services.
Inter-segment sales primarily consist of scrap metal sold by Dnepropetrovsk Vtormet to JSC “Interpipe Niznedneprovsky Tube Rolling Plant”, the cost of which was included in the cost of seamless pipes and wheels.
Management monitors the operating results of its business units separately for the purpose of making decisions about resource allocation and performance assessment. The Group’s financing (including finance costs and finance revenue) and income taxes are managed at the Group level and are not allocated to the operating segments.

INTERPIPE LIMITED NOTES TO THE CONSOLIDATED FINANCIAL STATEMENTS FOR THE YEAR ENDED 31 DECEMBER 2011 (in US dollars and in thousands)
27
Segment revenues and results Year ended 31 December 2011
Seamless pipes
Welded pipes
Railway wheels
Other operations Total
Revenue 1,008,592 216,023 311,086 222,297 1,757,998 Elimination of sales to other segments - - - (88,325) (88,325) Revenue - external 1,008,592 216,023 311,086 133,972 1,669,673 Cost of sales (795,881) (179,100) (250,158) (134,494) (1,359,633) Gross profit 212,711 36,923 60,928 (522) 310,040 Selling and distribution expenses (71,213) (24,081) (9,279) (1,382) (105,955) General and administrative expenses (32,867) (12,227) (5,924) (2,832) (53,850) Other operating income and expenses 7,360 (356) (854) (390) 5,760 Operating foreign exchange difference 1,309 (189) 812 99 2,031 Operating profit / (loss) 117,300 70 45,683 (5,027) 158,026 Finance income 2,754 Finance costs (95,516) Non-operating foreign exchange difference (3,093) Share of profits of associates 244 Profit before tax 62,415 Income tax expense (21,397) Profit for the year 41,018
For the years ended 31 December 2011 and 2010, share of profits of associates was attributable to the seamless pipes segment.
The Group measures the performance of its operating segments through a measure of earnings before interest, tax, depreciation and amortisation (EBITDA). EBITDA is calculated as operating profit or (loss) plus depreciation and amortisation charge, plus impairment of property, plant, equipment and intangible asset, plus loss / (gain) on disposal of property, plant and equipment and plus extraordinary losses / (gains).
EBITDA by segments Year ended 31 December 2011
Seamless pipes
Welded pipes
Railway wheels
Other operations Total
Operating profit / (loss) 117,300 70 45,683 (5,027) 158,026 Depreciation and amortisation 57,032 11,331 21,746 1,351 91,460 Impairment of property, plant and equipment and intangible assets (Note 22, 25) 12,553 1,546 5,051 - 19,150
(Gain) / Loss on disposal of property, plant and equipment (Note 25) (830) 285 (394) (20) (959)
Customer’s claim (Note 25) (12,182) - - - (12,182) EBITDA 173,873 13,232 72,086 (3,696) 255,495
Segment assets, liabilities and other information Year ended 31 December 2011
Seamless pipes
Welded pipes
Railway wheels
Other operations Total
Segment assets 1,145,646 144,528 349,487 41,741 1,681,402 Non-current assets classified as held for sale 3,390 - - - 3,390 Segment liabilities 338,861 34,148 66,338 16,110 455,457 Investment in associates (Note 8) 2,522 - - - 2,522 Addition to property, plant and equipment (Note 6) 127,155 327 57,793 3,726 189,001 Movement in provisions (Note 18) (7,971) 302 284 150 (7,235) Other non-cash items (9,770) 389 (2,317) 370 (11,328) Impairment of property, plant and equipment and intangible assets (12,553) (1,546) (5,051) - (19,150)

INTERPIPE LIMITED NOTES TO THE CONSOLIDATED FINANCIAL STATEMENTS FOR THE YEAR ENDED 31 DECEMBER 2011 (in US dollars and in thousands)
28
Segment revenues and results Year ended 31 December 2010
Seamless pipes Welded pipes Railway
wheels Other
operations Total
Revenue 755,798 165,011 252,387 144,063 1,317,259 Elimination of sales to other segments - - - (59,369) (59,369) Revenue - external 755,798 165,011 252,387 84,694 1,257,890 Cost of sales (648,615) (140,404) (188,796) (76,396) (1,054,211) Gross profit 107,183 24,607 63,591 8,298 203,679 Selling and distribution expenses (60,532) (16,491) (9,980) (1,455) (88,458) General and administrative expenses (26,179) (9,281) (7,614) (2,308) (45,382) Other operating income and expenses (17,608) (818) (518) 725 (18,219) Operating foreign exchange difference 1,612 153 127 (14) 1,878 Operating profit / (loss) 4,476 (1,830) 45,606 5,246 53,498 Finance income 1,400 Finance costs (76,261) Non-operating foreign exchange difference 3,268 Share of losses of associates (107) Loss before tax (18,202) Income tax expense (6,139) Loss for the year (24,341)
For the year ended 31 December 2010, share of losses of associates was attributable to seamless pipes segment.
EBITDA by segments Year ended 31 December 2010
Seamless pipes
Welded pipes
Railway wheels
Other operations Total
Operating profit / (loss) 4,476 (1,830) 45,606 5,246 53,498 Depreciation and amortisation 60,689 14,140 23,907 1,465 100,201 Impairment of property, plant and equipment and intangible assets (Note 25) 2,343 453 219 - 3,015
Loss on disposal of property, plant and equipment (Note 25) 349 52 149 65 615
Customer’s claim (Note 25) 12,182 - - - 12,182 EBITDA 80,039 12,815 69,881 6,776 169,511
Segment assets, liabilities and other information Year ended 31 December 2010
Seamless pipes
Welded pipes
Railway wheels
Other operations Total
Segment assets 880,211 135,178 266,454 23,682 1,305,525 Non-current assets classified as held for sale 3,481 - - - 3,481 Segment liabilities 176,091 25,467 45,895 6,021 253,474 Investment in associates (Note 8) 2,287 - - - 2,287 Addition to property, plant and equipment (Note 6) 72,134 1,606 33,143 69 106,952 Movement in provisions (Note 18) 16,890 323 2,001 200 19,414 Other non-cash items (2,011) (1,437) 2,518 (235) (1,165)

INTERPIPE LIMITED NOTES TO THE CONSOLIDATED FINANCIAL STATEMENTS FOR THE YEAR ENDED 31 DECEMBER 2011 (in US dollars and in thousands)
29
Reportable segments’ assets are reconciled to total assets as follows: 31 December 2011 31 December 2010 Segment assets for reportable segments 1,639,661 1,281,843 Other segments assets 41,741 23,682 Non-current assets classified as held for sale 3,390 3,481 Unallocated
Intangible assets 1,624 5,570 Deferred tax assets 73,789 69,002 Prepaid current income tax 4,554 22,933 Taxes recoverable, other than income tax 57,776 34,855 Other financial assets 6,319 29,530 Cash and cash equivalents 136,997 55,939 Other assets 243 304 284,862 218,133
Total assets 1,966,094 1,527,139
Reportable segments’ liabilities are reconciled to total liabilities as follows: 31 December 2011 31 December 2010 Segment liabilities for reportable segments 439,347 247,453 Other segments liabilities 16,110 6,021 Unallocated
Deferred tax liabilities 14,777 11,366 Taxes payable, other than income tax 3,816 5,591 Current income tax liabilities 495 3,041 Borrowings 1,025,586 878,967 Interest payable 10,907 15,583 Dividends payable to non-controlling interest owners 827 2,705 Other liabilities 4,594 8,535
1,061,002 925,788 Total liabilities 1,516,459 1,179,262
Geographical information
Revenues from external customers For the year ended
31 December 2011 For the year ended 31 December 2010
Ukraine 608,321 449,170 Russia 413,306 322,136 Other CIS countries 239,474 201,796 Europe 185,602 90,361 NAFTA 148,956 84,701 Middle East and Africa 71,026 103,323 Other countries 2,988 6,403 1,669,673 1,257,890
NAFTA region includes the USA, Canada and Mexico. Other CIS countries region includes members of Commonwealth of Independent States, except for Ukraine and Russia, both of which are presented as separate regions.

INTERPIPE LIMITED NOTES TO THE CONSOLIDATED FINANCIAL STATEMENTS FOR THE YEAR ENDED 31 DECEMBER 2011 (in US dollars and in thousands)
30
Non-current assets
Non-current assets comprising property, plant and equipment, intangible assets and goodwill are presented in the table below. Non-current assets are allocated by foreign countries in which the Group holds assets. If non-current assets in an individual foreign country are material, those assets are disclosed separately.
31 December 2011 31 December 2010 Ukraine 974,748 874,994 Europe 85,895 113,094 Other countries 284 266 1,060,927 988,354
Non-current assets allocated to Europe are primarily attributable to the construction of an electric arc furnace (“EAF” or “EAF Project”) (Notes 6 and 33).
6. Property, plant and equipment
Movement in property, plant and equipment and related accumulated depreciation for the years ended 31 December 2011 and 2010 was as follows:
Buildings and
structures
Machinery and
equipment
Transport and motor
vehicles
Fixtures and office equipment
Construction-in-progress
and uninstalled equipment Total
Cost or valuation: At 1 January 2010 213,634 502,319 12,510 4,454 367,602 1,100,519 Additions - - - - 106,952 106,952 Transfers 1,624 21,483 254 521 (23,882) - Disposals and write-offs (159) (14,642) (170) (106) - (15,077) Impairment - - - - (2,603) (2,603) Asset classified as held-for-sale - - - - (3,481) (3,481) Translation difference 619 1,440 35 10 346 2,450 At 31 December 2010 215,718 510,600 12,629 4,879 444,934 1,188,760 Additions - - - - 189,001 189,001 Transfers 6,468 46,388 2,063 577 (55,496) - Disposals and write-offs (310) (13,505) (660) (200) - (14,675) Impairment - - - - (937) (937) Acquisitions of a subsidiaries 624 - - - - 624 Translation difference (764) (1,858) (55) (21) (1,901) (4,599) At 31 December 2011 221,736 541,625 13,977 5,235 575,601 1,358,174 Accumulated depreciation and impairment: At 1 January 2010 30,463 94,179 4,311 1,908 - 130,861 Depreciation for the year 20,559 75,795 2,510 773 - 99,637 Disposals and write-offs (74) (13,860) (122) (89) - (14,145) Translation difference 22 71 6 2 - 101 At 31 December 2010 50,970 156,185 6,705 2,594 - 216,454 Depreciation for the year 19,838 70,554 1,653 736 - 92,781 Disposals and write-offs (121) (12,855) (404) (183) - (13,563) Impairment 7,663 7,017 - - - 14,680 Translation difference (239) (721) (29) (14) - (1,003) At 31 December 2011 78,111 220,180 7,925 3,133 - 309,349 Net book value At 31 December 2010 164,748 354,415 5,924 2,285 444,934 972,306 At 31 December 2011 143,625 321,445 6,052 2,102 575,601 1,048,825
Buildings and structures, machinery and equipment, transport and motor vehicles, fixtures and office equipment of the Group were valued at 1 July 2008. The valuation was carried out by an independent appraiser.

INTERPIPE LIMITED NOTES TO THE CONSOLIDATED FINANCIAL STATEMENTS FOR THE YEAR ENDED 31 DECEMBER 2011 (in US dollars and in thousands)
31
All items of property, plant and equipment that were not re-valued are carried at historical cost which approximates their fair value.
In 2007, the Group commenced construction of EAF. As at 31 December 2011 and 31 December 2010, costs attributable to the project amounting to USD 494,783 and USD 370,798 thousand, respectively, were included in the construction-in-progress and uninstalled equipment. They comprised of uninstalled equipment, site preparation costs and prepayments under the contract for equipment delivery (Note 33). Other costs included in construction-in-progress and uninstalled equipment represented primarily unfinished installation works and uninstalled equipment on existing production sites.
As at 31 December 2011, the Group has assessed certain property, plant and equipment items relating to open-hearth furnace workshop (“OHF”) for impairment. Management has intentions to decommission OHF by the end of 2012. The recoverable amount was determined as the remaining value in use plus scrap value assessed by professional appraisers. The impairment charge relating to OHF and amounting to USD 14,680 thousand was recognised in cost of sales (Note 22).
As at 31 December 2011 and 2010, property, plant and equipment with carrying value of USD 849,337 thousand and USD 357,671 thousand, respectively, were pledged as a security for the Group’s borrowings (Note 17). As at 31 December 2011 and 2010, prepayments for property plant and equipment amounting to USD nil and USD 71,737 thousand, respectively, were pledged as property rights under property, plant and equipment purchase agreements (Note 17).
For the years ended 31 December 2011 and 2010, borrowing costs amounting to USD 13,149 thousand and USD 12,739 thousand, respectively, were capitalised in property, plant and equipment. The capitalisation rate for the years ended 31 December 2011 and 2010 comprised 4.87% and 4.76%, respectively.
As at 31 December 2011 and 2010, USD 57,797 thousand of capital commitments were capitalised as a result of hedge accounting and were included in construction-in-progress and uninstalled equipment.
As at 31 December 2011 and 2010, the cost of fully depreciated items of property, plant and equipment, which remain in use, amounted to USD 13,729 thousand and USD 1,809 thousand, respectively.
Non-current assets held for sale are represented by production equipment located in the USA. In October 2010, the agreement for its sale was signed with expected disposal date in August 2011. The net book value of the equipment amounting to USD 5,775 thousand was written down to its selling price of USD 3,481 thousand and was reclassified to non-current assets held for sale. The impairment charge relating to the assets and amounting to USD 2,294 thousand was recognised in other operating income and expenses in 2010. In August 2011 the sale agreement was revised with the settlement date reset to 2012 and the final price decreased to USD 3,390 thousand. As the result of the revision, the carrying value of the equipment was written down by further USD 91 thousand, recognised in other operating income and expenses in 2011.
If property, plant and equipment continued to be measured using cost model, their carrying amount would be as follows:
Buildings and
structures Machinery
and equipment
Transport and motor
vehicles
Fixtures and office
equipment
Construction-in-progress
and uninstalled equipment Total
31 December 2010 40,611 184,084 2,304 2,289 444,934 674,222 31 December 2011 43,468 185,670 3,678 2,303 575,601 810,720
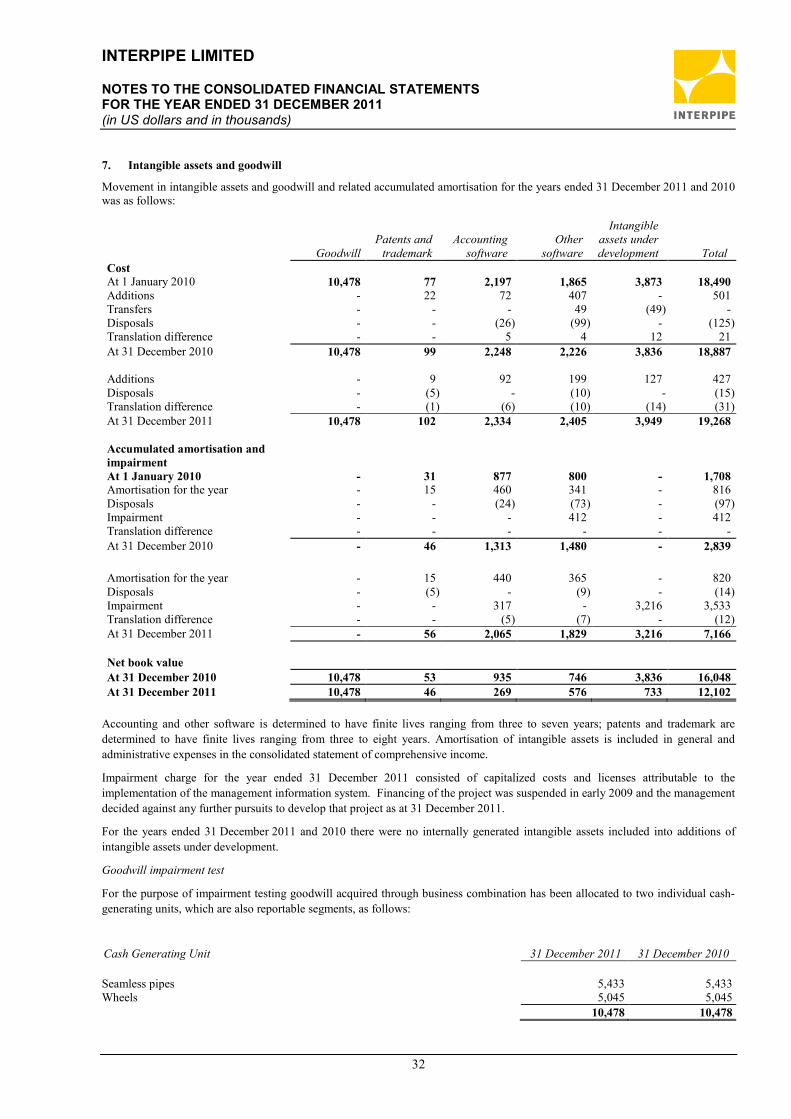
INTERPIPE LIMITED NOTES TO THE CONSOLIDATED FINANCIAL STATEMENTS FOR THE YEAR ENDED 31 DECEMBER 2011 (in US dollars and in thousands)
32
7. Intangible assets and goodwill
Movement in intangible assets and goodwill and related accumulated amortisation for the years ended 31 December 2011 and 2010 was as follows:
Goodwill Patents and
trademark Accounting
software Other
software
Intangible assets under development Total
Cost At 1 January 2010 10,478 77 2,197 1,865 3,873 18,490 Additions - 22 72 407 - 501 Transfers - - - 49 (49) - Disposals - - (26) (99) - (125) Translation difference - - 5 4 12 21 At 31 December 2010 10,478 99 2,248 2,226 3,836 18,887 Additions - 9 92 199 127 427 Disposals - (5) - (10) - (15) Translation difference - (1) (6) (10) (14) (31) At 31 December 2011 10,478 102 2,334 2,405 3,949 19,268 Accumulated amortisation and impairment
At 1 January 2010 - 31 877 800 - 1,708 Amortisation for the year - 15 460 341 - 816 Disposals - - (24) (73) - (97) Impairment - - - 412 - 412 Translation difference - - - - - - At 31 December 2010 - 46 1,313 1,480 - 2,839 Amortisation for the year - 15 440 365 - 820 Disposals - (5) - (9) - (14) Impairment - - 317 - 3,216 3,533 Translation difference - - (5) (7) - (12) At 31 December 2011 - 56 2,065 1,829 3,216 7,166 Net book value At 31 December 2010 10,478 53 935 746 3,836 16,048 At 31 December 2011 10,478 46 269 576 733 12,102
Accounting and other software is determined to have finite lives ranging from three to seven years; patents and trademark are determined to have finite lives ranging from three to eight years. Amortisation of intangible assets is included in general and administrative expenses in the consolidated statement of comprehensive income.
Impairment charge for the year ended 31 December 2011 consisted of capitalized costs and licenses attributable to the implementation of the management information system. Financing of the project was suspended in early 2009 and the management decided against any further pursuits to develop that project as at 31 December 2011.
For the years ended 31 December 2011 and 2010 there were no internally generated intangible assets included into additions of intangible assets under development.
Goodwill impairment test
For the purpose of impairment testing goodwill acquired through business combination has been allocated to two individual cash-generating units, which are also reportable segments, as follows:
Cash Generating Unit 31 December 2011 31 December 2010 Seamless pipes 5,433 5,433 Wheels 5,045 5,045 10,478 10,478

INTERPIPE LIMITED NOTES TO THE CONSOLIDATED FINANCIAL STATEMENTS FOR THE YEAR ENDED 31 DECEMBER 2011 (in US dollars and in thousands)
33
The recoverable amount of both CGUs has been determined based on value in use by applying cash flow projections from the approved Group’s strategy covering the period to 2014.
The calculation of value in use for both CGUs is particularly sensitive to the following assumptions:
• Gross margins;
• Raw materials price inflation;
• Discount rate;
• Growth rate.
Gross margins –budgeted gross margins are determined based on past performance and expectations of market development.
Raw materials price inflation – estimates are obtained from published indices or the Group’s internal researches. Forecast figures are used if data is publicly available, otherwise past actual raw material price movements have been used as an indicator of future price movements.
The pre-tax discount rates applied to cash flow projections are 19.3% and 20.6% as at 31 December 2011 and 20.2% and 20.8% as at 31 December 2010 for seamless pipes and wheels CGUs, respectively. Discount rates reflect management’s estimate of the specific risks relating to the relevant segments.
The growth rate used to extrapolate the cash flows of the both seamless pipes and wheels CGUs beyond five-year period is 3.6%. This growth rate does not exceed the average growth rate for the pipes and wheels industries.
With regard to assessment of value in use of the both CGUs, management believes that no reasonably possible change in any of the above key assumptions would cause the carrying value of the units to materially exceed its recoverable amount.
No impairment of goodwill was identified as the result of the testing performed.
8. Investments in associates
The Group’s investments in associates were as follows:
Entity Activity % of the Group
ownership 31 December 2011 31 December 2010 CJSC “Nikopolsky Repairing Plant” Repairs 25% 1,113 969 CJSC “Nikopolsky Tooling Plant” Tooling for machines 25% 1,044 1,042 CJSC “Teplogeneratzia” Utility services 30% 365 276
2,522 2,287
CJSC “Teplogeneratzia”, CJSC “Nikopolsky Tooling Plant” and CJSC “Nikopolsky Repairing Plant” are entities incorporated in Ukraine. They are private companies not listed on any public exchange.
The following table illustrates summarised financial information of the Group’s investments in associates:
For the year ended 31 December 2011
For the year ended 31 December 2010
At period beginning 2,287 2,385 Share of profit / ( loss) 244 (107) Translation difference (9) 9 At period end 2,522 2,287
The Group’s share in net assets of its associates was as follows:
CJSC “Teplo-generatzia”
CJSC “Nikopolsky Tooling Plant”
CJSC “Nikopolsky Repairing Plant”
At 31 December 2011 Assets 3,610 2,182 2,407 Liabilities (3,245) (1,138) (1,294) Net assets – carrying amounts of investments 365 1,044 1,113

INTERPIPE LIMITED NOTES TO THE CONSOLIDATED FINANCIAL STATEMENTS FOR THE YEAR ENDED 31 DECEMBER 2011 (in US dollars and in thousands)
34
CJSC “Teplo-generatzia”
CJSC “Nikopolsky Tooling Plant”
CJSC “Nikopolsky Repairing Plant”
At 31 December 2010 Assets 1,603 1,712 1,743 Liabilities (1,327) (670) (774) Net assets – carrying amounts of investments 276 1,042 969
The following table illustrates the Group’s share in revenues and profit or loss of associates:
For the year ended 31 December 2011
For the year ended 31 December 2010
Revenue Profit / (loss) for the year Revenue Profit / (loss)
for the year CJSC “Teplogeneratzia” 5,798 89 3,416 (213) CJSC “Nikopolsky Repairing Plant” 4,828 149 3,052 53 CJSC “Nikopolsky Tooling Plant” 3,228 6 2,584 53
9. Income tax
The components of income tax expense for the years ended 31 December 2011 and 2010 were as follows:
For the year ended 31 December 2011
For the year ended 31 December 2010
Current income tax expense (23,066) (29,151) Deferred income tax benefit 1,669 23,012 (21,397) (6,139)
Income tax expense for the years ended 31 December 2011 and 2010 originated in the following tax jurisdictions:
Domestic tax rates applicable to individual group entities as at For the year ended
31 December 2011 For the year ended 31 December 2010 31 December 2011 31 December 2010
Ukraine 23% - 25% 25% (18,015) (5,565) Russia 20% 20% (3,708) (1,743) Switzerland 12% 12% (3,034) 723 The USA 34% 34% 5,660 465 Cyprus 10% 10% (1,102) - Kazakhstan 20% 20% (1,198) (19) (21,397) (6,139)
In 2010, the Government of Ukraine initiated significant changes in tax laws. Starting from 1 January 2011, a new Tax Code was enforced, which superseded a set of various tax laws (including VAT, Corporate profit tax and others).
Key provisions related to Corporate profit tax in Ukraine are following: tax rate was reduced to 23% starting from 1 April 2011 and will be further reduced to 21% in 2012, to 19% in 2013, and 16% thereafter; harmonisation between tax and financial accounting in respect of profit before tax calculation as well as valuation of assets and liabilities.

INTERPIPE LIMITED NOTES TO THE CONSOLIDATED FINANCIAL STATEMENTS FOR THE YEAR ENDED 31 DECEMBER 2011 (in US dollars and in thousands)
35
Profit / (loss) before tax for financial reporting purposes is reconciled to tax expense as follows:
For the year ended 31 December 2011
For the year ended 31 December 2010
Accounting profit / (loss) before tax 62,415 (18,202) Tax (charge) / benefit calculated at domestic rates applicable to individual Group entities (8,376) 7,088
Tax effect of non-deductible expenses (11,420) (5,060)Tax effect of non-taxable incomes 1,058 596 Recognition of the tax asset relating to the change in an estimate of deductibility of certain temporary difference 1,369 -
Effect of change in tax rates in Ukraine (3,585) (3,914)Change in previously unrecognised deferred tax assets 253 (3,189)Translation difference (26) (236)Other differences (670) (1,424) (21,397) (6,139)
Deferred tax assets and liabilities related to the following:
31 December 2011
Change recognised in profit or loss
Translation difference
31 December 2010
Deferred tax liabilities: Revaluation and deemed cost adjustments of property, plant and equipment and difference in depreciation (2,067) 11,401 (11) (13,457)
Taxable differences on intercompany settlements and investments (6,665) 8,741 1 (15,407)
Other deferred tax liabilities (20) 7 1 (28) (8,752) 20,149 (9) (28,892) Deferred tax assets: Deductible costs retained in inventories 467 4,075 4 (3,612) Tax losses carry forward 17,804 (15,793) (79) 33,676 Write-down of inventories 1,635 (889) 8 2,516 Deductible differences on intercompany settlements and investments 29,760 (14,993) 2 44,751
Accrued liabilities and provisions 8,067 (3,436) (36) 11,539 Loans and interest payable 9,432 (3,510) (11) 12,953 Allowance for doubtful accounts 2,496 (1,742) (103) 4,341 Adjustment for unrealised profits in inventories 4,955 1,901 - 3,054 Deferral of tax deductible expenses 24,779 16,001 (69) 8,847 Deferral of revenues and related costs 474 (78) (2) 554 Other deferred tax assets 1,149 (269) 27 1,391 101,018 (18,733) (259) 120,010 Unrecognised deferred tax assets (33,254) 253 (25) (33,482) Deferred income tax benefit from origination and reversal of temporary differences 1,669
Reflected in the consolidated statement of financial position as follows:
Deferred tax assets 73,789 69,002 Deferred tax liabilities (14,777) (11,366) Deferred tax assets, net 59,012 57,636
As at 31 December 2011, the deferred tax effect of tax losses arising in Ukraine amounted to USD 8,631 thousand (2010: USD 27,259 thousand), Cyprus: USD 3,899 thousand (2010: USD 3,587 thousand), the USA: USD 166 thousand (2010: USD 2,172 thousand), Kazakhstan: USD 655 thousand (2010: USD 658 thousand) and Switzerland: USD 4,453 thousand

INTERPIPE LIMITED NOTES TO THE CONSOLIDATED FINANCIAL STATEMENTS FOR THE YEAR ENDED 31 DECEMBER 2011 (in US dollars and in thousands)
36
(2010: nil). Tax losses are available for offset against future taxable profits of the respective Group entities for 20 years in the USA and indefinitely in all other jurisdictions.
Deferred tax assets were not recognised in respect of deductible differences on intercompany settlements and investments and tax losses carry forward in the USA, capitalised transaction costs and tax losses carry forward in Cyprus, and tax losses carry forward in Kazakhstan, as there are doubts as to the recoverability of these assets.
As at 31 December 2011 and 2010, deferred tax liability was not recognised in respect of taxable temporary differences amounting to USD 36,333 thousand and USD 22,729 thousand, respectively, associated with the Company’s investments in its subsidiaries as management is able to control the timing of the reversal of those temporary differences and does not intend to reverse them in the foreseeable future.
31 December 2010
Change recognised in profit or loss
Change recognised in other
comprehensive income
Translation difference
31 December 2009
Deferred tax liabilities: Revaluation and deemed cost adjustments of property, plant and equipment and difference in depreciation
(13,457) 22,863 76,320 (351) (112,289)
Taxable differences on intercompany settlements and investments (15,378) (1,163) - (31) (14,184)
Deductible costs retained in inventories (3,612) (507) - (12) (3,093)
Other deferred tax liabilities (28) (1) - (1) (26) (32,475) 21,192 76,320 (395) (129,592) Deferred tax assets: Tax losses carry forward 33,676 (11,183) - 197 44,662 Write-down of inventories 2,516 986 - 3 1,527 Deductible differences on intercompany settlements and investments
44,751 2,870 - 54 41,827
Accrued liabilities and provisions 11,539 (2,198) - 43 13,694 Loans and interest payable 12,953 3,722 - 2 9,229 Allowance for doubtful accounts 4,341 484 - (12) 3,869 Adjustment for unrealised profits in inventories
3,054 126 - - 2,928
Deferral of deductible expenses 8,847 8,933 - (86) - Deferral of revenues and related costs 554 97 - (4) 461 Derivative financial instruments - (121) - - 121 Other deferred tax assets 1,362 1,293 - 1 68 123,593 5,009 - 198 118,386 Unrecognised deferred tax assets (33,482) (3,189) - - (30,293) Deferred income tax benefit from origination and reversal of temporary differences
23,012
Income tax relating to components of other comprehensive income 76,320
Reflected in the consolidated statement of financial position as follows:
Deferred tax assets 69,002 38,189 Deferred tax liabilities (11,366) (79,688) Deferred tax assets, net 57,636 (41,499) Changes recognised in other comprehensive income related to increase in tax base of property, plant and equipment as the result of changes in the tax legislation in Ukraine referred to above.

INTERPIPE LIMITED NOTES TO THE CONSOLIDATED FINANCIAL STATEMENTS FOR THE YEAR ENDED 31 DECEMBER 2011 (in US dollars and in thousands)
37
10. Prepaid current income tax
Income tax asset comprises of prepayments made to the tax authorities in Ukraine. In accordance with the Ukrainian tax legislation income tax should be accrued and paid on a quarterly basis during current tax year. Tax losses suffered by the Ukrainian subsidiaries in the 4th quarter of 2008 exceeded taxable profits received during the first nine months of the year. The excess resulted in a balance of prepaid income tax as at 31 December 2008. Since no direct cash reimbursement of overpaid income tax is available under the effective Ukrainian tax legislation, the respective income tax asset was split into current and non-current components based on the management best estimate of taxable profits generation by the Ukrainian subsidiaries and the expected timing of the prepayment offset against such taxable profits.
11. Inventories
Inventories, carried at lower of cost and net realisable value, consisted of the following:
31 December 2011 31 December 2010
Raw materials 108,635 69,136 Work in process 50,059 40,057 Finished goods 165,798 97,666
324,492 206,859
As at 31 December 2011 and 2010, write down of inventories to net realisable value amounted to USD 7,379 thousand and USD 15,354 thousand, respectively.
As at 31 December 2011, raw materials, work in process and finished goods with carrying value of USD 28,624 thousand, USD 22,688 thousand and USD 95,590 thousand, respectively, were pledged as a security for the Group’s borrowings (Note 17). No inventories were pledged as at 31 December 2010.
12. Trade and other accounts receivable
Trade and other accounts receivable consisted of the following:
31 December 2011 31December 2010 Trade accounts receivable 221,936 118,665 Less allowance for impairment (16,081) (23,245) 205,855 95,420 Other receivables net of allowance for impairment 2,372 2,481 208,227 97,901
As at 31 December 2011, trade receivables with carrying value of USD 23,517 thousand, were pledged as a security for the Group’s borrowings (Note 17). No trade receivables were pledged as at 31 December 2010.
Movement in the allowance for impairment of trade accounts receivable was as follows:
For the year ended 31 December 2011
For the year ended 31 December 2010
At period beginning 23,245 18,692 (Release) / charge for the year (Note 23) (4,090) 4,973 Utilisation (2,556) (588) Translation difference (518) 168 At period end 16,081 23,245
As at 31 December 2011 and 2010, allowance for impairment of other receivables amounted to USD 1,233 thousand and USD 628 thousand, respectively.
As at 31 December 2011 and 2010, the allowance for impairment of trade accounts receivable included USD 2,590 thousand and USD 5,584 thousand, respectively, of the allowance that was determined individually in respect of debtors with significant financial difficulties or with estimated high probability of their insolvency.

INTERPIPE LIMITED NOTES TO THE CONSOLIDATED FINANCIAL STATEMENTS FOR THE YEAR ENDED 31 DECEMBER 2011 (in US dollars and in thousands)
38
The analysis of trade and other accounts receivable is as follows:
Total
Neither past due nor
impaired
Past due, net of allowance for impairment
< 30 days 30 – 60 days 60 – 90 days >90 days 31 December 2011 208,227 129,965 23,911 22,103 3,165 29,083 31 December 2010 97,901 72,043 15,281 5,482 1,466 3,629
Trade receivables are non-interest bearing and are generally collected within a three-month term. As at 31 December 2011 and 2010, 66% and 50% of trade accounts receivable, respectively, were due from twenty major customers.
13. Prepayments and other current assets
Prepayments and other current assets consisted of the following:
31 December 2011 31 December 2010 Prepayments to suppliers 73,694 6,744 Prepaid insurance expense 2,872 1,098 Other current assets 2,280 610 78,846 8,452
14. Taxes recoverable, other than income tax
Taxes recoverable, other than income tax consisted of the following:
31 December 2011 31 December 2010
Value-added tax recoverable 57,773 34,854 Other taxes recoverable 3 1 57,776 34,855
VAT recoverable primarily originated in Ukraine (Note 4).
15. Other financial assets
Other financial assets consisted of the following:
31 December 2011 31 December 2010
Available reimbursement related to litigations (Notes 18 and 25) 7,700 6,930 Guarantee deposits 3,014 5,530 Restricted bank deposit pledged as collateral for loans 3,305 24,000 14,019 36,460
As at 31 December 2011 and 2010, the guarantee deposits represented restricted bank deposits relating to letters of credit issued by banks in favour of the Group’s suppliers and guarantees issued by banks in favour of the Group’s customers.
As at 31 December 2011 and 2010, restricted bank deposits and guarantee deposits with carrying value of USD 3,305 thousand and USD 24,000 thousand, respectively, were pledged as a security for the Group’s borrowings (Note 17).
16. Cash and cash equivalents
Cash and cash equivalents consisted of the following:
31 December 2011 31 December 2010
Current accounts and deposits on demand at banks 134,689 55,906 Time deposits at banks 2,285 25 Cash in hand 23 8
136,997 55,939
As at 31 December 2011 and 2010, demand deposits at banks earned interest at rates of up to 15% and 12% per annum, respectively. Time deposits at banks that were placed for periods of up to three months earned interest at rates of up to 15% and 17% per annum, respectively, for the years ended 31 December 2011 and 2010. Majority of the deposits are UAH denominated.
As at 31 December 2011 and 2010, cash and cash equivalents with carrying value of USD 82,864 thousand and USD 3,761 thousand, respectively, were pledged as a security for the Group’s borrowings (Note 17).

INTERPIPE LIMITED NOTES TO THE CONSOLIDATED FINANCIAL STATEMENTS FOR THE YEAR ENDED 31 DECEMBER 2011 (in US dollars and in thousands)
39
17. Borrowings
Interest bearing borrowings, net of unamortised portion of directly attributable loan origination costs consisted of the following:
31 December 2011 31 December 2010 Current borrowings Interest bearing loans due to banks 40,000 680,642 Other borrowings 23,517 - Bonds issued - 198,325 Add: current portion of non-current borrowings 63,102 - 126,619 878,967 Non-current borrowings Interest bearing loans due to banks 763,534 - Bonds issued 198,535 - Less: Current portion of non-current borrowings (63,102) - 898,967 - 1,025,586 878,967
By 31 December 2011, the Group has completed a major restructuring of its borrowings. The restructuring process, as detailed further below in this Note, has been commenced in early 2009 in response to the breach by the Group of certain financial and non-financial covenants provided by then existing loan agreements and bonds issue undertakings. The non-compliance with the covenants provided the lenders and bondholders with the right to demand an accelerated or full immediate repayment of the borrowings. Accordingly, as at 31 December 2010, USD 294,856 thousand of borrowings, which otherwise would be maturing in more than 12 months from the reporting date were presented as current borrowings.
Debt restructuring
The main purpose of the debt restructuring was to match the Group’s principal repayment and interest payment obligations with its cash generating capacity in a sustainable manner while allowing to complete its ongoing capital expenditure projects (mainly – the EAF Project) as well as to maintain proper level of safety and maintenance expenditures. The debt restructuring sought to do this by: (1) deferring the maturity dates of the Group’s principal repayment obligations; (2) providing for earlier repayments of a principal only out of the excess cash flows, the proceeds from asset disposals and other debt raisings, subject to certain carve-outs aimed to preserve the Group’s cash balance position; and (3) providing for the capitalisation of portion of the Group’s interest payment obligations in the form of payment-in-kind (“PIK”) interest until the final repayment of the restructured debt obligations or, if earlier, immediately after cessation of the PIK interest accrual.
In November 2011, the Group executed restructuring documentation with its lenders and bondholders. In order to give effect to the restructuring in a uniform manner, the lenders under various bilateral and syndicated facility agreements (the “Restructured facilities”), the lenders under the EAF project finance facilities backed by SACE (the “SACE facilities”) and the Group have entered into one overriding agreement which contains provisions to amend and override certain clauses (including various rights and obligations of the parties) set out in each of the Restructured facilities and the SACE facilities (the “Override agreement”) which has entered into full force and effect on 16 December 2011. The Override agreement acts as an umbrella amendment agreement applicable to each of the Restructured facilities and the SACE facilities.
SACE facilities restructuring
As part of the debt restructuring arrangements, SACE (Italian export credit agency – the “ECA”) and SACE facilities lenders have provided total additional commitment of USD 135,743 thousand of project finance dedicated to fund the EAF Project out of which USD 117,052 thousand in nominal value was drawn in 2011 with remaining USD 18,691 thousand of undrawn commitment as at 31 December 2011 (available against specific eligible EAF Project costs). The new commitment, amongst other things, has entitled SACE to a premium of USD 10,000 thousand, which was paid upfront as a condition precedent to the Override agreement effectiveness and accounted for as transaction costs for the purposes of these consolidated financial statements.
Bonds restructuring
In August 2007, Interpipe Limited issued on the Luxemburg Stock Exchange USD 200 million bonds, initially maturing in August 2010. The bonds are US Dollar denominated and bore interest of 8.75% per annum, payable semi-annually in arrears.
In September 2010, the terms of the bonds issuance were amended as follows: interest rate increased up to 10.25% and maturity date extended till August 2017. In October 2010, bondholders agreed to further amend the terms of the issue to ensure full alignment of the terms and conditions of the bonds with the restructuring terms determined under the Override agreement and the bondholders became entitled to share the security package (except security over the EAF assets) on a pari pasu basis with the other lenders. As at 31 December 2011 and 2010, the effective interest rate for the bonds was 10.70% per annum.

INTERPIPE LIMITED NOTES TO THE CONSOLIDATED FINANCIAL STATEMENTS FOR THE YEAR ENDED 31 DECEMBER 2011 (in US dollars and in thousands)
40
Margins and restructuring fees
As part of the restructuring process the Group and its lenders revised margins and fees applicable to various facilities. The Group paid an upfront fee to the lenders, participating in the restructuring, including 0.75% of the lenders’ exposure in cash and additional commitments as at the effective date of the Override agreement as well as committed to pay a further exit fee of 0.75% calculated on the same basis and payable with a final tranche of each of the Restructured facilities and the SACE facilities. The Restructured facilities and the SACE facilities bear interest at the base rate plus a margin of 4% and a PIK component that initially was set at a level of 1% margin and decreases following reduction of total net debt to EBITDA ratio.
Accounting for the restructuring
On the date of the restructuring the Group assessed whether the transaction should be accounted for as an extinguishment of debt. For this purpose the Group discounted expected cash flows under the loans and other agreements subsequent to the restructuring at the effective interest rates established for each facility prior to the restructuring. As the difference between the discounted amount and the carrying value of the existing facilities has not exceeded 10%, the restructuring has not been accounted for as an extinguishment. Therefore, the qualifying transaction costs of USD 21,638 thousand incurred on the restructuring were deducted from the carrying values of existing facilities and will be amortised over the remaining term of the restructured liabilities at the new effective interest rates defined for the facilities and bonds.
Applicable interest rate and currency split for borrowings were as follows:
Applicable interest rates 31 December 2011 31 December 2010 Restructured SACE facilities
USD Fixed rate 7.77% - 11.12% 78,477 83,673 Floating rate LIBOR (3month) + 1.5% 89,022 - Floating rate LIBOR (3month) + 4.0% 18,738 - 186,237 83,673
Restructured facilities USD Floating rate LIBOR (3month) + 4.0% 577,059 - Floating rate LIBOR (1month - 1year) + 2.25% - 7.00% - 517,591 Floating rate Cost of funding + 7.00% - 10,000 577,059 527,591 EUR Floating rate LIBOR (1month) + 7.00% - 65,841 - 65,841
Bonds restructured and facilities outside of restructuring scope USD Fixed rate 10.70% – 13.00% 238,773 198,325 RUR Fixed rate 7.50% – 8.60% 23,517 - EUR Floating rate EURIBOR (3month) + 5% - 7.00% - 3,537 262,290 201,862 1,025,586 878,967
As at 31 December 2011 and 2010, the nominal value of the Group’s loans and borrowings was USD 1,065,390 thousand and USD 891,612 thousand, respectively.
The additional commitments under the SACE facilities on a floating rate basis are subject to interest rate cap acquired by the Group from a bank capping LIBOR to maximum of 2.00% for the entire life of the SACE facilities and replicating the expected outstanding exposure under the SACE facilities. The initial premium of the cap in amount of USD 1,220 thousand is included in finance costs (Note 28) in the consolidated statements of comprehensive income. As at 31 December 2011, the fair value of the cap is USD 899 thousand.
Covenants
The Override agreement and undertakings under the bonds issue contain certain financial covenants, including the maintenance of specified ratios, such as debt service, total net debt to EBITDA, total debt to equity, current ratio, a minimum cash balance, maximum capital expenditures and additional permitted indebtedness, which shall be tested on a quarterly basis. Additionally,

INTERPIPE LIMITED NOTES TO THE CONSOLIDATED FINANCIAL STATEMENTS FOR THE YEAR ENDED 31 DECEMBER 2011 (in US dollars and in thousands)
41
the Group’s borrowings arrangements also restrict certain operational activities of the Group and any incompliance with such restrictions may cause default under the Restructured facilities, the SACE facilities or the bonds (jointly referred to as “Restructured creditors”). Management considers that as at 31 December 2011 and as at the date of issue of these consolidated financial statements the Group is in compliance with the financial and non-financial covenants.
Prepayment and cash sweep
Fixed amortisation schedule for the principal, cash and PIK interest as referred to above is set by the Override agreement. The Group has the option to refinance any amount of the outstanding indebtedness on pro-rata basis at any point in time upon consent of a required majority of the lenders.
Net proceeds raised from asset disposals, insurance compensation proceeds (if not reinvested) and cash sweep of 50% of the excess cashflow must be applied to repay the Group’s outstanding Restructured facilities and the SACE facilities on a pro-rata basis, after the EAF Project completion has occurred. This provision terminates when and if leverage ratio is maintained at 2.5:1 or less and after at least USD 200,000 thousand out of the Restructured facilities and the SACE facilities is repaid.
Equity Injection and Shareholders’ Support and Undertakings
As a condition precedent for the Override agreement effectiveness, the shareholders of the Company injected USD 65,000 thousand of equity (Note 29) and provided additional stand-by financial means in the form of a letter of credit in amount of USD 40,000 thousand aiming to secure funding for the EAF Project completion.
The Override agreement prohibits the Company to distribute dividends or make any other form of distribution in favour of its shareholders. In addition, the Company’s subsidiaries with the effective ownership of less than 100% (Note 31) are prohibited to declare and pay dividends unless required by law. Steel.One Limited is specifically restricted to distribute dividends until all obligation under the SACE facilities are extinguished.
Pledges of assets
A summary of the pledges to secure Group’s obligations is set out below: 31 December 2011 31 December 2010 Carrying values of property, plant and equipment (Note 6) 849,337 357,671 Inventories (Note 11) 146,902 - Trade receivables (Note 12) 23,517 - Cash and cash equivalents (Note 16) 82,864 3,761 Assignments of export contract receivables from Group companies - 398,216 Rights/title/interest under property, plant and equipment purchase agreements 30,752 133,975 Prepayments for property, plant and equipment (Note 6) - 71,737 Other financial assets (Note 15) 3,305 24,000
As at 31 December 2011, shares and participatory interest in subsidiaries as detailed in Note 31, except for newly acquired “META” LLC, were pledged as collateral to secure the Group’s obligations to the Restructured creditors. In addition, the shareholders of the Group agreed to pledge all shares of the Company to secure the Group’s obligation to the Restructured creditors.
Following the restructuring date, the Group is obliged to pledge USD 42,000 thousand of its inventories in Ukraine and all inventory in the USA to secure the Group’s obligation to the Restructured creditors.
The Group is also to procure the pledge of rights, including all monies and claims, arising out of certain intra-group sales contracts for the total minimal annual value of USD 270,000 thousand, as well as rights, arising out of sales contracts between certain of the Group’s trading subsidiaries and their ultimate customers for the total minimal annual value of USD 160,000 thousand, to be assigned to secure the Group’s obligations due to the Restructured creditors.
The occurrence of an event of default may lead to acceleration and enforcement by the Restructured creditors of the security provided, if the required majority of the Restructured creditors so elect.

INTERPIPE LIMITED NOTES TO THE CONSOLIDATED FINANCIAL STATEMENTS FOR THE YEAR ENDED 31 DECEMBER 2011 (in US dollars and in thousands)
42
18. Provisions
Provisions included the following:
31 December 2011 31 December 2010 Provision for customers’ and other claims 10,557 22,804 Defined benefit state pension plan 18,673 21,507 Retirement benefit plan 1,795 1,213 31,025 45,524 Provision – current portion (15,798) (26,815) Provision – non-current portion 15,227 18,709
Non-current portion of the provisions relates to defined benefit state pension plan and retirement benefit plan.
For the years ended 31 December 2011 and 2010, movements in the provisions were as follows:
Provision for customers’ and other claims
Defined benefit state pension plan
Retirement benefit plan
Total provisions
At 1 January 2010 11,015 18,865 1,160 31,040 Charge for the year 14,049 6,442 165 20,656 Payments and utilisation (1,025) (3,847) (115) (4,987) Reversal (1,242) - - (1,242) Translation difference 7 47 3 57 At 31 December 2010 22,804 21,507 1,213 45,524 Charge for the year 3,655 1,696 696 6,047 Payments and utilisation (2,613) (4,462) (112) (7,187) Reversal (13,282) - - (13,282) Translation difference (7) (68) (2) (77) At 31 December 2011 10,557 18,673 1,795 31,025
For the years ended 31 December 2011 and 2010, interest costs attributable to the provisions and amounting to USD 5,425 thousand and USD 4,091 thousand respectively, were included in finance costs in the consolidated statement of comprehensive income (Note 28).
Provision for customers’ and other claims
Provision for customers’ and other claims represents provision for probable losses relating to customers’ quality claims and other litigations filed against the Group in the courts. Reversal, net of charge for the year ended 31 December 2011 was USD 9,627 thousand (charge, net of reversal in 2010 of USD 12,807 thousand), is included in customers` and other claims (charges) (Note 25) and other finance costs (Note 28) in the consolidated statement of comprehensive income.
As at 31 December 2011 and 2010, insurance coverage and other reimbursements against probable losses amounting to USD 7,700 thousand and USD 6,930 thousand, respectively, were recognised as an asset and included in other financial assets (Note 15) in the consolidated statement of financial position. For the years ended 31 December 2011 and 2010, increase in insurance coverage of USD 2,550 thousand and USD 2,430 thousand, respectively, was credited to customers’ and other claims (charges), net of reversals, in other operating income and expenses (Note 25) in the consolidated statement of comprehensive income. Refer to Note 33 for further details on the provision relating to litigations.
Defined benefit state pension plan
Production subsidiaries of the Group domiciled in Ukraine have a legal obligation to compensate the Ukrainian State Pension Fund for additional pensions paid to certain categories of the former and existing employees of the Group. Under the plan the Group’s employees who have qualifying working experience in health hazardous environment and thus eligible to early retirement are entitled to additional compensations financed by the Group and paid through the Ukrainian State Pension Fund. These obligations fall under definitions of a defined benefit plan.

INTERPIPE LIMITED NOTES TO THE CONSOLIDATED FINANCIAL STATEMENTS FOR THE YEAR ENDED 31 DECEMBER 2011 (in US dollars and in thousands)
43
The following tables summarise the components of benefit expense recognised in the consolidated statement of comprehensive income and the amounts recognised in the consolidated statement of financial position with respect to the plan. Benefit expense, with the exception of interest cost, is included in payroll and related expenses within costs of sales (Note 22). Interest cost is included in finance costs (Note 28).
Benefit expense For the year ended
31 December 2011 For the year ended 31 December 2010
Current service cost 2,743 1,645 Interest cost (Note 28) 5,250 3,954 Past service cost (6,540) 768 Curtailment (1,181) - Actuarial losses 1,424 75 1,696 6,442
Changes in the present value of the defined benefit state pension plan
For the year ended 31 December 2011
For the year ended 31 December 2010
Present value at the beginning of the year 42,633 25,026 Current service cost 2,743 1,645 Past service cost (11,501) - Interest cost (Note 28) 5,250 3,954 Payment (4,462) (3,847) Actuarial losses 10,790 15,868 Curtailment gains (2,094) - Translation difference - (13) Present value at the end of the year 43,359 42,633
Pension benefit liability
31 December 2011 31 December 2010 Present value of unfunded obligation 43,359 42,633 Unrecognised past service cost 578 (4,358) Unrecognised actuarial losses (25,213) (16,799) Translation difference (51) 31 18,673 21,507 Benefit liability – current (4,381) (3,603) Benefit liability – non-current 14,292 17,904
Experience adjustments
31 December 2011 31 December 2010 31 December 2009 31 December 2008 31 December 2007 Present value of unfunded obligation 43,359 42,633 25,026 25,883 35,798 Experience adjustments on plan liabilities (4,432) (4,368) 5,186 (6,265) (4,050)
Past service cost reversal as at 31 December 2011 resulted from certain changes in the Ukrainian pension legislation, which occurred during the reporting year and which provided for retrospective pension age increase for women, changes in calculation of remuneration and recalculation of pensions for working pensioners.
The Group’s best estimate of contributions expected to be paid to the plan during the year ending 31 December 2012 amounts to USD 4,954 thousand.

INTERPIPE LIMITED NOTES TO THE CONSOLIDATED FINANCIAL STATEMENTS FOR THE YEAR ENDED 31 DECEMBER 2011 (in US dollars and in thousands)
44
Retirement benefit plan
Some production subsidiaries of the Group domiciled in Ukraine have contractual commitments to pay certain lump-sum payments to the retiring employees with a long service period as well as certain other post retirement and employment benefits according to the collective agreements. The following tables summarise the components of benefit expense recognised in the consolidated statement of comprehensive income and the amounts recognised in the statement of financial position with respect to the plan. Benefit expense, with the exception to interest cost, is included in payroll and related expenses within cost of sales (Note 22) and general and administrative expenses (Note 24) as appropriate. Interest cost is included in the finance costs (Note 28).
Benefit expense For the year ended
31 December 2011 For the year ended 31 December 2010
Current service cost 68 38 Interest cost (Note 28) 175 137 Vested past service cost 438 10 Actuarial losses / (gains) 16 (20) 697 165
Changes in the present value of retirement benefit plan
For the year ended 31 December 2011
For the year ended 31 December 2010
Present value at the beginning of the year 1,463 855 Current service cost 68 38 Past service cost 1,140 - Interest cost (Note 28) 175 137 Payment (112) (115) Actuarial losses 122 547 Curtailment gains (17) - Translation difference (61) 1 Present value at the end of the year 2,778 1,463
Post-employment defined benefit liability
31 December 2011 31 December 2010
Present value of unfunded obligation 2,778 1,463 Unrecognised past service cost (728) - Unrecognised net actuarial losses (249) (249) Translation difference (5) (1)
1,796 1,213 Benefit liability – current (860) (408) Benefit liability – non-current 936 805
Experience adjustments
31 December 2011 31 December 2010 31 December 2009 31 December 2008 31 December 2007 Post-employment defined benefit liability 2,778 1,463 855 955 2,655
Experience adjustments on plan liabilities (125) (308) 160 796 (39)
The Group’s best estimate of contributions expected to be paid to the plan during the year ending 31 December 2012 amounts to USD 877 thousand.

INTERPIPE LIMITED NOTES TO THE CONSOLIDATED FINANCIAL STATEMENTS FOR THE YEAR ENDED 31 DECEMBER 2011 (in US dollars and in thousands)
45
Principal assumptions applicable to all plans
The principal assumptions used in determining defined benefit obligations for the Group’s defined benefit plans are shown below:
31 December 2011 31 December 2010 Annual discount rate 13.0% 13.0%
Annual salary increase rate 20.0% in 2012, 10.0% afterwards
15.0% in 2011, 10.0% afterwards
Annual pension increase rate 20.0% in 2012, 10.0% afterwards
15.0% in 2011, 10.0% afterwards
19. Trade and other accounts payable
Trade and other accounts payable consisted of the following:
31 December 2011 31 December 2010 Payables to suppliers 280,642 169,631 Interest payable 10,907 15,583 Dividends payable to non-controlling interest owners 827 2,705 Promissory notes payable 50 741 Other accounts payable 6,844 5,389 299,270 194,049
Trade accounts payable are non-interest bearing and are generally settled within a three-month term.
20. Taxes payable, other than income tax
Taxes payable, other than income tax consisted of the following:
31 December 2011 31 December 2010 Accrued and withheld taxes on payroll 1,545 1,296 Property tax payable 1,198 1,178 VAT payable 51 2,078 Miscellaneous other taxes payable 1,022 1,039 3,816 5,591
21. Advances and other current liabilities
Advances and other current liabilities consisted of the following:
31 December 2011 31 December 2010 Advances from customers 128,317 30,335 Short-term employee benefits 12,838 9,890 Other current liabilities 84 277 141,239 40,502

INTERPIPE LIMITED NOTES TO THE CONSOLIDATED FINANCIAL STATEMENTS FOR THE YEAR ENDED 31 DECEMBER 2011 (in US dollars and in thousands)
46
22. Cost of sales
Cost of sales consisted of the following:
For the year ended 31 December 2011
For the year ended 31 December 2010
Materials (951,687) (666,937) Energy and utilities (179,191) (134,676) Depreciation (87,970) (96,253) Payroll and related expenses (67,732) (64,023) Rolling tools and instruments (26,433) (26,304) Impairment of property, plant and equipment (Note 6) (15,617) - Repairs and maintenance (13,612) (16,467) Insurance expenses (4,266) (18,323) Reversal of write down / (Write down of inventories) to net realisable value 7,383 (9,801) Other (20,508) (21,427) (1,359,633) (1,054,211)
23. Selling and distribution expenses
Selling and distribution expenses consisted of the following:
For the year ended 31 December 2011
For the year ended 31 December 2010
Forwarding and transportation services (85,284) (59,326) Storage and packaging expenses (8,802) (8,174) Payroll and related expenses (6,400) (5,790) Custom services (2,450) (2,608) Sales agency fees (1,613) (3,183) Advertising and promotion (1,035) (619) Professional fees (623) (308) Insurance expense (579) (354) Depreciation (537) (754) Release / (charge) of accounts receivable impairment allowance (Note 12) 4,090 (4,973) Other (2,722) (2,369) (105,955) (88,458)
24. General and administrative expenses
General and administrative expenses consisted of the following:
For the year ended 31 December 2011
For the year ended 31 December 2010
Payroll and related expenses (31,356) (24,030) Professional fees (4,999) (5,373) Business trips and transportation (4,580) (3,889) Depreciation and amortisation (2,953) (3,194) Rent (1,934) (1,738) Insurance expense (1,659) (1,400) Communication (1,154) (1,106) Bank fees (1,023) (869) Taxes, other than income tax (575) (810) Repairs and maintenance (573) (625) Other (3,044) (2,348) (53,850) (45,382)
Auditors’ remuneration
Auditors’ remuneration for the year ended 31 December 2011 is included in professional fees above and comprises statutory audit fee for the audit of the consolidated financial statements of the Group and stand alone financial statements of the certain Group

INTERPIPE LIMITED NOTES TO THE CONSOLIDATED FINANCIAL STATEMENTS FOR THE YEAR ENDED 31 DECEMBER 2011 (in US dollars and in thousands)
47
entities of USD 804 thousand (2010: USD 728 thousand) as well as non-audit fees of USD 103 thousand (2010: USD 100 thousand).
25. Other operating income and expenses
Other operating income and expenses consisted of the following:
For the year ended 31 December 2011
For the year ended 31 December 2010
Gain on disposal of by-products 993 1,122 Gain / (Loss) on disposal of property, plant and equipment and intangible assets 959 (615)
Impairment of intangible assets (3,533) (3,015) Maintenance of social assets (1,941) (1,381) Impairment of other assets (1,852) (396) Impairment of prepayments and other accounts receivable (829) (653) Customers’ and other claims (charges), net of reversals (Note 18) 11,929 (11,216) Other gains / (losses) 34 (2,065) 5,760 (18,219)
26. Operating and non-operating foreign exchange difference
Foreign currency translation differences (FOREX) on monetary assets and liabilities consisted of the following;
For the year ended 31 December 2011
For the year ended 31 December 2010
Operating FOREX gains / (losses) originated on
trade accounts receivable (5,524) (447) trade accounts payable 5,526 1,739 other operating exchange difference 2,029 586 2,031 1,878
Non-operating FOREX gains / (losses) originated on
loans payable (4,671) 7,515 cash balances 1,578 (4,247) (3,093) 3,268
27. Finance income
Finance income consisted of the following:
For the year ended 31 December 2011
For the year ended 31 December 2010
Interest income 2,422 910 Change in fair value of derivative financial instruments - 239 Other finance income 332 251 2,754 1,400

INTERPIPE LIMITED NOTES TO THE CONSOLIDATED FINANCIAL STATEMENTS FOR THE YEAR ENDED 31 DECEMBER 2011 (in US dollars and in thousands)
48
28. Finance costs
Finance costs consisted of the following:
For the year ended 31 December 2011
For the year ended 31 December 2010
Interest expense relating to bank loans and bonds issued (50,537) (48,034) Insurance expenses (27,197) (11,504) Debt restructuring costs (7,620) (6,220) Defined benefit state pension plan interest costs (Note 18) (5,250) (3,954) Retirement benefit plan interest costs (Note 18) (175) (137) Other finance costs (4,737) (6,412) (95,516) (76,261)
29. Equity
Issued capital and capital distribution
The Group was formed in April – September 2006 through a series of transactions that ultimately resulted in the Company obtaining controlling ownership interest in the subsidiaries from entities which were under common control at the time of the above reorganisation. As part of the reorganisation all the shares of the Company have been transferred to and, since 2006 are ultimately held by a number of discretionary trusts established to operate the Group as well as certain other investments. Mr. Viktor Pinchuk, a citizen of Ukraine, and his family members are beneficiaries of these discretionary trusts. The trustees engaged to manage the trusts are professional, experienced and reputable trust management companies.
Ordinary shares authorised and issued and fully paid were as follows:
Shares USD thousand
At 1 January 2010 4,000,000,000 62,278 At 31 December 2010 4,000,000,000 62,278 Issued in December 2011 1,950,000 26 At 31 December 2011 4,001,950,000 62,304
In December 2011, the Company issued 1,950,000 additional ordinary shares of EUR 0.01 each (equivalent of USD 26 thousand) at a premium of EUR 25 each and a total premium of EUR 48,591 thousand, which is equivalent of USD 64,974 thousand. The shares of the Company are not listed.
Revaluation reserve
Revaluation reserve is used to record increases in the fair value of property, plant and equipment as well as decreases to the extent that such decreases relate to any prior increase on the same asset previously recognised in equity. Revaluation reserve is limited in respect of dividends distribution.
Foreign currency translation reserve
The foreign currency translation reserve is used to record exchange differences arising from the translation of the financial statements of foreign subsidiaries denominated in their respective functional currencies into the Group reporting currency.
Dividends payable by the Company and its subsidiaries
There were no dividends declared by the Company that should be paid to the shareholders for the years ended 31 December 2011 and 31 December 2010.
There were no dividends declared by the subsidiaries that should be paid for the years ended 31 December 2011 and 31 December 2010.

INTERPIPE LIMITED NOTES TO THE CONSOLIDATED FINANCIAL STATEMENTS FOR THE YEAR ENDED 31 DECEMBER 2011 (in US dollars and in thousands)
49
30. Business combinations
Acquisition of “Meta” LLC
In 2011, OJSC “Dnepropetrovsk Vtormet” acquired 99.9% of participatory interests in “Meta” LLC (“Meta”), a company based in Kharkiv and specialising in scrap metal collection. The Group acquired Meta in order to expand its regional metal scrap capacities.
The acquired business contributed revenues of USD 377 thousand and net loss of USD 62 thousand to the Group for the period from 1 October 2011 to 31 December 2011. If the acquisition had occurred on 1 January 2011, the Group’s revenue would have been USD 1,670,281 thousand, and profit after tax would have been USD 40,905 thousand.
The fair value of the identifiable assets and liabilities of Meta as at the date of acquisition were:
Provisional fair value recognised on
acquisition Property, plant and equipment 625 Cash and cash equivalents - Total assets 625 Net assets 625 Attributable to minority interest (1) Net assets acquired by the Group 624 Goodwill arising on acquisition (Note 8) - Total consideration 624
Meta did not report under IFRS prior to the acquisition by OJSC “Dnepropetrovsk Vtormet”. The total consideration payable amounts to USD 624 thousand. USD 327 thousand was paid in cash during the year and USD 297 thousand remains due and included into other accounts payable in the consolidated statement of financial position as at 31 December 2011.
Cash flow related to Meta acquisition was as follows:
Purchase consideration – Cash paid 327 Net cash acquired with the subsidiary - Net cash outflow 327

INTERPIPE LIMITED NOTES TO THE CONSOLIDATED FINANCIAL STATEMENTS FOR THE YEAR ENDED 31 DECEMBER 2011 (in US dollars and in thousands)
50
31. Principal subsidiaries
The Group included the following subsidiaries as at 31 December 2011 and 2010:
Effective ownership
Name of the company Country of incorporation Business activities
31 December 2011
31 December 2010
JSC “Interpipe Niznedneprovsky Tube Rolling Plant” Ukraine
Production of seamless and welded pipes and railway wheels
93.93% 93.93%
JSC “Interpipe Novomoskovsk Pipe-Production Plant” Ukraine Production of welded pipes 87.64% 87.64%
“Interpipe Niko Tube” LLC Ukraine Production of seamless pipes 99.93% 99.93%
“Metallurgical Plant Dneprosteel” LLC Ukraine Construction of electric arc furnace 100.00% 100.00%
“Dneprosteel-Energo” LLC Ukraine Construction of electric arc furnace 100.00% -
“Transkom - Dnepr” LLC Ukraine Transportation services 100.00% 100.00%
“Limestone factory” LLC Ukraine Production of limestone 93.93% 93.93%
Society "Dishware Novomoskovsk" Ltd Ukraine Production of dishware 87.64% 87.64%
OJSC “Dnepropetrovsk Vtormet” Ukraine Scrap metal processing 98.67% 98.67%
“Luganskiy Kombinat Vtormet” LLC Ukraine Scrap metal processing 98.67% 98.67%
“META” LLC Ukraine Scrap metal processing 98.67% -
“Research and development center “Quality” LLC Ukraine Research and development 100.00% 100.00%
“Interpipe Ukraine” LLC Ukraine Trading 100.00% 100.00%
“Interpipe Management” LLC Ukraine Management services 100.00% 100.00%
“Interpipe-M” LLC Russia Trading 100.00% 100.00%
“Interpipe Kazakhstan” LLC Kazakhstan Trading 100.00% 100.00%
“Interpipe Europe” LLC Switzerland Trading 100.00% 100.00%
“Klw-Wheelco” LLC Switzerland Trading 100.00% 100.00%
“North American Interpipe, Inc” United States Trading 100.00% 100.00%
“Interpipe Middle East” FZE with limited liability
United Arab Emirates Trading 100.00% 100.00%
Steel.One Limited Cyprus Subholding 100.00% 100.00%
Saleks Investments Limited Cyprus Subholding 100.00% 100.00%
In 2011, the Group established a new subsidiary “Dneprosteel-Energo” LLC, which procures and re-sells electricity for the EAF. The subsidiary was established to ensure compliance of the Group with the Ukrainian regulations and licensing requirements for the entities operating at the Ukrainian electric energy distribution market.

INTERPIPE LIMITED NOTES TO THE CONSOLIDATED FINANCIAL STATEMENTS FOR THE YEAR ENDED 31 DECEMBER 2011 (in US dollars and in thousands)
51
32. Related party transactions
The Group defines related parties in accordance with IAS 24 “Related Party Disclosures”. IAS 24 focuses significantly on the concept of “control” (including common control) and “significant influence” as primary methods of related party identification.
During 2011 and 2010, the Group’s transactions with its related parties comprised those with its associates (Note 8) and key management personnel.
Transactions with associates
The transactions of the Group with its associates are presented below:
For the year ended 31 December 2011
For the year ended 31 December 2010
Sales of the products and other commodities 11,513 3,718 Purchases of inventories, utilities and other services 22,620 10,075
Outstanding balances of the Group with its associates were as follows:
31 December 2011 31 December 2010
Amounts owed to the Group 7,180 4,126 Amounts owed by the Group 11,972 4,062
The significant part of the associates’ transactions is with the Group’s production entities.
Terms and conditions of transactions with associates
The sales to and purchases from associates are made at terms equivalent to those that prevail in arm’s length transactions. Outstanding balances at the year-end are unsecured, interest free and settlement occurs in cash. For the year ended 31 December 2011, the Group has recorded an impairment charge relating to receivables from the associates and amounting to USD 127 thousand (2010: nil). This assessment is undertaken each financial year through examining of the financial position of the associates and the market in which the associates operate.
Accounts payable to shareholders
As at 31 December 2011, accounts payable to shareholders, included in other accounts payable, amounted to USD 272 thousand, (2010: USD 278 thousand) were interest free and payable on demand.
Compensation to key management personnel
Key management personnel of the Group as at 31 December 2011 comprised:
• The members of the Board of Directors and some of their important professional assignments include:
Name Function
Gennady Gazin Non-Executive Director, Chairman of the Board of Directors of Interpipe Limited, Chief Executive Officer of EastOne Group
Olexandr Kirichko Chief Executive Officer of Interpipe Limited Andrii Dudnyk Non-Executive Director, Chief Financial Officer of EastOne Group
Vitaly Sadykov Independent Non-Executive Director, Chief Executive Officer of State Transportation Leasing Company
Jean Pierre Saltiel Independent Non-Executive Director, Co-Chairman of Ukrainian Economic Advisory Council of Yalta European Strategy
Ganna Khomenko Non-Executive Director, Fiduciana Trust (Cyprus) Limited
Michael Tsarev Non-Executive Director, Chief Operational Officer of EastOne Group
Yakiv Konstantynivs’ky Non-Executive Director, Director of the Dnipropetrovsk Affiliate of EastOne Group
• Senior Management of the Group as at 31 December 2011 and 2010 comprised seventeen persons (including the CEO who is also a member of the Board of Directors).

INTERPIPE LIMITED NOTES TO THE CONSOLIDATED FINANCIAL STATEMENTS FOR THE YEAR ENDED 31 DECEMBER 2011 (in US dollars and in thousands)
52
For the year ended 31 December 2011, total compensation, comprising short-term employee benefits, to the members of the Board of Directors amounted to USD 645 thousand (2010: USD 821 thousand) and to the members of Senior Management of the Group amounted to USD 5,048 thousand (2010: USD 4,511 thousand). The compensation was included in general and administrative expenses in the consolidated statement of comprehensive income.
In addition to the above no other incentives were attributable to the key management personnel of the Group.
33. Commitments, contingencies and operating risks
Operating environment
The Group has significant operations in Ukraine as well as in Russia and some other CIS countries, whose economies while deemed to be of market status continue to display certain characteristics consistent with those of an economy in transition. These characteristics include, but are not limited to low levels of liquidity in the capital markets, relatively high inflation and the existence of currency controls which cause the national currencies to be illiquid outside of these countries. These countries continue economic reforms and development of their legal, tax and regulatory frameworks as required by a market economy. The future stability of the economies is largely dependent upon the success of these reforms and the effectiveness of economic, financial and monetary measures undertaken by their governments. As a result, operations in Ukraine, Russia and other CIS countries involve risks that are not typical for developed markets.
The Ukrainian, Russian and other CIS economies are vulnerable to market downturns and economic slowdowns elsewhere in the world. The global financial crisis has resulted in a decline in the gross domestic product, devaluation of national currencies against major currencies, capital markets instability, and significant deterioration in the liquidity in the banking sector, tighter credit conditions within these countries. As discussed in Note 2 “Basis of Preparation”, these factors had already affected and may have a further effect on the Group’s consolidated financial position and results of operations.
Taxation
Ukrainian as well as Russian and other CIS countries’ legislations and regulations regarding taxation and other operational matters, including currency exchange control and custom regulations, continue to evolve. Legislation and regulations are not always clearly written and are subject to varying interpretations by local, regional and national authorities, and other governmental bodies. Instances of inconsistent interpretations are not unusual. Management believes that its interpretation of the relevant legislation is appropriate and that the Group has complied with all regulations, and paid or accrued all taxes and withholdings that are applicable. Where the risk of outflow of resources is probable, the Group has accrued tax liabilities based on management’s best estimate.
The uncertainty related to inconsistent enforcement and application of tax laws in these countries creates a risk of substantial additional tax liabilities and penalties being claimed by the tax authorities. Such claims, if sustained, could have a material effect on the Group’s financial position, results of operations and cash flows. Management believes that there are strong arguments to successfully defend any such challenge and does not believe that the risk is any more significant than those of similar enterprises operating in Ukraine, Russia or other CIS countries. When it is not considered probable that a material claim will arise, no provision has been established in these financial statements.
Management believes that the Group has sufficient basis to support its compliance with all regulations, and it is not likely that any significant settlement will arise from its interpretation and application of tax legislation and regulations.
Litigation
As at 31 December 2011 and 2010, North American Interpipe, Inc. and Interpipe Europe LLC were defendants in several litigations relating to quality claims from customers amounting to approximately USD 25,798 thousand and USD 23,472 thousand, respectively. Provision for probable adverse consequences of the above cases amounting to USD 9,700 thousand and USD 21,374 thousand was included in provision for customers’ and other claims in the consolidated statement of financial position as at 31 December 2011 and 2010, respectively (Note 18).
In addition to the specific cases mentioned above, in the ordinary course of business the Group is subject to legal actions and complaints. As at 31 December 2011 and 2010, provisions have been made in respect of these cases amounting to USD 857 thousand and USD 1,430 thousand, respectively. Management believes that the ultimate liability arising from such actions or complaints will not have a material adverse effect on the consolidated financial position or the results of future operations of the Group.

INTERPIPE LIMITED NOTES TO THE CONSOLIDATED FINANCIAL STATEMENTS FOR THE YEAR ENDED 31 DECEMBER 2011 (in US dollars and in thousands)
53
Lease of land
The Group has the right to permanent use of the land plots on which its Ukrainian production facilities are located, and pays land tax as assessed annually by the state based on the total area and use for which the land is zoned.
Contractual commitments for the acquisition of property, plant and equipment
During the year ended 31 December 2011, the Group continued to maintain a capital commitment under EUR 280,240 thousand (equivalent of approximately USD 361,201 thousand as at 31 December 2011) under a turn-key contract with a leading equipment supplier to construct the EAF with a production capacity of 1.32 million ton of billets annually. As at 31 December 2011 and 2010, unpaid capital commitments were EUR 38,268 thousand (or USD 49,324 thousand) and EUR 97,560 thousand (or USD 129,560 thousand) thousand, respectively (Note 6).
As at 31 December 2011 and 2010, the Group’s other contractual commitments for acquisition and modernisation of production equipment amounted to USD 25,622 thousand and USD 37,105 thousand, respectively.
34. Financial risk management
The Group’s principal financial instruments comprise trade receivables and payables, interest bearing loans due to banks, bonds issued, cash and cash equivalents. The main purpose of these financial instruments is to provide funding for the Group’s operations. The Group has various other financial assets and liabilities such as other receivables and other payables, which arise directly from its operations.
The Group also enters into derivative transactions, primarily forward currency contracts. The purpose is to manage currency risks arising from Group’s operations and its sources of finance.
The main risks arising from the Group’s financial instruments are foreign currency risk, liquidity risk, credit risk and interest rate risk. The policies for managing each of these risks are summarised below.
Foreign currency risk
The Group performs its operations mainly in the following currencies: the Ukrainian hryvnia (“UAH”), the US dollar (“USD”), the Euro (“EUR”), the Russian rouble (“RUB”) and the Kazakhstani tenge (“KZT”).
The exchange rates of USD to those currencies as set by the National Bank of Ukraine (“NBU”) as at the dates stated were as follows:
100 UAH 1 EUR 100 RUB 1000 KZT As at 21 May 2012 12.513 1.272 3.1392 6.7696 As at 31 December 2011 12.516 1.289 3.1231 6.7550 As at 31 December 2010 12.560 1.328 3.2812 6.7842
The Group sells its products to Russia, Europe, and other regions; purchases materials from other countries, mainly from Russia; and attracts substantial amounts of foreign currency denominated short-term and long term borrowings, and is, thus, exposed to foreign exchange risk. Foreign currency denominated trade receivables and payables, and borrowings give rise to foreign exchange exposure.
Currency risks as defined by IFRS 7 arise on account of financial instruments being denominated in a currency that is not the functional currency and being of a monetary nature; translation-related risks are not taken into consideration. Relevant risk variables are generally non-functional currencies in which the Group has financial instruments.

INTERPIPE LIMITED NOTES TO THE CONSOLIDATED FINANCIAL STATEMENTS FOR THE YEAR ENDED 31 DECEMBER 2011 (in US dollars and in thousands)
54
The following table demonstrates the sensitivity of the Group’s profit before tax to a reasonably possible change in the foreign currency exchange rate, with all other variables held constant:
For the year ended 31 December 2011 High / low limits of change
in currency exchange rate, % Effect on profit before tax USD/UAH +0% - EUR/UAH +0% - RUB/UAH +0% - USD/KZT +2% (177) EUR/USD +10% (2,356) USD/UAH -10% 77,438 EUR/UAH -15% (2,027) RUB/UAH -5% 173 USD/KZT -2% 177 EUR/USD -5% 1,178
For the year ended 31 December 2010 High / low limits of change
in currency exchange rate, % Effect on profit before tax USD/UAH +5% (17,819) EUR/UAH +5% (4,437) RUB/UAH +15% (2,174) USD/KZT +15% (1,636) EUR/USD +10% (404) USD/UAH -5% 17,819 EUR/UAH -10% 8,873 RUB/UAH +5% (725) USD/KZT +5% (545) EUR/USD -15% 606
Liquidity risk
The Group’s objective is to maintain continuity and flexibility of funding through the use of credit terms provided by suppliers and borrowings.
The Group analyses the ageing of its assets and the maturity of its liabilities and plans its liquidity depending on expected repayment of various instruments. In the case of insufficient or excessive liquidity in individual entities, the Group relocates resources and funds among the Group entities to achieve optimal financing of business needs of each entity.
The table below summarises the maturity profile of the Group’s financial liabilities based on contractual undiscounted payments.
As at 31 December 2011 Less than 3
months 3 to 12 months
1 to 5 years
More than 5 years Total
Borrowings and interest payable 70,551 132,895 684,742 410,205 1,298,393 Trade and other accounts payable 261,274 27,089 - - 288,363
331,825 159,984 684,742 410,205 1,586,756
As at 31 December 2010 Less than 3
months 3 to 12 months
1 to 5 years
More than 5 years Total
Borrowings and interest payable 907,196 - - - 907,196 Trade and other accounts payable 176,793 1,673 - - 178,466 1,083,989 1,673 - - 1,085,662
As at 31 December 2010, borrowings, which otherwise would be maturing in more than 12 months from the reporting date were reclassified into current loans as a result of the non-compliance with covenants, as it is required by IAS 1.74. Accordingly, no future interest was included in calculations of the maturity profile.
Credit risk
Financial instruments, which potentially subject the Group to significant concentrations of credit risk, consist principally of bank deposits (Note 15, 16), trade and other accounts receivable (Note 12).
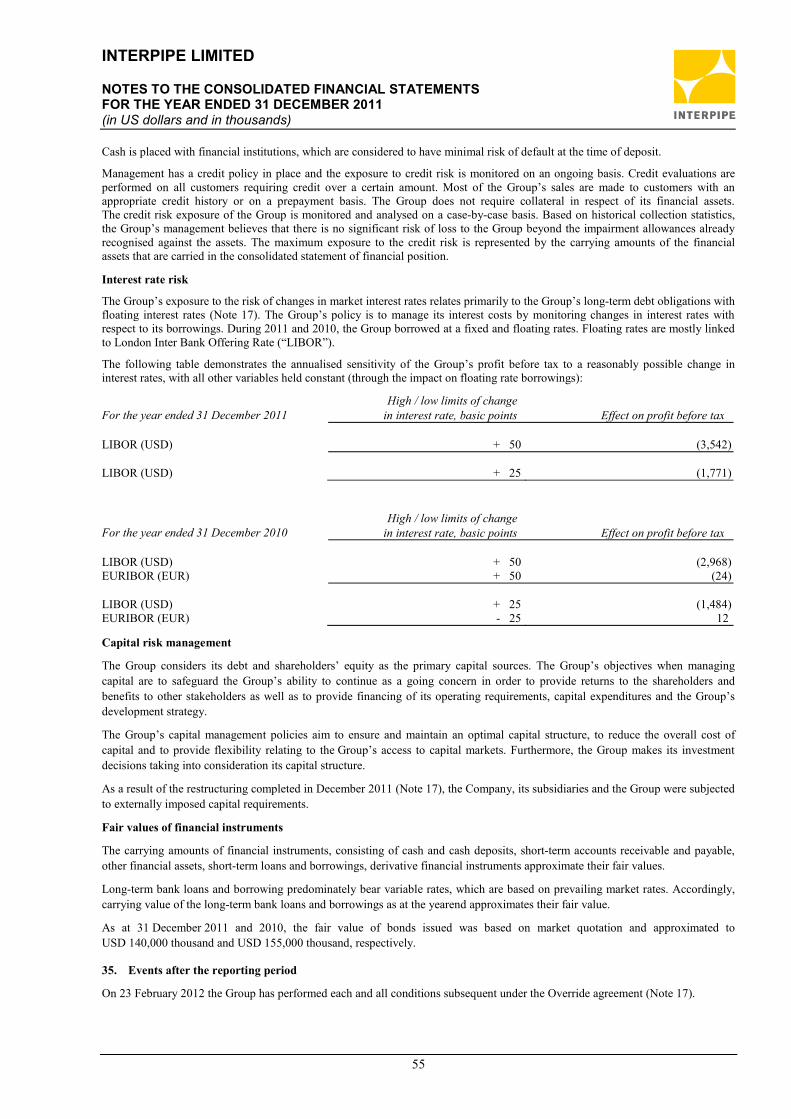
INTERPIPE LIMITED NOTES TO THE CONSOLIDATED FINANCIAL STATEMENTS FOR THE YEAR ENDED 31 DECEMBER 2011 (in US dollars and in thousands)
55
Cash is placed with financial institutions, which are considered to have minimal risk of default at the time of deposit.
Management has a credit policy in place and the exposure to credit risk is monitored on an ongoing basis. Credit evaluations are performed on all customers requiring credit over a certain amount. Most of the Group’s sales are made to customers with an appropriate credit history or on a prepayment basis. The Group does not require collateral in respect of its financial assets. The credit risk exposure of the Group is monitored and analysed on a case-by-case basis. Based on historical collection statistics, the Group’s management believes that there is no significant risk of loss to the Group beyond the impairment allowances already recognised against the assets. The maximum exposure to the credit risk is represented by the carrying amounts of the financial assets that are carried in the consolidated statement of financial position.
Interest rate risk
The Group’s exposure to the risk of changes in market interest rates relates primarily to the Group’s long-term debt obligations with floating interest rates (Note 17). The Group’s policy is to manage its interest costs by monitoring changes in interest rates with respect to its borrowings. During 2011 and 2010, the Group borrowed at a fixed and floating rates. Floating rates are mostly linked to London Inter Bank Offering Rate (“LIBOR”).
The following table demonstrates the annualised sensitivity of the Group’s profit before tax to a reasonably possible change in interest rates, with all other variables held constant (through the impact on floating rate borrowings):
For the year ended 31 December 2011 High / low limits of change
in interest rate, basic points Effect on profit before tax LIBOR (USD) + 50 (3,542) LIBOR (USD) + 25 (1,771)
For the year ended 31 December 2010 High / low limits of change
in interest rate, basic points Effect on profit before tax LIBOR (USD) + 50 (2,968) EURIBOR (EUR) + 50 (24) LIBOR (USD) + 25 (1,484) EURIBOR (EUR) - 25 12
Capital risk management
The Group considers its debt and shareholders’ equity as the primary capital sources. The Group’s objectives when managing capital are to safeguard the Group’s ability to continue as a going concern in order to provide returns to the shareholders and benefits to other stakeholders as well as to provide financing of its operating requirements, capital expenditures and the Group’s development strategy.
The Group’s capital management policies aim to ensure and maintain an optimal capital structure, to reduce the overall cost of capital and to provide flexibility relating to the Group’s access to capital markets. Furthermore, the Group makes its investment decisions taking into consideration its capital structure.
As a result of the restructuring completed in December 2011 (Note 17), the Company, its subsidiaries and the Group were subjected to externally imposed capital requirements.
Fair values of financial instruments
The carrying amounts of financial instruments, consisting of cash and cash deposits, short-term accounts receivable and payable, other financial assets, short-term loans and borrowings, derivative financial instruments approximate their fair values.
Long-term bank loans and borrowing predominately bear variable rates, which are based on prevailing market rates. Accordingly, carrying value of the long-term bank loans and borrowings as at the yearend approximates their fair value.
As at 31 December 2011 and 2010, the fair value of bonds issued was based on market quotation and approximated to USD 140,000 thousand and USD 155,000 thousand, respectively.
35. Events after the reporting period
On 23 February 2012 the Group has performed each and all conditions subsequent under the Override agreement (Note 17).