Interoperability Cost Analysis of the U.S. Automotive ... · Gregory Tassey, Ph.D. ... This...
93
RESEARCH TRIANGLE INSTITUTE 3040 Cornwallis Road • Post Office Box 12194 • Research Triangle Park, North Carolina 27709-2194 USA March 1999 Interoperability Cost Analysis of the U.S. Automotive Supply Chain Final Report Prepared for Gregory Tassey, Ph.D. National Institute of Standards and Technology Bldg. 101, Room A1013 Gaithersburg, MD 20899-1060 Prepared by Smita B. Brunnermeier Sheila A. Martin Research Triangle Institute Center for Economics Research Research Triangle Park, NC 27709 RTI Project Number 7007-03
-
Upload
truongtram -
Category
Documents
-
view
221 -
download
0
Transcript of Interoperability Cost Analysis of the U.S. Automotive ... · Gregory Tassey, Ph.D. ... This...
RESEARCH TRIANGLE INSTITUTE
3040 Cornwal l is Road • Post Of f ice Box 12194 • Research Tr iangle Park, Nor th Caro l ina 27709-2194 USA
March 1999
Interoperability Cost Analysis ofthe U.S. Automotive Supply Chain
Final Report
Prepared for
Gregory Tassey, Ph.D.National Institute of Standards and Technology
Bldg. 101, Room A1013Gaithersburg, MD 20899-1060
Prepared by
Smita B. BrunnermeierSheila A. Martin
Research Triangle InstituteCenter for Economics Research
Research Triangle Park, NC 27709
RTI Project Number 7007-03
RTI Project Number7007-03
Interoperability Cost Analysis ofthe U.S. Automotive Supply Chain
Final Report
March 1999
Prepared for
Gregory Tassey, Ph.D.National Institute of Standards and Technology
Bldg. 101, Room A1013Gaithersburg, MD 20899-1060
Prepared by
Smita B. BrunnermeierSheila A. Martin
Research Triangle InstituteCenter for Economics Research
Research Triangle Park, NC 27709

iii
Acknowledgments
We would like to acknowledge the assistance of contacts in the U.S.automotive supply chain who provided information for this study.We also received assistance from Dr. Thomas A. Phelps, of theEnvironmental Research Institute of Michigan; Dr. Gregory Tassey ofNIST; Dr. Simon Frechette of NIST; and Dr. James Fowler of NIST.

v
Contents
Executive Summary ES-1
1. Introduction 1-1
1.1 Background....................................................................... 1-3
1.2 Objectives ........................................................................ 1-5
1.3 Project Scope.................................................................... 1-6
1.4 Report Organization.......................................................... 1-7
2. The Automotive Supply Chain 2-1
2.1 The Anatomy of an Automobile......................................... 2-1
2.1.1 Automobile Platforms and Models ......................... 2-2
2.1.2 Production by Platform.......................................... 2-5
2.2 The Automobile Design and Development Process............ 2-9
2.2.1 Concept Design................................................... 2-10
2.2.2 Product Design.................................................... 2-12
2.2.3 Process or Factory Design.................................... 2-12
2.3 The U.S. Automotive Supply Chain ................................. 2-12
2.3.1 OEMs .................................................................. 2-14
2.3.2 First-Tier Suppliers............................................... 2-16
2.3.3 Subtier Suppliers.................................................. 2-17
2.3.4 Tooling Suppliers................................................. 2-17
3. Technical Issues in Product Data Exchange 3-1
3.1 Information Flow in the Automotive Supply Chain............. 3-1
3.1.1 Data Exchange Process .......................................... 3-2
3.1.2 Data Exchange Problems ....................................... 3-5

vi
3.1.3 Data Quality Issues................................................ 3-7
3.2 Potential Methods for Improving Interoperability ............... 3-8
3.2.1 Data Translation Methodologies ............................ 3-8
3.2.2 Improving Product Data Quality .......................... 3-15
3.2.3 Role of NIST........................................................ 3-16
4. Estimating Interoperability Costs 4-1
4.1 The Economic Impact of Imperfect Interoperability............ 4-1
4.1.1 Cost Drivers and Cost Categories ........................... 4-2
4.1.2 Impact Measures ................................................... 4-4
4.1.3 Quantifying Costs .................................................. 4-5
4.2 Data Collection Procedures............................................... 4-7
4.2.1 Sampling Plan ....................................................... 4-7
4.2.2 Survey Instruments ................................................ 4-9
4.2.3 Survey Implementation ........................................ 4-10
5. Cost Estimates 5-1
5.1 Interoperability Cost Estimates: The Cost ComponentApproach.......................................................................... 5-2
5.1.1 Avoidance Costs .................................................... 5-3
5.1.2 Mitigating Costs..................................................... 5-7
5.1.3 Delay Costs ........................................................... 5-8
5.2 Interoperability Cost Estimates: The Aggregate CostApproach.......................................................................... 5-9
5.2.1 Aggregate Interoperability Costs............................. 5-9
5.2.2 Aggregate Delay Costs ......................................... 5-10
5.3 Summary and Discussion ................................................ 5-10
6. Market Barriers and Roles for NIST 6-1
6.1 Market Failure in the Development of InteroperabilitySolutions........................................................................... 6-2
6.1.1 Nonappropriability of Benefits ............................... 6-3
6.1.2 Technical and Market Risk..................................... 6-3
6.1.3 Need for Unbiased Expertise.................................. 6-4
6.2 Potential Future Roles for NIST.......................................... 6-5
References R-1

vii
Figures
Figure 2-1 Structure of an Automobile ........................................................ 2-3
Figure 2-2 The Automobile Design and Development Process .................. 2-11
Figure 2-3 U.S. Automotive Supply Chain................................................. 2-14
Figure 3-1 Multiple CAD/CAM Systems Used in the Automobile SupplyChain ........................................................................................ 3-3
Figure 3-2 Generic Model of Data Exchange in the ProductDevelopment Process ................................................................ 3-4
Figure 3-3 General Motors’ STEP/IGES Translation Process Flow forWireframe and Surfaces ........................................................... 3-14
viii
Tables
Table 2-1 OEM Platforms in North American Production, 1997 ................. 2-6
Table 2-2 “Big Three” Production, Sales, and Employees: 1997 .............. 2-15
Table 2-3 Characteristics of Prominent Selected First-Tier Suppliers ......... 2-18
Table 2-4 Characteristics of Prominent Subtier Suppliers.......................... 2-19
Table 2-5 Characteristics of the Tool and Die Industry ............................. 2-20
Table 4-1 Interoperability Cost Drivers ...................................................... 4-3
Table 4-2 Metrics for Interoperability Costs................................................ 4-6
Table 5-1 Summary of Annual Interoperability Costs: Cost ComponentApproach................................................................................... 5-3
Table 5-2 Sources of Annual Avoidance Costs ........................................... 5-4
Table 5-3 Summary of Annual Interoperability Costs: Aggregate CostApproach................................................................................... 5-9

ES-1
Executive Summary
The National Institute for Standards and Technology (NIST) is theonly U.S. research laboratory or institute whose primary mission issupporting economic growth. As part of this mission, NISTprovides technical infrastructure to U.S.-based industries. NIST’sManufacturing Engineering Laboratory (MEL) providesmanufacturing infrastructure, technology, measurements, andstandards. MEL is currently involved in developing standards thatpromote interoperability among members of the U.S. automotivesupply chain.
The objective of this study was to assess the costs of imperfectinteroperability to the U.S. automotive supply chain and to describethe sources of these costs. By understanding the sources andmagnitude of inefficiencies caused by interoperability problems,NIST can better determine the potential impact of its programs andfocus them to maximize program effectiveness.
This study estimates that imperfect interoperability imposes at least$1 billion per year on the members of the U.S. automotive supplychain. By far, the greatest component of these costs is theresources devoted to repairing or reentering data files that are notusable for downstream applications. This estimate is conservativebecause we could not quantify all sources of interoperability costs.
ES.1 BACKGROUNDThe productivity and competitiveness of the U.S. domesticautomobile industry is important to the overall performance of theU.S. economy. The auto industry is responsible for about 9 percentof the total value of manufactured goods in the U.S. and 4 percent
Interoperability is theability to communicateproduct data acrossdifferent productionactivities. It is essential tothe productivity andcompetitiveness of manyindustries because efficientdesign and manufacturingrequire the coordination ofmany different participantsand processes that rely ona digital representation ofthe product.
Interoperability Cost Analysis of the U.S. Automotive Supply Chain
ES-2
of manufacturing employment (U.S. Department of Commerce,1998). U.S. consumers spend about 5 percent of total personalexpenditures on motor vehicles and parts (BEA, 1998). The motorvehicle industry is also a major end-user for many materials.
A number of characteristics and trends in the auto industry haveelevated the importance of interoperability to the productivity andcompetitiveness of the industry. In an attempt to protect marketshare from imports, the U.S. auto industry began in the 1970s toimplement a number of practices designed to improve theindustry’s productivity and competitiveness. These practicesinclude concurrent engineering and other lean manufacturingmethods as well as outsourcing a greater share of design anddevelopment to suppliers. These methods have significantlyreduced lead times and have narrowed the productivity gapbetween the U.S. industry and its competitors.
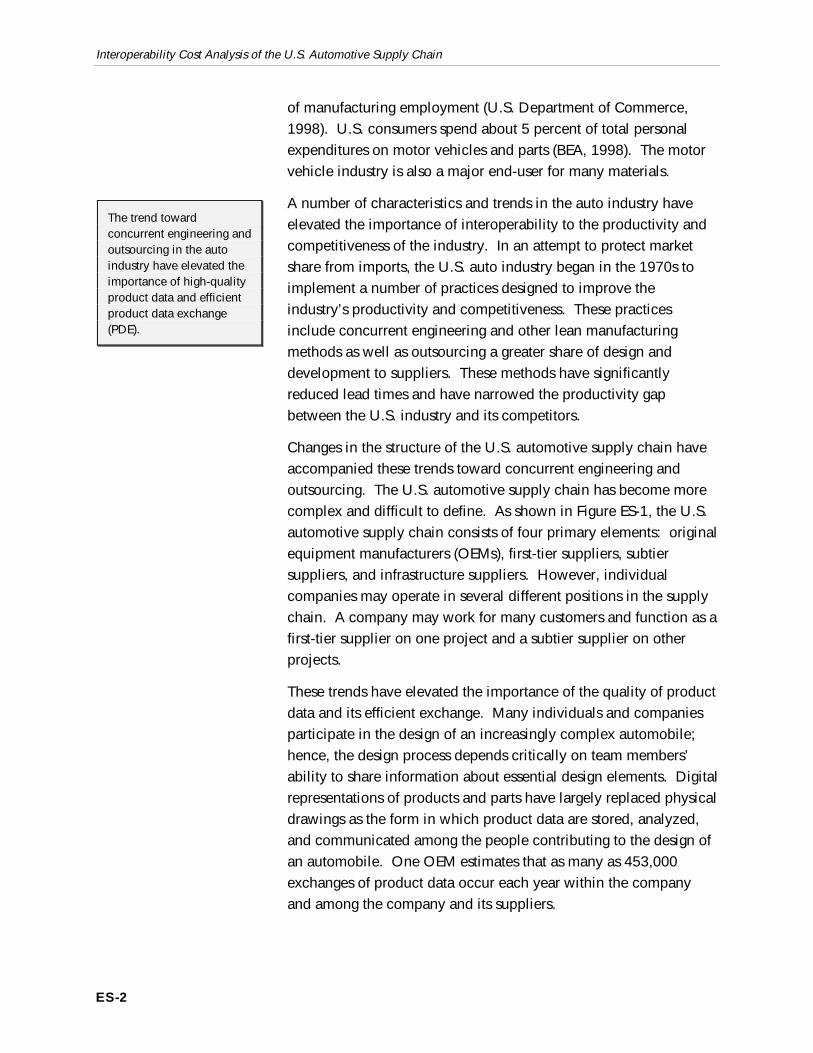
Changes in the structure of the U.S. automotive supply chain haveaccompanied these trends toward concurrent engineering andoutsourcing. The U.S. automotive supply chain has become morecomplex and difficult to define. As shown in Figure ES-1, the U.S.automotive supply chain consists of four primary elements: originalequipment manufacturers (OEMs), first-tier suppliers, subtiersuppliers, and infrastructure suppliers. However, individualcompanies may operate in several different positions in the supplychain. A company may work for many customers and function as afirst-tier supplier on one project and a subtier supplier on otherprojects.
These trends have elevated the importance of the quality of productdata and its efficient exchange. Many individuals and companiesparticipate in the design of an increasingly complex automobile;hence, the design process depends critically on team members’ability to share information about essential design elements. Digitalrepresentations of products and parts have largely replaced physicaldrawings as the form in which product data are stored, analyzed,and communicated among the people contributing to the design ofan automobile. One OEM estimates that as many as 453,000exchanges of product data occur each year within the companyand among the company and its suppliers.
The trend towardconcurrent engineering andoutsourcing in the autoindustry have elevated theimportance of high-qualityproduct data and efficientproduct data exchange(PDE).

Executive Summary
ES-3
Figure ES-1. U.S. Automotive Supply ChainThe complexity of the U.S. automotive supply chain compounds the industry’s interoperability problems.
Original Equipment Manufacturers� highly concentrated� “Big Three” (Chrysler, Ford, and GM)
First Tier� hundreds of companies� some large and some small
Subtier� thousands of companies� mostly small
InfrastructureSuppliers
A number of problems arise when design data generated for onepurpose are shared with other members of an automotive designteam. Many different software and hardware systems are usedthroughout the automotive supply chain. These systems differ notonly among companies but also among different functions within acompany. Because each system has its own proprietary datarepresentation, product data are created and stored in multiple,incompatible formats, which makes exchanging these data difficult.Resulting data files may contain errors, may be incomplete, or maybe formatted in a way that makes them unusable for downstreamapplications.
Members of the auto industry generally acknowledge that imperfectinteroperability is an important and expensive problem. A numberof potential solutions have been developed over the years. Theseinclude
➤ standardization on a single system for each OEM and itssuppliers and sharing of files in native format,
➤ development of point-to-point translators, and
➤ development of neutral format translators (Doty, 1994).
None of the solutions that have been widely used in the past havebeen successful at significantly reducing these problems. Single-system standardization forces suppliers to maintain redundantsystems and does not eliminate interoperability problems. Point-to-
Interoperability Cost Analysis of the U.S. Automotive Supply Chain
ES-4
point translators work reasonably well for some well-defined datatranslation tasks, but each combination of sending and receivingsystems requires a different translator. Neutral format translatorssuch as IGES and DXF have been very successful in some limitedapplications, but they have a number of weaknesses.
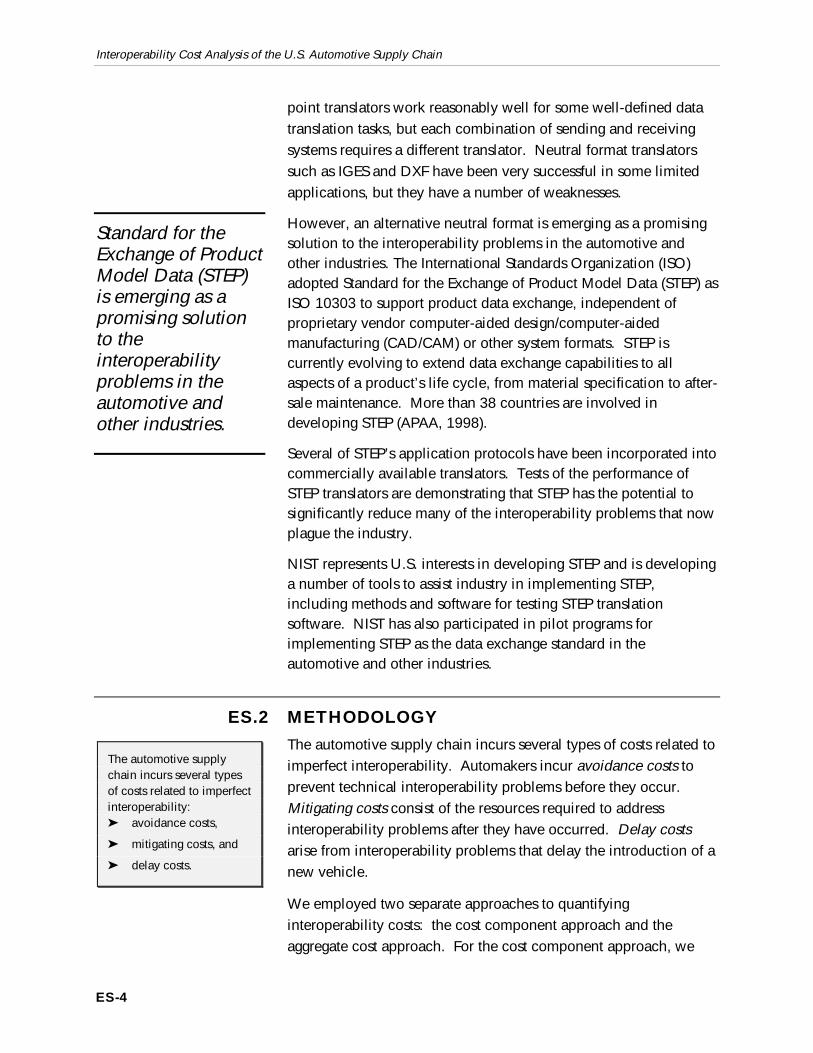
However, an alternative neutral format is emerging as a promisingsolution to the interoperability problems in the automotive andother industries. The International Standards Organization (ISO)adopted Standard for the Exchange of Product Model Data (STEP) asISO 10303 to support product data exchange, independent ofproprietary vendor computer-aided design/computer-aidedmanufacturing (CAD/CAM) or other system formats. STEP iscurrently evolving to extend data exchange capabilities to allaspects of a product’s life cycle, from material specification to after-sale maintenance. More than 38 countries are involved indeveloping STEP (APAA, 1998).
Several of STEP’s application protocols have been incorporated intocommercially available translators. Tests of the performance ofSTEP translators are demonstrating that STEP has the potential tosignificantly reduce many of the interoperability problems that nowplague the industry.
NIST represents U.S. interests in developing STEP and is developinga number of tools to assist industry in implementing STEP,including methods and software for testing STEP translationsoftware. NIST has also participated in pilot programs forimplementing STEP as the data exchange standard in theautomotive and other industries.
ES.2 METHODOLOGYThe automotive supply chain incurs several types of costs related toimperfect interoperability. Automakers incur avoidance costs toprevent technical interoperability problems before they occur.Mitigating costs consist of the resources required to addressinteroperability problems after they have occurred. Delay costsarise from interoperability problems that delay the introduction of anew vehicle.
We employed two separate approaches to quantifyinginteroperability costs: the cost component approach and theaggregate cost approach. For the cost component approach, we
Standard for theExchange of ProductModel Data (STEP)is emerging as apromising solutionto theinteroperabilityproblems in theautomotive andother industries.
The automotive supplychain incurs several typesof costs related to imperfectinteroperability:Z avoidance costs,
Z mitigating costs, and
Z delay costs.
Executive Summary
ES-5
identified many sources of avoidance and mitigating costs andasked industry executives to identify the labor, capital, andmaterials devoted to addressing each of these problems separately.We also asked executives to estimate the cycle time delay causedby interoperability problems and developed a cost estimateassociated with this delay. We summed these components of costto arrive at an estimate of the total interoperability costs in theindustry. This approach provided insight regarding the primarysources of interoperability costs.
Using the aggregate cost approach, we interviewed key industryexecutives about interoperability cost issues and to ask them toconsider the scope of all interoperability problems in theircompany. We asked them to provide an estimate of totalinteroperability costs. We added cycle time delay costs to thisestimate. This method allowed the respondents to consider costcomponents that we may not have considered. It also provided amethod for checking the consistency of the responses.
Our results are based on interviews with representatives of tencompanies: two of the “Big Three” auto OEMs, five suppliers, andthree tooling companies. To add qualitative information from aslightly different perspective, we also discussed interoperabilityissues with one company that manufactures auto-relatedequipment.
ES.3 RESULTSSolving interoperability problems can significantly reduce costs forthe U.S. automotive supply chain. Using the two differentapproaches described above, this study estimates that imperfectinteroperability imposes at least $1 billion dollars per year on themembers of the U.S. automotive supply chain. The majority ofthese costs are attributable to the time and resources spentcorrecting and recreating data files that are not usable by thosereceiving the files. These estimates are conservative because theydo not include elements of cost that our industry contacts could notquantify.
Table ES-1 shows our estimates using both the cost componentapproach and the aggregate cost approach. The estimates differ by
Imperfectinteroperabilityimposes at least $1billion dollars peryear on themembers of the U.S.automotive supplychain.

Interoperability Cost Analysis of the U.S. Automotive Supply Chain
ES-6
Source of CostTotal Cost
($Thousands) Percent of Cost
Cost Component Approach
Avoidance cost 52,799 5
Mitigating costs 907,645 86
Delay cost 90,000 9
Total 1,050,444 100
Aggregate Cost Approach
Interoperability cost 925,602 91
Delay cost 90,000 9
Total 1,015,602 100
only 3 percent. The similarity of these estimates provides someassurance that the respondents to our survey were consistent withrespect to their answers and provides evidence that the estimatesare credible.
We consider this estimate of interoperability costs of the U.S.automotive supply chain to be conservative. The project’s scope,time and resource constraints, and data limitations prevented usfrom quantifying several sources of interoperability costs. Theseinclude the following:
Z Post-manufacturing interoperability costs. We consideredonly the interoperability costs involved in the design andmanufacture of automobiles. Interoperability problems alsooccur during other phases of the product life cycle,including marketing, after-market product support, and costanalysis.
Z Interoperability costs of small suppliers. Because ofconstraints on project time and resources, we quantifiedinteroperability costs to the OEMs, large suppliers, andtooling suppliers. However, smaller suppliers may alsoincur some costs.
Z In-house investments in interoperability solutions. Becauseof the unavailability of data, we were unable to quantify allof the industry’s investments in the development ofinteroperability solutions. These investments may besubstantial. For example, GM’s investment in its STEPTranslator Center is not included in our estimates.
Table ES-1. Summary ofInteroperability CostsTwo approaches to estimatinginteroperability costs lead tosimilar estimates.
Executive Summary
ES-7
Z Costs to consumers resulting from delays. Interoperabilityproblems delay the introduction of new and redesignedautos. Our estimates do not include consumers’ welfarelosses resulting from delays in the availability of new andimproved products.
Z Loss of market share resulting from delays. Wehypothesized that the U.S. auto industry could suffer a lossof market share resulting from interoperability delays, whichcould lead to a loss of profits to the industry. We were notable to quantify these lost profits.
Industry has been slow to act on its own to invest in the mostpromising solutions to these costly interoperability problems.Despite industrywide agreement that a neutral format such as STEPholds the best potential solution to interoperability problems(McEwan, 1995), STEP has not been universally adopted by theindustry. A number of issues have hampered industry’scommitment to STEP, including
➤ the significant investment required to develop a solutionthat will benefit all members of the industry;
➤ the technical risk associated with developing STEPtranslators;
➤ the market risk caused by competitive rivalries among thecompanies that develop CAD/CAM software and translators;and
➤ the need for an unbiased expert to negotiate, develop, andimplement industry standards.
NIST can address many of these issues to advance the developmentof STEP translators, to hasten the adoption of STEP by industry, andto improve the value of STEP to the U.S. economy. By assisting inthe development of STEP as an industry standard, NIST reduces theuncertainty and risk associated with industry’s investment in STEP.NIST’s activities in developing conformance testing practices helpsto improve the quality of the STEP software, further reducing thetechnical risk to both the software industry and the auto industry.By helping to demonstrate the benefits of STEP through programssuch as the AutoSTEP pilot program, NIST helps to reduceindustry’s perceived technical risk associated with investments inSTEP. Finally, by continuing to participate in the development ofSTEP’s application protocols and implementation prototypes, NISTlends expertise and credibility to the STEP development processand improves the process of standards implementation.
NIST’s STEPactivities canimprove the value ofSTEP to the U.S.economy.

Interoperability Cost Analysis of the U.S. Automotive Supply Chain
ES-8
The resources NIST invests in participating in these activities benefitthe entire U.S. automotive supply chain by reducing costs,improving cycle time, and strengthening the competitiveness of theindustry. U.S. consumers also benefit because cost savings arepassed on and new models become available more quickly.
1-1
1 Introduction
The productivity and competitiveness of the U.S. domesticautomobile industry is important to the overall performance of theU.S. economy. Motor vehicles and equipment account for about9 percent of the total value of manufactured goods in the U.S. and4 percent of manufacturing employment (U.S. Department ofCommerce, 1998). In 1997, U.S. personal consumptionexpenditures on motor vehicles and parts were over $250 billion,comprising about 5 percent of total personal consumptionexpenditures (BEA, 1998). Furthermore, the motor vehicle industryis a major end user for many key materials such as alloy steel,aluminum, and synthetic rubber and therefore creates a deriveddemand for additional economic activity (Womack, 1989).
During the 1960s, 1970s, and 1980s the U.S. automobile industrystruggled as its domestic market share fell and the import share ofthe U.S. automobile market rose from less than 1 percent in 1955to over 30 percent in 1987 (Womack, 1989). As the industrysearched for explanations for the decline, analysts argued that theindustry’s production techniques were outdated (Womack, Jones,and Roos, 1990) and that its market strategies were not in tune withthe rapidly changing motor vehicle market (Womack, 1989). As aresult, U.S. automakers took longer to develop a new automobileand used more engineering hours in the product developmentprocess than their Japanese counterparts.
The U.S. auto industry has made significant improvements in thelast decade. By increasing their use of concurrent engineering andother lean manufacturing methods and by delegating a greater
Interoperability Cost Analysis of the U.S. Automotive Supply Chain
1-2
share of design and development to their suppliers, the averagelead time for a new auto platform has fallen from about 5 years inthe mid-1980s (Womack, 1989) to about 2 to 3 years today(Buckholz, 1996; Brooke, 1998; Jost, 1998; Martin, 1998). U.S.automakers have also made significant progress toward closing theproductivity gap with their competitors (Automotive News, 1997b).
Although concurrent engineering and design outsourcing haveimproved the competitiveness of the industry, these practices havealso magnified the importance of efficient product data exchange(PDE). The responsibility for the design of an automobile and thefactory that produces it is now distributed among many companies;thus, product data must be shared among a greater number ofpeople and organizations, both concurrently and sequentially. Thisincreased level of PDE implies that interoperability�the ability tocommunicate product data across different production activities�isessential to the productivity and competitiveness of the industry.
As the number of data exchanges increases, the costs of imperfectinteroperability mount. U.S. automakers and their suppliers incurcosts to maintain multiple computer-aided design (CAD)/computer-aided manufacturing (CAM) systems, to repair files that aretranslated incorrectly, to manually reenter data that cannot betranslated, and to scrap designs and tooling that are defectivebecause of imperfect interoperability.
Today, the U.S. automobile industry spends $2 to $3 billiondeveloping a new automobile or truck platform.1,2 With as manyas 12 major platform redesigns and eight minor redesigns per year,3
even a small percentage decrease in the cost of designing anautomobile and its factory can lead to significant savings. Thesesavings could be distributed among consumers, who would enjoylower prices and earlier innovations in automobile designs, and the
1A platform is the basic mechanical structure of the vehicle. Several car models
can share the same platform.2The 1999 GM Chevy Silverado cost about $3 billion for vehicle and factory
development while Chrysler’s new Jeep Grand Cherokee cost about$2.65 billion (Greenwald, 1998). Ford’s Focus cost between $2 to 3 billion(Sorge, 1998), and the Chrysler LH Concorde and Intrepid redesigns cost about$2.1 billion (Jost, 1998).
3Research Triangle Institute (RTI) developed these estimates of the average numberof platforms undergoing major and minor redesign from an IRN, Inc., report onplans for model year new product programs for 1996 to 2003 (IRN, 1997).
Concurrent engineeringand design outsourcinghave magnified theimportance of efficient PDEand system interoperability.
Section 1 — Introduction
1-3
U.S. auto industry, which would incur fewer costs and capture alarger market share.
The National Institute of Standards and Technology (NIST) isassisting the auto industry in the development of solutions tointeroperability problems. As the only U.S. federal researchlaboratory or institute whose primary mission is supportingeconomic growth, NIST provides technical infrastructure to U.S.-based industries. NIST is making a number of contributions toadvancing interoperability in the U.S. automotive supply chain,including participation in the development and diffusion of a PDEstandard.
The broad, economywide portfolio of technologies supported byNIST’s infratechnologies creates a strategic planning challenge forNIST. In response, NIST requires economic assessments oftechnologies, industries, and market structure to
➤ project or document the returns from its laboratory researchprograms and
➤ provide information that it can use to improve the selectionand management of its portfolio of projects.
This study furthers NIST’s objectives for economic analysis byexamining the cost of interoperability problems in the U.S.automotive supply chain. By understanding the sources andmagnitude of inefficiencies caused by interoperability problems,NIST can better determine the potential impact of its programs andfocus them to maximize their effectiveness.
1.1 BACKGROUNDIn the process of designing and manufacturing an automobile,many individuals and organizations exchange product data. Thedesign and manufacturing process involves many divisions withinthe original equipment manufacturer (OEM), many first-tiersuppliers, a number of second-tier and subtier suppliers, andtooling suppliers. This exchange of data supports the process ofconcurrent engineering and design, allowing these organizations towork together to improve the performance and manufacturability ofa product and to advance the competitiveness of the industry.
The number of people, organizations, and functions involved inproducing an automobile increases the complexity of the data

Interoperability Cost Analysis of the U.S. Automotive Supply Chain
1-4
exchange process. Digital representations of products and partshave largely replaced physical drawings as the form in whichproduct data are stored, analyzed, and communicated among thepeople contributing to the design of an automobile. Many differentsoftware and hardware systems are used throughout the automotivesupply chain. Not only do these systems differ between companiesbut they also differ among different functions within a company.Each system has its own proprietary data representation. As aresult, product data are created and stored in multiple,incompatible formats. These incompatible formats cause imperfectinteroperability among the parties involved in exchanging productdata.
Imperfect interoperability imposes costs on the industry due tohigher costs of design and production and slower implementationof design changes. The OEMs have tried to improveinteroperability, in part, by mandating specific software systems fortheir suppliers. These mandates sometimes impose significantcosts, especially for suppliers that must maintain multiple systemsto satisfy the demands of multiple customers. The systems areexpensive to purchase and to learn. Data translators, anotherpotential interoperability solution, currently have limitedcapabilities and can cause data translation errors.
An alternative neutral format for data translation is emerging as apromising solution to the interoperability problems in theautomotive and other industries. The International StandardsOrganization (ISO) adopted Standard for the Exchange of ProductModel Data (STEP) as ISO 10303 to support product data exchange,independent of proprietary vendor CAD/CAM or other systemformats. STEP is currently evolving to extend data exchangecapabilities to all aspects of a product’s life cycle, from materialspecification to after-sale maintenance. More than 38 countries areinvolved in the development of STEP (APAA, 1998).
NIST has been involved in developing the infratechnologiesrequired to improve interoperability in the auto industry and otherindustries. NIST is playing a key coordinating role in ISO’sdevelopment of STEP, is supporting conformance andimplementation testing, and is developing modularizationinfrastructural technologies. These activities help the private sectorintegrate STEP into commercial software. To maximize the
Imperfectinteroperabilityimposes costs on theautomobile industrydue to higher costsof design andproduction andslowerimplementation ofdesign changes.
NIST is participating in thedevelopment of PDEstandards, tools, andpractices that help theprivate sector integratethose standards intocommercial software.

Section 1 — Introduction
1-5
effectiveness of its efforts and to develop an idea of the potentialbenefits of this work, NIST needs to better understand themagnitude and sources of the costs of this problem to the U.S. autoindustry.
1.2 OBJECTIVESThe objective of this study is to estimate the cost of imperfectinteroperability to the U.S. automotive supply chain and to describethe sources of those costs. While industry personnel generallyagree that interoperability is an important and expensive problem,there is no comprehensive estimate of just how much this problemcosts the industry. Even though a few case studies have beenconducted of the economic impact of selected elements of cost(e.g., the Industrial Technology Institute [ITI] study of the cost ofduplicate software [Fleischer, Nicholas, and Phelps, 1997]), theproblem has not been examined in its entirety.
This study’s focus is slightly different than typical studies of theeconomic impact of NIST laboratory programs. Most studies of thistype (e.g., Leech and Link, 1995; Link, 1995) involve retrospectiveanalyses of NIST programs that have contributed to thedevelopment of specific infratechnologies. This study is differentbecause it is a prospective analysis of the potential benefits of aNIST program to address interoperability issues.
NIST also anticipates that the methods developed for this study willbe useful in analyzing interoperability problems in other industries.Many industries face interoperability challenges similar to those ofthe auto industry. Although the auto industry is unique in someways, the concepts, procedures, and some of the findings from thisstudy will be applicable to other industries, such as aircraft andshipbuilding, in which concurrent engineering is becoming animportant part of the competitiveness strategy.
This difference in focus reflects NIST’s dual uses for the results ofthis study. By providing a rich characterization as well as anestimate of the magnitude of the cost of interoperability problems,the results of this study will contribute directly to NIST’s strategicplanning in the area of interoperability. This study will also providethe first step in analyzing the potential impact of NIST’sinteroperability programs for the U.S. automotive industry. The
The concepts,procedures, andsome of the findingsfrom this study willbe applicable toother industries,such as aircraft andshipbuilding, inwhich concurrentengineering isbecoming animportant part of thecompetitivenessstrategy.
Interoperability Cost Analysis of the U.S. Automotive Supply Chain
1-6
total cost of imperfect interoperability provides an upper-boundestimate of the potential benefits of solving this problem andtherefore an estimate of the maximum potential impact of NIST’scontributions to solving the problem. This information can be usedlater in a retrospective study of the impact of NIST’s interoperabilityprograms.
With this information, NIST can assess how the costs ofinteroperability can be alleviated by addressing a variety ofconditions that add to the cost of these problems. These conditionsinclude the following:
➤ maintenance of redundant CAD/CAM systems;
➤ maintenance of multiple point-to-point translation software;
➤ manual reentry of digital data when translators are notavailable;
➤ errors in translation that are detected and eitherreattempted, repaired, or manually reentered;
➤ undetected translation errors that cause problems later inthe design and manufacturing process; and
➤ delays due to translation problems that affect productdevelopment schedules.
By showing how the overall costs to the industry are driven bythese factors, NIST will be able to focus on the conditions causingthe greatest cost to the industry.
1.3 PROJECT SCOPEThis study addresses interoperability between engineering systemsthat exchange product data within the U.S. automotive supplychain. Product data include the geometry, topology, relationships,tolerances, attributes, and features necessary to completely define acomponent part or an assembly of parts for the purposes of design,analysis, manufacture, inspection, and product support. This studycovers only the front end of the automobile’s product life cycle.That is, it does not address interoperability problems beyondproduct manufacturing. Thus, this study addresses
➤ interoperability between all engineering applications in thedesign-to-manufacture life cycle,
➤ interoperability within as well as across companies,
➤ data translation issues as well as data quality issues,
The term product datadenotes the totality of dataelements which completelydefine the product for allapplications over itsexpected life cycle (Smith,1989).

Section 1 — Introduction
1-7
➤ interoperability problems that occur across differentsoftware applications as well as within the same softwareapplication, and
➤ instances in which product data must be manually enteredinto a software program because no interoperability existsbetween the receiving software and other software thatalready has the product data.
In practice, disentangling the effects of interoperability problemsdue to data quality problems from the impact of data translationissues is very difficult. Both of these problems have importanteffects on the cost of designing and manufacturing an automobile.Thus, rather than trying to address these issues separately, weexplored the cost of both kinds of interoperability issues.
1.4 REPORT ORGANIZATIONSection 2 provides background information on the auto industry.This information illustrates why imperfect interoperability canimpose significant costs to the auto industry and consumers.Section 3 describes the technical problems that cause imperfectinteroperability in the auto industry and discusses how theseproblems might be avoided. Section 4 describes how imperfectinteroperability affects costs and profits of members of the U.S.automotive supply chain as well as consumer benefits. It alsodiscusses the development of metrics of technical and economicimpact and our procedures for collecting the data required toconstruct these metrics. Section 5 presents our analysis of primaryand secondary data sources and provides our estimate of the cost ofimperfect interoperability to the U.S. automotive industry and itsconsumers. Section 6 discusses market barriers to the adoption ofinteroperability solutions and explains how NIST can assist industryin overcoming those barriers.

2-1
The Automotive2 Supply Chain
The design and production of an automobile require interactionand coordination among many functions and industry participants.An automobile consists of a large number of components, parts,and accessories that must function together as an integrated unit.Consequently, the design and development process is alsocomplex, requiring a number of iterations among the design stepsfor different vehicle components. To further complicate theprocess, these components are typically designed andmanufactured by many companies that are part of a complexsupply chain. These companies must somehow coordinate theiractivities to ensure that the components they design andmanufacture are compatible with other components.
The complexity described in this section suggests the importance ofefficient and accurate product data exchange (PDE).Interoperability issues in the automotive industry are importantbecause the complexity of the product, the design process, and theindustry magnifies the impact of interoperability problems whileobscuring their solution. This section describes the complexityleading to the importance of interoperability issues and whyinteroperability issues have become an important factor in thecompetitiveness of the automobile industry.
2.1 THE ANATOMY OF AN AUTOMOBILEThe structure of an automobile is extremely complex. A typicalmotor vehicle consists of approximately 15,000 parts andaccessories that must be designed to be compatible. As shown in
Interoperabilityissues in theautomotive industryare importantbecause thecomplexity of theproduct, the designprocess, and theindustry magnifiesthe impact ofinteroperabilityproblems whileobscuring theirsolution.

Interoperability Cost Analysis of the U.S. Automotive Supply Chain
2-2
Figure 2-1, an automobile comprises several major systems, each ofwhich contains many subsystems, components, and interfacingparts. For example, parts such as bearings, crankshafts, filters,gears, pistons, pumps, and valve trains make up the engine, andtheir design must be compatible. Similarly, other systems, such asaxles, suspensions, transmissions, bodies, seats, and instrumentpanels, consist of many parts that must work together. Designersmust coordinate these systems to enable the successful finalassembly of the vehicle.
2.1.1 Automobile Platforms and Models
Most motor vehicles are designed and built under the platformconcept. A platform is typically defined as the basic mechanicalstructure of a vehicle. Different vehicles based on the sameplatform commonly share several structural elements, such as thefloor plan and door pillar (Automotive News, 1997a). Typically,automakers offer several car models per platform. For example, theChevrolet Lumina, Chevrolet Monte Carlo, Pontiac Grand Prix,Buick Regal, and Buick Century all share the same platform. Inaddition, these cars may be offered in several body styles, such as atwo-door coupe, four-door sedan, and four-door hatchback.
The platform concept is becoming increasingly important asautomakers seek to reduce costs by designing and producing morevehicles from common platforms. The number of platforms is animportant measure of annual design and engineering effort of eachcompany. Models built on common platforms carry over a largepercentage of parts and production processes, and the engineeringand tooling for the vehicle’s basic structure account for the majorityof total product development and launch costs (Womack, 1989).Thus, the potential savings from using an existing platform for anew model are considerable. Ford estimates that when theydevelop a new model on an existing platform, development andengineering costs fall by 15 to 20 percent (Automotive NewsEurope, 1997). Other automakers estimate even higher savings.
Most automakers are now pursuing a strategy of reducing thenumber of platforms but increasing their flexibility and the numberof models that can be developed from each platform. The strategy
Automakers are increasingthe flexibility of theirplatforms to reducedevelopment andengineering costs and tospeed the introduction ofnew models.

Section 2 — The Automotive Supply Chain
2-3
Figure 2-1. Structure of an AutomobileAn automobile consists of several major systems; each system contains a number of components and parts.
Automobile
Electronic Systems and Components
1. connectors2. engine management systems3. optical cable, multiplexing4. printed circuit boards5. semiconductors, diodes, transistors
Engine and Components
1. blocks, heads2. camshafts, crankshafts3. connecting rods4. cylinder liners5. diesel engines6. emission equipment7. engine bearings8. exhaust components9. filers (air, fuel, oil)10. fuel additives11. fuel system and components12. gaskets, seals, packings13. gasoline engines14. intake components15. intercoolers16. pistons and rings17. pumps, tubing, hoses, fittings18. timing chains, gears, and belts19. turbo and superchargers20. valve covers, oil pans21. valvetrain and components
Exterior
1. body parts2. bumpers and parts3. exterior trim4. lighting5. locks, latches, hinges6. mirrors7. stampings8. sunroofs/convertible tops9. wiper blades and arms
Fasteners and Adhesives
1. adhesives2. clamps3. mechanical fasteners4. tape
Hydraulic andPneumatic Systems
1. air compressors2. hydraulic cylinders3. pumps (nonsteering)4. tubing, hoses, fittings5. valves and controls
Steering and Components
1. linkage, hoses, boots2. pumps3. steering columns4. steering gears5. steering racks
Suspension and Components
1. brushings and bearings2. castings/forgings/stampings3. dampers4. springs5. tires6. wheels
Transmission and Components
1. clutches, valves, and components2. gears and linkages3. housings4. manual and automatic transmissions5. torque converters6. transaxles7. transfer cases8. transmission bearings
Axles and Components Brakes and Components
1. axles/differentials/transfer cases2. bearings3. cv and u-joints4. drive shafts5. torsion traction systems6. viscous couplings
1. ABS components2. master cylinders, calipers3. pads, shoes4. rotors, drums5. wheel cylinders, hoses, tubing
Cooling Systems andComponents
1. fans, clutches2. heat exchangers3. hoses, belts4. radiators5. thermostats
Electrical Systems and Components
1. alternators, generators2. anti-theft systems and components3. audio systems and components4. batteries and parts5. collision warning systems6. switches, fuses, circuit breakers7. fuel systems and components8. heating, ventilation, A/C, and components9. horns, alarms, emergency equipment10. ignition systems and components11. instrument clusters and components12. lighting systems and components13. motors and components14. on board radar systems15. relays and regulators16. sensors and actuators17. solenoids18. starters19. wiring20. cruise control
Interior
1. airbags and components2. cables3. carpeting/floor mats4. door systems and trim5. headliners6. instrument panels, consoles7. interior trim8. linkages9. mirrors10. seat belts11. seats and components12. window systems
Source: constructed from data available from Chilton Company. 1997. “Automotive Industries Annual Source Guide.” Available at <http://ai.chilton.net>.
Section 2 — The Automotive Supply Chain
2-5
allows automakers to offer consumers model variety while reducingdesign and development costs.
At the same time, the definition of a platform is changing. Aplatform once included the floor plan architecture, sometimes evenwith fixed door openings and front and rear window frames.Lately, the definition of a platform is much broader, allowing fordifferences in wheelbase and even width (Automotive NewsEurope, 1997). This broader definition allows automakers to designand build a greater variety of models on the same platform.
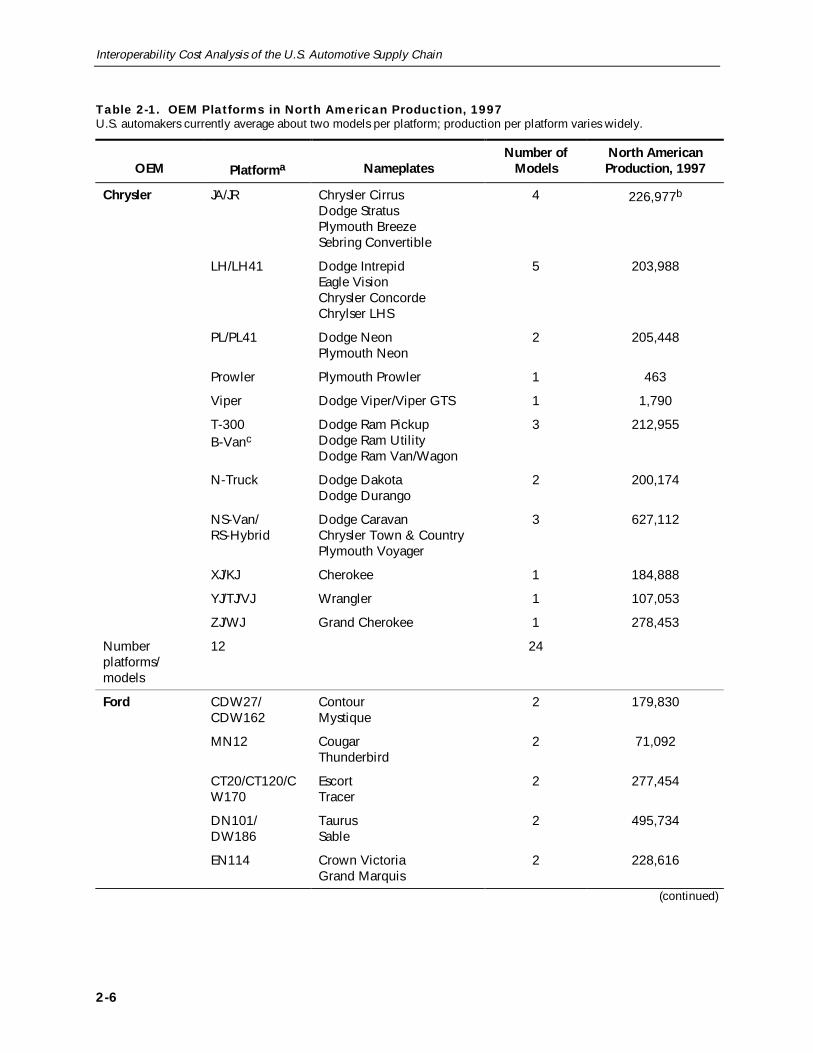
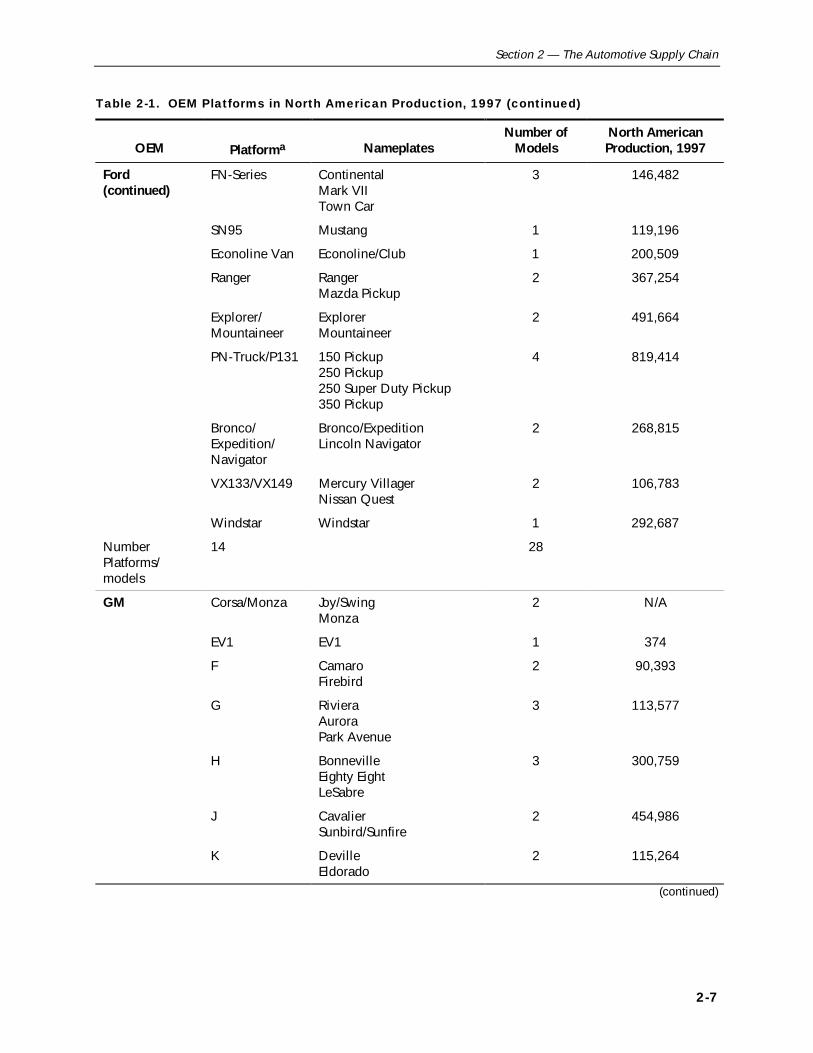
Table 2-1 lists the platforms used in North American production bythe U.S. original equipment manufacturers (OEMs) in 1997 (IRN,1997). This classification uses a somewhat narrow definition of aplatform. The average number of models per platform is about two.However, the number of models for each platform varies greatly,and this number should rise as the OEMs pursue their strategy offewer platforms with greater flexibility.
2.1.2 Production by Platform
Maximizing unit production and sales per platform is an importantindustry strategy for decreasing design and development costs overthe next decade (Auto and Auto Parts, January 9, 1997). Table 2-1lists the U.S. and Canadian production of the most populargroupings of U.S. OEM platforms for the 1997 calendar years.1 Themost popular platform grouping, Chevy S/K pickups and utilities,has production of over 1 million per year, while some of the lesspopular platform groupings have production of only 100,000 peryear or less.
Industry’s current strategy of consolidating on fewer, more flexibleplatforms is a response to an opposite longer-term trend. Over thepast 20 years, the unit sales per platform have declined for the U.S.OEMs. In addition, more frequent model renewals are required tokeep pace with faster changes in style and taste. An analysis of theOEM plans for major and minor redesigns (IRN, 1997) shows that,using the definition of platform provided in Table 2-1, an average of12 platforms undergo major redesigns and eight undergo minorrevisions in an average model year.
1Because the definition of a platform is changing, statistics on production per
platform are inconsistent over time.
Interoperability Cost Analysis of the U.S. Automotive Supply Chain
2-6
Table 2-1. OEM Platforms in North American Production, 1997U.S. automakers currently average about two models per platform; production per platform varies widely.
OEM Platforma NameplatesNumber of
ModelsNorth AmericanProduction, 1997
Chrysler JA/JR Chrysler CirrusDodge StratusPlymouth BreezeSebring Convertible
4 226,977b
LH/LH41 Dodge IntrepidEagle VisionChrysler ConcordeChrylser LHS
5 203,988
PL/PL41 Dodge NeonPlymouth Neon
2 205,448
Prowler Plymouth Prowler 1 463
Viper Dodge Viper/Viper GTS 1 1,790
T-300B-Vanc
Dodge Ram PickupDodge Ram UtilityDodge Ram Van/Wagon
3 212,955
N-Truck Dodge DakotaDodge Durango
2 200,174
NS-Van/RS-Hybrid
Dodge CaravanChrysler Town & CountryPlymouth Voyager
3 627,112
XJ/KJ Cherokee 1 184,888
YJ/TJ/VJ Wrangler 1 107,053
ZJ/WJ Grand Cherokee 1 278,453
Numberplatforms/models
12 24
Ford CDW27/CDW162
ContourMystique
2 179,830
MN12 CougarThunderbird
2 71,092
CT20/CT120/CW170
EscortTracer
2 277,454
DN101/DW186
TaurusSable
2 495,734
EN114 Crown VictoriaGrand Marquis
2 228,616
(continued)
Section 2 — The Automotive Supply Chain
2-7
Table 2-1. OEM Platforms in North American Production, 1997 (continued)
OEM Platforma NameplatesNumber of
ModelsNorth AmericanProduction, 1997
Ford(continued)
FN-Series ContinentalMark VIITown Car
3 146,482
SN95 Mustang 1 119,196
Econoline Van Econoline/Club 1 200,509
Ranger RangerMazda Pickup
2 367,254
Explorer/Mountaineer
ExplorerMountaineer
2 491,664
PN-Truck/P131 150 Pickup250 Pickup250 Super Duty Pickup350 Pickup
4 819,414
Bronco/Expedition/Navigator
Bronco/ExpeditionLincoln Navigator
2 268,815
VX133/VX149 Mercury VillagerNissan Quest
2 106,783
Windstar Windstar 1 292,687
NumberPlatforms/models
14 28
GM Corsa/Monza Joy/SwingMonza
2 N/A
EV1 EV1 1 374
F CamaroFirebird
2 90,393
G RivieraAuroraPark Avenue
3 113,577
H BonnevilleEighty EightLeSabre
3 300,759
J CavalierSunbird/Sunfire
2 454,986
K DevilleEldorado
2 115,264
(continued)

Interoperability Cost Analysis of the U.S. Automotive Supply Chain
2-8
Table 2-1. OEM Platforms in North American Production, 1997 (continued)
OEM Platforma NameplatesNumber of
ModelsNorth AmericanProduction, 1997
GM (continued) N/GMX130 Grand AmAchieva/AleroSkylark
3 345,980
P90 MalibuCutlass
2 273,449
Saturn SaturnSaturn LS
2 271,471
W Chevy LuminaChevy Monte CarloPontiac Grand PrixPontiac Cutlass SupremeOlds IntrigueBuick RegalBuick Century
7 739,446
Y Corvette 1 24,673APV/U-Van Lumina/Venture
Trans SportSilhouetteOpel/Vauxhall Sintra
4 222,483d
C/K PickupsC/K Utilitiesc
PickupSierraTahoeYukon/DenaliChevy SuburbanGMC Suburban
6 1,125,755
G-Vans Chevy Van/ExpressGMC Savana
2 128,285
M-Vans AstroSafari
2 170,804
S-PickupsS-Utilitiesc
S-10 PickupSanomaHombreBlazerJimmy/EnvoyBravada
6 596,428
Numberplatforms/models
19 50
aThe definition of a platform is subject to some discretion. The definitions used in the generation of these numbers maydiffer slightly from definitions used in other sources.
bProduction numbers do not include Sebring Convertible.cCounted as two distinct platforms by some definitions and in our count of the number of platforms; however, separate
production statistics were not available.dDoes not include opel.
Sources: IRN, Inc. December 1997. “Product Life Cycles.” Grand Rapids, MI.Automotive News. 1998a. 1998 Market Data Book. Detroit: Marketing Services Inc.

Section 2 — The Automotive Supply Chain
2-9
2.2 THE AUTOMOBILE DESIGN ANDDEVELOPMENT PROCESSAutomotive design and development in the U.S. have changedsignificantly over the last few decades. These changes havecontributed to its complexity while simultaneously shorteningautomobile development timelines and improving product quality.Prior to these changes, U.S. automakers considered newautomobile development a linear process that took 5 or more yearsto complete. Automakers proceeded sequentially from conceptdesign through product design, product engineering, andcomponent sourcing to final assembly (Womack, 1989).
U.S. automakers were compelled to rethink this linear approach tothe vehicle development process in the face of stiff competitionfrom Japanese automakers. In the 1980s, Japanese auto companiescompleted the automotive design process, from initial conceptionto delivery to consumers, in 43 months, on average; their U.S.counterparts took 63 months (Womack, 1989). Thus, Japaneseautomakers were able to introduce novel design changes that metcustomer demand more quickly and at less expense, whichaccounted, at least in part, for their rising market share.
Concurrent engineering, which integrates design, manufacturing,and support processes to provide early manufacturing input into thedesign process, is a fairly recent phenomenon in the U.S.automotive industry. The design of the GMC CK pickup in theearly 1970s marked the first time in the U.S. auto industry thatmanufacturing engineers formally worked with design engineers.This early effort at concurrent engineering was very successful andled eventually to its further acceptance in the auto industry. By theearly 1980s, Chrysler had formed its Manufacturing FeasibilityGroup (MFG).2 The MFG worked under the philosophy that one-third to one-half of quality problems stemmed from poor design andthat by integrating manufacturing and design engineering theseproblems could be reduced much more cheaply than they could ifdiscovered later in the process. An important result of concurrentengineering was a reduction in the number of operations requiredto manufacture many parts. This translated into less equipment
2This analysis was conducted prior to the merger of Chrysler Corporation with
Daimler-Benz. We refer throughout this report to market data and activities ofChrysler, rather than the combined company, Daimler Chrysler AG.
Recent changes in theautomotive design anddevelopment process haveshortened cycle time andreduced engineering costswhile elevating theimportance ofinteroperability.
Interoperability Cost Analysis of the U.S. Automotive Supply Chain
2-10
(and the required capital expenditure), fewer breakdowns, lessdowntime, and a shorter time to market (Dauch, 1993).
As a result of these efforts, lead times for U.S. automakers havebeen falling since the mid-1980s and continue to fall. Buchholz(1996) reports that Chrysler’s average lead time was 54 months in1987 and was about 29 months in 1996. The recently introducedDodge Durango was developed in 23 months; the shorter lead timewas attributable to heavy borrowing from the Dakota pickup(Brooke, 1998). The new Concorde and Intrepid redesigns tookabout 31 months (Jost, 1998). GM has recently reported that itscycle time has fallen from 36 months in 1995 to about 24 monthstoday (Martin, 1998).
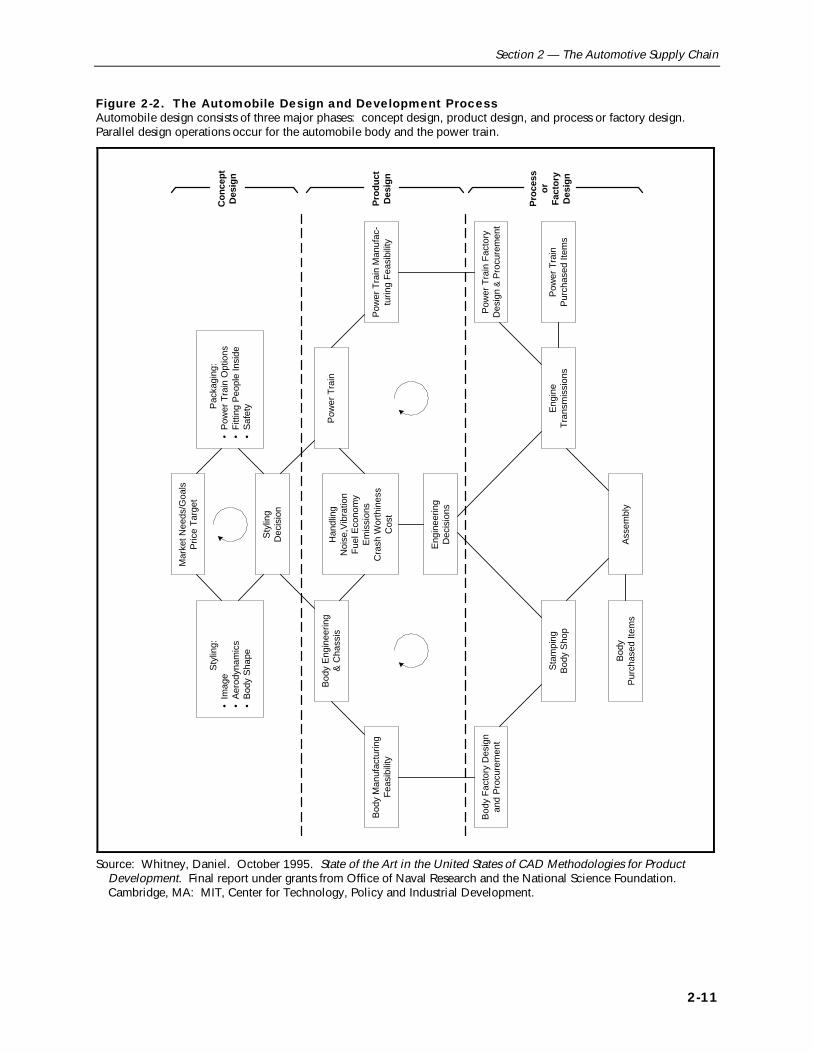
The revised vehicle development process, as described by Whitney(1995) and illustrated in Figure 2-2, includes three phases: conceptdesign, product design, and process or factory design. Thedevelopment process is no longer linear; concurrent design andengineering require multiple iterations between phases and amongactivities within each phase.
Feedback loops, which are illustrated in Figure 2-2 by the circulararrows, require an efficient exchange of information within andbetween phases. Interoperability problems can interrupt thisprocess causing delays and increasing cost.
2.2.1 Concept Design
Before designing a new product, automakers survey the market’sneeds. If the automakers identify a niche or need, they considerwhether they can generate a suitable design at a competitive pricethat will meet the demands of the target market. They develop theconcept by preparing computer or clay models. The styling processdetermines the body shape, image, and aerodynamics of thevehicle. Engineers analyze space claims and conduct interferencechecking in a simultaneous process called packaging to ensure thatall passengers and components fit inside the vehicle’s exterior.Decisionmakers also select the power train options at this stage.
The current automobiledevelopment processinvolves concurrent designand an iterative processthat requires an efficientexchange of informationamong processes.
Section 2 — The Automotive Supply Chain
2-11
Figure 2-2. The Automobile Design and Development ProcessAutomobile design consists of three major phases: concept design, product design, and process or factory design.Parallel design operations occur for the automobile body and the power train.
Mar
ket N
eeds
/Goa
lsP
rice
Tar
get
Han
dlin
gN
oise
,Vib
ratio
nF
uel E
cono
my
Em
issi
ons
Cra
sh W
orth
ines
sC
ost
Sty
ling
Dec
isio
n
Sty
ling:
• Im
age
• A
erod
ynam
ics
• B
ody
Sha
pe
Pac
kagi
ng:
• P
ower
Tra
in O
ptio
ns•
Fitt
ing
Peo
ple
Insi
de•
Saf
ety
Bod
y E
ngin
eerin
g&
Cha
ssis
Pow
er T
rain
Eng
inee
ring
Dec
isio
ns
Bod
y M
anuf
actu
ring
Fea
sibi
lity
Bod
y F
acto
ry D
esig
nan
d P
rocu
rem
ent
Sta
mpi
ngB
ody
Sho
p
Pow
er T
rain
Man
ufac
-tu
ring
Fea
sibi
lity
Pow
er T
rain
Fac
tory
Des
ign
& P
rocu
rem
ent
Eng
ine
Tra
nsm
issi
ons
Pow
er T
rain
Pur
chas
ed It
ems
Bod
yP
urch
ased
Item
sA
ssem
bly
Pro
cess
orF
acto
ryD
esig
n
Pro
duct
Des
ign
Con
cept
Des
ign
Source: Whitney, Daniel. October 1995. State of the Art in the United States of CAD Methodologies for ProductDevelopment. Final report under grants from Office of Naval Research and the National Science Foundation.Cambridge, MA: MIT, Center for Technology, Policy and Industrial Development.

Interoperability Cost Analysis of the U.S. Automotive Supply Chain
2-12
2.2.2 Product Design
Once company decisionmakers have approved the concept andstyling, engineers begin building and testing a prototypeautomobile. Engineers must develop detailed part and componentspecifications for the vehicle’s body and its power train. Bodyengineers design about 20 exterior panels and 300 to 400 interiorpanels of various sizes. Simultaneously, power train engineersselect or design the power train and determine how to arrange itscomponents under the hood. They conduct packaging checks toensure that there are no rival space claims and that everything fitsas intended. Engineers also test the crash worthiness of theprototype and its noise-vibration-harshness (NVH) at this stage.
2.2.3 Process or Factory Design
As the product design progresses, the automaker proceeds withproduction procurement and design decisions for the body andpower train parts. The degree of design activity conducted bysuppliers varies along a continuum. At one extreme, supplierssimply manufacture parts based on the specifications and designsprovided by the automaker. At the other extreme, the supplier isresponsible for the component or system design, responding only tohigh-level specifications from the OEM. Efficient PDE is veryimportant because data transfers are routinely made along thesupply chain.
In parallel, a factory and process are designed for the parts that willbe produced in-house. The plant floor layout is determined, andtooling and fixtures are designed or procured. The major segmentsof the factory are power train, body shop, and final assembly.
2.3 THE U.S. AUTOMOTIVE SUPPLY CHAINThe U.S. automotive supply chain is not easy to characterize. Anautomobile consists of so many components that the sheer size ofthe industry is overwhelming. Manufacturing employment in theindustry was 772,000, or about 4 percent of all manufacturingemployment, in 1996. Shipments of autos and auto equipmentamounted to $329 billion in 1996, or approximately 9 percent ofthe value of all manufactured goods (U.S. Department ofCommerce, 1998).
Body design and powertrain design proceed inconcurrent timelines thatmeet during analysis ofhandling, noise, vibration,fuel economy, crashworthiness, and cost.

Section 2 — The Automotive Supply Chain
2-13
Further complicating an analysis of the automotive supply chain isthe complexity of the relationships between customers andsuppliers. OEMs design and produce only some of the 15,000 partsand accessories that make up an automobile; they procure othersfrom first-tier suppliers. The first-tier suppliers can in turnoutsource to subtier suppliers. A company’s position in the supplychain may differ depending on the part and the customer. Thus, acompany that is a first-tier supplier of transmissions to one OEMmay be a subtier supplier of other parts to the same or other OEMs.Furthermore, these companies, especially the subtier suppliers,often supply parts to customers outside the auto industry.
Production infrastructure, such as hardware, tooling, robots, andsoftware, is also an important part of the supply chain (Fine andWhitney, 1996). The supply chain in the automobile market,therefore, comprises a long, dynamic, and complex network thatinvolves the OEMs, first-tier suppliers, subtier suppliers, andcompanies that provide infrastructure.
Finally, the relationships among the customers and suppliers arechanging over time as competitive pressures force changes on theindustry. In response to Japanese competition, U.S. automakers arereducing the time it takes to develop a concept into a final productby adopting the philosophies of core competence and concurrentdesign. The adoption of these philosophies is forcing significantchanges in the relationships between the OEMs and their suppliers(Flynn et al., 1996).
All of these factors complicate the task of clearly identifying anddescribing the different components of the automotive supplychain. Analysts have proposed two competing characterizations ofthe supply chain. The first identifies a company’s position in thesupply chain based on its customers. If a company directly suppliesthe OEMs, it is a first-tier supplier; a subtier company supplies thefirst tier, and so on. However, this definition is difficult tooperationalize in today’s business scenario because a supplier cansimultaneously serve multiple customers. As noted earlier, thesame company can act as a first-tier supplier on one project and asubtier supplier on another project.
An alternative characterization identifies a company’s position inthe supply chain based on its products and its role in production.
Characterization andanalysis of the U.S.automotive supply chainare difficult because ofZ the complexity of the
product,
Z the size of theindustry,
Z the complexity of therelationships betweencustomers andsuppliers, and
Z continuous changes inthe relationshipsbetween customersand suppliers.
We can characterize theU.S. automotive supplychain in terms of eachcompany’s customers or interms of its products and itsrole in production. In thisreport, we use the firstmethod to characterize theindustry.

Interoperability Cost Analysis of the U.S. Automotive Supply Chain
2-14
The first-tier suppliers are responsible for integrating systems, whilethe subtier supplies modules or subsets of systems, and the nextsubtier contributes components and basic material (Phelan, 1997;Flynn et al., 1996).
Despite the limitations of both characterizations, it is useful tochoose one to facilitate a discussion of the industry’s structure. Weuse the first method for characterizing the industry. Figure 2-3provides a simplified view of the overall industry structure. TheOEM market is highly concentrated: a few large firms dominate themarket. The first-tier market is more competitive. There arehundreds of first-tier suppliers, some of which are very large withsales of billions of dollars. The subtier market is even morecompetitive and consists of thousands of smaller companies inaddition to a few large companies. Some first-tier suppliers alsooperate on the subtier by either vertically integrating or bysupplying parts to their rivals on the first tier. Infrastructuresuppliers often supply software, hardware, tooling, and robots to alllevels of the supply chain. Some of the major players at each levelof the automobile supply chain are characterized below.
Figure 2-3. U.S. Automotive Supply ChainThe U.S. automotive industry is less concentrated and more competitive in downstream segments of the supply chain.
Original Equipment Manufacturers� highly concentrated� “Big Three” (Chrysler, Ford, and GM)
First Tier� hundreds of companies� some large and some small
Subtier� thousands of companies� mostly small
InfrastructureSuppliers
2.3.1 OEMs
The “Big Three”—Chrysler Corporation, Ford Motor Company, andGeneral Motors Corporation (GM)—are the major U.S. auto OEMs.
This study focuses on themembers of the U.S.automotive supply chainthat are most seriouslyaffected by imperfectinteroperability—theOEMs; the first-tiersuppliers, the subtiersuppliers, and the toolingsuppliers.

Section 2 — The Automotive Supply Chain
2-15
As illustrated in Table 2-2, the three OEMs produced over 12 millioncars and light trucks in 1997 in North America. They generated over$378 billion in total revenue and employed over one million peoplein 1997.
Table 2-2. “Big Three” Production, Sales, and Employees: 1997GM is the largest U.S. OEM in terms of production, sales, and employees.
OEM
1997 NorthAmerican
Production (Carsand Light Trucks)
1997 Revenue fromManufacturing
($million)1997 Total Revenue
($million)a
1997 Number ofEmployees(persons)
Chrysler 2,688,054 56,986 61,147 121,000
Ford 4,395,520 122,935 153,627 363,892
GMb 5,454,180 153,683 178,174 608,000
Total 12,537,754 333,604 392,948 1,092,892
aIncludes revenue from financial services, insurance, and other revenue.bGM statistics includes sales and employment of Delphi Automotive, which is no longer part of GM. To avoid double
counting, we have not included Delphi Automotive’s sales in the OEM revenue for purposes of extrapolation.
Sources: Hoover’s Inc. 1998. Hoover’s Company Capsules. Austin, TX: Hoover’s Inc.Ward’s Communications. 1997. Ward’s Automotive Yearbook. 59th Edition. Detroit: Ward’s Communications.Automotive News. 1998a. 1998 Market Data Book. Detroit: Marketing Services Inc.Ford Motor Co. March 18, 1998. Annual Report on Form 10K for years ended December 31, 1997. EdgarDatabase. <http://www.sec.gov/Archives/edgar/data/37996/0000037996-98-000014.txt>.Chrysler Corp. January 23, 1998. Annual Report on Form 10K for year ended December 31, 1997. Edgar Database.<http://www.sec.gov/Archives/edgar/data/791269/0000950124-98-000347.txt>.General Motors Corp. March 20, 1998. Annual Report on Form 10K for year ended December 31, 1997. EdgarDatabase. <http://www.sec.gov/Archives/edgar/data/40730/0000950124-98-001456.txt>.
In an attempt to become more globally competitive, the OEMs arerestructuring to cut costs and speed vehicle development. They areincreasingly focusing on parts and services in which they possess aclear competitive advantage and are outsourcing other work. GM,Ford, and Chrysler currently outsource 30, 50, and 70 percent of theirvehicle content, respectively (Auto and Auto Parts, 1997). With GM’srecent spinoff of Delphi Automotive Systems, GM’s percentage ofoutsourced work will climb to levels more comparable to those ofFord and Chrysler. Successfully transferring the design andmanufacturing of many components to their supplier base requiresconcurrent design processes that demand effective PDE andinteraction between the OEMs and their many tiers of suppliers.

Interoperability Cost Analysis of the U.S. Automotive Supply Chain
2-16
2.3.2 First-Tier Suppliers
The first tier of the supply chain consists of several hundredcompanies. Each supplier, depending on its size and diversity, canproduce anything as minor as a part for a major system (fastenersfor the brake system) or as integral as the entire axle assembly.Many of the larger companies have several divisions and sites andare responsible for producing several parts, systems, components,and accessories. Many suppliers are also increasing their input intodesigning and manufacturing complete modules or systems ratherthan just building simple component parts based on OEMspecifications. Therefore, sharing data throughout the product lifecycle has become an important feature of a first-tier supplier’soperations.
While OEMs are becoming less vertically integrated, many first-tiersuppliers are purchasing subtier suppliers to become morevertically integrated. Suppliers are becoming system integrators bycombining related components into a single product to provideincreased value to the OEM. Many suppliers, eager to deliver alarger share of the content of a vehicle, have become large systemintegrators by acquiring competitors and related-parts assemblersand operations, giving them the resources, financial strength, andthe capacity to serve several manufacturers globally. For example,Lear Corporation purchased Automotive Industries in 1995 and hasnow acquired Masland, a maker of carpet and trim. Similarly,Johnson Controls, Inc., recently acquired interior componentsmanufacturer Prince, and Magna International purchased Douglasand Lomason, a seat manufacturer (Flynn et al., 1996). Companiespursuing a niche in the system integration market know that theymust communicate efficiently to compete effectively.
First-tier suppliers often work for multiple OEMs. For example,TRW conducts 23 percent of its business with Ford and 10 percentwith GM. Johnson Controls earns 11 percent of its revenues fromChrysler and 10 percent from Ford (NIST, 1997). To varyingdegrees, each OEM requires its suppliers to use a specificcomputer-aided design/computer-aided manufacturing (CAD/CAM)design system. For example, Chrysler requires all of its first-tiersuppliers to use CATIA on their work for Chrysler (AIAG, 1997a).Ford is shifting from Computervision (CV) to I-DEAS in the powertrain area. Body engineers at Ford currently use PDGS, which will
Because first-tier suppliersoften work for multipleOEMs, they must purchaseand maintain multipledesign systems or invest inexpensive translationsoftware.
Section 2 — The Automotive Supply Chain
2-17
also eventually be supplanted by I-DEAS. GM uses Unigraphics(UG) but is less stringent about “requiring” suppliers to use UG.This is partly because GM still has some people who internally usetheir in-house system, CGS. Also its Saturn division uses CATIA.The use of multiple CAD/CAM systems by OEMs forces manysuppliers of multiple OEMs to purchase and maintain multipledesign systems or invest in expensive translation software.Furthermore, many suppliers have customers outside the autoindustry that require similar CAD/CAM data. This mixed-customerbase exacerbates the PDE problem by bringing even moreCAD/CAM systems into the mix.
Table 2-3 lists a few of the largest members of the first tier of theautomotive supply chain, their auto industry revenue, and theirprimary products. The total sales of the top 150 U.S. OEM partssuppliers in 1997 were over $288.7 billion (Automotive News,1998b).
2.3.3 Subtier Suppliers
The subtiers of suppliers consist of thousands of smaller companiesthat work with OEMs only indirectly via other suppliers. Anexception would be some of the first-tier suppliers that also operateon the subtier by supplying parts to their rivals on the first tier. Anexample is Dana Corporation, which directly supplies Ford(18 percent of its revenue) and Chrysler (11 percent of its revenue).Dana also acts as a subtier supplier to Eaton, which, in turn,supplies Ford. The subtier companies that have no direct OEMbusiness are relatively smaller companies that supply integralcomponents or modules to the first tier without having muchinteraction with the OEMs. Table 2-4 lists a few of the largersubtier suppliers and their total sales (including nonauto sales).
2.3.4 Tooling Suppliers
Production of tooling is a major element of automobile design anddevelopment in terms of both of cost and lead time. As describedin Section 2.2, tooling is an important part of automobile assemblyas well as the production of automobile parts. The tooling that isused to manufacture parts and assemble them must be designed inconjunction with the automobile and its component parts.
Published statistics do notprovide estimates of thetotal volume of toolingindustry sales to the autoindustry. However, theauto industry comprises9 percent of the total valueof manufactured goods inthe U.S. (Department ofCommerce, 1998).Therefore, we assumed that9 percent of the revenue ofSICs 3544 and 3599—about $44 billion—is fromthe auto industry.

Interoperability Cost Analysis of the U.S. Automotive Supply Chain
2-18
Table 2-3. Characteristics of Prominent First-Tier SuppliersFirst-tier suppliers vary in terms of their size and the range of parts and components they produce.
Company
North American OEMAuto Sales 1997
($millions)
Worldwide OEMAuto Sales 1997
($millions) Primary Products
Delphi AutomotiveSystems
19,950 26,600 Brakes, steering, suspension,cockpit components, wire harness
Lear Corporation 4,672 7,300 Complete interior systems, seats
Delco Electronicsa 4,350 5,350 Electronic systems
Johnson Controls Inc. 4,950 7,280 Seats, interior trim, batteries
Dana Corporation 4,974 6,217 Drive train, structural, engine,chassis
Magna InternationalInc.
3,740 5,500 Chassis, seats, and interiors
TRW Inc. 3,516 7,032 Airbags, steering, suspensions,electronic safety, conveniencesystems, engine components
Robert BoschCorporation
3,300 16,500 ABS, electronic and brakes
Dupont Automotive 2,800 3,500 Engineering polymers, fibers,lubricants and finishes
Eaton Corporation 2,913 3,552 Valves, climate control, electronics
ITT Automotive 2,600 5,200 ABS, wipers, small motors, fluidhandling systems, switches, diecastings
Arvin Industries Inc. 1,038 1,622 Exhaust systems and ride controlproducts
Tenneco Automotive 914 1,758 Shocks, struts, vibration controlproducts, exhaust and emissioncontrol systems
Allied SignalAutomotive
533 1,158 Turbochargers, air brakes
Cooper Automotive 360 474 Lighting and brake components,ignition and wiper products
aSince these figures were developed, Delco Electronics was acquired by Delphi Automotive Systems.
Source: Automotive News. March 30, 1998b. “Top 150 OEM Parts Suppliers to North America.” Detroit: MarketingServices Inc.

Section 2 — The Automotive Supply Chain
2-19
Table 2-4. Characteristics of Prominent Subtier SuppliersSubtier suppliers tend to be smaller and supply various parts to first-tier suppliers.
Company Name1997 Worldwide Sales
($millions) Primary Products
Nypro Inc. 433 Plastic products and custom injection moldings
Ganton Technologies 78 Aluminum and magnesium die-cast parts
Lectra Systems, Inc. 175 CAM systems, CAD systems, design hardware,design software
ITW—Deltar (An Illinois ToolWorks, Inc. Company)
40a Batteries and parts, door systems and trim,molded components, filtration products
Brush Research ManufacturingCo.
7.5a Engine cylinders, brake cylinders, rotors, drums,valves, and controls
Amtech Precision Products 18a Wire splices, assembly material, ignitioncomponents
Auburn Gear, Inc. 46 Axles, differentials, transfer cases, gears, andlinkages
Calspan S.R.L. Corporation 110a Design hardware, engineering design, andprototyping
Cascade Die Casting Group,Inc.
65a Dies, molds, tools and equipment, filters (air,oil, fuel, pumps, tubings, hoses, and fittings)
Hamlin, Inc. 80 ABS components, airbag components, antitheftsystems, sensors and actuators
HR Textron, Inc. 89 ABS components, sensors and actuators,solenoids, valves, and controls
aEstimated by Gale Research Inc. (1997) based on prior year data.
Sources: Gale Research Inc. 1997. Ward’s Business Directory of U.S. Private and Public Companies. Detroit: GaleResearch Inc.Information Access Corporation. 1998. Business Index [computer file]. Foster City, CA: Information AccessCorporation.Chilton Company. 1997. Automotive Industries Annual Source Guide. <http://ai.chilton.com>.
Imperfect interoperability between the auto OEMs, parts suppliers,and their tooling shops causes many of the same costs and delaysas imperfect interoperability in other parts of the automotive supplychain. Although the tool and die industry serves many industrialcustomers, the automobile industry is one of its primary clients,along with the aircraft industry, the household appliances industry,and the electronic components industry. Interoperability issues insome of these other industries are very similar to those in theautomobile industry.
The segments of the tooling industry that have the greatestinvolvement in the auto industry are SIC 3544 (Special Dies, Tools,
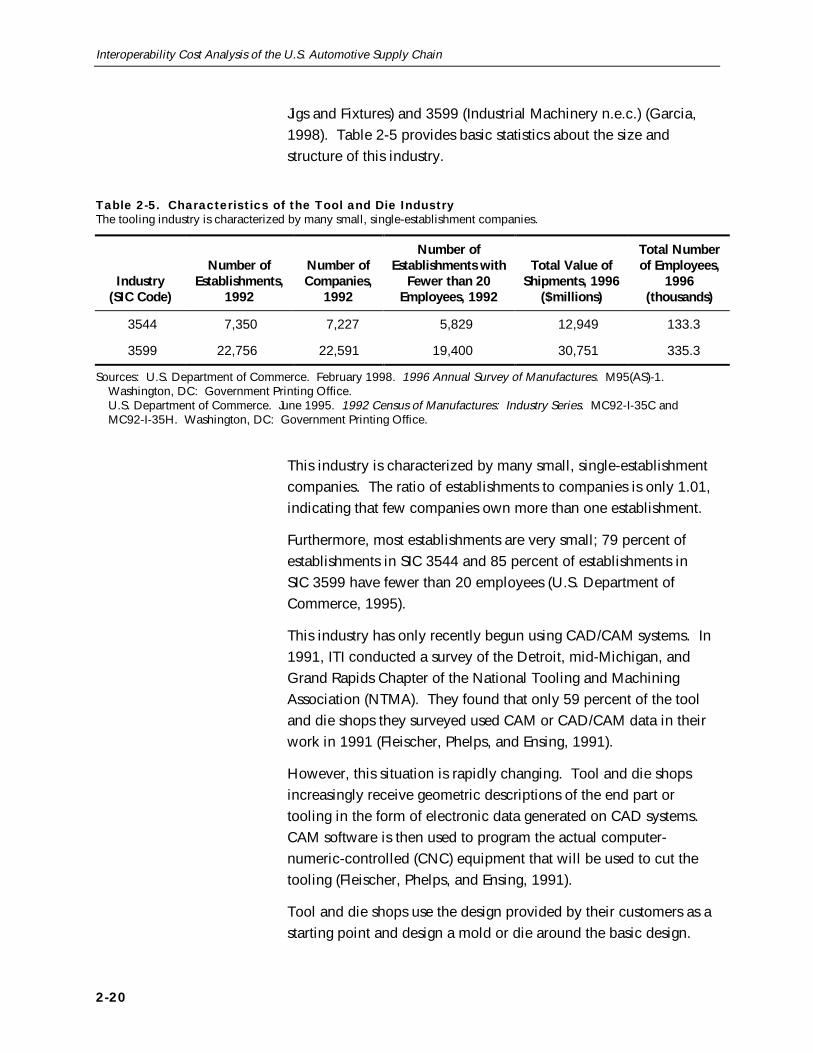
Interoperability Cost Analysis of the U.S. Automotive Supply Chain
2-20
Jigs and Fixtures) and 3599 (Industrial Machinery n.e.c.) (Garcia,1998). Table 2-5 provides basic statistics about the size andstructure of this industry.
Table 2-5. Characteristics of the Tool and Die IndustryThe tooling industry is characterized by many small, single-establishment companies.
Industry(SIC Code)
Number ofEstablishments,
1992
Number ofCompanies,
1992
Number ofEstablishments with
Fewer than 20Employees, 1992
Total Value ofShipments, 1996
($millions)
Total Numberof Employees,
1996(thousands)
3544 7,350 7,227 5,829 12,949 133.3
3599 22,756 22,591 19,400 30,751 335.3
Sources: U.S. Department of Commerce. February 1998. 1996 Annual Survey of Manufactures. M95(AS)-1.Washington, DC: Government Printing Office.U.S. Department of Commerce. June 1995. 1992 Census of Manufactures: Industry Series. MC92-I-35C andMC92-I-35H. Washington, DC: Government Printing Office.
This industry is characterized by many small, single-establishmentcompanies. The ratio of establishments to companies is only 1.01,indicating that few companies own more than one establishment.
Furthermore, most establishments are very small; 79 percent ofestablishments in SIC 3544 and 85 percent of establishments inSIC 3599 have fewer than 20 employees (U.S. Department ofCommerce, 1995).
This industry has only recently begun using CAD/CAM systems. In1991, ITI conducted a survey of the Detroit, mid-Michigan, andGrand Rapids Chapter of the National Tooling and MachiningAssociation (NTMA). They found that only 59 percent of the tooland die shops they surveyed used CAM or CAD/CAM data in theirwork in 1991 (Fleischer, Phelps, and Ensing, 1991).
However, this situation is rapidly changing. Tool and die shopsincreasingly receive geometric descriptions of the end part ortooling in the form of electronic data generated on CAD systems.CAM software is then used to program the actual computer-numeric-controlled (CNC) equipment that will be used to cut thetooling (Fleischer, Phelps, and Ensing, 1991).
Tool and die shops use the design provided by their customers as astarting point and design a mold or die around the basic design.
Section 2 — The Automotive Supply Chain
2-21
Thus, there is still a considerable amount of design required by thetool and die shop before they can start making a mold or die(Fleischer, Phelps, and Ensing, 1991).
As tooling suppliers increase their exchange of product data withOEMs and parts suppliers, the need for improved interoperabilitybecomes more critical. Because tooling suppliers are such a keylink in the design and manufacturing process, speeding the designand manufacture of tooling and decreasing its costs can lead toimportant advances in the competitiveness of the U.S. auto supplychain.

3-1
TechnicalIssues in Product3 Data Exchange
The growing complexity of automobiles, the design process, andthe automobile supply chain has elevated the importance ofefficient product data exchange (PDE). As the volume of PDEsgrows, members of the automotive supply chain spend more andmore resources translating and transferring product data and solvingthe technical problems associated with these exchanges. Thesetechnical problems have therefore taken on greater importance,because they affect the cost and time required to design andmanufacture an automobile.
This section describes the PDE process and the problems typicallyencountered by designers and engineers in the auto industry whenthey exchange product data. It also describes some potentialsolutions to the interoperability problem and NIST’s role indeveloping these solutions and encouraging industry to adopt them.
3.1 INFORMATION FLOW IN THE AUTOMOTIVESUPPLY CHAINData from computer-aided design, engineering, and manufacturingsoftware systems are routinely exchanged within companies andbetween original equipment manufacturers (OEMs), first-tierautomotive component suppliers, subtier automotive componentsuppliers, and tooling suppliers. One OEM estimates that as manyas 453,000 PDEs occur each year within their company and amongtheir company and their suppliers. Another OEM estimates that
As the volume of PDEsgrows, the auto industryspends more timetranslating product dataand solving technicalproblems associated withPDE. The solution of thesetechnical problems hasbecome an important issuethroughout the industry.

Interoperability Cost Analysis of the U.S. Automotive Supply Chain
3-2
electronic exchange of computer-aided design (CAD) data aloneoccurs at least 7,000 times per month; that quantity rises as high as16,000 transfers per month during peaks. This last estimate doesnot include transfers that take place using physical media such astape and CD-ROM; nor does it include transfers of data besidesCAD/computer-aided manufacturing (CAM) data.
Currently, many different computerized engineering, design andanalysis, and manufacturing software and hardware systems areused throughout the automotive supply chain. Not only do thesesystems differ between companies but they can also differ amongdifferent functions within a company. Each system has its ownproprietary data representation. As a result, product data arecreated and stored in multiple, frequently incompatible formats.Therefore, interoperability problems exist, whether files are beingtransferred between firms or within a firm.
Figure 3-1 identifies some of the different CAD/CAM platformscurrently used by members of the U.S. automobile supply chain.The figure, based on AIAG (1997a), demonstrates that a first-tiersupplier with several OEM customers and subtier suppliers mayhave to purchase, learn, and maintain multiple, often redundantplatforms or translation software.
3.1.1 Data Exchange Process
Given the many different formats in which product model data aredeveloped and stored, each data transfer requires a decision aboutthe type of data exchange that will be used. Members of theautomotive supply chain may exchange data electronically via asecure communications network, such as Automotive NetworkeXchange (ANX), or they may exchange physical media, such asmagnetic tape, CD-ROM, or diskettes.
Regardless of what medium is used, the parties to the transfer mustchoose a method for transferring the data from one system toanother. As illustrated in Figure 3-2, the common choices include
Interoperability problemsoccur not only amongdifferent companies butamong different functionswithin the same company.

Section 3 — Technical Issues in Product Data Exchange
3-3
Figure 3-1. Multiple CAD/CAM Systems Used in the Automobile Supply ChainMultiple translators are required to exchange data between the various players in the U.S. automotive industry.
CADKEY
ARIES
Applicon
ANVIL
AutoCAD
Pro/ENGINEER
I-DEAS
PDGS
CATIA
HP
Intergraph
EUCLID
CADDS
I-DEAS
Intergraph
Pro/ENGINEER
CATIA
Unigraphics
I-DEAS
Unigraphics
CATIA
CADDS
Subtier Suppliers
OriginalEquipment
ManufacturersFirst-TierSuppliers
Source: AIAG. 1997a. “Product Data Exchange in the Automobile Supply Chains: AutoSTEP at the Midpoint.”Southfield, MI: AIAG.
➤ native format transfer, in which the sender creates the datafile in the same software that the receiver will use,eliminating the need for translation for that particulartransfer;1
➤ point-to-point translation, which uses a conversion programthat transforms the data from the form used by one systemto the form used by another system;
➤ manual reentry of product data into the receiving system;and
➤ neutral format translation, in which the data are translatedfrom the originating format into a neutral format by thesender, and translated from the neutral format to the desiredformat by the receiver.
1Although a translation is not required in native format transfer, it is important to
note that a translation may be required before a native format transfer takesplace. For example, if design data are created in Pro/E, but the customerrequires the data in CATIA format, the sender must translate the data intoCATIA and verify that it has been translated correctly before forwarding thenative format data to the customer. Problems related to native format transfersare discussed in Section 3.2.

Interoperability Cost Analysis of the U.S. Automotive Supply Chain
3-4
Figure 3-2. Generic Model of Data Exchange in the Product Development ProcessTranslations between two data systems require choosing a translation method and an error correction method. Eachchoice has implications for the cost of the translation.
OriginalModel
System A
Error-FreeFile
File withUndetected
Errors
Choose ErrorCorrection
Method
RetryTranslation
ManuallyRepairErrors
ManuallyReenter
Data
ModelSystem B
Error Analysis:Errors Detected?
No
Yes
Choose Translation Method✓ Native Format✓ Point-to-Point Translation✓ Manual Reentry✓ Neutral Format
Error Discovered at✓ Prototype✓ Hard Tooling✓ Production
Section 3 — Technical Issues in Product Data Exchange
3-5
The choice among the available options depends on a number offactors, including the specific sending and receiving systems, thecomplexity of the data, and the availability of translators. Thedecision affects the direct and indirect costs associated with theexchange, because different methods for exchanging the file imposedifferent labor and capital requirements and impose differentprobabilities of error and subsequent delay.
After the exchange takes place, the recipient analyzes the file forerrors. If no errors are detected, the exchange process is complete(however, errors may remain that are not detected and may causeproblems later in the design and manufacturing process). If errorsare detected, the two parties to the exchange have three choices forresolving the errors:
➤ reattempt the transfer, possibly using alternative settings inthe translation software;
➤ manually repair the errors in the file; or
➤ manually reenter the data that need to be transferred.
File exchange errors affect costs over and above what wouldnormally be experienced in a successful file transfer. These costsinclude not only the direct costs (labor and other resources) that arerequired to reattempt the transfer, manually repair the error, ormanually reenter the data, but also the indirect costs associatedwith any delays related to file problems. The transfer process isrepeated until the transfer has been accomplished and no errors aredetected in the data file.
Theoretically, additional problems can arise from errors in the filethat are undetected. As shown in Figure 3-2, these errors will mostlikely be detected later in the production process, either at theprototyping stage, the hard tooling stage, or the production stage.The later in the process these delays are detected, the more costlytheir consequences, in terms of both direct costs and indirect costs.
3.1.2 Data Exchange Problems
Problems in the exchange of product model data take a variety offorms. Some of these problems are sufficiently serious to requirerepeating the data exchange or recreating the model. Otherproblems can be repaired more easily. Some of the more commonproblems that require repeating the transfer of a solid model or
This study focuses on errorsin the file that are due toboth the exchange betweensoftware and hardwareplatforms andinteroperability problemsdue to product dataquality. Practicallyspeaking, it is often difficultto separate problems dueto hardware/softwareincompatibility from thosedue to product dataquality.
Interoperability Cost Analysis of the U.S. Automotive Supply Chain
3-6
recreating the data include models that arrive with missing,collapsed, or inverted faces; models that do not form closed solids(surfaces and edges do not connect); and models with incorrectfeature orientation (Frechette, 1997).
Other common problems associated with the transfer of CAD datainclude
➤ lines that do not meet at corners;
➤ lines that cross at corners;
➤ curves or lines drawn as many short line segments;
➤ multiple occurrences of the same feature at the samelocation;
➤ lines or surfaces coincident with other lines or surfaces;
➤ surfaces that do not meet at lines;
➤ some or all of the geometry not translated;
➤ geometry, dimensions, and notes not correctly separatedinto different layers;
➤ planar features drawn out of plane; and
➤ geometry of features not drawn to scale (Fleischer, Phelps,and Ensing, 1991).
Fleischer, Phelps, and Ensing (1991) surveyed members of theDetroit, Mid-Michigan, and Grand Rapids chapters of the NationalTooling and Machining Association (NMTA) to determine thenature and frequency of problems incurred when tool and dieshops received CAD/CAM data from their customers. The surveyrevealed that in about 51 percent of the jobs, the CAD data had tobe repaired. The job shop had to completely recreate CAD data inan additional 25 percent of the cases. In about 15 percent of allcases, these errors were not discovered until after the part toolinghad already been cut. These errors were costly and caused delaysbecause the company had to scrap and recut the parts (Fleischer,Phelps, and Ensing, 1991).2
2At the time this study was conducted, the use of CAD/CAM data was still not a
widespread practice in the tooling industry. Only 59 percent of the shopssurveyed used CAM or CAD/CAM in their work, with smaller shops less likelyto do so. As the industry’s familiarity with CAD/CAM has increased, theincidence of these problems among shops that do use CAD/CAM seems to havedeclined based on our more recent interviews with tooling suppliers.However, as explained in Section 5 manual reentry and rework of product datais a significant problem.
Section 3 — Technical Issues in Product Data Exchange
3-7
3.1.3 Data Quality Issues
Even when data transfers are completely successful, data qualityissues can lead to imperfect interoperability. A recent study by theAIAG (1997b) found that product data quality issues cause manyproblems for many members of the automotive supply chain.These issues exist even when product data are exchanged in nativefile formats. One OEM reported that downstream functions, suchas rapid prototyping, finite element analysis, or CNC programming,spent a great deal of their time�as much as 50 percent�workingwith CAD data files that were not constructed properly for use inthese downstream purposes.
These problems stem from poor model construction techniquesused during CAD data entry. Examples of CAD data problems citedby the AIAG study include
Z lines that do not meet at corners as intended,
Z curves supposed to be tangent that are not,
Z duplicate entities,
Z surface patches that do not match at their joining edges, and
Z solid model faces that are incorrectly formed or haveimproper topology (AIAG, 1997b).
These problems sometimes occur because different computationalsoftware and different operating systems develop product modelswith different scale and closure tolerances. Furthermore, differentorganizations use different conventions to organize their drawingsor documents (Sawant and Nazemetz, 1998).
While translation errors of the type listed in Section 3.1.2 areusually obvious, many data quality problems are not easilydetectable. The user may not realize that the data are of poorquality until a problem with a downstream software programoccurs and leads to the discovery of the problem data. The fartherdownstream these kinds of problems are detected, the more costlythey are in terms of scrapped models, model rework, and projectdelay.
Even when data transfersare completely successful,data quality issues can leadto imperfectinteroperability.
Interoperability Cost Analysis of the U.S. Automotive Supply Chain
3-8
3.2 POTENTIAL METHODS FOR IMPROVINGINTEROPERABILITYMembers of the auto industry generally acknowledge that imperfectinteroperability is an important and expensive problem. Yet noneof the solutions that have been widely used in the past have beensuccessful at significantly reducing these problems. This sectionbriefly describes several approaches to improving interoperabilityand their technical and economic shortcomings.
3.2.1 Data Translation Methodologies
As described earlier, interoperability problems consist of both datatranslation problems and data quality problems. Becauseinformation is created on a variety of CAD/CAM and otherengineering systems and each system has a proprietary datarepresentation, product data are currently stored in formats that areoften incompatible, so the data must be translated to transfer it fromone system into another. The following methods are currently usedto share data between systems, but they have a number ofdrawbacks:
➤ standardization on a single system and sharing of files innative format,
➤ point-to-point translation,
➤ manual reentry of data, and
➤ neutral format translation (Doty, 1994).
Single-System Standardization
Standardization on a single system may seem like the simplest wayto ensure compatible data because an exchange of product datarequires no translation. However, even within a single company,enforcing this standardization can be difficult because differentparts of the organization have different needs and a single systemmay not be capable of meeting all these needs. Furthermore, evenwhen a single system is mandated, the use of different versions ofthe software may create translation problems.
Section 3 — Technical Issues in Product Data Exchange
3-9
Enforcing a single-system standard across the members of the U.S.supply chain can be even more difficult and costly. It restricts thecompany’s collaborators to users of the same technology.Alternatively, the company with greater market power can forcepotential collaborators to adopt its system of choice. The threemajor U.S. automobile manufacturers require their first-tiersuppliers to maintain specific systems for the purpose of sharingproduct data. Many suppliers work with more than one majorcustomer, each of whom requires a different system. In addition,many of these suppliers have customers outside the auto industry.This situation creates significant extra cost because, as documentedin AIAG (1997a), maintaining these multiple systems concurrentlycauses
Z less than optimal use of the systems in place, because somesystems are only used a small percentage of the time (e.g.,used only to transmit data to a specific customer);
Z decreased proficiency of CAD users in each of the multiplesystems maintained and a resulting decrease in theflexibility with which the engineering staff can be used;
Z increased cost for maintaining and administering themultiple systems and increased system administrationproblems and system down time;
Z increased training costs because CAD users must be trainedon multiple systems;
Z increased number of data transfers among multiple systemsused concurrently for the same design project, along withthe attendant accuracy problems and costs;
Z increased costs of product data management (PDM), whichbecomes increasingly expensive because changes must betracked through multiple design systems; and
Z increased costs of maintaining quality and procedurestandards for CAD data, which reduces the quality of theCAD data entering systems.
These costs may be especially burdensome to small companies thatproduce small volumes because some of the costs of purchasing,maintaining, and gaining expertise in these systems are fixed, ratherthan variable, costs. Small companies cannot spread the costs ofinvestment in these systems across a large enough volume to makeit cost-effective (Target, 1994). Thus, these requirements canfunction as barriers to market entry.
To minimize problems ofdata exchange, the threeOEMs encourage or requiretheir first-tier suppliers tomaintain specific systemsfor the purpose of sharingproduct data:Z GM requires
Unigraphics,
Z Chrysler requiresCATIA, and
Z Ford requires I-DEAS.
Interoperability Cost Analysis of the U.S. Automotive Supply Chain
3-10
Point-to-Point Translation
A second approach to sharing data among applications is todevelop and use a conversion program that transforms data fromthe form used by one system to the form used by another system.For some well-defined data translation tasks, these translators workfairly well. However, the drawbacks of this approach include
➤ the need for a pair of translators for every combination ofsystems that require translation (Frechette, 1997),
➤ the need to update each translator when either of the twosystems’ software is updated, and
➤ the lack of availability of translators for all software and alltasks.
In addition, a high degree of vendor cooperation is necessary forthe development of direct translators. Sawant and Nazemetz(1998) point out that such cooperation is limited because thedevelopment of viable translators requires the disclosure ofproprietary information about the software. Vendors areunderstandably reluctant to share such information withcompetitors.
Manual Reentry
When a satisfactory method of exchanging electronic data is notavailable, operators may manually reenter data into each systemthat requires it. Aside from the obvious problems of the cost andtime required to manually reenter product data, it may also result intranscription errors. Nevertheless, this method is commonly usedin some situations (Doty, 1994).
Neutral Format Translation
Another approach to sharing data between different systems is todevelop a common neutral format for exchanging the data.Implementing the neutral format requires a pair of translators (readand write) between each application and the neutral format. Suchtranslators are often called “half translators.” With a neutral format,only two translators are required for each application, regardless ofthe number of other systems used to exchange data. This simplifiesthe maintenance of translators as each system evolves. Vendors arealso more willing to develop half translators because they do notrequire the disclosure of proprietary code. A vendor can build a
Point-to-point translationrequires the developmentof n(n–1) translators, wheren is the number of designsystems that must sharedata. As explained below,a neutral format facilitatesdata exchange with fewertranslators (Frechette,1997).
Section 3 — Technical Issues in Product Data Exchange
3-11
pair of half translators for his product without interacting with hiscompetitor (Sawant and Nazemetz, 1998).
Two alternative neutral format solutions are used most often toexchange CAD data in the auto industry: Initial Graphics ExchangeSpecification (IGES) and Drawing Exchange Format (DXF). Theseneutral format translators have shortcomings, as described below.STEP, another alternative neutral format, may be a promisingsolution to interoperability problems.
Alternative Neutral Format Solutions. IGES, which is a U.S.national standard, is supported by most CAD/CAM systems. DXF isa proprietary format defined by AutoDesk, the makers of AutoCAD.It is almost universally used for exchanging CAD/CAM data onpersonal computer-based systems (Doty, 1994). Subtier suppliersand tooling suppliers use it extensively.
Although IGES and DXF have been very successful in some limitedapplications, they have a number of weaknesses. IGES and DXFare limited because they were designed mainly to communicatedesign data, but many other types of data that supportmanufacturing, marketing, technical areas, cost analysis, andconfiguration management are required. Furthermore, IGES is usedprimarily in the U.S., so it cannot enable data transfers withinternational partners and customers. The U.S. Product DataAssociation (US Pro) is currently developing an IGES 6.0 release.The company has indicated that this will be the last IGES upgradeand that it will focus its development efforts on STEP (Sawant andNazemetz, 1998).
Benefits of STEP. STEP, an alternative neutral format, is emergingas a promising solution to the interoperability problems in theautomotive and other industries. STEP is a file format produced byeach software package (McEwan, 1995). The InternationalOrganization for Standards (ISO) adopted STEP as ISO 10303 toachieve the benefits of such an exchange standard. Rather thantranslating data from one software system into another, STEPprovides a complete computer-interpretable product data format.STEP allows users to integrate business and technical system dataand covers all aspects of the business cycle, from design toanalysis, manufacturing, sales, and service.

Interoperability Cost Analysis of the U.S. Automotive Supply Chain
3-12
STEP goes beyond currently available neutral format translators inseveral ways. First, it includes more of the types of data required todevelop, analyze, manufacture, document, and support many typesof products. Second, rather than operating only on the elementscommon to two systems, STEP provides a base model thatincorporates a superset of existing systems and extensions tosupport special application needs. Furthermore, because STEP isbeing developed by the ISO, it will enable U.S. companies tointeract with suppliers and customers abroad.
STEP’s advantages over other data translation methods arebecoming clear as STEP is tested and implemented in industry. Inthe auto industry, a number of organizations, including the AutoIndustry Action Group (AIAG), the Environmental Research Instituteof Michigan’s Center for Electronic Commerce (ERIM CEC),3 andNIST, have participated in a pilot project called AutoStep. TheAutoSTEP pilot project is introducing STEP to the auto industry,ensuring that STEP meets the needs of the industry, and measuringthe benefits from using STEP. The pilot project has tested theaccuracy of models exchanged between participating members ofthe U.S. automotive supply chain and has produced valuableinformation about the potential benefits of STEP. AutoSTEPparticipants have transferred over 100 production part modelsbetween supply chain partners using STEP as the neutral format.Eighty-three percent of these models translated as valid solidmodels, and the project has been very successful at identifying andaddressing translator errors (Frechette, 1997).
Fleischer (1997) points out that the AutoSTEP pilot project has beenquite successful on the technical side. He notes that, after a rockystart in which the systems had difficulty translating even simplefiles, STEP translators have been improved to a point at which theyaverage over 90 percent success in translation—better than mostdirect translation products. Frechette (1998) also notes that theCAD model exchange success of the AutoSTEP project has beenimproving significantly over time. The number of useableSTEP-facilitated data exchanges has increased from 35 percent to82 percent in less than 2 years.
3ERIM CEC was formerly part of the Industrial Technology Institute.
STEP is superior to otherneutral format translatorsbecause itZ addresses many types
of data,
Z incorporates a supersetof elements commonto all systems,
Z supports specialapplication needs, and
Z provides forinternationalexchanges.
Section 3 — Technical Issues in Product Data Exchange
3-13
Tests have shown that STEP performs better in most cases thanIGES. Strub (1998a) reported on a STEP/IGES comparison studyconducted by AIAG members that began in April 1997 and lasted6 months. Sixty-one data exchanges were conducted between fourmajor CAD systems using both STEP and IGES translators.4 The testcriteria were file size, face count, surface count, and surface area.The test results indicated that, on average, the STEP translatorsconveyed 80 percent of the surface area of the original modelsurface, whereas the IGES translators conveyed an average of only69 percent of the surface area. In 60 percent of the cases, STEPprovided a better exchange mechanism, in 32 percent of the casesIGES performed better than STEP, and in 8 percent of the cases,STEP and IGES provided the same results (PDES, Inc., 1998).
The GM STEP Translation Center also recently conducted a study tocompare the performance of IGES and STEP translators forexchanging wireframe and surface data from CATIA to UG, UG toCATIA, UG to Pro/ENGINEER, and Pro/ENGINEER to UG (PDES,Inc., 1998). The same models were transferred using both methods,as shown in Figure 3-3.
The test metrics were file size, surface count, and total surface area.The center conducted 43 tests and found that for the
Z 11 exchanges from UG to CATIA, the success rate was99 percent for STEP and 69 percent for IGES;
Z nine CATIA to UG exchanges, 99 percent of the STEPexchanges were successful compared to 66 percent forIGES;
Z 11 exchanges from UG to Pro/ENGINEER, both STEP andIGES were successful 99 percent of the time; and
Z 12 exchanges from Pro/ENGINEER to UG, STEP and IGESwere successful 98 percent of the time.
STEP’s success is particularly noteworthy given the fact that IGESwas implemented at least 10 years earlier than STEP, indicatingSTEP’s potential for improving data exchange as its implementationmoves forward and the commercially available STEP translatorsimprove.
4The CAD systems included recent releases of CATIA, CADDS-5, Pro/ENGINEER,
and UG.
Tests have shownthat STEP performsbetter in most casesthan IGES.

Interoperability Cost Analysis of the U.S. Automotive Supply Chain
3-14
Figure 3-3. General Motors’ STEP/IGES Translation Process Flow for Wireframe and SurfacesThe GM STEP/IGES translation study compared the translation capabilities of IGES with those of STEP.
Create STEPFile in “A”
(2)
Read “A” STEPFile into “B”
(3)
Create IGESFile in “A”
(2)
Read “A” IGESFile into “B”
(3)
SystemB
SystemA
Tran
slat
e O
ut
Translate Out
Translate In
Tran
slate
In
TransmitFile
TransmitFile
Source: PDES, Inc., 1998. Results of STEP Testing in the U.S. Auto Industry.
Such demonstrations of STEP’s capabilities have encouraged theauto industry and other industries to implement this technology.Production operations at General Motor’s STEP Translation Centerbegan on May 1, 1996. STEP is now being used to transfer productdesign data between GM divisions. The initial focus is ontranslation of solid model data between UG and CATIA. GM plansto increase the scope of the project to use STEP for configurationmanagement, data organization, and drawings (PDES, Inc., 1997c).
In November 1997, Delco Electronics announced that it hadsuccessfully replaced IGES with STEP as the PDE process in supportof climate control systems for two major OEM customers. Delcouses UG design software, while two of its major OEM customersuse CATIA. The original process used IGES as the neutral dataformat and was described as tedious and cumbersome. Delcoexpects the new exchange process using STEP to significantlyreduce costs and cycle time compared to the old process usingIGES (PDES, Inc., 1997b). In August 1997, Boeing and its enginesuppliers, Pratt & Whitney, Rolls-Royce, and GE Aircraft Engines,agreed to use STEP to exchange product data in the Digital Pre-Assembly (DPA) process. The engine companies previously usedcustom software translators that were expensive to develop andmaintain to exchange solid model data between their CAD systemsand CATIA (PDES, Inc., 1997a).
Demonstrations of STEP’scapabilities haveencouraged manymembers of the autoindustry and otherindustries to begin testingSTEP and using it for somedata exchanges.
Section 3 — Technical Issues in Product Data Exchange
3-15
STEP will certainly not solve all of the interoperability problems inthe U.S. automotive supply chain. A number of issues, particularlythose not directly related to translation, must be addressed in otherways. For example, in the AutoSTEP pilot project, CAD systemnumerical accuracy mismatch caused a number of problems withfile transfers. If the receiver’s CAD system has a more preciseaccuracy limit than the sender’s system, data loss occurs during thetransfer from the sender to the receiver (Frechette, 1997). Similarly,problems with translated models may be due to designer errorscaused by poor or incorrect CAD data generation practices.
Even as STEP emerges as a preferred neutral format translator,native format data exchanges will nearly always be the preferredform of data exchange when available. However, for dataexchanges in which native format cannot be arranged or is not cost-effective, STEP will likely become the preferred data exchangeformat.
3.2.2 Improving Product Data Quality
Solving product data quality issues requires creating and applyingproduct data creation standards and procedures (AIAG, 1997b).AIAG has developed a guidebook describing best business practicesfor customers and suppliers who are engaged in productdevelopment. The guidebook, entitled “Best Practices in SupplyChain Product Development,” was published in by AIAG August of1998 (AIAG, 1998). It is based on a study of the best productdevelopment practices in nonautomotive supply chains that havepotential automotive applications.
Implementing these practices will require an investment in training.Furthermore, high-quality product model data created followingbest practices take longer to create than low-quality data. Althoughthe benefits of higher quality data can be substantial (AIAG, 1997b),they may not be recognized or realized by the company practicinggood data creation practices. Instead, these benefits may accrue tothe customers of these companies who must work with these data.In time, the company investing in these practices may benefit bycapturing a greater market share or commanding a price premiumas a result of their superior data.

Interoperability Cost Analysis of the U.S. Automotive Supply Chain
3-16
3.2.3 Role of NIST
NIST responds to industry needs for standards-based solutions tothe interoperability problems being encountered among numerousengineering and manufacturing software applications in a variety ofdomains. NIST is helping to solve interoperability problems indiscrete parts industry domains by participating in the development,implementation, and deployment of STEP. NIST has responded torequests for assistance from the auto and other industries and hasacted as a catalyst in developing the standards, tools, and practicesnecessary to advance STEP. NIST represents U.S. interests indeveloping the standard and is developing a number of tools toassist industry in implementing STEP, including methods andsoftware for testing STEP translation software. NIST has alsoparticipated in pilot programs for implementing STEP as the dataexchange standard in the automotive and other industries.
Not all of NIST’s relevant projects are specifically targeted to theauto industry. Many of NIST’s STEP programs, such as standardsdevelopment, will benefit the auto industry despite being targetedmore generally to a wider group of industries. The relevantautomobile-related projects under way at NIST specific to STEP are
Z manufacturing standards development,
Z STEP conformance and implementation testing, and
Z STEP modularization infrastructural technologies.
Manufacturing Standards Development
On behalf of the American National Standards Institute (ANSI),NIST holds the secretariat for the international working groupsresponsible for STEP standardization (specifically ISO TC184/SC4).In this role NIST coordinates the international process for ensuringconsensus among the many countries participating in STEPdevelopment. NIST also ensures that ISO guidelines fordevelopment progress are adhered to and provides an onlinerepository of STEP information (see http://www.nist.gov/sc4/).
STEP Conformance and Implementation Testing
In conjunction with ERIM CEC, NIST has developed a set of value-added software tools for use by vendors and users during translatordevelopment and for interoperability trials. The tools enablevendors to test their products’ conformance with the standard and
NIST has served as acatalyst in the developmentof standards, tools, andpractices necessary toadvance STEP in the autoindustry.

Section 3 — Technical Issues in Product Data Exchange
3-17
use the results of these tests to verify their conformance to potentialcustomers. These tools can also be used during interoperabilitytrials to verify the success of translations. NIST has placed the testsystems on the Internet and currently a number of CAD/CAMsoftware vendors who are in the process of developing andimproving their STEP translators are using them.
NIST is providing software toolkits and developing metrics tosupport the data exchange and analysis of implementation using theSTEP standard in the auto industry. These toolkits are supportingthe AutoSTEP pilot program by providing network access tosoftware, enabling users to interactively access the toolkits withoutthe effort of installing and maintaining the software locally. NIST isalso providing expertise in requirements analysis, STEPmethodology, issue management, and STEP testing tools to theAutoSTEP pilot project.
AIAG is leading the implementation of the AutoSTEP pilot projectwith the assistance of ERIM CEC and NIST. AutoSTEP isintroducing STEP to the auto industry, ensuring that it meets theneeds of industry and measuring the benefits from using it. Thepilot project has tested the accuracy of models exchanged betweenparticipating members of the U.S. automotive supply chain and hasproduced valuable information about the potential benefits of STEP(Frechette, 1997).
STEP Modularization Infrastructural Technologies
In conjunction with the international standards working groupsresponsible for the development of STEP, NIST is working oninfrastructural technologies necessary to transition STEPdevelopment to a more modular approach. The objectives of themodular approach are to reduce the complexity of STEPspecifications, promote reuse of tried-and-true STEP components,ease the ability of software vendors to support multiple STEPstandards, and accelerate the standardization of STEP solutions forspecific interoperability problems.

4-1
EstimatingInteroperability4 Costs
The technical problems caused by imperfect interoperabilityimpose costs on society because scarce resources are consumed toaddress these problems. Imperfect interoperability increases thecost of designing and producing vehicles and causes delays in theintroduction of new models. These costs and delays reduce thewell-being of both consumers and producers.
Building on the discussion in Section 3 of the technical issues ofinteroperability, this section describes the economic impact ofimperfect interoperability. Section 4.1 describes a typology ofinteroperability costs and a set of technical and economic impactmeasures for quantifying these costs. It also describes the twoapproaches that we used to estimate total interoperability costs.Section 4.2 describes our procedures for collecting the primary datarequired for the analysis.
4.1 THE ECONOMIC IMPACT OF IMPERFECTINTEROPERABILITYInteroperability problems in the automobile industry affect society’seconomic welfare in two ways: by increasing the cost of designingand producing automobiles and by delaying the introduction ofimproved automobiles. An increase in the cost of designing andproducing a new vehicle may lead to an increase in theequilibrium price of automobiles and/or a reduction in the quantityof automobiles exchanged in the market. Depending on thestructure of the market, the lost social surplus will be shared by
Imperfect interoperabilityreduces society’s economicwelfare byZ increasing the cost of
designing anddevelopingautomobiles and
Z delaying thedevelopment of newautomobiles.

Interoperability Cost Analysis of the U.S. Automotive Supply Chain
4-2
consumers, who will pay higher prices, and producers, who willearn lower profits.
A delay in the introduction of an improved automobile alsoimposes costs on consumers and producers. The late introductionof a new product or service can lead to a loss in consumer surplusbecause consumers cannot benefit from the product’simprovements until it becomes available. For example, Hausman(1997) found that consumer welfare declined significantly whenfederal and state regulations delayed the introduction of newtelecommunications services. In the context of this study, the delayof the introduction of a new vehicle may force a consumer topurchase a vehicle that does not provide as much net value (valueminus price). This loss in consumer surplus can be attributed to thelate arrival of the preferred vehicle.
Producers can also lose market share and revenues if a new vehicleis delayed. However, producers can incur significant losses even ifmarket share and revenues are not lost, but simply put off, due todiscounting. Clark, Chew, and Fujimoto (1987) estimated that thediscounted present value of the profits from the introduction of anew vehicle could fall by as much as one million dollars for eachday of delay of the product introduction. Martin (1998) verified thisestimate via interviews with industry officials.
Delays in the production of intermediate products (parts andassemblies) can also increase the cost of design and production.They may cause bottlenecks in the automobile design andmanufacturing process, leading to the inefficient use of capital andlabor.
4.1.1 Cost Drivers and Cost Categories
A number of factors affect the resources required to successfullyshare product data among members of the U.S. automotive supplychain. Table 4-1 describes these cost drivers. Although this listmay not be comprehensive, it describes the primary factors thataffect the level of interoperability costs, determined from informaland formal interviews with members of the U.S. automotive supplychain. This list provided a launching point for developing ataxonomy of interoperability costs.
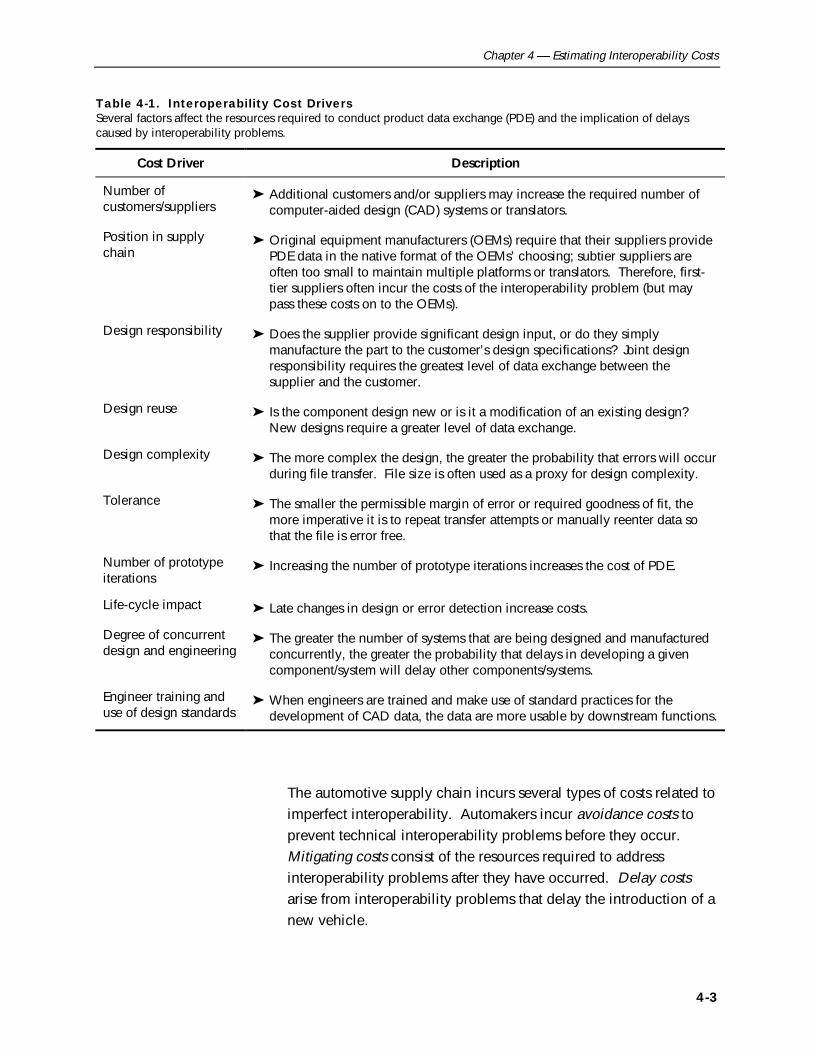
Chapter 4 � Estimating Interoperability Costs
4-3
Table 4-1. Interoperability Cost DriversSeveral factors affect the resources required to conduct product data exchange (PDE) and the implication of delayscaused by interoperability problems.
Cost Driver Description
Number ofcustomers/suppliers
Z Additional customers and/or suppliers may increase the required number ofcomputer-aided design (CAD) systems or translators.
Position in supplychain
Z Original equipment manufacturers (OEMs) require that their suppliers providePDE data in the native format of the OEMs’ choosing; subtier suppliers areoften too small to maintain multiple platforms or translators. Therefore, first-tier suppliers often incur the costs of the interoperability problem (but maypass these costs on to the OEMs).
Design responsibility Z Does the supplier provide significant design input, or do they simplymanufacture the part to the customer’s design specifications? Joint designresponsibility requires the greatest level of data exchange between thesupplier and the customer.
Design reuse Z Is the component design new or is it a modification of an existing design?New designs require a greater level of data exchange.
Design complexity Z The more complex the design, the greater the probability that errors will occurduring file transfer. File size is often used as a proxy for design complexity.
Tolerance Z The smaller the permissible margin of error or required goodness of fit, themore imperative it is to repeat transfer attempts or manually reenter data sothat the file is error free.
Number of prototypeiterations
Z Increasing the number of prototype iterations increases the cost of PDE.
Life-cycle impact Z Late changes in design or error detection increase costs.
Degree of concurrentdesign and engineering
Z The greater the number of systems that are being designed and manufacturedconcurrently, the greater the probability that delays in developing a givencomponent/system will delay other components/systems.
Engineer training anduse of design standards
Z When engineers are trained and make use of standard practices for thedevelopment of CAD data, the data are more usable by downstream functions.
The automotive supply chain incurs several types of costs related toimperfect interoperability. Automakers incur avoidance costs toprevent technical interoperability problems before they occur.Mitigating costs consist of the resources required to addressinteroperability problems after they have occurred. Delay costsarise from interoperability problems that delay the introduction of anew vehicle.
Interoperability Cost Analysis of the U.S. Automotive Supply Chain
4-4
Avoidance costs include
Z the cost of purchasing, maintaining, and training forredundant CAD/computer-aided manufacturing (CAM)systems for the purpose of native format translation;
Z the cost of purchasing, maintaining, and training for point-to-point translation software;
Z the cost of purchasing, maintaining, and training for neutralformat translation software;
Z outsourcing costs incurred when outside companies arehired to provide data exchange services;
Z investments in in-house programs aimed at addressinginteroperability issues, such as implementing STEP ortraining engineers in proper product model data creation;and
Z the cost of participating in industry consortia activitiesaimed at improving interoperability throughout the industry.
Mitigating costs include
Z the cost of reworking scrapped models, designs, prototypes,parts, dies, etc., that were incorrect due to interoperabilityproblems; and
Z the cost of manually reentering data when other methods ofdata exchange are unavailable or unsatisfactory.
Delay costs include
➤ profits lost due to decline in market share caused by delays;
➤ profits lost due to delay of revenues (discounts the value offuture profits); and
➤ losses of consumer welfare due to delay of the availabilityof products with greater net value.
Our analysis includes each of these kinds of costs except for thelosses to consumers.
4.1.2 Impact Measures
Quantifying the costs described above requires appropriate metricsthat capture the most important impacts. We developed two kindsof impact metrics:
Z Technical impacts describe the effects of imperfectinteroperability on the accuracy and usability of exchangedproduct data and the resources required (including time) fordata exchange and product development.
Imperfect interoperabilitygeneratesZ avoidance costs,
Z mitigating costs, and
Z delay costs.

Chapter 4 � Estimating Interoperability Costs
4-5
Z Economic impacts describe how technical impacts translateinto changes in cost and economic activity. Thesemeasures can be either quantitative or qualitative.
The sources of costs and the technical and economic metrics thatwe used to measure interoperability costs are summarized inTable 4-2. These metrics can be linked to the cost driverspresented in Table 4-1. For example, the greater the number ofcustomers/suppliers a company works with, the greater the numberof CAD/CAM systems and translators it must purchase and maintainand hence the greater its avoidance costs. The more complex,and/or the newer the design of a given component, the greater theprobability of errors occurring during PDE, increasing mitigatingcosts. This increases the number of attempts required tosuccessfully transfer the data.
4.1.3 Quantifying Costs
We employed two separate approaches to quantifying theeconomic metrics described in Table 4-2. Our first approach wasto collect primary and secondary data on the level of costs relatedto each of the technical and economic metrics shown in Table 4-2.By summing these components of cost, we developed an estimateof the total interoperability costs in the industry. We refer to thisapproach as the cost component approach.
Our second approach was to interview key industry executivesabout interoperability cost issues and to ask them to consider thescope of all interoperability problems in their company. We askedthem to provide an estimate of the total cost of all components ofinteroperability costs. We refer to this approach as the aggregatecost approach.
Each of these approaches has merit. The cost component approachbuilds a cost estimate from information provided by industry andother sources. Interviewees provide only pieces of the totalestimate. It puts less burden on industry officials to process all ofthe information to provide an overall estimate.
However, the aggregate cost approach allows industry officials toconsider interoperability cost factors that we may not haveconsidered. It allows them to consider the entire scope of theproblem and offer a vision of the automobile industry with perfect
We estimatedinteroperability costs usingtwo approaches:Z cost component
approach
Z aggregate costapproach

Interoperability Cost Analysis of the U.S. Automotive Supply Chain
4-6
Table 4-2. Metrics for Interoperability Costs We measured interoperability costs from several different sources.
Source of Cost Components Technical Metric Economic Metric
Avoidance Costs
Multiple CAD/CAMsystems
CAD/CAM softwarelicenses
Number of CAD/CAMsoftware licenses required bytype
Investment in CAD/CAMsoftware licenses
System maintenance Labor required to maintain allCAD/CAM systems
Cost of labor required tomaintain CAD/CAMsystems
System training Labor hours devoted totraining and gainingcompetence on all CAD/CAMsystems
Cost of labor time requiredto gain competence on allCAD/CAM systems
Multiple translators Translation softwarelicenses
Number of translation softwarelicenses required by type
Investment in translationsoftware licenses
Software training Labor hours devoted totraining on the use of differenttranslators
Cost of training labor to usedifferent translators
Outsourcing datatranslation
Third-party suppliers Jobs outsourced to third-partysuppliers of data exchangeservices
Cost of outsourced work
Investments ininteroperabilitysolutions
In-houseinteroperabilityresearch
Capital, labor, and materialsdevoted to in-houseinteroperability research
Cost of in-houseinteroperability research
Activities in industryconsortia
Time and materials devoted toparticipation in industryconsortia
Cost of membership, labortime, and materialsdevoted to consortiaactivities
Mitigating Costs
Poor qualityCAD/CAM files
Scrapped models,designs, prototypes,parts, dies, etc.
Hours required to reworkmodels, designs, prototypes,etc.
Cost of time required torework scrapped data,parts, etc.
Manual data reentry Number of jobs that requiredreentry and labor cost perreentry job
Total cost of manual datareentry
(continued)
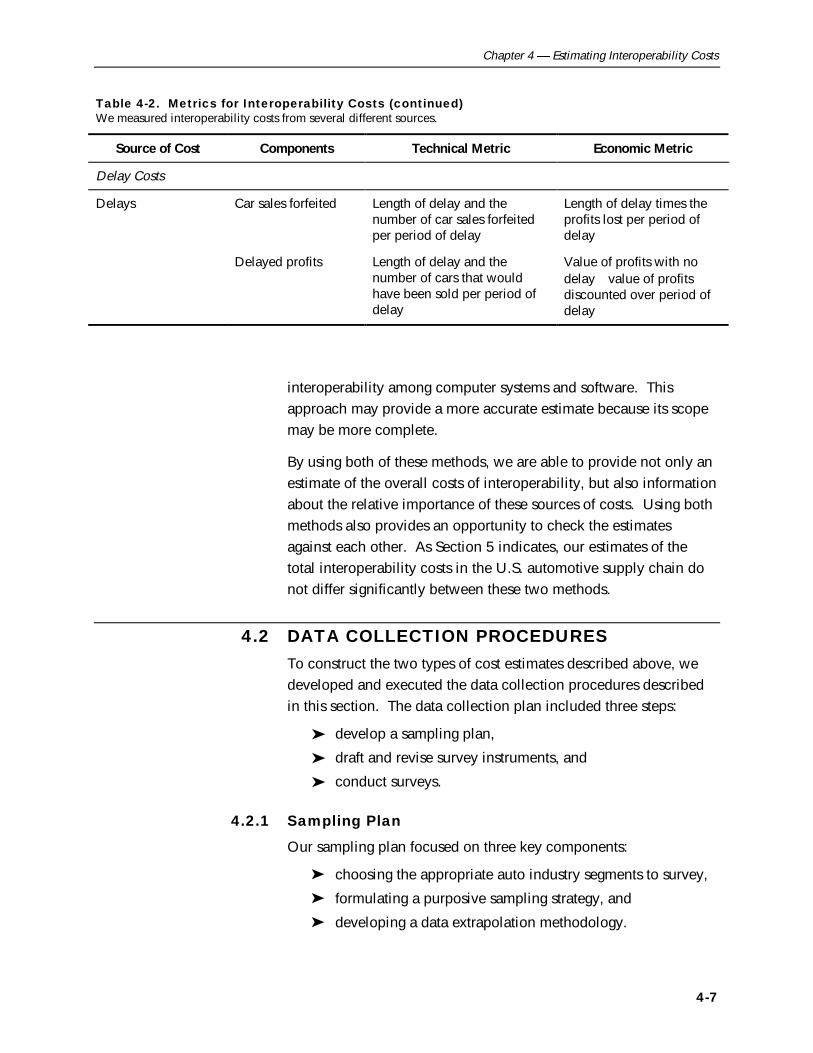
Chapter 4 � Estimating Interoperability Costs
4-7
Table 4-2. Metrics for Interoperability Costs (continued) We measured interoperability costs from several different sources.
Source of Cost Components Technical Metric Economic Metric
Delay Costs
Delays Car sales forfeited Length of delay and thenumber of car sales forfeitedper period of delay
Length of delay times theprofits lost per period ofdelay
Delayed profits Length of delay and thenumber of cars that wouldhave been sold per period ofdelay
Value of profits with nodelay�value of profitsdiscounted over period ofdelay
interoperability among computer systems and software. Thisapproach may provide a more accurate estimate because its scopemay be more complete.
By using both of these methods, we are able to provide not only anestimate of the overall costs of interoperability, but also informationabout the relative importance of these sources of costs. Using bothmethods also provides an opportunity to check the estimatesagainst each other. As Section 5 indicates, our estimates of thetotal interoperability costs in the U.S. automotive supply chain donot differ significantly between these two methods.
4.2 DATA COLLECTION PROCEDURES To construct the two types of cost estimates described above, wedeveloped and executed the data collection procedures describedin this section. The data collection plan included three steps:
➤ develop a sampling plan,
➤ draft and revise survey instruments, and
➤ conduct surveys.
4.2.1 Sampling Plan
Our sampling plan focused on three key components:
Z choosing the appropriate auto industry segments to survey,
Z formulating a purposive sampling strategy, and
Z developing a data extrapolation methodology.

Interoperability Cost Analysis of the U.S. Automotive Supply Chain
4-8
Industry Segments
The U.S. auto supply chain comprises a long and complex networkthat involves three major OEMs, hundreds of first-tier suppliers,thousands of subtier suppliers, and many providers of tooling andother infrastructure. Resource constraints made it impossible for usto survey each company in each tier of the supply chain. Anothercomplicating factor was the difficulty of defining each supplier’sposition in the supply chain, as described in Section 2. Therefore,our sampling frame classified suppliers on the basis of their size,rather than their position in the supply chain. We note, however,that most companies normally considered part of the first tier arelarger than companies normally considered part of the subtier.
Given these constraints, one of the key study design decisions forthis task was to determine the industry segments to survey. Webased this decision on two important considerations:
➤ the degree to which an industry segment has been affectedby data exchange problems; and
➤ the resources required to identify the requisite data, contactthe data source, and collect the data from each industrysegment.
Based on these considerations, we limited our data collectionefforts to the OEMs, the large suppliers, and the tooling suppliers.OEMs stand to lose market share if interoperability problems causedelays in bringing new platforms to market. Larger suppliers servemultiple customers and are often intimately involved in the designprocess; thus, interoperability problems are also likely to be asignificant issue for them. Tooling suppliers are increasinglyexchanging product data with parts suppliers and OEMs, and PDEissues are becoming more and more important to this segment ofthe automobile supply chain. However, very small suppliers oftenare not involved in the design process; hence, their interoperabilitycosts are expected to be lower. Because we did not survey otherindustry segments such as subtier suppliers and suppliers ofinfrastructure other than tooling, our quantitative estimates providea conservative estimate of the total interoperability costs faced bythe U.S. automobile industry.
This study focuses on theinteroperability costs ofOEMs, large suppliers, andtooling suppliers.
Chapter 4 � Estimating Interoperability Costs
4-9
Sampling Strategy
Our sampling strategy was to interview all three OEMs and apurposive sample of suppliers and tooling manufacturers. Apurposive sample allowed us to select a sample based onstratification variables as well as factors that minimize the difficultyof obtaining the data, such as the availability of key informants ateach company. Although a purposive sample has drawbacks (e.g.,we cannot make statistical statements about the precision ofestimates with respect to the population), we decided it was thebest strategy given the time and resource constraints of this project.
We used the list of top 150 suppliers created by Automotive News(1998b) as our sampling frame for the supplier segment of theindustry. For tooling suppliers, we began with the list of toolingsuppliers that participated in an earlier study of the use of productdata in the tooling industry (see Fleischer, Phelps, and Ensing,1991). In some cases, these suppliers provided contacts at othercompanies that provided additional data.
Extrapolation Methodology
Because we surveyed a small purposive sample of the industry, wecannot claim that the survey results are statistically representative ofthe entire affected population. Nevertheless, we developedmethods for extrapolation based on sales information availablefrom secondary data sources. Although this extrapolationprocedure does not provide estimates with definable statisticalprecision, it does provide a cost-effective, reasonable, anddefensible method for developing an industry estimate. We providedetails about the extrapolation procedure in Section 5.
4.2.2 Survey Instruments
We designed survey instruments that could be used either as atelephone interview guide or as a written survey the respondentcould complete and send to us. We developed a different surveyinstrument for each of the relevant industry segments: OEMs,suppliers, and tooling suppliers. The survey instruments asked forthe information needed to estimate interoperability costs using boththe cost component method and the aggregate cost method. Wereviewed the survey with industry consultants and NIST, and theseearly reviews led to several revisions of the survey.

Interoperability Cost Analysis of the U.S. Automotive Supply Chain
4-10
4.2.3 Survey Implementation
We collected some of the primary data via the telephoneinterviews; other data were collected via written survey responses.We allowed each respondent to choose the response method withwhich he/she was most comfortable. Many respondents providedboth written and oral responses.
The interview team
Z identified the candidate person for the interview;
Z called the selected individual, described the study, andrequested his/her participation;
Z sent the selected individuals our survey instrument andother information about the study;
Z conducted the interview over the phone or solicited writtenanswers, depending on the preferences of the respondent;and
Z followed up with the respondent to clarify writtenresponses.
Locating the appropriate contact within each company was one ofthe most important data collection challenges. We asked ourconsultant, industry contacts, and NIST staff for referrals to theappropriate person whenever possible. Where we had no referral,we directly contacted selected organizations to identify the personmost likely to have the knowledge and clearance to answer ourquestions.

5-1
Cost5 Estimates
Our analysis indicates that imperfect interoperability imposes about$1 billion of costs each year on the members of the U.S.automotive supply chain. By far, the greatest component of thesecosts is the resources devoted to repairing or reentering data filesthat are not usable for downstream applications.
We consider this estimate of interoperability costs of the U.S.automotive supply chain to be conservative. As explained in thissection, the project’s scope, time and resource constraints, and datalimitations hampered our efforts to quantify several sources ofinteroperability costs, including:
Z post-manufacturing interoperability costs,
Z interoperability costs of small suppliers,
Z in-house investments in interoperability solutions,
Z costs to consumers from delays in new productintroduction, and
Z lost profits from declining market share caused by delays.
In this section, we describe how we developed these estimates anddiscuss the estimates in the context of qualitative information aboutthe sources of these costs. As described in Section 4, we used twomethods to develop these estimates: the cost component approachand the aggregate cost approach. While these two methods lead toroughly the same estimate of the costs of imperfect interoperability,they both exclude some possibly significant costs that we were notable to quantify. Section 5.1 describes the methods and results ofthe cost component approach, while Section 5.2 provides theestimates from the aggregate cost approach. Section 5.3 discusses

Interoperability Cost Analysis of the U.S. Automotive Supply Chain
5-2
the differences between these estimates and the costs that we werenot able to quantify.
Our results are based on interviews with representatives of tencompanies: two of the “Big Three” auto original equipmentmanufacturers (OEMs), five suppliers, and three tooling companies.To add qualitative information from a slightly different perspective,we also discussed interoperability issues with one company thatmanufactures auto-related equipment. The combined 1997 sales ofthe five suppliers we talked with was over $38.4 billion. Thisrepresents about 13 percent of the sales of the “large suppliersegment” of the auto industry.1 The three tooling companies weinterviewed together comprise about $79 million in sales, most ofwhich is conducted in the auto industry. Although the toolingindustry is difficult to define, we estimate that these threecompanies comprise about 2 percent of the total tooling business inthe auto industry.2
5.1 INTEROPERABILITY COST ESTIMATES: THECOST COMPONENT APPROACHWe collected information about avoidance costs, mitigating costs,and delay costs from members of each of three segments of the U.S.automotive supply chain: OEMs, suppliers, and tooling suppliers.For each industry segment, we developed industry estimates bysumming the costs provided by the respondents and multiplyingthose costs by a weighting factor based on the percentage ofrevenue the sample represented. For example, the total revenues ofthe tooling suppliers responding to the survey represented about
1We used an Automotive News (1998b) list of the top 150 OEM suppliers as a
sample frame to define the “large supplier segment” of the auto industry. Theircombined sales in 1997 were estimated to be over $288.7 billion. We limitedthe extrapolation of our survey results to this segment only.
2As explained in Section 2, two Standard Industrial Classification (SIC) codescomprise most of the tooling suppliers that work for the automotive industry:3544 and 3599. However, these SIC codes include suppliers of tooling tomany other industries as well. The auto industry comprises 9 percent by valueof shipments of all manufacturing (U.S. Department of Commerce, 1995).Therefore, we assumed that 9 percent of the value of tooling business in theseindustries was supplied to the automobile industry.
Industry estimates ofinteroperability costs areextrapolated from surveyresponses using aweighting factor based onthe percentage of industryrevenue the samplerepresents.
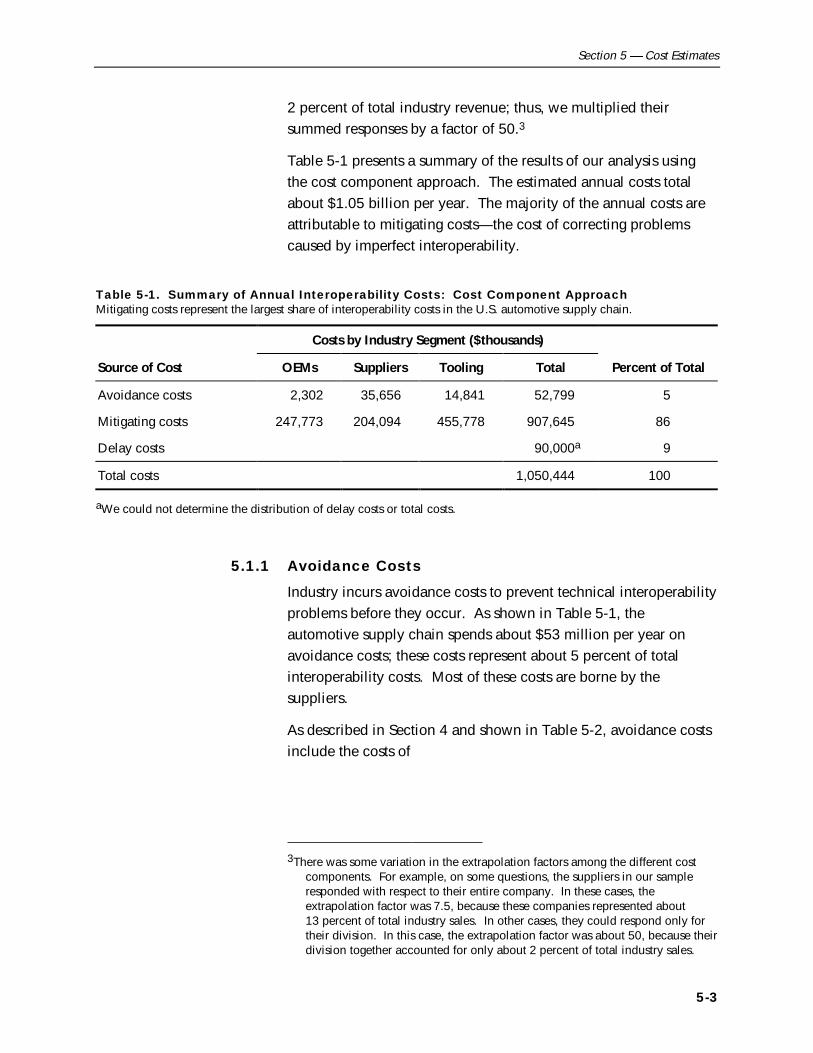
Section 5 � Cost Estimates
5-3
2 percent of total industry revenue; thus, we multiplied theirsummed responses by a factor of 50.3
Table 5-1 presents a summary of the results of our analysis usingthe cost component approach. The estimated annual costs totalabout $1.05 billion per year. The majority of the annual costs areattributable to mitigating costs—the cost of correcting problemscaused by imperfect interoperability.
Table 5-1. Summary of Annual Interoperability Costs: Cost Component ApproachMitigating costs represent the largest share of interoperability costs in the U.S. automotive supply chain.
Costs by Industry Segment ($thousands)
Source of Cost OEMs Suppliers Tooling Total Percent of Total
Avoidance costs 2,302 35,656 14,841 52,799 5
Mitigating costs 247,773 204,094 455,778 907,645 86
Delay costs 90,000a 9
Total costs 1,050,444 100
aWe could not determine the distribution of delay costs or total costs.
5.1.1 Avoidance Costs
Industry incurs avoidance costs to prevent technical interoperabilityproblems before they occur. As shown in Table 5-1, theautomotive supply chain spends about $53 million per year onavoidance costs; these costs represent about 5 percent of totalinteroperability costs. Most of these costs are borne by thesuppliers.
As described in Section 4 and shown in Table 5-2, avoidance costsinclude the costs of
3There was some variation in the extrapolation factors among the different cost
components. For example, on some questions, the suppliers in our sampleresponded with respect to their entire company. In these cases, theextrapolation factor was 7.5, because these companies represented about13 percent of total industry sales. In other cases, they could respond only fortheir division. In this case, the extrapolation factor was about 50, because theirdivision together accounted for only about 2 percent of total industry sales.

Interoperability Cost Analysis of the U.S. Automotive Supply Chain
5-4
Z purchasing, maintaining, and training for redundantcomputer-aided design (CAD)/computer-aidedmanufacturing (CAM) systems for the purpose of nativeformat translation; point-to-point translation software, andneutral format translation software;
Z outsourcing incurred when outside companies are hired toprovide data exchange services;
Z investments in in-house programs aimed at addressinginteroperability issues, such as implementing STEP ortraining engineers in proper product model data creation;and
Z participating in industry consortia activities aimed atimproving interoperability throughout the industry.
The first component listed in Table 5-2, redundant software, coststhe industry over $30 million per year, split roughly equallybetween suppliers of automotive parts and assemblies and suppliersof tooling. Although the cost of purchasing the licenses required torun this redundant software is an important part of these costs, thecost of training engineers to work on these systems is slightly larger.Outsourcing of data translation is also a significant part of theavoidance cost, while investments in interoperability solutions costthe industry roughly $4 million per year. Below, we providegreater detail about the sources of these costs.
Table 5-2. Sources of Annual Avoidance CostsThe cost of maintaining redundant software is the largest share of avoidance costs.
Costs by Industry Segment ($thousands)
Source of Cost OEMs Suppliers Tooling Total
Redundant software
Licenses 0 8,918 3,107 12,025
Maintenance 0 4,524 2,821 7,345
Training 0 3,278 8,914 12,192
Redundant software costs (subtotal) 0 16,720 14,842 31,562
Data translation outsourcing 2,042 15,594 0 17,636
Investments in interoperability solutions 260 3,341 0 3,601
Total avoidance costs 2,302 35,655 14,842 52,799

Section 5 � Cost Estimates
5-5
Redundant Software
Suppliers and larger tooling companies maintain some CAD/CAMsystems, point-to-point translation software, and neutral formatsoftware primarily to satisfy the data exchange needs of theirprojects. Some larger suppliers have several redundant systemsbecause they supply several OEMs. In addition, all the suppliersuse at least one neutral format software (IGES, DXF, or STEP) andmany also use point-to-point translation software. The surveyrespondents listed the software they considered redundant.
We annualized the one-time purchase price of redundant softwareover the expected duration of its useful life.4 While the softwaremight be purchased in a specific year, it will probably be used for anumber of years. In this regard, the cost of purchasing thesesystems is similar to any other capital investment.
In addition to the one-time purchase cost, many software licensesrequire an annual system maintenance cost (e.g., cost of receivingupdates and servicing the license). In addition, companies musttrain their personnel on these software, adding additional costs tomaintaining these multiple redundant software packages. Theannual cost of training was actually slightly larger than theannualized one-time cost of purchasing the licenses.
Data Translation Outsourcing
Some firms outsource their PDE to third parties, while others haveinternal departments that operate in this capacity for their internalclients. We included both types of “outsourcing” in this costcategory, which we estimate at $18 million per year.
Among the five suppliers, we interviewed four companies reportedthat they used third-party solutions for their PDE needs in 1997.One company reported that outsourcing their PDE allowed them toeliminate some of the redundant CAD/CAM systems. None of thetooling companies nor the OEMs reported using third-partytranslation services. However, OEMs and some suppliers have in-house departments dedicated to performing PDE operations for the
4To annualize the one-time purchase costs of software, we assumed a 7 percent
discount rate as recommended by OMB (1995), and a useful life of 5 years forthe software is recommended by several industry contacts.
Our definition ofoutsourcing costs includesthe cost of maintaininginternal departments thatoperate as data translationservice providers for theircompany.
Interoperability Cost Analysis of the U.S. Automotive Supply Chain
5-6
company or division. These costs are included in the outsourcingcategory.
While third-party solutions do not appear to be extensively used inthe auto industry at the present time, their significance as aninteroperability solution could increase in the future as morequalified data translation services become available. If the OEMscontinue to require that suppliers deliver files in native format, andas suppliers diversify the number of customers they serve,outsourcing may become a more cost-effective option because thesuppliers can reduce the number of redundant CAD/CAM systemsthey maintain.
However, OEM representatives expressed concern about this trend.The respondents indicated the following concerns:
Z The supplier and the OEM are less likely to recognize lossof data if translations are executed by third parties.
Z Vendors can charge very high rates.
Z Vendors can delay a project.
Z Vendors can be unreliable and the quality of theirtranslations are sometimes poor.
Z Vendors often do not understand the product very well andtherefore are unable to make appropriate adjustments tosolve translation problems.
These factors can lead to complications and can affect the quality,cost, and timing of the project.
Investments in Interoperability Solutions
The OEMs and most of the large suppliers participate in industryefforts to solve problems associated with imperfect interoperability.The costs of these efforts, including membership fees, labor timedevoted to consortia activities, and travel expenses, total about$3.6 million per year.
In addition, the OEMs conduct their own research anddevelopment toward the solution of interoperability problems. Forexample, the GM Step Translator Center was started in 1995 at GMto evaluate STEP implementations of interest to GM. Some of thestudies conducted by the GM STEP Translator Center are discussedin Section 3.
Section 5 � Cost Estimates
5-7
While the cost of these programs clearly falls into this category ofavoidance costs, we were not able to obtain an estimate of thebudget of the GM Step Translator Center. And we could not obtainan estimate of other kinds of internal research activities by the otherOEMs. Thus, our estimate of mitigating cost does not include thecost of these internal activities by the OEMs.
5.1.2 Mitigating Costs
By far, the largest portion of interoperability costs is due to the needto repair or replace unusable data files. The OEMs together spendapproximately $248 million per year correcting or recreatingunusable data. One OEM mentioned that downstream engineeringdepartments spend as much as 50 percent of their time dealing withpoor translations or poor quality CAD/CAM data files. AnotherOEM noted that, on the average, rework requires an average of4.9 hours per data exchange. With over 450,000 PDEs per year,this rework is extremely expensive in terms of engineering labortime.5
Suppliers and tooling companies also incur significant mitigatingcosts. Suppliers incur over $204 million per year for reworkingdata files. All but one supplier we talked with reported labor costscaused by incomplete or incorrect data files that had to bereworked or reentered manually. The need to manually renter datais especially troublesome for the tooling companies. They reportthat a large proportion of their jobs require rework or reentry ofsome kind. These costs amount to over $455 million for all toolingsuppliers—significantly higher than the costs reported by thesuppliers.
Our interviews with the tooling suppliers indicate two reasons forthese high costs. First, tooling suppliers typically have one primaryCAD system into which they must transfer all incoming data(although some large tooling suppliers do maintain a seat on thecustomer’s system to receive the data in the first place). Thesecond reason, which is probably more significant, is that toolingsuppliers must make significant changes to the product data tomake it useful for their purposes. That is, the data as delivered do
5We assumed a loaded wage rate of $59.20, which we based on a $25.00 per
hour wage rate for a Level III Engineer (DOL, 1996a), a 48 percent benefits rate(DOL 1996b), and a 60 percent indirect cost rate.
The OEMs togetherspendapproximately$248 million peryear correcting orrecreating unusabledata.
Tooling suppliers incursignificant costs forreentering and reworkingdata because the productdata they receive from theircustomers usually do notmeet the needs of toolingdesign.
Interoperability Cost Analysis of the U.S. Automotive Supply Chain
5-8
not meet the needs of the tooling design, so they have to rework itto make it useful.
5.1.3 Delay Costs
As described in Section 4, we collected information about twotypes of delay costs:
Z the lost profits due to a decline in market share and
Z the decline in the net present value (NPV) of the lost profitsdue to delay of revenues.
We asked the OEMs and the suppliers to estimate the amount bywhich development time for their products would fall ifinteroperability problems did not exist.6 Although the answersdiffered among the respondents, the average for the suppliersweighted by their revenue shares was about 4 months (from anaverage 36-month development time), and the OEMs estimated areduced development time of about 2 months. Using the moreconservative estimate provided by the OEMs, we assumed thatwithout interoperability problems, new automobile models wouldbe available 2 months earlier if no interoperability problemsoccurred.
Most respondents indicated that they experienced no significantpotential loss in market share due to delays caused byinteroperability costs, or they were not able to quantify this impact.However, because of discounting, producers may incur significantlosses even if market share and revenues are not lost, but simplyput off. Clark, Chew, and Fujimoto (1987) estimated that thediscounted present value of the profits from the introduction of anew vehicle could fall by as much as $1 million for each day ofdelay of the product introduction.7 Martin (1998) verified thisestimate via interviews with industry officials, and we used thisestimate to determine the average per-day cost of a delay inproduct introduction. 6The exact wording of the question was, “If your company/division experienced
NO data exchange problems between any of your engineering systems or withany of your suppliers or customers, by how much time do you think the designand manufacturing lead time would shorten?”
7Clark, Chew, and Fujimoto used the following assumptions: 1) A very successfulvehicle may generate gross revenues of $7.5 billion over its life: 5 years at200,000 units a year at a wholesale price of $7,500. 2) A 10 percent discountrate. 3) With labor and capital in place at the planned launch date, lost profitscould be as high as 60 percent of lost revenue.

Section 5 � Cost Estimates
5-9
On average, the three OEMs introduce about one and one-half newmodels per year (12 new models in 8 years [IRN, 1997]). A2-month delay in the introduction of these vehicles, at a cost of$1 million per day implies a $90 million annual cost for the delayof the introduction of these vehicles because of imperfectinteroperability. We were not able to assign these costs by sector.
5.2 INTEROPERABILITY COST ESTIMATES: THEAGGREGATE COST APPROACH We employed a second method to estimate interoperability costs tocorroborate the results of our component cost analysis. Our secondapproach was to interview key industry executives aboutinteroperability cost issues and to ask them to consider the scope ofall interoperability problems in their company. We asked them toprovide an estimate of the total cost of all components ofinteroperability costs.8 Their answers to this question provided thefirst component of our estimate of the aggregate costs. The secondcomponent of our aggregate approach was the cost incurred due toproduct delays, which is explained in Section 5.1.3. Together,these costs total about $1.02 billion, as shown in Table 5-3.
Table 5-3. Summary of Annual Interoperability Costs: Aggregate Cost ApproachThe aggregate cost approach provides an estimate of interoperability costs that is very similar to the cost componentapproach estimate.
Source of Cost Annual Cost ($thousands) Percent
Interoperability cost 925,602 91
Delayed profits 90,000 9
Total 1,015,602 100
5.2.1 Aggregate Interoperability Costs
The respondents’ estimates of the percent cost reductionsassociated with perfect interoperability varied significantly across
8The exact wording of the question was: “Imagine a situation in which your
company experienced no data exchange problems between any of yourengineering systems or with any of your customers or suppliers. In thissituation, by what percentage do you think the total cost of designing andmanufacturing an automobile would fall?”
We employed theaggregate cost approach tocorroborate the estimatesfrom the cost componentapproach.
Interoperability Cost Analysis of the U.S. Automotive Supply Chain
5-10
sectors and among members of the same sector. For the suppliers,the estimates ranged from less than 1 percent to 10 percent. Theaverage, weighted by the respondents’ share of revenue, was about6 percent. Estimates from the tooling suppliers ranged from3 percent to 50 percent. The weighted average was about13 percent. We were not able to obtain an estimate from the OEMsurvey respondents. Thus, the estimates provided in Table 5-3 donot include interoperability costs for the OEMs.9
Recent estimates of the cost of a major redesign of a newautomobile are about $2.5 billion (See Section 1, page 2). Weassumed that a minor redesign costs about 10 percent of a majorredesign. With about 12 major redesigns and 8 minor redesigns peryear, the auto industry spends about $32 billion per year onproduct and factory redesign. To obtain the interoperability costestimate provided in Table 5-3, we multiplied the weighted averagepercent decrease in cost for each sector by that sector’s share ofthese annual development costs.10
5.2.2 Aggregate Delay Costs
The interoperability costs shown in the first row of Table 5-3 do notinclude the lost profit due to delays caused by imperfectinteroperability. Thus, we added our estimates of delay costs, asexplained in Section 5.1.3, to the aggregate estimates ofinteroperability costs explained in Section 5.2.1.
5.3 SUMMARY AND DISCUSSION Our two approaches to estimating the cost of interoperabilityproduced very similar estimates. The cost component approachestimates that interoperability costs are about $1.05 billion peryear, while the aggregate cost approach leads to an estimate ofabout $1.02 billion per year�a difference of about 3 percent. Thesimilarity of these estimates provides some assurance that the
9 OEM delay costs are included in Table 5-3.10We assumed that product development costs are allocated among the three
major sectors of the automobile supply chain (OEMs, suppliers, and toolingsuppliers) according to their shares of total industry revenue. Thus, weassumed that OEMs incur 56 percent of development costs; suppliers incur43 percent of development costs, and tooling suppliers incur 1 percent ofdevelopment costs. We calculated their interoperability cost by multiplyingtheir share of development cost by their estimated percent decrease in cost.
Section 5 � Cost Estimates
5-11
respondents to our survey were consistent with respect to theiranswers and provides evidence that the estimates are credible.
However, recall that the aggregate cost approach does not includeestimates of the reduction of costs from the OEMs. In the costcomponent approach, over $250 million of avoidance andmitigating costs were attributed to the OEMs, yet the OEMrespondents to our survey would not provide an aggregate estimate.Thus, we might assume that, if we were able to obtain an aggregateestimate from the OEMs, the interoperability costs estimated usingthe aggregate cost approach might be at least 25 percent higherthan that of the cost component approach.
Higher costs using the aggregate cost approach may be explainedby the difficulty of detailing all of the sources of interoperabilitycost. For example, the cost component approach resulted in anestimate of avoidance and mitigating costs for the suppliers of onlyabout $240 million. However, the suppliers indicated that, withperfect interoperability, their costs would fall by, on the average,6 percent, implying a savings of almost $900 million using theaggregate cost approach. Thus, although these respondents had asense of the magnitude of the costs caused by interoperabilityproblems, they were not able to specify the actual sources of thesecosts in our survey using the cost component approach.
We consider this estimate of interoperability costs of the U.S.automotive supply chain to be conservative. The project’s scope,time and resource constraints, and data limitations prevented usfrom quantifying several sources of interoperability costs. Theseinclude the following:
Z Post-manufacturing interoperability costs. We consideredonly the interoperability costs involved in the design andmanufacture of automobiles. Interoperability problems alsooccur during other phases of the product life cycle,including marketing, after-market product support, and costanalysis.
Z Interoperability costs of small suppliers. Because ofconstraints on project time and resources, we quantifiedinteroperability costs to the OEMs, large suppliers, andtooling suppliers. However, smaller suppliers may alsoincur some.
Z In-house investments in interoperability solutions. Becauseof the unavailability of data, we were unable to quantify allof the industry’s investments in the development of
Although our two methodsfor estimatinginteroperability costproduced similar estimates,the aggregate costapproach does not includea potentially significantportion of OEM costs.

Interoperability Cost Analysis of the U.S. Automotive Supply Chain
5-12
interoperability solutions. These investments may besubstantial. For example, GM’s investment in its STEPTranslator Center is not included in our estimates.
Z Costs to consumers resulting from delays. Interoperabilityproblems delay the introduction of new and redesignedautos. Our estimates do not include consumers’ welfarelosses resulting from delays in the availability of new andimproved products.
Z Loss of market share resulting from delays. Wehypothesized that the U.S. auto industry could suffer a lossof market share resulting from interoperability delays, whichcould lead to a loss of profits to the industry. We were notable to quantify these lost profits; however, they probablyare minimal. Most of our interviewees indicated that theyprobably did not lose market share due to delays, and that ifthey had they could not quantify the impact.

6-1
Market Barriers and6 Roles for NIST
Imperfect interoperability costs the U.S. automotive supply chainabout $1 billion per year. The largest component of these costs ismitigating costs, such as the labor required to repair incomplete orinaccurate models and manually enter or reenter data when otherdata translation methods are inadequate or not available.Avoidance costs such as redundant software, translationoutsourcing, and investments in interoperability solutions furthercontribute to the burden of imperfect interoperability on theindustry. Finally, imperfect interoperability causes delays in themarket introduction of new and redesigned models, which imposesfurther costs on the industry and on consumers.
These costs pose a significant challenge to the competitiveness ofthe U.S. automotive industry. While overseas automakers areexperiencing similar problems,1 it is widely recognized that solvinginteroperability problems can improve competitiveness by reducingcosts and cycle time.
Other industries may also benefit from improving interoperability indesign and manufacturing. Shipbuilding, aerospace, farmmachinery, and construction equipment are a few of the industriesthat also incur costs resulting from imperfect interoperability. Ourestimates of interoperability costs in the automotive supply chainare about 0.3 percent of the 1996 total value of shipments for SIC3711 (Motor Vehicle and Car Bodies) and 3714 (Motor VehicleParts and Accessories) (U.S. Department of Commerce, 1998). If
1A recent press release by Opel estimates that data translation problems alone cost
the German auto industry at least several million marks per year (Strub, 1998b).
Interoperability Cost Analysis of the U.S. Automotive Supply Chain
6-2
the annual interoperability cost percentage in these other industriesis similar, costs could be as high as $400 million per year.2
Currently available data translation methodologies cannot solveinteroperability problems. As discussed in Section 3, single-systemstandardization, point-to-point translation, and neutral formattranslators (IGES and DXF) are costly and inadequate tosignificantly reduce the costs of imperfect interoperability.
STEP has a great deal of potential for improving interoperability andreducing costs. As discussed in Section 3, several organizationshave tested STEP translators and found that they usually performedbetter than alternative translators. However, before STEP can reachits potential for solving these problems, further development andimprovement of STEP translation software is required.
Despite the industrywide agreement that a neutral format such asSTEP holds the best potential solution to interoperability problems(McEwan, 1995), industry has been slow to act on its own todevelop and promote STEP as an interoperability solution. Thissection describes the source of this inaction and NIST’s role inaddressing these problems and in encouraging the developmentand diffusion of STEP.
6.1 MARKET FAILURE IN THE DEVELOPMENT OFINTEROPERABILITY SOLUTIONSIndustry often is reluctant to invest in infratechnologies such asstandards and software that promote the development and adoptionof standards. Like many forms of R&D, infratechnologies, tovarying degrees, have the characteristics of a public good.Rationing of such goods is undesirable because they are nonrival inconsumption; that is, consumption of a public good does notimpose costs on society because it does not reduce the amount ofthe good available to others. Further, the benefits of thedevelopment of these technologies are nonappropriable because it
2This scenario is based on the 1996 total value of shipments for the following SIC
codes: 3721 (Aircraft); 3724 (Aircraft Engines and Engine Parts), 3728 (AircraftParts and Auxiliary Equipment, n.e.c.); 3761 (Guided Missiles and SpaceVehicles); 3764 (Space Propulsion Units and Parts), 3769 (Space VehicleEquipment, n.e.c.); 3731 (Ship Building and Repairing); 3523 (Farm Machineryand Equipment); and 3531 (Construction Machinery) (U.S. Department ofCommerce, 1998).
Standards and the softwarethat embody them areinfratechnologies thatsupport technologydevelopment andapplication. Industrytypically is reluctant toinvest in infratechnologies.

Section 6 — Market Barriers and Roles for NIST
6-3
is difficult or impossible to exclude those who do not pay for theinfratechnologies from benefiting from them. They typically areembodied in processes, techniques, and standards, rather than inproducts that can be sold. As a result of these characteristics,public goods are typically underprovided by private markets ascompared to their socially optimal levels of provision (Tassey,1997).
The private sector might also underinvest in infratechnologiesbecause of their inherent technical and market uncertainty and risk.Lack of information about the potential benefits and costs ofdeveloping an infratechnology make it difficult for decisionmakersto assess the expected value of their investment. Infratechnologiesoften carry high technical risk, which can also reduce privateinvestment in favor of less risky projects, even when the expectedrate of return is high (Tassey, 1997).
We spoke informally with members of the Auto Industry ActionGroup (AIAG) and with other industry executives to discuss theauto industry’s lack of action in addressing interoperabilityproblems. These automotive industry executives cited three majorreasons for the lack of action within the industry on this issue.Below, we elaborate on these sources of market failure.
6.1.1 Nonappropriability of Benefits
Because all members of the automotive supply chain would benefitfrom developing and adopting a standard neutral format for PDE,no individual firm has the incentive to invest the substantialresources necessary to develop and promote the standard.Although the OEMs recognize the value of the development andadoption of such a standard, they think that the first-tier suppliersshould be more active in investing in its development andadoption. However, the first-tier suppliers claim they lack theresources to make the substantial investment required. Theyunderstand that the OEMs will also benefit from improvedinteroperability and feel that the costs should be shared as well.
6.1.2 Technical and Market Risk
The development and diffusion of STEP throughout the automotivesupply chain is limited by the risks faced by both the developers ofSTEP translation software and its potential users in the automotive
Interoperability Cost Analysis of the U.S. Automotive Supply Chain
6-4
supply chain. The software developers face significant technical riskbecause the development of STEP-compliant translation software istechnically difficult and expensive. They face uncertainty duringthe development process regarding whether their software will beSTEP-compliant.
The market risk faced by these software developers is caused by theuncertainty regarding whether STEP will emerge as the industry’sstandard method for promoting interoperability. Developing astandard and promoting its adoption require cooperation andagreement among many companies. Rivalries among competitors,as well as differences in their potential gain from agreeing on astandard, may prevent this cooperation. The companies that supplyCAD/CAM software to the automotive industry might argue thatsingle-system standardization is the best solution—as long as thesystem chosen is theirs. They are motivated to prevent the adoptionof a neutral format standard because the current system of OEMsrequiring neutral format exchanges feeds the industry’s demand fortheir products. This type of competitive rivalry is a common failureof consortia attempting to solve common industry problems(Tassey, 1992).
Members of the automotive supply chain that use CAD/CAMtranslation software also face significant technical and market risk.They face uncertainty regarding the performance of the softwarewith respect to the standard. Although most of the major softwarevendors that supply the automotive industry have released STEPtranslation software, users are still skeptical about the performanceof the software and its value to users. Users also face uncertaintyabout the industry’s acceptance of STEP. The value of a company’sinvestment in STEP translation software will increase if its partners,customers, and suppliers also adopt STEP. However, as explainedabove, industry-wide adoption may be difficult to accomplish.
6.1.3 Need for Unbiased Expertise
Finally, developing and promoting an industry standard requireunbiased expertise that the members of the automotive supplychain do not possess, individually or collectively. Becausedeveloping and promoting standards are not part of the industry’score business, they need assistance from outside experts. Tomaximize the acceptance of the standard by all members of the
Both developers ofSTEP translationsoftware and itsusers face marketrisk caused by theuncertaintyregarding whetherSTEP will emerge asthe industry’sstandard method forpromotinginteroperability.

Section 6 — Market Barriers and Roles for NIST
6-5
industry, industry must believe that the experts will not promoteone company’s interests over another’s in the process of developingand promoting standards. Thus, the experts’ reputation forunbiased standards-setting and research is an important factor inthe success of the standard.
6.2 POTENTIAL FUTURE ROLES FOR NISTNIST’s participation in the development of STEP can address themarket failures cited above. NIST continues to support thedevelopment of STEP by acting as a catalyst in developing thestandards, tools, and practices necessary to advance STEP in theautomobile industry.
By assisting in the development of STEP as an industry standard,NIST reduces the uncertainty and risk associated with the autoindustry’s investment in STEP. Confident that STEP will become anaccepted industry standard, the OEMs, suppliers, and softwaredevelopers can move ahead with STEP development and testing. Inaddition, by helping to demonstrate the benefits of STEP throughprograms such as the AutoSTEP pilot program, NIST helps to reduceindustry’s perceived technical risk associated with investments inSTEP.
Second, NIST’s activities in developing conformance testingpractices helps to improve the quality of the STEP software, furtherreducing the technical risk to both the software industry and theauto industry users of that software. Software developers can verifythat their software conforms with STEP protocols during thedevelopment stage, reducing the risk that the software will needmajor revisions later in the development process. Auto industryusers can verify that the software they purchase conforms withSTEP; this reduces the buyer’s uncertainty and transaction cost.
Finally, NIST provides expertise regarding the development andimplementation of standards. By continuing to participate in thedevelopment of STEP’s application protocols and implementationprototypes, NIST lends credibility to the STEP development processand improves the process of standards implementation.
By participating in the development and deployment of standards-based interoperability solutions in the automobile industry, NIST
NIST advances theimplementation of STEP inthe auto industry byreducing technical andmarket risk and by lendingits expertise to thestandards development andimplementation process.

Interoperability Cost Analysis of the U.S. Automotive Supply Chain
6-6
can play a significant role in reducing the $1 billion per year costimposed on the automotive supply chain by imperfectinteroperability. Continued industry investment is necessary if STEPimplementation is to minimize the costs of imperfectinteroperability. In conjunction with manufacturers and softwarevendors, NIST can help eliminate the sources of market failure thathave slowed the adoption of open, nonproprietary interoperabilitysolutions.
R-1
References
Auto and Auto Parts: Industry Survey. January 9, 1997. “Big ThreeStill Dominate U.S. Market but Transplants Take Root.”
Automotive Industry Action Group (AIAG). November 1997a.“Product Data Exchange in Automotive Supply Chains-AutoStep at the Midpoint.” Southfield, MI: AutomotiveIndustry Action Group.
Automotive Industry Action Group (AIAG). October 1997b. “ASnapshot of Product Development Practices in AutomotiveSupply Chains.” Southfield, MI: Automotive IndustryAction Group.
Automotive Industry Action Group (AIAG). August 1998. “BestPractices in Supply Chain Product Development.”Document D-11. Southfield, MI: Automotive IndustryAction Group.
Automotive News Europe. December 22, 1997. “Platforms areFewer, but More Flexible.” 2(26):6.
Automotive News. 1997a. 1997 Market Data Book. Detroit:Marketing Services Inc.
Automotive News. June 16, 1997b. “Nissan Sets Mark forEfficiency.” Detroit: Marketing Services Inc.
Automotive News. 1998a. 1998 Market Data Book. Detroit:Marketing Services Inc.
Automotive News. March 30, 1998b. “Top 150 OEM PartsSuppliers to North America.” Detroit: Marketing ServicesInc.
Interoperability Cost Analysis of the U.S. Automotive Supply Chain
R-2
Automotive Parts and Accessories Association (APAA). 1998.“Standard for Exchange of Product Model Data (STEP).”Available at <http://www.apaa.org/step.html>.
Brooke, Lindsay. 1998. “Unibody vs. Body-on-Frame; Sport-UtilityFrames; Includes Related Articles on Low-Cost Sport UtilityVehicles and Frame Styles.” Lexis-Nexis AcademicUniverse 178(1):32. <http://web.lexis-nexis.com/univers…5=6e903b1dd9914cad980fbeb0942b547a>.
Buchholz, Kami. 1996. “Simultaneous Engineering Saves Timesand Money.” 104(11):97. Lexis-Nexis Academic Universe178(1):32. <http://web.lexis-nexis.com/univers…5=97d827356946a181ae480b0eb7207546>.
Chilton Company. 1997. “Automotive Industries Annual SourceGuide.” Available at <http://ai.chilton.net>.
Clark, Kim B., W. Bruce Chew, and Takahiro Fujimoto. 1987.“Product Development in the World Auto Industry.” InBrookings Papers on Economic Activity, M.N. Baily andC. Winston (eds.), pp. 729-781. Washington, DC: TheBrookings Institution.
Chrysler Corp. January 23, 1998. Annual Report on Form 10K foryear ended December 31, 1997. Edgar Database.<http://www.sec.gov/Archives/edgar/data/791269/0000950124-98-000347.txt>.
Dauch, Richard E. 1993. “Passion for Manufacturing.”Dearborne, MI: Society of Manufacturing Engineers.
Doty, Rossel. 1994. “Open Systems: The Next STEP.” Action LineJanuary/February:30-33.
Fine, Charles H., and Daniel Whitney. February 1996. “Is theMake or Buy Decision Process a Core Competitiveness?”Working paper. Cambridge, MA: MIT Center forTechnology, Policy, and Industrial Development.
Fleischer, Mitchell. March 1997. “STEP Update.” AutomotiveManufacturing and Production 109(3):22.
Fleischer, Mitchell, Fredrick Nicholas, and Thomas Phelps. 1997.AutoSTEP Case Study Report: Costs of Multiple CADSystems. Southfield, MI: Automotive Industry ActionGroup (AIAG).

References
R-3
Fleischer, Mitchell, Thomas Phelps, and Michael Ensing. March12, 1991. CAD/CAM Data Problems and Costs in the Tooland Die Industry. A Report on a Study Conducted for theMichigan Modernization Service by Industrial TechnologyInstitute and the Detroit Chapter of the National Toolingand Machine Association.
Flynn, Michael S., Bruce M. Belzowski, Bram Bluestein, MichaelGer, Manfred Tuerks, and John Waraniak. 1996. “The 21st
Century Supply Chain: Changing Roles, Responsibilitiesand Relationships in the Automotive Industry.” Chicago:A.T. Kearney, Inc.
Ford Motor Co. March 18, 1998. Annual Report on Form 10K foryear ended December 31, 1997. Edgar Database.<http://www.sec.gov/Archives/edgar/data/37996/0000037996-98-000014.txt>.
Frechette, Simon. 1997. “STEP Implementation: Solid ModelExchange Results in the AutoSTEP Pilot Project.” Agilityand Global Competition 1(3):1-12.
Frechette, Simon. June 23, 1998. “STEP Testing andCertifications.” Presentation made at STEP Success Daysponsored by AIAG and PDES, Inc.
Gale Research Inc. 1997. Ward’s Business Directory of U.S.Private & Public Companies, 1998. Detroit: Gale ResearchInc.
Garcia, Tom, NTMA, personal communication with AlanO’Connor, Research Triangle Institute, October 2, 1998.
General Motors Corp. March 20, 1998. Annual Report on Form10K for year ended December 31, 1997. Edgar Database.<http://www.sec.gov/Archives/edgar/data/40730/0000950124-98-001456.txt>.
Greenwald, John. 1998. “Bigger—The New ’99 Models FeatureHigh-Tech Marvels and Some of the Best Price Value inYears.” Time 152(18).
Hausman, Jerry. 1997. “The Effect of New Services inTelecommunication.” MIT Working Paper.
Hoover’s Inc. 1998. Hoover’s Company Capsules. Austin, TX:Hoover’s Inc.
Information Access Corporation. 1998. Business Index [computerfile]. Foster City, CA: Information Access Corporation.

Interoperability Cost Analysis of the U.S. Automotive Supply Chain
R-4
IRN, Inc. December 1997. “Product Life Cycles.” Grand Rapids,MI.
Jost, Kevin. 1998. “Chrysler Redesigns Its Large Cars for 1998.”Lexis-Nexis Academic Universe 106(1):10.<http://web.lexis-nexis.com/univers…5=21777aca18ea2177704ce765373ec3d>.
Leech, David P., and Albert N. Link. April 1995. An EconomicEvaluation of NIST’s Research in Real-time Control System(RCS) Architecture: A Case Study Approach. 95-2 PlanningReport. Arlington, VA: TASC, Inc.
Link, Albert N. November 1995. An Economic Evaluation of theSpectral Irradiance Standard. 95-5 Planning Report.
Martin, Norman. 1998. “Putting the Tools to Work; AutomobileCompany Design Platforms; Includes Related Article onAmerican Manufacturers.” Lexis-Nexis Academic Universe178(9):105. <http://web.lexis-nexis.com/univers…5=7ae9d52b10e7e852d5d723e0b188cc40>.
McEwan, I. January 1995. “In STEP with Suppliers: GM’sPerspective on Product Data Exchange.” Excerpt from aspeech given at AutoFact ’94. PRONews.<http://www.scra.org/uspro//events/gm_persp.html>.
National Institute of Standards and Technology (NIST). 1997.“Cost Modeling: Economic Loss Due to CAD/CAM FileIncompatibility in the Automotive Industry.” NISTpresentation.
Office of Management and Budget. 1995. “Guidelines andDiscount Rates for Benefit-Cost Analysis of FederalPrograms.” Memorandum for Heads of ExecutiveDepartments and Establishments. OMB Circular No. A-94,Revised.
PDES, Inc. 1997a. “Boeing Implements STEP as ProductionExchange Process with Three Engine Companies.”<http://www.scra.org/pdesinc/boeing_press.html>. News release dated August 22, 1997.
PDES, Inc. 1997b. “Delco Electronics Corporation SuccessfullyImplements STEP for Internal Data Exchange.”<http://www.scra.org/pdesinc/delco_press.html>. Newsrelease dated November 6, 1997.
PDES, Inc. 1997c. “General Motors STEP Translation Center.”<http://www.scra.org/pdesinc/pilots/step_tran.html>.
References
R-5
PDES, Inc. 1998. “Results of STEP Testing in the U.S. AutomotiveIndustry.” Summary sheet.
Phelan, Mark. 1997. “Sprechen Sie Megasupplier.” AutomotiveIndustries June:71-75.
Sawant, A.V., and J.N. Nazemetz. 1998. “Impediments to DataExchange and Use of STEP for Data Exchange.” Paperdeveloped under the Computer Assisted TechnologyTransfer (CATT) research program. Contract numberF34601-95-D-00376. Oklahoma State University workingpaper.
Smith, Bradford. 1989. “Product Data Exchange: The PDESProject—Status and Objectives.” NISTIR 4165.Gaithersburg, MD: National Institute of Standards andTechnology. <http://www.mel.nist.gov/msidlibrary/summary/8921.html>.
Sorge, Marjorie. 1998. “Ford Finds Its Global Focus.” Lexis-NexisAcademic Universe <http://web.lexis-nexis.com/univers…5=0f229e4b10ecf10cfe2cc2b21cb8251f>.
Strub, Mike. 1998a. “Get in STEP.” Action LineJanuary/February:16-18.
Strub, Mike. October 6, 1998b. Memorandum to AutoSTEPexploder.
Target. 1994. “Are You Prepared for the Information Based GlobalEconomy? STEP Towards the Future.” Target 10(1):30.
Tassey, Gregory. 1992. Technology Infrastructure and CompetitivePosition. Norwell, MA: Kluwer Academic Publishers.
Tassey, Gregory. 1997. The Economics of R&D Policy. Westport,CT: Quorum Books.
U.S. Department of Commerce. June 1995. 1992 Census ofManufactures. MC92-I-35H and MC92-I-35H. Washington,DC: U.S. Government Printing Office.
U.S. Department of Commerce. February 1998. 1996 AnnualSurvey of Manufactures. M96(AS)-1. Washington, DC:U.S. Government Printing Office.
U.S. Department of Commerce, Bureau of Economic Analysis(BEA). 1998. “National Accounts Data.” Washington, DC:Bureau of Economic Analysis.<http://www.bea.doc/bea/dn/niptbl-d.htm>.

Interoperability Cost Analysis of the U.S. Automotive Supply Chain
R-6
U.S. Department of Labor (DOL). 1996a. “OccupationalCompensation Survey. National Summary, 1996”. Bulletin2497. Bureau of Labor Statistics. Washington DC.
U.S. Department of Labor (DOL). 1996b. “Employer Costs forEmployee Compensation – March 1996”. News Releasedated October 10, 1996. Bureau of Labor Statistics.Washington DC.
Ward’s Communications. 1997. Ward’s Automotive Yearbook.59th Edition. Detroit: Ward’s Communications.
Whitney, Daniel. October 1995. State of the Art in the UnitedStates of CAD Methodologies for Product Development.Final report under grants from Office of Naval Research andthe National Science Foundation. Cambridge, MA: MIT,Center for Technology, Policy and Industrial Development.
Womack, James P. 1989. “The U.S. Automobile Industry in an Eraof International Competition: Performance and Prospects.”MIT Commission on the Industrial Productivity workingpaper.
Womack, James P., Daniel T. Jones, and Daniel Roos. 1990. TheMachine that Changed the World. New York: RawsonAssociates.