Interobserver Agreement, Intraobserver Reliability, and ...Reliability, and the Rorschach...
33
ARTICLES Interobserver Agreement, Intraobserver Reliability, and the Rorschach Comprehensive System Marvin W. Acklin, Claude J. McDowell II, Mark S. Verschell, and Darryl Chan Honolulu, Hawaii Interrater agreement and reliability for the Rorschach have recently come under in- creasing scrutiny. This is the second report examining methods of Comprehensive System reliability using principles derived from observational methodology and ap- plied behavioral analysis. This study examined a previous nonpatient sample of 20 protocols (N = 412 responses) and also examined a new clinical sample of 20 proto- cols (N = 374 responses) diagnosed with Research Diagnostic Criteria. Reliability was analyzed at multiple levels of Comprehensive System data, including response- level individual codes and coding decisions and ratios, percentages, and derivations from the Structural Summary. With a number of exceptions, most Comprehensive System codes, coding decisions, and summary scores yield acceptable, and in many instances excellent, levels of reliability. Limitations arising from the nature of Ror- schach data and Comprehensive System coding criteria are discussed. In this article, we report on the latest in a series of studies undertaken to examine and improve the performance of the Rorschach Inkblot Test as a clinical and re- search instrument (Acklin, McDowell, & Ornduff, 1992; McDowell & Acklin, 1996). The Rorschach relies on the application of a complex coding system to sam- ples of verbal behavior to yield data for clinical and research purposes. As such, the Rorschach is less a test than a behavioral observation methodology (McDowell & Acklin, 1996). The Comprehensive System was developed by Exner (1990, 1991, 1993, 1995; Exner & Weiner, 1994) to standardize Rorschach observation (i.e., ad- ministration) and coding procedures, and it remains the focus of ongoing investiga- tion and refinement. JOURNAL OF PERSONALITY ASSESSMENT, 74(1), 15–47 Copyright © 2000, Lawrence Erlbaum Associates, Inc.
Transcript of Interobserver Agreement, Intraobserver Reliability, and ...Reliability, and the Rorschach...

ARTICLES
Interobserver Agreement, IntraobserverReliability, and the Rorschach
Comprehensive System
Marvin W. Acklin, Claude J. McDowell II,Mark S. Verschell, and Darryl Chan
Honolulu, Hawaii
Interrater agreement and reliability for the Rorschach have recently come under in-creasing scrutiny. This is the second report examining methods of ComprehensiveSystem reliability using principles derived from observational methodology and ap-plied behavioral analysis. This study examined a previous nonpatient sample of 20protocols (N = 412 responses) and also examined a new clinical sample of 20 proto-cols (N = 374 responses) diagnosed with Research Diagnostic Criteria. Reliabilitywas analyzed at multiple levels of Comprehensive System data, including response-level individual codes and coding decisions and ratios, percentages, and derivationsfrom the Structural Summary. With a number of exceptions, most ComprehensiveSystem codes, coding decisions, and summary scores yield acceptable, and in manyinstances excellent, levels of reliability. Limitations arising from the nature of Ror-schach data and Comprehensive System coding criteria are discussed.
In this article, we report on the latest in a series of studies undertaken to examineand improve the performance of the Rorschach Inkblot Test as a clinical and re-search instrument (Acklin, McDowell, & Ornduff, 1992; McDowell & Acklin,1996). The Rorschach relies on the application of a complex coding system to sam-ples of verbal behavior to yield data for clinical and research purposes. As such, theRorschach is less a test than a behavioral observation methodology (McDowell &Acklin, 1996). The Comprehensive System was developed by Exner (1990, 1991,1993, 1995; Exner & Weiner, 1994) to standardize Rorschach observation (i.e., ad-ministration) and coding procedures, and it remains the focus of ongoing investiga-tion and refinement.
JOURNAL OF PERSONALITY ASSESSMENT,74(1), 15–47Copyright © 2000, Lawrence Erlbaum Associates, Inc.

The merits of assessing the reliability of diagnostic tests and classificationsystems are prominent within psychometric theory (Jensen, 1959) and likelydate back to the earliest history of psychiatric diagnosis (Matarazzo, 1983).However, the earliest empirical attempts to measure the reliability of behavioralobservational systems were not conducted until the early to mid-20th century(i.e., 1930–1965). Most, if not all, of these early studies were flawed in their sta-tistical designs, as they employed reliability measures (e.g., percentage agree-ment and contingency coefficients) that did not take into account the effects ofbehavior prevalence and chance agreement or give credit for associated observa-tions that were not in strict agreement (Shrout, Spitzer, & Fleiss, 1987). Cohen’skappa (1960) was introduced to overcome the weaknesses of these measures,and it has since become the standard method for assessing diagnostic agreementin psychiatry and other medical specialties. A standard approach for assessingthe reliability of the Rorschach Comprehensive System, however, has yet to beestablished.
Historically, a variety of statistical techniques have been used in Rorschach re-liability research, including phi (φ), the product–moment correlation (r), and pro-portion of agreement (PA). Despite opposing psychometric literature, Weiner’s(1991) editorial guidelines established the percentage agreement index as the stan-dard reliability measure for research studies submitted to theJournal for Personal-ity Assessment.More recent applied research papers have used Cohen’s kappa (κ)and the intraclass correlation coefficient (ICC) for selected Comprehensive Sys-tem variables (Greco & Cornell, 1992; Netter & Viglione, 1994; Perry & Braff,1994; Perry, McDougall, & Viglione, 1995; Perry, Sprock, et al., 1995; Perry &Viglione, 1991). Relatively few studies, however, have outlined the conceptualand methodological foundations for the application of these various reliabilitytechniques to the Rorschach Comprehensive System.
In the absence of a standardized methodology for assessing the reliability ofComprehensive System data, technical scrutiny and criticism of Exner’s methodshaveemerged(e.g.,Wood,Nezworski,&Stejskal,1996a).Woodandhiscolleaguespointed out the conceptual and procedural vagaries inherent in published ap-proaches to Comprehensive System reliability. In particular, they noted the use ofinadequate statistical methods, as well as an absence of data documenting the reli-ability of Comprehensive System summary scores. Working separately, McDowelland Acklin (1996) similarly concluded that Comprehensive System reliability hadnot been established using appropriate statistical methods. Recent debates pub-lished in Psychological Science(Exner, 1996; Wood, Nezworski, & Stejskal,1996a, 1996b) andPsychological Assessment(Meyer, 1997a, 1997b; Wood,Nezworski, & Stejskal, 1997) regrettably did not resolve the issues in dispute.
Conceptual inconsistencies and statistical confusion (Suen, 1988) have compli-cated dialogue concerning the appropriate terms and procedures for assessing thereliability of the Rorschach Comprehensive System (e.g., witness the recent inter-
16 ACKLIN, M CDOWELL, VERSCHELL, CHAN
change between Exner, 1996, and Wood et al., 1996a, 1996b). In the context of be-havioral assessment, Cone (1982) noted that
The current looseness of terms and their inconsistent usage retards the developmentof the precision necessary for [behavioral assessment] to advance. … One area par-ticularly in need of [distinctions and clarifications] is direct observation methodol-ogy. … Distinguishing accuracy from agreement and reliability and validityillustrates some obvious needs of a lexicon of behavioral assessment. (pp. 2–3)
In an attempt to clarify these issues for the Rorschach Comprehensive System, wepropose a reliability framework that is informed by modern behavioral observationmethodology.
BEHAVIORAL OBSERVATION PARADIGM
Indefiningabehavioralobservationparadigm, it isnecessary todistinguishbetweenthe nature and interpretation of data (Suen, 1988). The nature of Rorschach data en-compassesbothnomothetic traitand idiographicbehaviorapproachestopersonalityassessment(Weiner,1998).Closelyrelatedto thenatureofbehavioralobservationaldata are interpretations based on either criterion-referenced or norm-referencedmeasurement frameworks (Suen, 1988). We propose that Comprehensive Systemdata are interpreted within a criterion-referenced rather than a norm-referencedframework. This distinction is by no means insignificant, as criterion-referencedmeasurement frameworkstendtoyield lowerestimatesofdatareliabilityduetotheirinclusion of observers as a source of systematic observation error (McGraw &Wong, 1996; Suen, 1988). Although this viewpoint may sound counterintuitive, thepsychometric literature (e.g., Suen & Ary, 1989; Tinsley & Weiss, 1975) seemsrather clear:
Thus, when decisions are based on themean[italics added] of the ratings obtainedfrom a set of observers, or on ratings which have beenadjusted[italics added] for raterdifferences (such as ranks orZscores), the interjudge variance should not be regardedas error. On the other hand … if the investigator wishes his results to be generalizableto other samples of judges using the same scale with a similar sample of subjects, thebetween-raters variance should be included as part of the error term. (Tinsley &Weiss, 1975, p. 363)
With regard to the common measures of observer reliability, percentage agreementand kappa treat systematic observer bias as error, contingency coefficients and theproduct–moment correlation do not, and ICCs may or may not depending onwhether correlation is measured using a consistency or absolute agreement defini-tion of correlation (McGraw & Wong, 1996; Suen, 1988).
RORSCHACH RELIABILITY 17
LEVELS OF RELIABILITY ANALYSIS
The Comprehensive System yields a plethora of behavioral observation data. Ob-servation procedures produce samples of verbal behavior that correspond to the re-sponses given to the Rorschach inkblots. Individual codes are applied to targetbehaviors (i.e., key words) within each response, and then are tabulated, summed,and combined to form interpretive indexes that describe a composite Rorschachprotocol. A conceptual scheme for organizing response-level verbal behaviors(e.g., Location, Developmental Quality, and Determinant segments) facilitates theprocesses of both behavioral coding and data interpretation.
Critics of the Rorschach Comprehensive System have decried the fact that thereis no published research demonstrating the reliability of aggregate codes and inter-pretive indexes from the Structural Summary (e.g., SumT,3r+(2)/R, DEPI). In par-ticular,Woodetal. (1996a,1996b,1997)assertedthatacceptable levelsof reliabilityfor response-level codes are insufficient to justify the reliability of protocol-levelcomposite scores. In contrast, Meyer (1997a) argued that data representing sum-maryscoresshouldbemore reliable thandata representing response-level codesbe-cause psychometric theory predicts that random errors of measurement will tend tocancel on aggregation. Our review of the relevant literature suggests that the answerto thisdebatedependsonthestatisticalapproachthat isusedtoevaluatedatareliabil-ity. In most cases, correlation coefficients (e.g., the intraclass correlation and theproduct–moment correlation) and correlational-like coefficients (e.g.,φ andκ) willproduce response-level reliability estimates that provide a lower bound estimate oftotal score reliability (e.g., Berk, 1979; Hartmann, 1977). Conversely, estimates ofresponse-level reliability derived via percentage agreement statistics will not dem-onstrate a formal relation to total score reliability (Hartmann, 1977). Because the re-lation between response-level reliability and protocol-level reliability is neverabsolute and is complicated by summary scores that are derived from multiple com-ponent codes, the analysis of both levels of Comprehensive System data appears tobe warranted.
CONCEPTUAL FOUNDATIONS OF RELIABILITY
Within the context of behavioral assessment, reliability indexes provide a means toevaluate the effectiveness of observer training and the objectivity with which targetbehaviors may be measured (Berk, 1979): “Conventionally, reliability is most com-monly defined asdata(not observer) consistency. The term reliability refers to thedegree to which measurement error is absent from the data. The less measurementerror, the more consistent the data” (Suen, 1988, p. 348). Relative to observers assources of error, data consistency has been assessed through two primary ap-proaches: between-observer reliability (i.e., interobserver agreement) and within-
18 ACKLIN, M CDOWELL, VERSCHELL, CHAN

observer reliability (i.e., intraobserver reliability;Suen,1988,p.349). Interobserveragreement indexes (e.g., proportion agreement,φ, andκ) are usually applied to dataat thenominalandordinal levelsofmeasurementandprovidean indicationof thede-gree to which observers are interchangeable (Suen, 1988). Intraobserver reliabilityindexes (e.g., the ICC) may be applied to data that approximate interval-level mea-surementandprovidean indicationof thedegreetowhichobservationaldataare freefrommeasurementerror (Suen,1988).Although indexesof intraobserver reliabilitytend to provide more rigorous analyses of observer consistency than do indexes ofinterobserver agreement (Berk, 1979),1 interobserver agreement indexes representthe only means for assessing the reliability of polychotomous nominal data.Hence, with specific regard to the Rorschach Comprehensive System, it wouldseem appropriate to apply intraobserver reliability indexes to protocol-level sum-mary scores and response-level data that are coded in dichotomous fashion and toapply interobserver agreement indexes to response-level data that are coded inpolychotomous fashion.
STATISTICAL APPROACHES
In a series of important training studies, DeCato (1983, 1984, 1994) was one of thefirst researchers to methodologically examine the reliability of Rorschach codingusing the kappa coefficient. More recently, McDowell and Acklin (1996)operationalized principles from applied behavioral analysis and used Cohen’skappa to examine the reliability of response-level Comprehensive System data in asample of nonpatient protocols. In addition to demonstrating respectable levels ofresponse-level observer reliability, McDowell and Acklin suggested thatkappa,aPA coefficient corrected for chance agreement, produced more accurate reliabilityestimates than the PA index alone, a fact of potential importance in the effort to re-fine the reliability, validity, and utility of the Comprehensive System. Conse-quently, and consistent with most expert commentary in the field (e.g., Suen & Ary,1989), McDowell and Acklin suggested that Cohen’s kappa is the method of choicefor quantifying response-level reliability in the Rorschach Comprehensive System.
This study extended McDowell and Acklin’s (1996) previous ComprehensiveSystem reliability analyses by (a) organizing response-level data according to adecision-based coding methodology; (b) examining aggregate codes, ratios, per-centages, and derivations from the Structural Summary; (c) examining the relationbetween response-level reliability, base rate, and quantification method; and (d)
RORSCHACH RELIABILITY 19
1In addition to noting that the Tinsley and Weiss (1975) definition ofreliability (i.e., proportional-ity of ratings) is only appropriate for norm-referenced measurement frameworks, we also note thatnominal ratings assume interval-level characteristics when coded in dichotomous fashion. Hence, thedistinction betweenagreementandreliability will hold whether one definesreliability as proportional-ity of ratings or absence of measurement error.
incorporating a new sample of clinical protocols in addition to the original sampleof nonpatient protocols. This last facet of this research design helps to establish thediscriminant validity of the Comprehensive System across varying diagnosticgroups, as it is a well-known fact that the magnitude of reliability estimates variesas a function of the phenomena observed (Haynes, 1978).
Consistent with the recommendations of the previous study, and with the con-ceptualization of response-level reliability of this study, unweighted kappa (i.e.,standard kappa) was applied to all response-level data, with the understanding thatthis coefficient may be interpreted as an index of intraobserver reliability whendata are coded in dichotomous fashion.2 For response-level data that were coded inpolychotomous fashion, kappa was most cautiously interpreted as an index ofinterobserver agreement.3
This study proposes the ICC as the method of choice for assessing the reliabilityof Comprehensive System summary scores. The intraclass correlation approachoffers several methodological advantages over other measures of intraobserver re-liability (e.g.,φ, weightedκ, and the product–moment correlation), including (a)freedom from the classical parallel test assumptions, (b) the ability to provide in-formation on the relative contributions of different sources of measurement error,and (c) the ability to estimate observer reliability within a criterion-referencedmeasurement framework (Suen, 1988). Specifically, this study uses the ICC that isbased on a two-way random effects model of variance and an absolute agreementdefinition of correlation (McGraw & Wong, 1996; Shrout & Fleiss, 1979). ThisICC is appropriate when behavioral observations are performed by raters who maydiffer in their understanding or application of the relevant behavioral coding sys-tem, as it treats systematic observer bias as a source of observation error.
METHOD
Participants
Twenty nonpatient protocols (N = 412 responses) were randomly selected from alarger sample of protocols provided by students at a midwestern university during
20 ACKLIN, M CDOWELL, VERSCHELL, CHAN
2Unweighted kappa is actually a special case of weighted kappa in which all classification disagree-ments are treated as equally serious (Soeken & Prescott, 1986). For reasonably large sample sizes anddichotomous data, kappa is equivalent to the ICC that results when a two-way analysis of variance isapplied to the data (Fleiss & Cohen, 1973).
3To interpret kappa for polychotomous nominal data as a measure of intraobserver reliability, onemust be willing to (a) assume the rather untenable classical parallel test assumptions (Bakeman, Quera,McArthur, & Robinson, 1997) or (b) perform an equally indefensible data transformation (i.e., differ-entially weighting the disagreements among the nominal ratings) that enables kappa to be interpreted asa reliability coefficient (i.e., the intraclass correlation) that is not bound by the classical parallel test as-sumptions (Fleiss & Cohen, 1973; Suen, 1988).
the years 1987 to 1989. The clinical and demographic characteristics of these par-ticipants were described in a previous report (McDowell & Acklin, 1996).
Twenty clinical protocols (N = 374 responses) were randomly selected from alarger sample of protocols obtained from psychiatric inpatients at a 56-bed, gen-eral hospital over a 4-year period from 1992 through 1995. The average age of the12 female and 8 male participants was 27.3 years (SD= 8.3). The sample was eth-nically heterogeneous (30% White, 10% African American, 20% Asian American,10% Hispanic, and 30% other). All participants received research diagnostic crite-ria (RDC; Spitzer, Endicott, & Robins, 1989) diagnoses that were based solely onchart review (i.e., independent of clinical information from the Rorschach). RDCdiagnoses (and their associated frequencies) were: schizophrenia (2), unspecifiedfunctional psychosis (2), bipolar manic (3), intermittent depressive disorder (1),major depression (2), minor depression (3), labile personality (1), drug use disor-der (4), antisocial personality (1), and other psychiatric disorder (1). Descriptivestatistics for both samples are available on request from Marvin W. Acklin.
Administration and Coding Procedures
Participants from both samples were assessed by graduate clinical psychology stu-dents who were trained in Comprehensive System administration and coding pro-cedures (Exner, 1990). Training and supervision were provided by the Marvin W.Acklin. All protocols were valid in terms of Comprehensive System guidelines forresponse productivity (R≥ 14). For the purpose of reliability analysis, the 40 proto-cols were then independently rescored by Claude J. McDowell II (as per the previ-ous study) and a graduate clinical psychology student with advanced training in theComprehensive System. Each of these raters possessed a minimum of 3 years of ex-perience in Comprehensive System coding procedures.A Rorschach Workbook forthe Comprehensive System(Exner, 1990) facilitated scoring decisions.
The Rorschach Interpretive Assistance Program, Version 3.1 (RIAP3; Exner &Ona, 1995), was used to produce structural summaries for all protocols and to ex-port protocol-level data to a statistical database program for reliability analysis.However, limitations of the RIAP3 export facility necessitated that coded re-sponses be manually entered into the statistical database for response-level reli-ability analysis. Data-checking programs were written by Mark S. Verschell tominimize errors in the data entry process.
Response-Level Coding Scheme
The process of organizing the multitude of Comprehensive System data for reli-ability analysis is a complex task, and as far as we are aware, it has never been ade-
RORSCHACH RELIABILITY 21

quately described in the Rorschach literature. In an effort to promote dialogueamong Rorschach researchers and, ultimately, the development of a standard ap-proach for evaluating Comprehensive System reliability, we present our data orga-nization scheme in explicit fashion (see also Table 1).
The nine segments of the Comprehensive System may be conceptualized asencompassing 60 specificcoding decisionsthat raters must apply to each verbalresponse. These coding decisions represent a mutually exclusive use of each in-dividual code that comprises the Comprehensive System. That is, no individualcode may be applied to more than one coding decision.Dichotomouscoding de-cisions involve a choice from among two competing coding possibilities, mostoften involving the presence or absence of one Comprehensive System code.Polychotomouscoding decisions involve a choice from among three or morecompeting coding possibilities and two or more Comprehensive System codes.Absentmay or may not be a possible coding category, depending on the natureof the specific coding decision. This organizational scheme produces one reli-ability coefficient for each of the 60 coding decisions and one reliability coeffi-cient for each of their constituent codes.
The Location segment consists of four individual codes that yield two coding de-cisions: (a) Does the response involve the whole blot (W), common detail (D), or un-usual detail (Dd); and (b) does the response involve white space area (S) or not?
TheDevelopmentalQuality segmentconsistsof three individual codes that yieldtwo coding decisions: (a) Do response percepts involve specific (o) or diffuse (v)form demand, and (b) Are response percepts involved in a meaningful relationship(+)ornot.Within thisdataorganizationscheme, (a) the individual codeDQ[o] isap-plied to all responses that involve at least one object with specific form demand, (b)the individual codeDQ[v] is applied to all responses that do not involve at least oneobjectwithspecific formdemand,and (c) the individual codeDQ[+] isapplied toallresponses that involve two or more objects in a meaningful relation, regardless ofform demand. This data organization scheme can replicate the Comprehensive Sys-temcodingcriteriausingonly three individualcodes,becausethe fourDevelopmen-tal Quality codes outlined by the Comprehensive System are in fact compositecoding categories. Explicitly, (a)DQ[+] represents cooccurrence of specific formdemand and percept synthesis (i.e., [o] and [+]); (b)DQ[o] represents specific formdemand in the absence of percept synthesis; (c)DQ[v] represents diffuse form de-mand in the absence of percept synthesis; and (d)DQ[v/+] represents the cooccur-rence of diffuse form demand and percept synthesis (i.e., [v] and [+]).
TheDeterminantssegmentconsistsof29 individual codes that yield11codingde-cisions. Six of these coding decisions involve determinants (i.e., Color, AchromaticColor, Texture, Vista, Diffuse Shading, and Reflection) with polychotomous catego-ries that reflect varying degrees of form predominance.4 For example, Does this tex-
22 ACKLIN, M CDOWELL, VERSCHELL, CHAN
4We incorporate Color Naming (CN) as a category of the color determinant.
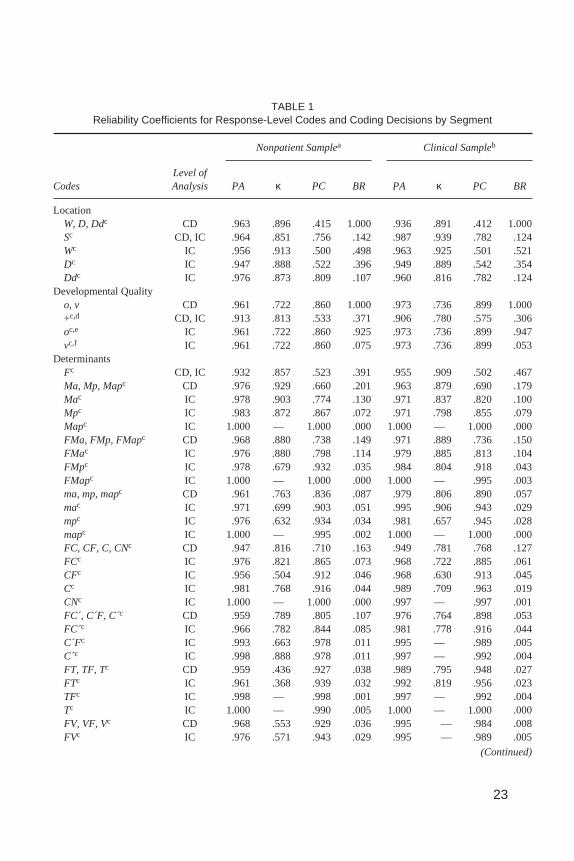
TABLE 1Reliability Coefficients for Response-Level Codes and Coding Decisions by Segment
Nonpatient Samplea Clinical Sampleb
CodesLevel ofAnalysis PA κ PC BR PA κ PC BR
LocationW, D, Ddc CD .963 .896 .415 1.000 .936 .891 .412 1.000Sc CD, IC .964 .851 .756 .142 .987 .939 .782 .124Wc IC .956 .913 .500 .498 .963 .925 .501 .521Dc IC .947 .888 .522 .396 .949 .889 .542 .354Ddc IC .976 .873 .809 .107 .960 .816 .782 .124
Developmental Qualityo, v CD .961 .722 .860 1.000 .973 .736 .899 1.000+c,d CD, IC .913 .813 .533 .371 .906 .780 .575 .306oc,e IC .961 .722 .860 .925 .973 .736 .899 .947vc,f IC .961 .722 .860 .075 .973 .736 .899 .053
DeterminantsFc CD, IC .932 .857 .523 .391 .955 .909 .502 .467Ma, Mp, Mapc CD .976 .929 .660 .201 .963 .879 .690 .179Mac IC .978 .903 .774 .130 .971 .837 .820 .100Mpc IC .983 .872 .867 .072 .971 .798 .855 .079Mapc IC 1.000 — 1.000 .000 1.000 — 1.000 .000FMa, FMp, FMapc CD .968 .880 .738 .149 .971 .889 .736 .150FMac IC .976 .880 .798 .114 .979 .885 .813 .104FMpc IC .978 .679 .932 .035 .984 .804 .918 .043FMapc IC 1.000 — 1.000 .000 1.000 — .995 .003ma, mp, mapc CD .961 .763 .836 .087 .979 .806 .890 .057mac IC .971 .699 .903 .051 .995 .906 .943 .029mpc IC .976 .632 .934 .034 .981 .657 .945 .028mapc IC 1.000 — .995 .002 1.000 — 1.000 .000FC, CF, C, CNc CD .947 .816 .710 .163 .949 .781 .768 .127FCc IC .976 .821 .865 .073 .968 .722 .885 .061CFc IC .956 .504 .912 .046 .968 .630 .913 .045Cc IC .981 .768 .916 .044 .989 .709 .963 .019CNc IC 1.000 — 1.000 .000 .997 — .997 .001FC´, C´F, C c CD .959 .789 .805 .107 .976 .764 .898 .053FC´c IC .966 .782 .844 .085 .981 .778 .916 .044C´Fc IC .993 .663 .978 .011 .995 — .989 .005C´c IC .998 .888 .978 .011 .997 — .992 .004FT, TF, Tc CD .959 .436 .927 .038 .989 .795 .948 .027FTc IC .961 .368 .939 .032 .992 .819 .956 .023TFc IC .998 — .998 .001 .997 — .992 .004Tc IC 1.000 — .990 .005 1.000 — 1.000 .000FV, VF, Vc CD .968 .553 .929 .036 .995 — .984 .008FVc IC .976 .571 .943 .029 .995 — .989 .005
(Continued)
23
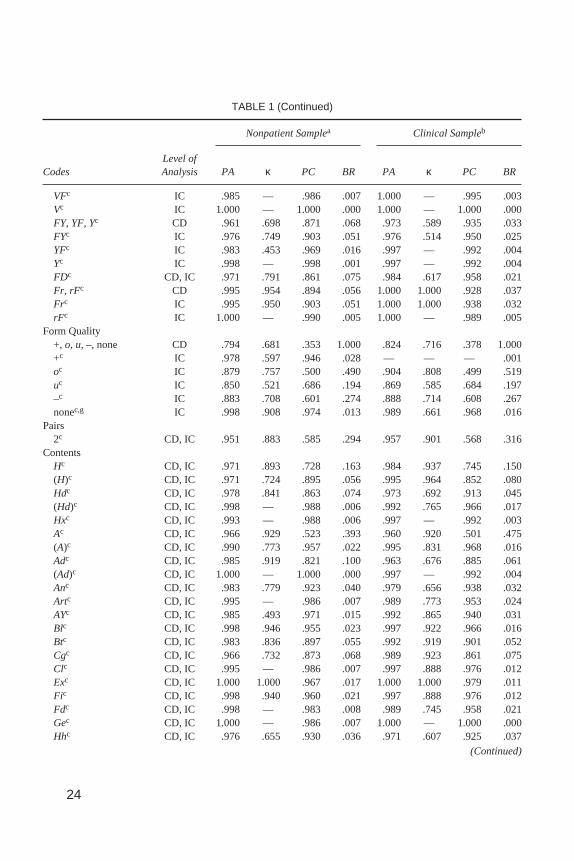
TABLE 1 (Continued)
Nonpatient Samplea Clinical Sampleb
CodesLevel ofAnalysis PA κ PC BR PA κ PC BR
VFc IC .985 — .986 .007 1.000 — .995 .003Vc IC 1.000 — 1.000 .000 1.000 — 1.000 .000FY, YF, Yc CD .961 .698 .871 .068 .973 .589 .935 .033FYc IC .976 .749 .903 .051 .976 .514 .950 .025YFc IC .983 .453 .969 .016 .997 — .992 .004Yc IC .998 — .998 .001 .997 — .992 .004FDc CD, IC .971 .791 .861 .075 .984 .617 .958 .021Fr, rFc CD .995 .954 .894 .056 1.000 1.000 .928 .037Frc IC .995 .950 .903 .051 1.000 1.000 .938 .032rFc IC 1.000 — .990 .005 1.000 — .989 .005
Form Quality+, o, u,–, none CD .794 .681 .353 1.000 .824 .716 .378 1.000+c IC .978 .597 .946 .028 — — — .001oc IC .879 .757 .500 .490 .904 .808 .499 .519uc IC .850 .521 .686 .194 .869 .585 .684 .197–c IC .883 .708 .601 .274 .888 .714 .608 .267nonec,g IC .998 .908 .974 .013 .989 .661 .968 .016
Pairs2c CD, IC .951 .883 .585 .294 .957 .901 .568 .316
ContentsHc CD, IC .971 .893 .728 .163 .984 .937 .745 .150(H)c CD, IC .971 .724 .895 .056 .995 .964 .852 .080Hdc CD, IC .978 .841 .863 .074 .973 .692 .913 .045(Hd)c CD, IC .998 — .988 .006 .992 .765 .966 .017Hxc CD, IC .993 — .988 .006 .997 — .992 .003Ac CD, IC .966 .929 .523 .393 .960 .920 .501 .475(A)c CD, IC .990 .773 .957 .022 .995 .831 .968 .016Adc CD, IC .985 .919 .821 .100 .963 .676 .885 .061(Ad)c CD, IC 1.000 — 1.000 .000 .997 — .992 .004Anc CD, IC .983 .779 .923 .040 .979 .656 .938 .032Artc CD, IC .995 — .986 .007 .989 .773 .953 .024AYc CD, IC .985 .493 .971 .015 .992 .865 .940 .031Blc CD, IC .998 .946 .955 .023 .997 .922 .966 .016Btc CD, IC .983 .836 .897 .055 .992 .919 .901 .052Cgc CD, IC .966 .732 .873 .068 .989 .923 .861 .075Clc CD, IC .995 — .986 .007 .997 .888 .976 .012Exc CD, IC 1.000 1.000 .967 .017 1.000 1.000 .979 .011Fic CD, IC .998 .940 .960 .021 .997 .888 .976 .012Fdc CD, IC .998 — .983 .008 .989 .745 .958 .021Gec CD, IC 1.000 — .986 .007 1.000 — 1.000 .000Hhc CD, IC .976 .655 .930 .036 .971 .607 .925 .037
(Continued)
24

TABLE 1 (Continued)
Nonpatient Samplea Clinical Sampleb
CodesLevel ofAnalysis PA κ PC BR PA κ PC BR
Lsc CD, IC .995 .963 .869 .070 .989 .883 .908 .048Nac CD, IC .973 .408 .955 .023 .984 .617 .958 .021Scc CD, IC .993 .796 .964 .018 .997 .946 .950 .025Sxc CD, IC .995 .798 .976 .012 .992 .892 .925 .039Xyc CD, IC 1.000 — 1.000 .000 1.000 — .995 .003Idc CD, IC .956 .677 .865 .073 .960 .645 .887 .060
PopularsPc CD, IC .956 .889 .606 .269 .973 .935 .592 .286
Organizational Quality1.0–6.5c CD .847 .811 .191 .637 .885 .856 .201 .6201.0c IC .976 .892 .776 .129 .981 .925 .751 .1462.0c IC .985 .793 .930 .036 .981 .811 .901 .0512.5c IC .961 .815 .790 .119 .971 .844 .811 .1063.0c IC .951 .696 .840 .087 .987 .902 .864 .0743.5c IC .985 .494 .971 .015 .992 .819 .956 .0234.0c IC .954 .708 .842 .086 .963 .700 .875 .0664.5c IC .978 .879 .819 .101 .992 .957 .815 .1035.0c IC .990 — .985 .007 1.000 — 1.000 .0005.5c IC .985 .856 .899 .053 .981 .819 .896 .0556.0c IC .998 — .993 .004 .997 — .997 .0016.5c IC 1.000 — 1.000 .000 1.000 — 1.000 .000
Special ScoresDV1, DV2c CD .947 .349 .918 .042 .960 .530 .915 .044DV1c IC .954 .273 .937 .033 .963 .346 .943 .029DV2c IC .990 .496 .981 .010 .992 .724 .971 .015DR1, DR2c CD .964 .304 .948 .027 .971 .713 .897 .053DR1c IC .976 .364 .962 .019 .981 .749 .925 .039DR2c IC .985 — .986 .007 .987 .540 .971 .015INC1, INC2c CD .927 .516 .850 .081 .955 .631 .877 .066INC1c IC .937 .547 .861 .075 .960 .661 .882 .063INC2c IC .988 — .988 .006 .995 — .995 .003FAB1, FAB2c CD .966 .469 .936 .033 .973 .726 .902 .051FAB1c IC .976 .432 .957 .022 .981 .657 .945 .028FAB2c IC .988 .440 .978 .011 .992 .820 .956 .023CONc CD, IC .998 — .998 .001 1.000 — 1.000 .000ALOGc CD, IC .988 — .983 .008 .989 .495 .979 .011PSVc CD, IC .990 .496 .981 .010 .981 .658 .945 .028CFBc CD, IC 1.000 — 1.000 .000 1.000 — .995 .003ABc CD, IC .990 — .986 .007 .995 .797 .974 .013AGc CD, IC .990 .862 .930 .036 .989 .795 .948 .027COPc CD, IC .971 .712 .899 .053 .984 .849 .894 .056
(Continued)
25
ture percept incorporate (a) more form features than shading features (FT), (b) moreshadingfeaturesthanformfeatures(TF),or(c)shadingfeaturesexclusively(T).Threecoding decisions involve determinants (i.e., human movement, animal movement,and inanimate movement) with polychotomous categories that reflect varying statesofperceptmovement.Forexample,are thesehumanpercepts involved in (a)anactiveformofmovement (Ma), (b)apassive formofmovement (Mp), (c)bothactiveandpas-siveformsofmovement(Ma–p),or(d)nomovement?Finally, twocodingdecisionsin-volvedeterminants (i.e., formdimensionandpure form)withdichotomouscategoriesthat reflect simple presence or absence coding. For example, is this percept basedsolely on the form features of the inkblot (F) or not?
The Form Quality segment consists of five individual codes that yield a single5
coding decision: Do the percepts involve an overelaborated (+), ordinary (o), un-usual (u), arbitrary (–), or no (none) use of the inherent form features within eachinkblot?
The Pairs segment consists of one individual code that yields a single present orabsent coding decision: Are these percepts based on the symmetry features of theinkblot (2) or not? Similarly, the Content segment consists of 27 individual codesthat yield 27 present or absent coding decisions. For example, do the contents ofthis response involve food (Fd) or not. Analogous to the Pairs segment, thePopulars segment consists of one individual code that yields a single present or ab-
26 ACKLIN, M CDOWELL, VERSCHELL, CHAN
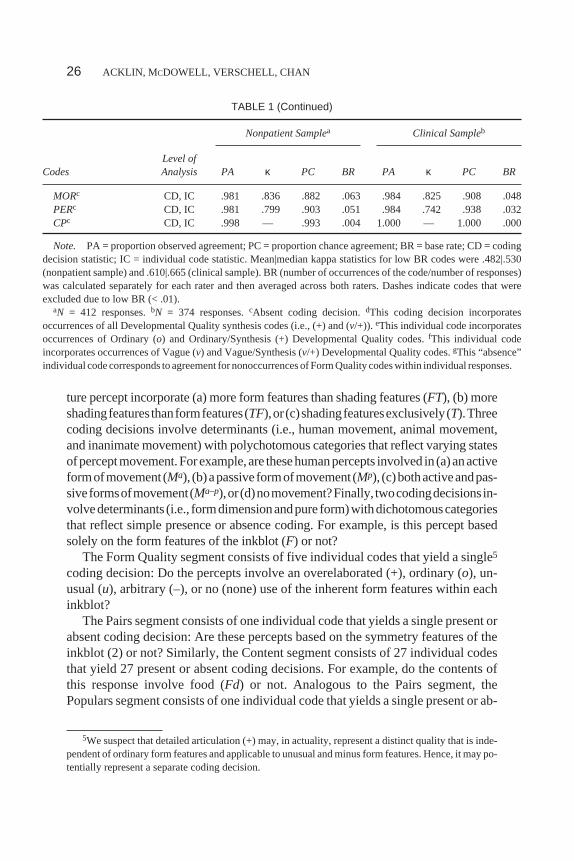
TABLE 1 (Continued)
Nonpatient Samplea Clinical Sampleb
CodesLevel ofAnalysis PA κ PC BR PA κ PC BR
MORc CD, IC .981 .836 .882 .063 .984 .825 .908 .048PERc CD, IC .981 .799 .903 .051 .984 .742 .938 .032CPc CD, IC .998 — .993 .004 1.000 — 1.000 .000
Note. PA = proportion observed agreement; PC = proportion chance agreement; BR = base rate; CD = codingdecision statistic; IC = individual code statistic. Mean|median kappa statistics for low BR codes were .482|.530(nonpatient sample) and .610|.665 (clinical sample). BR (number of occurrences of the code/number of responses)was calculated separately for each rater and then averaged across both raters. Dashes indicate codes that wereexcluded due to low BR (< .01).
aN = 412 responses.bN = 374 responses.cAbsent coding decision.dThis coding decision incorporatesoccurrences of all Developmental Quality synthesis codes (i.e., (+) and (v/+)). eThis individual code incorporatesoccurrences of Ordinary (o) and Ordinary/Synthesis (+) Developmental Quality codes.fThis individual codeincorporates occurrences of Vague (v) and Vague/Synthesis (v/+) Developmental Quality codes.gThis “absence”individual code corresponds to agreement for nonoccurrences of Form Quality codes within individual responses.
5We suspect that detailed articulation (+) may, in actuality, represent a distinct quality that is inde-pendent of ordinary form features and applicable to unusual and minus form features. Hence, it may po-tentially represent a separate coding decision.
sent coding decision: Does this response involve the most commonly perceivedinkblot percepts (P) or not?
The Organizational Quality segment consists of four individual codes thatwould normally yield one coding decision: Does this response (a) integrate formfeatures of the whole inkblot (ZW), (b) integrate concrete form features and whitespace areas of the inkblot (ZS), (c) integrate adjacent form features of the inkblot(ZA), (d) integrate nonadjacent (i.e., distant) form features of the inkblot (ZS), or(e) not involve meaningful integration of the form features of the inkblot? How-ever, we were unable to model this coding decision for reliability analysis becausethe RIAP3 sequence of scores does not list the Organizational Quality codes thatwere originally entered by the raters. Although RIAP3 does provide the numericalvalues that are associated with raters’ original Organizational Quality coding deci-sions, these values are not mutually exclusive for any one Organizational Qualitycode (e.g., Card II:ZW= ZS= 4.5; Card VI:ZW= ZA= 2.5; Exner, 1995). Conse-quently, it was necessary to base our data organization scheme solely on these nu-merical values. Although this arrangement does not provide an estimate of rateragreement for Organizational Quality codes, the resulting response-level reliabil-ity estimates are still valid in the sense that the numerical values reflect the actualdata on which interpretive indexes (e.g.,Zd) are derived.
TheSpecialScoressegmentconsistsof18individualcodesthatyield14codingde-cisions.Fourof thesecodingdecisions involvespecial scores (i.e., IncongruousCom-bination, Fabulized Combination, Deviant Verbalization, and Deviant Response)withpolychotomouscategories that reflect varyingdegreesof cognitiveslippage.Forexample, does this percept involve (a) appropriate attributes, (b) a mildly unrealisticcombination of attributes (Inc1), or (c) a moderately or severely unrealistic combina-tion of attributes (Inc2)? The remaining 14 coding decisions involve special scoreswith dichotomous categories that reflect simple presence or absence coding. For ex-ample, does this response involve morbid (MOR) content or not?
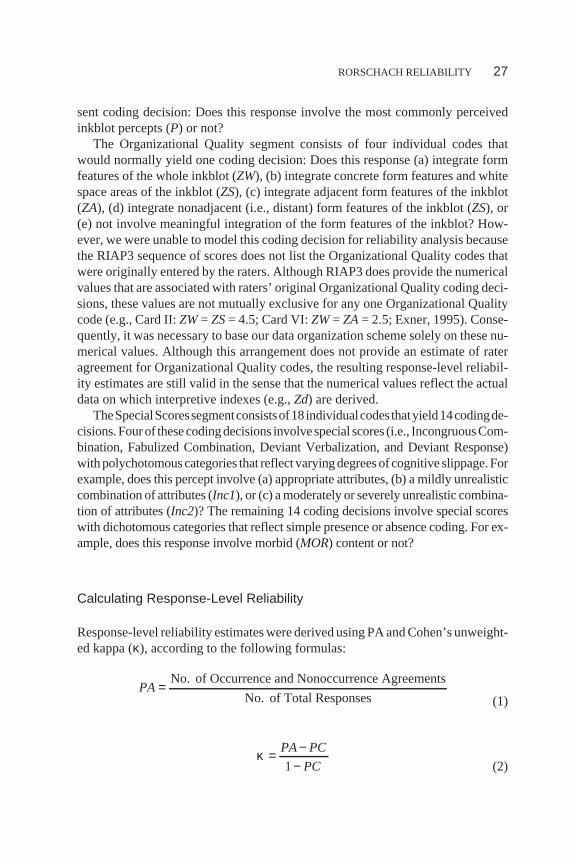
Calculating Response-Level Reliability
Response-level reliability estimates were derived using PA and Cohen’s unweight-ed kappa (κ), according to the following formulas:
PA=No. of Occurrence and Nonoccurrence Agreements
No. of Total Responses (1)
κ = −−
PA PC
PC1 (2)
RORSCHACH RELIABILITY 27

where proportion of chance agreement (PC) equals the product of the values of rat-ers’ marginal proportions for each coding category summed over all categories(Zwick, 1988).
Additionally, we calculated base rate of occurrence (BR) for each individualcode and coding decision as the proportion of occurrences of each individual orcomposite code averaged across both raters.
Protocol-Level Data
Protocol-level data include aggregate codes, ratios, percentages, and derivationsfrom the Comprehensive System Structural Summary. These data are most easilyorganized for reliability analysis by using the RIAP3 export facility, and thePcanalx syntax file that reads the resulting ASCII text files into an SPSS (SPSS,Inc., 1998) database.6 In most cases, the resulting Structural Summary data are pro-duced in an appropriate format for immediate reliability analysis. One anomaly,however, seems to occur for Structural Summary ratios that involve divisions be-tween nonzero numerators and zero denominators. RIAP3 will report the values ofthese undefined ratios as the numerator values alone, yet we could find no explana-tion in any of Exner’s works or in the RIAP3 manual as to why this should be so.Therefore, we performed a manual check of our Structural Summary ratio data andexcluded all data points that corresponded to undefined ratios.
Calculating Protocol-Level Reliability
Reliability estimates for all Structural Summary data were derived using the ICCthat is based on a two-way random effects model of variance and an absolute agree-ment definition of correlation (McGraw & Wong, 1996; Shrout & Fleiss, 1979).This ICC formula is calculated as follows:
( ) ( ) ( )ICC
MS MS
MS k MS MS MSkn
A,1 R E
R E c E
=−
+ − + −1 (3)
whereMSR is the mean square for rows (i.e., scores),MSC is the mean square forcolumns (i.e., raters),MSE is the mean square error,k is the number of raters, andnis the number of protocols.
28 ACKLIN, M CDOWELL, VERSCHELL, CHAN
6An updated syntax file that associates variable names with the Structural Summary data is avail-able from Mark S. Verschell.

RESULTS
Table 1 presents PA, Cohen’s kappa (κ), PC, and BR data for response-levelcoding decisions and individual codes. Data are organized according to the ninesegments of the Comprehensive System, and are identified as representing acoding decision (CD), an individual code (IC), or in many cases, both. Due tothe difficulty of making distinctions under conditions of highly restricted truescore variability (e.g., Shrout et al., 1987), kappa coefficients were excludedwhen the base rates of their underlying codes fell below .01 (i.e., < 1 occurrenceper 100 responses; G. Meyer, personal communication, August 20, 1998). Ex-cluded coefficients are indicated in Table 1 by a dash. Of the 116 ICs and CDsthat were examined, 27 (23%) were excluded from the nonpatient group (M|Mdnκ = .482|.530), and 28 (24%) were excluded from the clinical group (M|Mdn κ =.610|.665).
In the nonpatient group, kappa values ranged from .273 on Deviant Verbaliza-tion (DV1) to 1.000 on Explosion (Ex), with mean and median kappa values of.726 and .776, respectively. In the clinical group, kappa values ranged from .346for Deviant Verbalization (DV1) to 1.000 forExplosion (Ex), with mean and me-dian kappa values of .784 and .798, respectively.
Considering Determinant coding decisions and individual codes exclusively,nonpatient kappa values ranged from .368 for Form–Texture (FT) to .954 for FormReflection (Fr), with mean and median kappa values of .737 and .775, respec-tively. Kappa values for Determinants in the clinical group ranged from .589 forShading-Diffuse to 1.000 for Form Reflection, with mean and median kappa val-ues of .786 and .798, respectively.
Considering Content coding decisions and individual codes exclusively,nonpatient kappa values ranged from .408 for Nature (Na) to 1.000 forExplosion(Ex), with mean and median kappa values of .795 and .798, respectively. Kappavalues for Contents in the clinical group ranged from .607 for Household (Hh) to1.000 for Blood (Bl), with mean and median kappa values of .827 and .883,respectively.
Considering Special Score coding decisions and individual codes exclu-sively, nonpatient kappa values ranged from .273 for Deviant Verbalization(DV1) to .862 for Aggressive Movement (AG), with mean and median kappavalues of .526 and .496, respectively. Kappa values for Special Scores in theclinical group ranged from .346 for Deviant Verbalization (DV1) to .849 forCooperative Movement (COP), with mean and median kappa values of .681and .719, respectively.
Table 2 presents ICCs for protocol-level aggregate codes, ratios, percentages,and derivations from the Structural Summary. Data are organized according toExner’s (1991) framework of interpretive clusters. ICCs were excluded when
RORSCHACH RELIABILITY 29
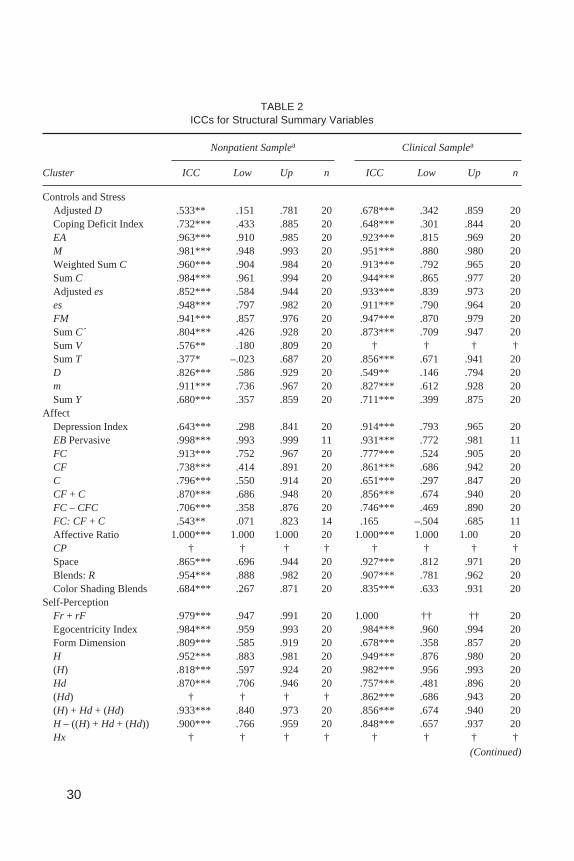
TABLE 2ICCs for Structural Summary Variables
Nonpatient Samplea Clinical Samplea
Cluster ICC Low Up n ICC Low Up n
Controls and StressAdjustedD .533** .151 .781 20 .678*** .342 .859 20Coping Deficit Index .732*** .433 .885 20 .648*** .301 .844 20EA .963*** .910 .985 20 .923*** .815 .969 20M .981*** .948 .993 20 .951*** .880 .980 20Weighted SumC .960*** .904 .984 20 .913*** .792 .965 20SumC .984*** .961 .994 20 .944*** .865 .977 20Adjustedes .852*** .584 .944 20 .933*** .839 .973 20es .948*** .797 .982 20 .911*** .790 .964 20FM .941*** .857 .976 20 .947*** .870 .979 20SumC´ .804*** .426 .928 20 .873*** .709 .947 20SumV .576** .180 .809 20 † † † †SumT .377* –.023 .687 20 .856*** .671 .941 20D .826*** .586 .929 20 .549** .146 .794 20m .911*** .736 .967 20 .827*** .612 .928 20SumY .680*** .357 .859 20 .711*** .399 .875 20
AffectDepression Index .643*** .298 .841 20 .914*** .793 .965 20EBPervasive .998*** .993 .999 11 .931*** .772 .981 11FC .913*** .752 .967 20 .777*** .524 .905 20CF .738*** .414 .891 20 .861*** .686 .942 20C .796*** .550 .914 20 .651*** .297 .847 20CF + C .870*** .686 .948 20 .856*** .674 .940 20FC – CFC .706*** .358 .876 20 .746*** .469 .890 20FC: CF + C .543** .071 .823 14 .165 –.504 .685 11Affective Ratio 1.000*** 1.000 1.000 20 1.000*** 1.000 1.00 20CP † † † † † † † †Space .865*** .696 .944 20 .927*** .812 .971 20Blends:R .954*** .888 .982 20 .907*** .781 .962 20Color Shading Blends .684*** .267 .871 20 .835*** .633 .931 20
Self-PerceptionFr + rF .979*** .947 .991 20 1.000 †† †† 20Egocentricity Index .984*** .959 .993 20 .984*** .960 .994 20Form Dimension .809*** .585 .919 20 .678*** .358 .857 20H .952*** .883 .981 20 .949*** .876 .980 20(H) .818*** .597 .924 20 .982*** .956 .993 20Hd .870*** .706 .946 20 .757*** .481 .896 20(Hd) † † † † .862*** .686 .943 20(H) + Hd + (Hd) .933*** .840 .973 20 .856*** .674 .940 20H – ((H) + Hd + (Hd)) .900*** .766 .959 20 .848*** .657 .937 20Hx † † † † † † † †
(Continued)
30
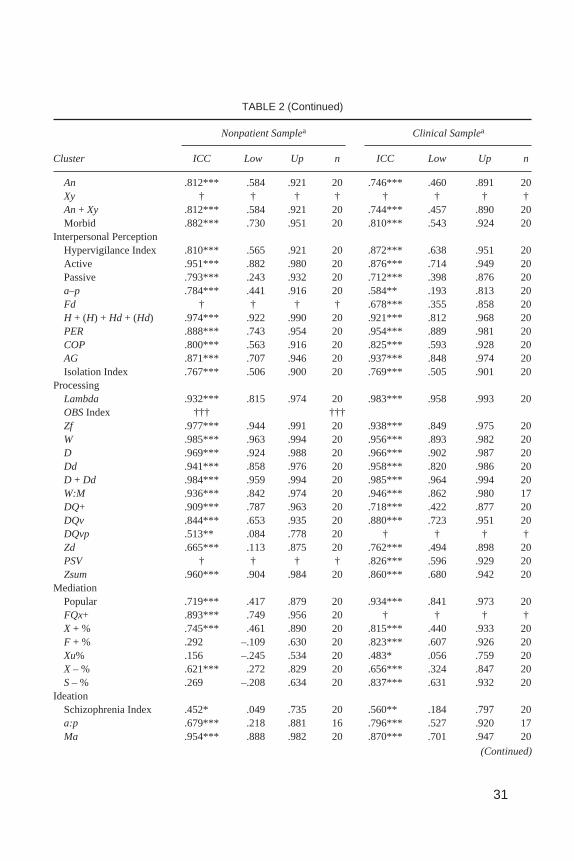
TABLE 2 (Continued)
Nonpatient Samplea Clinical Samplea
Cluster ICC Low Up n ICC Low Up n
An .812*** .584 .921 20 .746*** .460 .891 20Xy † † † † † † † †An+ Xy .812*** .584 .921 20 .744*** .457 .890 20Morbid .882*** .730 .951 20 .810*** .543 .924 20
Interpersonal PerceptionHypervigilance Index .810*** .565 .921 20 .872*** .638 .951 20Active .951*** .882 .980 20 .876*** .714 .949 20Passive .793*** .243 .932 20 .712*** .398 .876 20a–p .784*** .441 .916 20 .584** .193 .813 20Fd † † † † .678*** .355 .858 20H + (H) + Hd + (Hd) .974*** .922 .990 20 .921*** .812 .968 20PER .888*** .743 .954 20 .954*** .889 .981 20COP .800*** .563 .916 20 .825*** .593 .928 20AG .871*** .707 .946 20 .937*** .848 .974 20Isolation Index .767*** .506 .900 20 .769*** .505 .901 20
ProcessingLambda .932*** .815 .974 20 .983*** .958 .993 20OBSIndex ††† †††Zf .977*** .944 .991 20 .938*** .849 .975 20W .985*** .963 .994 20 .956*** .893 .982 20D .969*** .924 .988 20 .966*** .902 .987 20Dd .941*** .858 .976 20 .958*** .820 .986 20D + Dd .984*** .959 .994 20 .985*** .964 .994 20W:M .936*** .842 .974 20 .946*** .862 .980 17DQ+ .909*** .787 .963 20 .718*** .422 .877 20DQv .844*** .653 .935 20 .880*** .723 .951 20DQvp .513** .084 .778 20 † † † †Zd .665*** .113 .875 20 .762*** .494 .898 20PSV † † † † .826*** .596 .929 20Zsum .960*** .904 .984 20 .860*** .680 .942 20
MediationPopular .719*** .417 .879 20 .934*** .841 .973 20FQx+ .893*** .749 .956 20 † † † †X + % .745*** .461 .890 20 .815*** .440 .933 20F + % .292 –.109 .630 20 .823*** .607 .926 20Xu% .156 –.245 .534 20 .483* .056 .759 20X – % .621*** .272 .829 20 .656*** .324 .847 20S– % .269 –.208 .634 20 .837*** .631 .932 20
IdeationSchizophrenia Index .452* .049 .735 20 .560** .184 .797 20a:p .679*** .218 .881 16 .796*** .527 .920 17Ma .954*** .888 .982 20 .870*** .701 .947 20
(Continued)
31
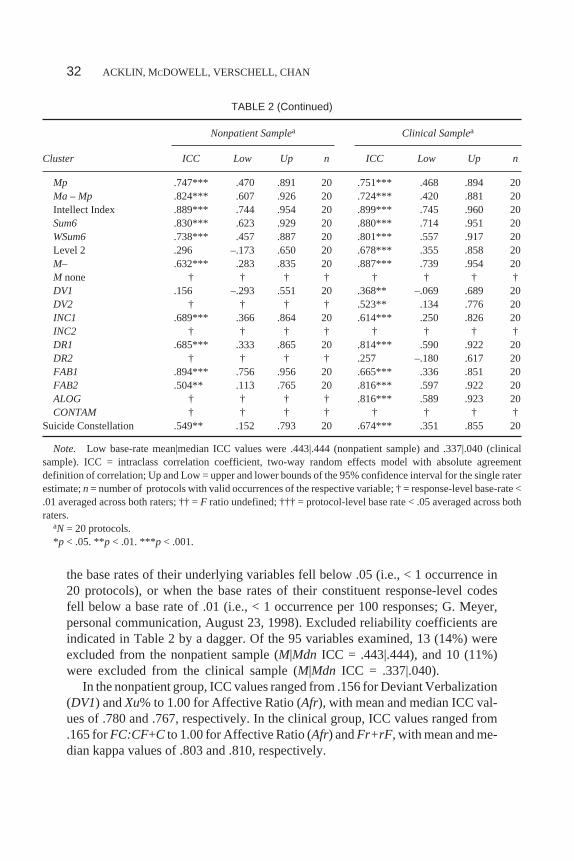
the base rates of their underlying variables fell below .05 (i.e., < 1 occurrence in20 protocols), or when the base rates of their constituent response-level codesfell below a base rate of .01 (i.e., < 1 occurrence per 100 responses; G. Meyer,personal communication, August 23, 1998). Excluded reliability coefficients areindicated in Table 2 by a dagger. Of the 95 variables examined, 13 (14%) wereexcluded from the nonpatient sample (M|Mdn ICC = .443|.444), and 10 (11%)were excluded from the clinical sample (M|Mdn ICC = .337|.040).
In the nonpatient group, ICC values ranged from .156 for Deviant Verbalization(DV1) andXu% to 1.00 for Affective Ratio (Afr), with mean and median ICC val-ues of .780 and .767, respectively. In the clinical group, ICC values ranged from.165 forFC:CF+C to 1.00 for Affective Ratio (Afr) andFr+rF, with mean and me-dian kappa values of .803 and .810, respectively.
32 ACKLIN, M CDOWELL, VERSCHELL, CHAN
TABLE 2 (Continued)
Nonpatient Samplea Clinical Samplea
Cluster ICC Low Up n ICC Low Up n
Mp .747*** .470 .891 20 .751*** .468 .894 20Ma – Mp .824*** .607 .926 20 .724*** .420 .881 20Intellect Index .889*** .744 .954 20 .899*** .745 .960 20Sum6 .830*** .623 .929 20 .880*** .714 .951 20WSum6 .738*** .457 .887 20 .801*** .557 .917 20Level 2 .296 –.173 .650 20 .678*** .355 .858 20M– .632*** .283 .835 20 .887*** .739 .954 20M none † † † † † † † †DV1 .156 –.293 .551 20 .368** –.069 .689 20DV2 † † † † .523** .134 .776 20INC1 .689*** .366 .864 20 .614*** .250 .826 20INC2 † † † † † † † †DR1 .685*** .333 .865 20 .814*** .590 .922 20DR2 † † † † .257 –.180 .617 20FAB1 .894*** .756 .956 20 .665*** .336 .851 20FAB2 .504** .113 .765 20 .816*** .597 .922 20ALOG † † † † .816*** .589 .923 20CONTAM † † † † † † † †
Suicide Constellation .549** .152 .793 20 .674*** .351 .855 20
Note. Low base-rate mean|median ICC values were .443|.444 (nonpatient sample) and .337|.040 (clinicalsample). ICC = intraclass correlation coefficient, two-way random effects model with absolute agreementdefinition of correlation; Up and Low = upper and lower bounds of the 95% confidence interval for the single raterestimate;n = number of protocols with valid occurrences of the respective variable; † = response-level base-rate <.01 averaged across both raters; †† =F ratio undefined; ††† = protocol-level base rate < .05 averaged across bothraters.
aN = 20 protocols.*p < .05. **p < .01. ***p < .001.
DISCUSSION
This study examined the reliability of Comprehensive System data that were col-lected from samples of nonpatient and clinical protocols. Response-level reliabilitywas evaluated using the kappa coefficient, and protocol-level reliability was evalu-ated using the ICC. This study also examined the relation among response-level re-liability, quantification method, and base rate.
Interpreting Reliability Coefficients
Kappa is interpreted as the proportion of possible agreement that is achieved by rat-ers beyond chance agreement. Kappa values may range from –1.00 to 1.00. Kappavalues greater than zero indicate that raters agree more frequently than would bepredicted by chance. A kappa value of zero indicates that raters’ observed agree-ment is no better than chance. Kappa values of less than zero indicate that ratersagree less frequently than would be predicted by chance.
Kappa is directly related to the proportion of observed agreement. For ex-ample, the Location coding decision in the clinical sample indicates that ratersachieved a PC equal to .412 and reliability estimates of .891 and .936 for kappaand PA, respectively. The possible range of agreement beyond chance agree-ment was equal to .588 (1 – .412), and the kappa value of .891 indicates that theraters achieved 89% of this range. Thus, the proportion of raters’ nonchanceagreement was equal to .524 (.891 × .588 = .524). Adding the proportion ofnonchance agreement to the PC yielded the PA (PA = .412 + .524 = .936).
The ICC is interpreted as the proportion of total variance in observers’ ratingsthat is attributable to true variation among target behaviors (i.e., verbal responses;Bartko, 1991). ICC values will usually range from 0 to 1.0, with 1.0 indicating per-fect observer agreement when there is at least some degree of variation among thetarget behaviors. Negative ICC values are interpreted as representing zero reliabil-ity (Bartko, 1976).
For a given amount of true score variance, the magnitude of reliability coeffi-cients will vary as a function of the different factors that contribute to error vari-ance. These factors include (a) the adequacy of the behavioral observation codingcriteria, (b) the occasion on which the behavioral observation data were collected,(c) the nature (i.e., signal) of the actual behaviors under investigation, (d) the train-ing and experience of the observers, and (e) the setting or context in which the ac-tual behaviors are observed (Bartko, 1991). Although estimates of observerreliability should always be interpreted with these factors in mind, several generaland reasonably similar guidelines (e.g., Fleiss, 1981; Gelfand & Hartmann, 1975;Landis & Koch, 1977) have been proposed for interpreting the magnitude of the
RORSCHACH RELIABILITY 33
kappa coefficient. For the purpose of analyzing response-level data within thisstudy, we interpret kappa values (a) less than .61 as representing unacceptable lev-els of reliability, (b) greater than or equal to .61 and less than .81 as representingsubstantial and acceptable levels of reliability, and (c) greater than or equal to .81as representing excellent levels of reliability.
Guidelines for interpreting the magnitude of ICCs appear relatively infre-quently in the research literature and are more varied in their recommendationsthan are the corresponding guidelines for interpreting the kappa coefficient. Forexample, Mitchell (1979) suggested that ICC values of .50 and .60 should not beconsidered as low. Shrout and Fleiss (1979) suggested that ICC values of .75 or.80 are minimally acceptable in substantive studies. Berk (1979) suggested thatICC values of .80 and above are indicative of a “high degree of agreement” (p.467). To a large extent, these differences represent the differing generalizations(i.e., generalizability theory; Cronbach, Gleser, Nanda, & Rajaratnam, 1972)that may be derived from behavioral observation data and differing forms of theICC.
ICCs that estimate the reliability of a single observer’s scores are expected to belower in value than ICCs that estimate the average reliability of multiple observ-ers’ scores (Shrout & Fleiss, 1979). Although the reliability of ComprehensiveSystem summary scores could be evaluated using the latter approach (i.e., averagescore ICCs; McGraw & Wong, 1996), the former approach is more conservative andprovides a lower bound estimate of the true dependability of protocol-level data. Inaddition, this approach produces reliability estimates that seem to be appropriatelycharacterized by the same interpretive framework that has been postulated for thekappa coefficient. Therefore, this study applied the previously described interpre-tive framework to both response-level and protocol-level data.
Response-Level Reliability
The results of this study indicate that well-trained and experienced raters can applythe majority of Comprehensive System codes in a consistent fashion. Of the 88 in-dividual codes and coding decisions that met our base-rate inclusion criteria in thenonpatient sample, 36 (41%) demonstrated kappa values in the range of excellentreliability (κ ≥ .81), 30 (36%) demonstrated kappa values in the range of substantialreliability (.61≤ κ < .81), and 22 (25%) demonstrated kappa values in the range ofunacceptable reliability (κ < .61). Individual codes and coding decisions that fellwithin the unacceptable range of reliability includeFQ+, FV, Shading-Vista,INC1, FQu,Incongruous Combination,CF, DV2, PSV, Z= 3.5, Ay, FabulizedCombination,YF, FAB2, FAB1,Shading-Texture,Na, FT, DR1,Deviant Verbal-ization,DV1,and Deviant Response (Table 1).
34 ACKLIN, M CDOWELL, VERSCHELL, CHAN
Mean and median kappa values in the nonpatient sample were in the upperrange of substantial reliability across all codes combined (.726|.776), across Deter-minant codes exclusively (.737|.775), and across Content codes exclusively(.795|.798). Special Scores (M|Mdnκ = .526|.496) and other low-frequency codesappeared to be the most problematic.
Of the 89 individual codes and coding decisions that met our base-rate inclu-sion criteria in the clinical sample, 42 (47%) demonstrated kappa values in therange of excellent reliability (κ ≥ .81), 39 (44%) demonstrated kappa values in therange of substantial reliability (.61≤ κ < .81), and 8 (9%) demonstrated kappa val-ues in the range of unacceptable reliability (κ < .61). Individual codes and codingdecisions that fell within the unacceptable range of reliability includeALOG,De-viant Verbalization,DR2, DV1, FQu, Hh, FY,and Shading-Diffuse.
In the clinical sample, mean and median kappa values were in the upper rangeof substantial reliability across all codes combined (.784|.798) and across Determi-nant codes exclusively (.786|.798). Mean and median kappa values were in themiddle range of substantial reliability across Special Score codes exclusively(.681|.719). Mean and median kappa values were in the range of excellent reliabil-ity across Content codes exclusively (.827|.883).
Protocol-Level Reliability
The results of this study also indicate that well-trained and experienced raters pro-duce consistent Comprehensive System protocols across the majority of aggregatecodes, percentages, ratios, and derivations from the Structural Summary. Of the 82variables that met our base-rate inclusion criteria in the nonpatient sample, 45(55%) demonstrated ICC values in the range of excellent reliability (ICC≥ .81), 24(29%) demonstrated ICC values in the range of substantial reliability (.61≤ ICC <.81), and 13 (16%) demonstrated ICC values in the range of unacceptable reliability(ICC < .61). Variables that fell within the unacceptable range of reliability includeAdjD, DQv/+, F+%, DV1, FAB2, FC:CF+C, Level 2,S-%, SCON, SCZI,SumT,SumV, andXu%. Mean ICC values in the nonpatient sample fell within the upperrange of substantial reliability (.780), and median ICC values fell within the rangeof excellent reliability (.825).
Of the 85 variables that met our base-rate inclusion criteria in the clinical sam-ple, 53 (62%) demonstrated ICC values in the range of excellent reliability (ICC≥.81), 24 (28%) demonstrated ICC values in the range of substantial reliability (.61≤ ICC < .81), and 8 (9%) demonstrated ICC values in the range of unacceptable re-liability (ICC < .61; rounding error of 1% noted). Variables that fell within the un-acceptable range of reliability includea–p, Dscore,DR2, DV1, DV2, FC:CF+C,SCZI,andXu%. Mean and median ICC values in the clinical sample fell within inthe range of excellent reliability (.803|.837).
RORSCHACH RELIABILITY 35
Sensitivity, Specificity, Base Rate, and Reliability
True reliability coefficients (e.g.,κ7 and the ICC) indicate the proportion of totalmeasurement variance that is attributable to true score differences among a set ofrated behaviors (σ2T /[σ2T + σ2E]; Shrout et al., 1987). Given fixed levels of diag-nostic sensitivity and specificity (i.e., the accuracy of fallible observers’ ratings inrelation to an absolute criterion), reliability estimates tend to decrease in value asthe base rates of target behaviors approach 0 or 100% (Bartko, 1991; Grove,Andreasen, McDonald-Scott, Keller, & Shapiro, 1981; Kraemer, 1979; Shrout etal., 1987). Conversely, reliability estimates tend to be maximized when observersare presented with the most varied number of behaviors to rate (i.e., maximum truescore variance at a base rate of 50%; Bartko, 1991).
Reliability coefficients are also affected by changes in the sensitivity and speci-ficity of observational procedures across populations with differing base rates(Langerbucher, Labouvie, & Morgenstern, 1996). Under certain situations of de-creasing base rates, increases in diagnostic specificity (i.e., the rate of true negativeclassifications) are not offset by decreases in diagnostic sensitivity (i.e., the rate oftrue positive classifications). Hence, reliability estimates may actually be higher inhomogenous populations than in heterogeneous populations. These situations cor-respond to increases in positive predictive value, fewer diagnostic classificationerrors, and lower error variance (σ2E).
Considerable debate has centered on the appropriateness of calculating reliabil-ity estimates in the context of low base-rate phenomena. Although Carey andGottesman (1978) coined the phrasethe base-rate problem,their intent was to ref-erence the inappropriateness of generalizing reliability estimates across observa-tional phenomena with differing base rates, as opposed to assessing reliability inlow base-rate situations. Grove et al. (1981) were perhaps the first to suggest thatreliability estimates not be reported for low base-rate phenomena (i.e., < 5%), forconcerns that low reliability estimates might lead researchers to reject valid diag-nostic procedures (i.e., those with acceptable levels of sensitivity and specificity).Spitznagel and Helzer (1985) further recommended that Yule’sY be substitutedfor kappa when assessing reliability in low base-rate situations, as this statisticdoes not share the same base-rate dependence (i.e., problem) as the kappa statistic.These recommendations, however, have since been criticized by several research-ers (e.g., Bartko, 1991; Langerbucher et al., 1996; Shrout et al., 1987) who havepointed out that (a) Yule’sY is in fact a measure of association and may only be in-terpreted as an index of reliability under rare and restrictive conditions and (b)Yule’s Y produces biased estimates of observational reliability and may misleadresearchers into believing that measurement error is not a significant problem,
36 ACKLIN, M CDOWELL, VERSCHELL, CHAN
7Variance components for the kappa coefficient can be conceptualized as arising from the differingweights that are assigned to the various cross-classifications of observers’ ratings.
when, in fact, it really is. Furthermore, these researchers have explained that (a) thelow base-rate problem is not a function of reliability statistics per se but rather rep-resents the difficulty of making distinctions in increasingly homogenous popula-tions and (b) the kappa statistic demonstrates stable psychometric properties inproperly designed reliability studies.
Despite these clarifications, developing standards within Comprehensive Sys-tem reliability research still call for the exclusion of “unstable” response-levelcodes and protocol-level variables that occur at extremely low base rates. To fur-ther clarify these issues, we reexamined our response-level data, including codesand coding decisions that were previously excluded on the basis of their low baserates. For the purpose of these analyses, we contrasted reliability estimates aboveand below the 5% low base-rate cutoff recommended by Grove et al. (1981).
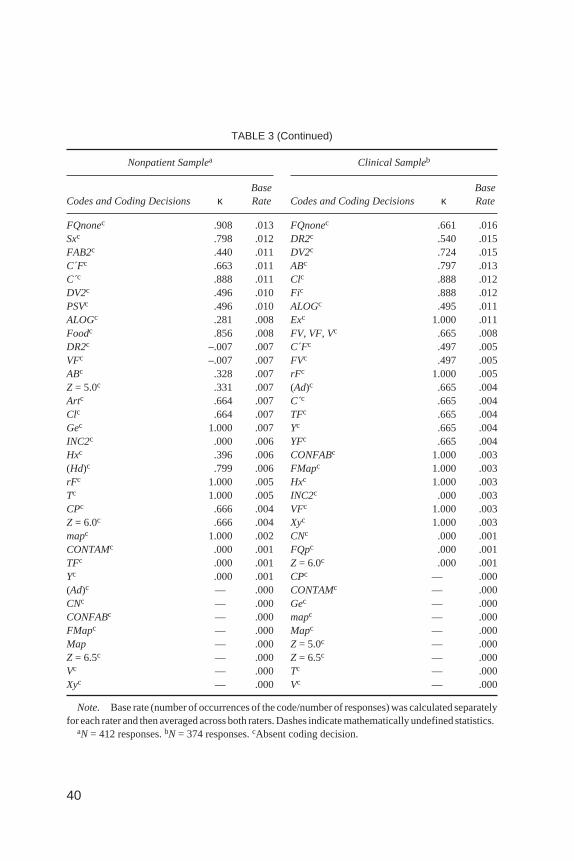
Table 3 presents response-level data for both samples sorted by descending baserate. In the nonpatient sample, 53% of the low base-rate codes and coding decisionsfell within the unacceptable reliability range (i.e.,κ < .61), with an average kappavalueof .564. Incontrast,only5%of thehigherbase-ratecodesandcodingdecisions(i.e., > 5%) fell within the unacceptable reliability range, with an average kappavalueof .803. In theclinicalsample,21%of the lowbase-ratecodesandcodingdeci-sions fell within the unacceptable reliability range, with an average kappa value of.710. In contrast, only 2% of the higher base-rate codes and coding decisions fellwithin theunacceptablereliability range,withanaveragekappavalueof .817.Theseresults highlight the difficulty of making distinctions in increasingly homogenouspopulations, as lower base-rate Comprehensive System codes and coding decisionswere indeed associated with lower estimates of observer reliability.
To shed further light on these issues, we plotted kappa, PA, and PC in relation toincreasing base rates of response-level codes and coding decisions. Figures 1(nonpatient)and2 (clinical) clearly illustratewhyPA isan inappropriatemeasureofreliability (e.g., Spitzer, Cohen, Fleiss, & Endicott, 1967), as it produces reliabilityestimates that are insensitive to variations in the base rate of behavioral occurrenceand, correspondingly, to the degree of chance agreement. Kappa, on the other hand,is much more sensitive to variations in the rate of behavioral occurrence and the de-gree of chance agreement. Although our data confirm Shrout et al.’s (1987) asser-tions that there is no mathematical necessity for small kappa values to be associatedwith low base-rate phenomena, Figures 1 and 2 demonstrate that the variability ofkappavalues increasedascodesandcodingdecisionsoccurredat increasingly lowerbase rates and as chance agreement correspondingly increased in value. Formally,kappavalues for codesandcodingdecisions thatoccurredatabase rateof5%or lessdemonstratedsignificantlygreatergroupvariability (i.e.,as indicatedbytheaverageof their squared deviation scores about the sample meanκ value) than kappa valuesfor codes and coding decisions that occurred at higher base rates: nonpatient sampleF(1,106)=26.935,p=.000,andclinicalsampleF(1,105)=7.250,p=.008.Further-more, our data demonstrate the well-established relation (e.g., Hanley, 1987) be-
RORSCHACH RELIABILITY 37

TABLE 3Reliability Coefficients for Response-Level Data by Descending Base Rate
Nonpatient Samplea Clinical Sampleb
Codes and Coding Decisions κBaseRate Codes and Coding Decisions κ
BaseRate
FQ:p, o, u,–, none .681 1.000 DQ:o, v .736 1.000DQ:o, v .722 1.000 FQ:p, o, u,–, none .716 1.000W, D, Dd .896 1.000 W, D, Dd .891 1.000DQoc .722 .925 DQoc .736 .940Z = 1.0–6.5c .811 .637 Z = 1.0–6.5c .856 .620FQoc .757 .518 Wc .925 .521Wc .913 .498 FQoc .808 .520Dc .888 .396 Ac .920 .475Ac .929 .393 Fc .909 .467Fc .857 .391 Dc .889 .354DQ+c .813 .371 (2)c .901 .316(2)c .883 .294 DQ+c .780 .306FQ–c .708 .274 Pc .935 .286Pc .889 .269 FQ–c .714 .267Ma, Mp, Mapc .929 .201 FQuc .585 .197FQuc .521 .194 Ma, Mp, Mapc .879 .179FC, CF, C, CNc .816 .163 FMa, FMp, FMapc .889 .150Hc .893 .163 Hc .937 .150FMa, FMp, FMapc .880 .149 Z = 1.0c .925 .146Sc .851 .142 FC, CF, C, CNc .781 .127Mac .903 .130 Ddc .816 .124Z = 1.0c .892 .129 Sc .939 .124Z = 2.5c .815 .119 Z = 2.5c .844 .106FMAc .880 .114 FMAc .885 .104FC , C´F, C c .789 .107 Z = 4.5c .957 .103Ddc .873 .107 Mac .837 .100Z = 4.5c .879 .101 (H)c .964 .080Adc .919 .100 Mpc .798 .079Z = 3.0c .696 .087 Cgc .923 .075ma, mp, mapc .763 .087 Z = 3.0c .902 .074Z = 4.0c .708 .086 INC1, INC2c .631 .066FC´c .782 .085 Z = 4.0c .700 .066INC1, INC2c .516 .081 INC1c .661 .063INC1c .547 .075 Adc .676 .061DQvc .722 .075 FCc .722 .061FDc .791 .075 Idc .645 .060Hdc .841 .074 ma, mp, mapc .806 .057Idc .677 .073 COPc .849 .056FCc .821 .073 Z = 5.5c .819 .055Mpc .872 .072 FC , C´F, C c .764 .053
(Continued)
38
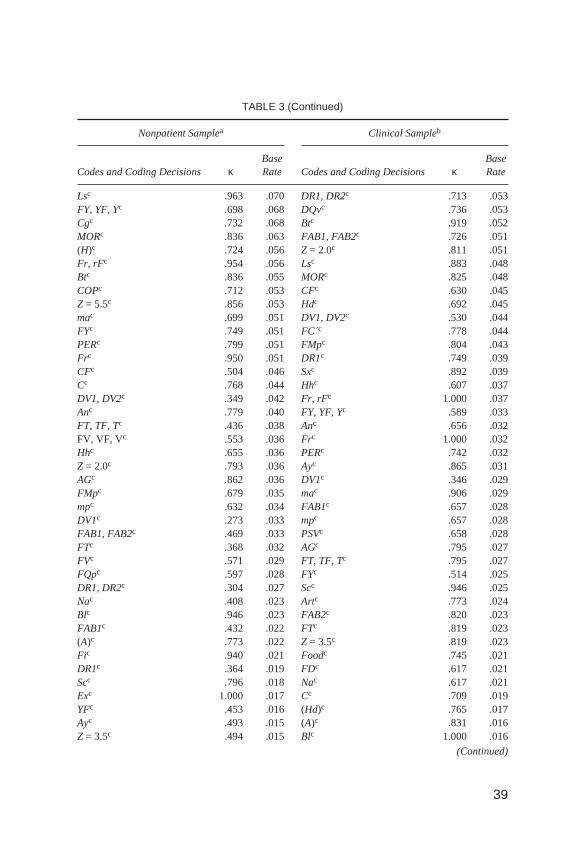
TABLE 3 (Continued)
Nonpatient Samplea Clinical Sampleb
Codes and Coding Decisions κBaseRate Codes and Coding Decisions κ
BaseRate
Lsc .963 .070 DR1, DR2c .713 .053FY, YF, Yc .698 .068 DQvc .736 .053Cgc .732 .068 Btc .919 .052MORc .836 .063 FAB1, FAB2c .726 .051(H)c .724 .056 Z = 2.0c .811 .051Fr, rFc .954 .056 Lsc .883 .048Btc .836 .055 MORc .825 .048COPc .712 .053 CFc .630 .045Z = 5.5c .856 .053 Hdc .692 .045mac .699 .051 DV1, DV2c .530 .044FYc .749 .051 FC´c .778 .044PERc .799 .051 FMpc .804 .043Frc .950 .051 DR1c .749 .039CFc .504 .046 Sxc .892 .039Cc .768 .044 Hhc .607 .037DV1, DV2c .349 .042 Fr, rFc 1.000 .037Anc .779 .040 FY, YF, Yc .589 .033FT, TF, Tc .436 .038 Anc .656 .032FV, VF, Vc .553 .036 Frc 1.000 .032Hhc .655 .036 PERc .742 .032Z = 2.0c .793 .036 Ayc .865 .031AGc .862 .036 DV1c .346 .029FMpc .679 .035 mac .906 .029mpc .632 .034 FAB1c .657 .028DV1c .273 .033 mpc .657 .028FAB1, FAB2c .469 .033 PSVc .658 .028FTc .368 .032 AGc .795 .027FVc .571 .029 FT, TF, Tc .795 .027FQpc .597 .028 FYc .514 .025DR1, DR2c .304 .027 Scc .946 .025Nac .408 .023 Artc .773 .024Blc .946 .023 FAB2c .820 .023FAB1c .432 .022 FTc .819 .023(A)c .773 .022 Z = 3.5c .819 .023Fic .940 .021 Foodc .745 .021DR1c .364 .019 FDc .617 .021Scc .796 .018 Nac .617 .021Exc 1.000 .017 Cc .709 .019YFc .453 .016 (Hd)c .765 .017Ayc .493 .015 (A)c .831 .016Z = 3.5c .494 .015 Blc 1.000 .016
(Continued)
39
40
TABLE 3 (Continued)
Nonpatient Samplea Clinical Sampleb
Codes and Coding Decisions κBaseRate Codes and Coding Decisions κ
BaseRate
FQnonec .908 .013 FQnonec .661 .016Sxc .798 .012 DR2c .540 .015FAB2c .440 .011 DV2c .724 .015C´Fc .663 .011 ABc .797 .013C´c .888 .011 Clc .888 .012DV2c .496 .010 Fic .888 .012PSVc .496 .010 ALOGc .495 .011ALOGc .281 .008 Exc 1.000 .011Foodc .856 .008 FV, VF, Vc .665 .008DR2c –.007 .007 C´Fc .497 .005VFc –.007 .007 FVc .497 .005ABc .328 .007 rFc 1.000 .005Z = 5.0c .331 .007 (Ad)c .665 .004Artc .664 .007 C´c .665 .004Clc .664 .007 TFc .665 .004Gec 1.000 .007 Yc .665 .004INC2c .000 .006 YFc .665 .004Hxc .396 .006 CONFABc 1.000 .003(Hd)c .799 .006 FMapc 1.000 .003rFc 1.000 .005 Hxc 1.000 .003Tc 1.000 .005 INC2c .000 .003CPc .666 .004 VFc 1.000 .003Z = 6.0c .666 .004 Xyc 1.000 .003mapc 1.000 .002 CNc .000 .001CONTAMc .000 .001 FQpc .000 .001TFc .000 .001 Z = 6.0c .000 .001Yc .000 .001 CPc — .000(Ad)c — .000 CONTAMc — .000CNc — .000 Gec — .000CONFABc — .000 mapc — .000FMapc — .000 Mapc — .000Map — .000 Z = 5.0c — .000Z = 6.5c — .000 Z = 6.5c — .000Vc — .000 Tc — .000Xyc — .000 Vc — .000
Note. Base rate (number of occurrences of the code/number of responses) was calculated separatelyfor each rater and then averaged across both raters. Dashes indicate mathematically undefined statistics.
aN = 412 responses.bN = 374 responses.cAbsent coding decision.

FIGURE 1 Coefficients of interrater agreement in relation to increasing base rates of ComprehensiveSystem codes: Nonpatient sample. PA = proportion of agreement; PC = proportion of chance agreement.
FIGURE 2 Coefficients of interrater agreement in relation to increasing base rates of ComprehensiveSystem codes: Clinical sample. PA = proportion of agreement; PC = proportion of chance agreement.
41
tween the decreasing precision of the kappa statistic and the decreasing base rate ofbehavioral observation phenomena. Formally, kappa values for codes and codingdecisions that occurred at a base rate of 5% or less demonstrated significantly lowerstability than kappa values for codes and coding decisions that occurred at higherbase rates: average nonpatientSEM= .130 versus .047,F(1, 106) = 57.834,p= .000,and average clinicalSEM= .118 versus .049,F(1, 105) = 27.204,p= .000. These re-sults highlight the exacting nature of reliability measurements that are made in ho-mogenous environments (e.g., Bartko, 1991). That is, when true score variability islow, observers have a smaller range beyond chance agreement in which to agree ordisagree, and classification mistakes have a much greater impact on reliability esti-mates than would the same number of mistakes when made under conditions ofgreater true score variability.
Finally, our data demonstrate that reliability estimates do not uniformly decreasein value when codes and coding decisions are assessed in increasingly homogenousenvironments. Specifically, of the 99 codes and coding decisions that occurred atleast once in both samples (i.e., base rate > 0), 36 (36%) demonstrated higher kappavalues in the lower base-rate sample. In addition, this result was equally likely to oc-cur for codes and coding decisions with an average base rate less than or equal to 5%as it was for codes and coding decisions with an average base rate greater than 5%,suggesting that low base-rate instability was not a contributing factor. We hypothe-size that increased specificity (i.e., fewer false positive diagnostic classification er-rors) isa likely factor contributing to thehigher reliabilityof certainComprehensiveSystem codes in more homogenous samples (e.g., Langerbucher et al., 1996).
In sum, our data suggest that generalized reliability interpretation frameworks(e.g., Landis & Koch, 1977) may not be appropriate for Comprehensive System datathat occur at base rates less than or equal to 5%. In these situations, it may be more ap-propriate to interpret the magnitude of reliability estimates in relation to the demon-strated levelsofprecision (i.e., thestandarderrorsofmeasurement)and themaximumlevelsofreliability thatmaybeachievedgiventhebaserate,sensitivity,andspecificityof Comprehensive System data (e.g., Grove et al., 1981). Furthermore, although it istrue that lowbase-rateenvironmentsplacerestrictionsontheadequacyof thevarianceestimates thatareused tocalculate the reliabilityofobservationaldata (Bartko,1991),nosinglestudywillbeabletodeterminethebaseratethatrepresentsthemostappropri-ate cutoff between stringent and unstable estimates of reliability for ComprehensiveSystem data. We suggest that the true reliability of Comprehensive System codes andcoding decisions will most appropriately be established via replication and the even-tual implementation of meta-analytic techniques.
Limitations of Comprehensive System Reliability
A number of Comprehensive System codes and aggregate variables demonstrate lessthan acceptable levels of reliability. Consistent with the behavioral assessment litera-
42 ACKLIN, M CDOWELL, VERSCHELL, CHAN
ture, we suggest three specific factors that may depress Comprehensive System reli-ability estimates. First, low prevalence will naturally depress the reliability of themajority of Comprehensive System data. For example, the average base rates of re-sponse-levelcodesandcodingdecisions inthisstudywere10.4%(nonpatientsample)and 10.8% (clinical sample), respectively. Only 13% (nonpatient) and 12% (clinical)of these codes and coding decisions occurred at a base rate of 20% or greater.
Second, the coding of Rorschach responses is a demanding procedure that hastwo mutually interdependent vulnerabilities: the adequacy of raters’ administra-tion procedures and the application of coding criteria to individual responses. Er-rors arising in either of these procedures will tend to lower Comprehensive Systemreliability estimates. Poor inquiry is a significant source of administration errorthat impedes subsequent coding procedures and hence lowers reliability estimates.Coding decisions are also subject to many direct sources of error, including con-servative and liberal biases, errors of commission and omission, and problemswith intraobserver consistency.
Ambiguous coding criteria are a third factor that tends to depress Comprehen-sive System reliability estimates. Texture is perhaps a good example. Texture canbe scored without specific mention of a shading component if a somatosensory ex-perience can be identified by the rater (e.g., the examinee rubs the card or states, “Itlooks like it would feel fluffy”). Improved coding criteria await the developmentof a standardized methodology for assessing Comprehensive System reliability.Although this study represents only an initial step in this endeavor, valid and in-creasingly potent criticisms of the Comprehensive System necessitate that Ror-schach researchers no longer sacrifice statistical rigor for computational ease.Kappa and the ICC offer the greatest potential for elucidating the various sourcesof Comprehensive System administration and coding error and, ultimately, for en-hancing the Rorschach’s validity as a clinical and research measure.
Conclusions, Caveats, and Directions for Future Research
The findings reported here represent a stringent and extensive demonstration ofinterobserver and intraobserver reliability for the Rorschach Comprehensive Sys-tem. By clearly defining our framework for conceptualizing, organizing, and inter-preting Comprehensive System data, we hope that this contribution will advancefuture discussion and research. We believe that this study provides strong evidencefor the reliability of the Rorschach Inkblot Test across multiple levels of Compre-hensive System data. Furthermore, these results are consistent with conclusionsdrawn from the majority of previously reported reliability studies for the RorschachComprehensive System (e.g., Meyer, 1997b).
We note that conclusions drawn from this study must be tempered by the rela-tively small sample sizes that were used to evaluate the reliability of our protocol-level data. In addition, the reliability of a number of response-level codes and pro-
RORSCHACH RELIABILITY 43
tocol-level variables remains problematic. Parsing the errors arising from Com-prehensive System administration and coding procedures from the base-rateproblem that inevitably affects the magnitude of reliability estimates is a yet un-completed task. Finally, we provide a word of caution for reviewers who mightdraw conclusions from the low reliability estimates that are associated with certainStructural Summary derivations and interpretive indexes, as the majority of proto-col-level data are interpreted in terms of categorical, rather than absolute, agree-ment. Hence, although the ICC used in this study accurately describes thereliability of derived Comprehensive System scores, the interpretive consistencyof Comprehensive System protocols may need to be evaluated using an alternativeassessment framework. As far as we know, the reliability of Exner’s interpretiveclusters (i.e., Exner, 1991) has yet to be examined.
One further and relatively unexplored area of Comprehensive System researchinvolves the question ofscorer accuracy,or the degree of correspondence betweena rater and a criterion measure that is considered to be relatively incontrovertible(Suen, 1988). Standards of rater accuracy (i.e., master protocols) may be estab-lished through the use of videotaped administrations and consensus ratings amongComprehensive System clinicians and researchers who are deemed to be experts.Subsequent research designs may then evaluate rater accuracy by employing sta-tistics that are relevant for assessing behavioral observation data within a validityframework, namely sensitivity, specificity, positive predictive value, and negativepredictive value (Shrout et al., 1987). In addition to facilitating rater training andthe development of refined coding criteria, these “gold standard” studies will helpto establish acceptable levels of reliability for low base-rate Comprehensive Sys-tem data, thereby enabling Rorschach researchers to confidently address the issueof field reliability that has been raised by Wood et al. (1996a, 1996b, 1997).Hence, scorer accuracy is a component of Comprehensive System validity thatrepresents an important step toward ensuring the continued clinical and researchutility of the Rorschach Inkblot Test.
ACKNOWLEDGMENTS
This research was the collaborative effort of members of the Hawaii Rorschach Re-search Group (Marvin W. Acklin, Claude J. McDowell II, and Mark S. Verschell).We share equal authorial credit for this article. Greg Meyer played a significant rolein the development of our thinking about the nature and analysis of Rorschach dataand gave generously of his expertise. Harald Janson made helpful comments con-cerning coding schemes and data analysis. Special thanks to Tracy Eells, who pro-vided early inspiration and direction. Roger Bakeman, James Wood, StephenHaynes, and Gyoen Soggin were helpful with technical assistance.
44 ACKLIN, M CDOWELL, VERSCHELL, CHAN

REFERENCES
Acklin, M. W., McDowell, C. M., & Ornduff, S. (1992). Statistical power and the Rorschach: 1975–1991.Journal of Personality Assessment, 59,366–379.
Bakeman, R., Quera, V., McArthur, D., & Robinson, B. F. (1997). Detecting sequential patterns and de-termining their reliability with fallible observers.Psychological Methods, 7,357–370.
Bartko, J. J. (1976). On various intraclass correlation reliability coefficients.Psychological Bulletin, 83,762–765.
Bartko, J. J. (1991). Measurement and reliability: Statistical thinking considerations.SchizophreniaBulletin, 17,483–489.
Berk, R. A. (1979). Generalizability of behavioral observations: A clarification of interobserver agree-ment and interobserver reliability.American Journal of Mental Disability, 83,460–472.
Carey, G., & Gottesman, H. (1978). Reliability and validity in binary ratings: Areas of common misun-derstanding in diagnosis and symptom ratings.Archives of General Psychiatry, 35,1454–1459.
Cohen, J. (1960). A coefficient of agreement for nominal scales.Educational and Psychological Mea-surement, 20,37–46.
Cone, J. D. (1982). Validity of direct observation procedures.New Directions for Methodology of Socialand Behavioral Science, 12,67–69.
Cronbach, L. J., Gleser, G. C., Nanda, H., & Rajaratnam, N. (1972).The dependability of behavioralmeasurements: Theory of generalizability for scores and profiles.New York: Wiley.
DeCato, C. M. (1983). Rorschach reliability: Cross-validation.Perceptual & Motor Skills, 56,11–14.DeCato, C. M. (1984). Rorschach reliability: Toward a training model for interscorer agreement.Jour-
nal of Personality Assessment, 48,58–64.DeCato, C. M. (1994). Toward a training model for scoring revisited: A follow-up on a training system
for interscorer agreement.Perceptual & Motor Skills, 78(1), 3–10.Exner, J. E. (1990).A Rorschach workbook for the Comprehensive System(3rd ed.). Asheville, NC:
Rorschach Workshops.Exner, J. E., Jr. (1991).The Rorschach: A comprehensive system: Vol. 2. Interpretation(2nd ed.). New
York: Wiley.Exner, J. E., Jr. (1993).The Rorschach: A comprehensive system: Vol. 1. Basic foundations(3rd ed.).
New York: Wiley.Exner, J. E. (1995).Rorschach workbook for the Comprehensive System(4th ed.). Asheville, NC: Ror-
schach Workshops.Exner, J. E. (1996). A comment on “The Comprehensive System for the Rorschach: A critical examina-
tion.” Psychological Science, 7(1), 11–13.Exner, J. E., & Ona, N. (1995). Rorschach interpretation assistance program (Version 3.1) [Computer
software]. Odessa, FL: Psychological Assessment Resources.Exner, J. E., Jr., & Weiner, I. B. (1994).The Rorschach: A comprehensive system: Vol. 3. Assessment of
children and adolescents.New York: Wiley.Fleiss, J. L. (1981).Statistical methods for rates and proportions.New York: Wiley.Fleiss, J. L., & Cohen, J. (1973). The equivalence of weighted kappa and the intraclass correlation coef-
ficient as measures of reliability.Educational and Psychological Measurement, 33,613–619.Gelfand, S., & Hartmann, D. (1975).Child behavior analysis and therapy.New York: Pergamon.Greco, C. M., & Cornell, D. G. (1992). Rorschach object relations of adolescents who committed homi-
cide.Journal of Personality Assessment, 59,574–583.Grove, W. M., Andreasen, N. C., McDonald-Scott, P., Keller, M. B., & Shapiro, R. W. (1981). Reliabil-
ity studies of psychiatric diagnosis.Archives of General Psychiatry, 38,408–413.Hanley, J. A. (1987). Standard error of the kappa statistic.Psychological Bulletin, 102,315–321.Hartmann, D. P. (1977). Considerations in the choice of reliability estimates.Journal of Applied Behav-
ior Analysis, 10,103–116.
RORSCHACH RELIABILITY 45
Haynes, S. N. (1978).Principles of behavioral assessment.New York: Gardner.Jensen, A. R. (1959). The reliability of projective techniques: Review of the literature.Acta
Psychologica, 16,108–136.Kraemer, H. C. (1979). Ramifications of a population model fork as a coefficient of reliability.
Psychometrika, 44,461–472.Landis, J. R., & Koch, G. G. (1977). The measurement of observer agreement for categorical data.
Biometrics, 33,159–174.Langerbucher, J., Labouvie, E., & Morgenstern, J. (1996). Measuring diagnostic agreement.Journal of
Clinical and Consulting Psychology, 64,1285–1289.Matarazzo, J. D. (1983). The reliability of psychiatric and psychological diagnosis.Clinical Psychology
Review, 3,103–145.McDowell, C. J., & Acklin, M. W. (1996). Standardizing procedures for calculating Rorschach interrat-
er reliability: Conceptual and empirical foundations.Journal of Personality Assessment, 66,308–320.
McGraw, K. O., & Wong, S. P. (1996). Forming inferences about some intraclass correlation coeffi-cients.Psychological Methods, 1,30–46.
Meyer, G. J. (1997a). Assessing reliability: Critical corrections for a critical examination of the Ror-schach Comprehensive System.Psychological Assessment, 9,480–489.
Meyer, G. J. (1997b). Thinking clearly about reliability: More critical corrections regarding the Com-prehensive System.Psychological Assessment, 9,495–498.
Mitchell, S. K. (1979). Interobserver agreement, reliability, and generalizability of data collected in ob-servational studies.Psychological Bulletin, 86,376–390.
Netter, B. C., & Viglione, D. J. (1994). An empirical study of malingering schizophrenia on the Ror-schach.Journal of Personality Assessment, 62,45–57.
Perry, W., & Braff, D. L. (1994). Information-processing deficits and thought disorder in schizophrenia.American Journal of Psychiatry, 151,363–368.
Perry, W., McDougall, A., & Viglione, D. J. (1995). A five-year follow-up on the temporal stability ofthe Ego Impairment Index.Journal of Personality Assessment, 64,112–118.
Perry, W., Sprock, J., Schaible, D., McDougall, A., Minassian, A., Jenkins, M., & Braff, D. (1995). Am-phetamine on Rorschach measures in normal subjects.Journal of Personality Assessment, 64,456–465.
Perry, W., & Viglione, D. J. (1991). The Ego Impairment Index as predictor of outcome in melancholicdepressed patients treated with tricyclic antidepressants.Journal of Personality Assessment, 56,487–501.
Shrout, P. E., & Fleiss, J. (1979). Intraclass correlations: Uses in assessing rater reliability.Psychologi-cal Bulletin, 86,420–428.
Shrout, P. E., Spitzer, R. L., & Fleiss, J. L. (1987). Quantification of agreement in psychiatric diagnosisrevisited.Archives of General Psychiatry, 44,172–177.
Soeken, K. L., & Prescott, P. A. (1986). Issues in the use of kappa to estimate reliability.Medical Care,24,733–741.
Spitzer, R. L., Cohen, J., Fleiss, J. L., & Endicott, J. (1967). Quantification of agreement in psychiatricdiagnosis: A new approach.Archives of General Psychiatry, 17,83–87.
Spitzer, R. L., Endicott, J. E., & Robins, E. (1989).Research diagnostic criteria (RDC) for a selectedgroup of functional disorders.New York: New York State Psychiatric Institute, BiometricResearch.
Spitznagel, E. L., & Helzer, J. E. (1985). A proposed solution to the base rate problem in the kappa statis-tic. Archives of General Psychiatry, 42,725–729.
SPSS, Inc. (1998). SPSS for Windows (Version 8.2) [Computer software]. Chicago: Author.Suen, H. K. (1988). Agreement, reliability, accuracy, and validity: Toward a clarification.Behavioral
Assessment, 10,343–366.
46 ACKLIN, M CDOWELL, VERSCHELL, CHAN
Suen, H. K., & Ary, D. (1989).Analyzing quantitative behavioral observation data.Hillsdale, NJ: Law-rence Erlbaum Associates, Inc.
Tinsley, H. E., & Weiss, D. J. (1975). Interrater reliability and agreement of subjective judgments.Jour-nal of Counseling Psychology, 22,358–376.
Weiner, I. B. (1991). Editor’s note: Interscorer agreement in Rorschach research.Journal of PersonalityAssessment, 56,1.
Weiner, I. B. (1998).Principles of Rorschach interpretation.Mahwah, NJ: Lawrence Erlbaum Associ-ates, Inc.
Wood, J. M., Nezworski, M. T., & Stejskal, W. (1996a). The Comprehensive System for the Rorschach:A critical examination.Psychological Science, 7(3), 3–10.
Wood, J. M., Nezworski, M. T., & Stejskal, W. (1996b). Thinking critically about the ComprehensiveSystem for the Rorschach: A reply to Exner.Psychological Science, 7(1), 14–17.
Wood, J. M., Nezworski, M. T., & Stejskal, W. (1997). The reliability of the Comprehensive System forthe Rorschach: A comment on Meyer (1997).Psychological Assessment 9,490–494.
Zwick, R. (1988). Another look at interrater agreement.Psychological Bulletin, 103,374–378.
Marvin W. Acklin850 West Hind DriveSuite 203Honolulu, HI 96821
Received April 5, 1999Revised July 9, 1999
RORSCHACH RELIABILITY 47