internship report on IESCO Wapda final project 2014
174
ACKNOWLEDGEMENT ACKNOWLEDGEMENT I take this opportunity to express my profound gratitude and deep regards to my all guides for his exemplary guidance, monitoring and constant encouragement throughout the course of this project. The blessing, help and guidance given by him time to time shall carry me a long way in the journey of life on which I am about to embark. I am thankful to my professors and staff members of IESCO, especially Mr. Naveed Sabir (Assistant Engineer of IESCO for the valuable information provided by them in their respective fields. I am grateful for their cooperation during the period of my assignment. Lastly, I thank almighty, my parents, brother, sisters and friends for their constant encouragement without which this project would not be possible. 1
-
Upload
ilhaan-marwat -
Category
Education
-
view
232 -
download
14
Transcript of internship report on IESCO Wapda final project 2014

ACKNOWLEDGEMENTACKNOWLEDGEMENT
I take this opportunity to express my profound gratitude and deep regards to my all
guides for his exemplary guidance, monitoring and constant encouragement
throughout the course of this project. The blessing, help and guidance given by him
time to time shall carry me a long way in the journey of life on which I am about to
embark.
I am thankful to my professors and staff members of IESCO, especially Mr. Naveed
Sabir (Assistant Engineer of IESCO for the valuable information provided by them in
their respective fields.
I am grateful for their cooperation during the period of my assignment.
Lastly, I thank almighty, my parents, brother, sisters and friends for their constant
encouragement without which this project would not be possible.
1

TABLE OF CONTENT
1. Preface …………………………………………………..…03
2. Executive Summary…………………………………..……04
3. Objective ………………………………………………..…06
4. Overview of UBL ……………………………………..07
5. Vision, Mission…………………………………..…08
6. Nature of Organization……………………………………...09
7. Number of Employees ……………………..…………….…11
8. Board Of Directors …………………………………………15
9. Branches…………………………….…………………..…..19
10. Department………………………………………………….23
11. Structure of Finance/Accounts Department…………………25
12. Critical Analysis …………………………………………….27
13. Financial Analysis of UBL………………………………….29
14. Balance Sheet……………………………………………..… 30
15. Profit & Loss Statement…………………………….………..31
16. UBL Ratio Analysis ………………………………………....32
17. Horizontal Analyses …………………………………………45
18. Vertical Analyses……………………………………………..49
19. Organaizational Analysis……………………………………...51
20. Future Prospects for UBL…………..……………………......52
21. Weakness of Organaization……………………………….....54
22. Conclusion & Recommendations……………………………5423. References & Sources Used…………………………………5524. Annexure……………………………………………….……56
2

PREFACE
"Anything learnt by practice is worthy than by theory."
Our degree is a professional one, and a professional must has technical knowledge,
which is achieved through experiences.
It is the requirement for the completion of MBA degree that the students have to
spend time in an organization as internee after completing most part of his course.
Internship has specific purposes. It provides real life environment to students where
they can implement their knowledge practically, improve their analytic and leadership
skills and enhance their capabilities in different aspect of business field. At the end of
their course they have to write a report as the requirement of degree, which improve
their writing skills.
I did my internship in Wapda (IESCO) Islamabad.
I arranged the contents of this report during my internship and all facts present in this
report are true to my best knowledge.
3

1. Executive Summary:
In this internship report there are five major parts first part consist of
introduction of the organization and also discuss the business volume of the
organization. The second part of this report is organizational structures and discusses
the whole groups that are working in the organization and also describe decision-
making power in this organization. Third part of the report is the resources of the
organization if the resources of the organization are fully utilized than no organization
go to failure and also describe the resources of funds. The fourth part of the report is
very important part that is analysis of financial reports and balance sheet and ratio
analysis of the organization. The last part consists of future prospect, strength,
weakness, conclusion and recommendation for the organization. In last all annexure
are attached with the report.
IESCO was formed in 1998 to take over the assets, functions and responsibilities of
the erstwhile Islamabad Area Electricity Board, which was then a division of
WAPDA.
It services 2.1 million consumers directly, but touches the lives of more than 25 mln
people living in the 6 districts its services.
IESCO Strategic Vision 2012-2015
IESCO committed to providing leadership in sustainable development and
incorporating sustainability principles and identifying alternative and sustainable
courses of action to minimize its environmental impact.
4

IESCO is committed to creating and promoting an environmentally sustainable and
responsible culture and foster continuous improvement in its performance in terms of
its environmental footprint.
IESCO is committed to ensuring the health and wellbeing of its staff. It will put in
place a comprehensive package of wellbeing measures including occupational health
services, employee assistance programmed, a stress management policy and a rolling
programmed of wellbeing and healthy lifestyle events.
IESCO is committed to providing universal health coverage to its staff and their
families and ensuring financial risk protection for healthcare through the most cost
effective and transparent measures. IESCO upholds the principles of equity in doing
so.
5
2. O B J E C T I V E S:
Objective of the study was two pronged.
General Objective:
To get acquaintance to the IESCO operations.
To know what sort of changes management brings in managerial activities.
To see the application of our Professional studies especially.
Specific Objective:
Specific purpose of the study includes.
A partial fulfillment as a requirement for the completion of MBA Degree.
To objectively observe the operations of IESCO in general and the operations
of IESCO in specific.
To make recommendations or implementation plans for the improvement of
the operations of IESCO in the light of our professional studies.
6

3. Overview of Wapda IESCO:
3.1: History of IESCO:
WAPDA, the Pakistan Water and Power
Development Authority, was created in
1958 as a Semi-Autonomous Body for the
purpose of coordinating and giving a
unified direction to the development of
schemes in Water and Power Sectors,
which were previously being dealt with,
by the respective Electricity and Irrigation
Department of the Provinces.
Since October 2007, WAPDA has been bifurcated into two distinct entities i.e.
WAPDA and Pakistan Electric Power Company (PEPCO). WAPDA is responsible
for water and hydropower development whereas PEPCO is vested with the
responsibility of thermal power generation, transmission, distribution and billing.
There is an independent Chairman and MD (PEPCO) www.pepco.gov.pk replacing
Chairman WAPDA and Member (Power) who were previously holding the additional
charges of these posts.
7

We light your life…
8

I sl a m abad E l e c tr i c S u p pl y Co m pany Limited ( I E SCO)
Islamabad Electric Supply Company Limited (IESCO) is a public limited company
incorporated in Pakistan on 25th April 1998 under the Companies Ordinance, 1984.
The company was established to take over all the properties, rights, assets,
obligations and liabilities of Islamabad Area Electricity Board owned by WAPDA,
and such other assets and liabilities as agreed. The company has been granted
distribution license by NEPRA on 2nd November, 2001 for a term of 25 years for
electricity distribution.
IESCO has witnessed significant growth and development in the power sector during
the recent past. IECSO presently serves over 1.90 million customers. IESCO has
been operating at high levels of efficiencies and has been rated as the best
performing Distribution Company in the country as at the close of the financial year
on June 30, 2009 in terms of lowest Progressive Distribution losses with a level of
7.7%.
IESCO was formed as a public limited company, incorporated in Pakistan on 25th
April 1998 under the Companies Ordinance, 1984 to take over the assets, functions
and responsibilities of the erstwhile Islamabad Area Electricity Board, which was then
a division of WAPDA.
IESCO's core function is to supply, distribute and sell power (electricity) in the
licensed area from Attock to Jhelum, and from the river Indus to River Neelum in
Kashmir.
IESCO serves 2.2 million consumers directly, but touches the lives of more than 25
million people living in the 6 districts of its services.
“This business plan will become a road map to chart the course of this objective
explaining the number of areas as to how to achieve this target. It will define
&focus on objective by using appropriate information & analysis.”
9

Vision
To be the most admired public utility in Pakistan,
an undisputed leader in the power sector, efficient
and profitable.
Mission
To provide uninterrupted power supply to our
customers enabling trade and industry,
commerce, educational & social activities to
flourish and enrich the lives of our customers.
To be a socially responsible corporate citizen.
To be the most efficient public utility in
Pakistan.
To achieve the lowest line losses in the
distribution sector.
To be an employer of choice.
10

To generate profits for our stakeholders.
3.2) Nature of organization:
Area Electricity Board (AEB) Islamabad was one of the eight AEB's constituted
through amendments in WAPDA Act during 1981. Later Government of Pakistan
under the Power Sector Restructuring Program approved revamping of WAPDA
power sector, resultantly twelve corporate entities were formed. Eight Distribution
and Supply Companies (DISCOs), one National Transmission and Distribution
Company (NTDC) and three Generation Companies (GENCOs). All these companies
have been incorporated under Companies Ordinance 1984.
IESCO was incorporated on 25th April, 1998 vide company registration No. L09499
of 1997-98 under section 32 and certificate for commencement of business was
obtained on 1st June, 1998 under section 146(2) of Companies Ordinance 1984.
The main objective of the company was to acquire/take over those properties, rights
and liabilities of Pakistan, Water and Power Development Authority comprising of
administrative division formally known as the Islamabad Area Electricity Board
(AEB) and to carry on, expand and extend the business and activities.
11

To play and active role to make “Sar Sabz and Roshan Pakistan”
To facilitate agriculture and industrial sector
To ensure un-interrupted and stable power supply to all customers
State-of-the-art customer care for satisfaction of customers
To provide electricity to every village in jurisdiction of company
To establish, construct and operate reliable electricity distribution network.
IESCO’s Commitment
Improve customer satisfaction
Reduce Line Losses
Weed out corruption
Increase revenue generation
IESCO web site is launched to provide
the best
Customer services
12

Management Philosophy
Open door policy for all
Tackle all problems upfront
Merit, justice, fair play be the hallmark
Transparency in all fields
Accountability of everyone
Corporate Strategy
In the long run the company desires to
become a profit earning concern by
minimizing the line losses and maximizing
the recovery. The company would like to
ensure availability of uninterrupted power
supply to the people of the thirteen districts
under its jurisdiction. To ensure that the
company is well managed and deliver
efficient and quality service to the
electricity consumer at the minimum cost possible.
Culture
IESCO has its own strong culture. The employees own the company.
13

Cover Value:
Business Strategy:
The business strategy is to provide electricity to the consumers at affordable rates.
The domestic consumers using less energy are charge at very low rates. The
commercial, industrial and big domestic consumers are charged very high rates. In
order to develop agriculture sector, subsidies provided and they are charged less rates
as compared to commercial and industrial consumers.
14
Merit Team Work
Efficiency Transparency
Safety

3.3) Breakdown:
Islamabad Circle
Islamabad Division 1 Islamabad Division 2 Barakahu Division
City Circle Rawalpindi
Rawat Division City Division Cantt Division (Rawalpindi) Satellite Town Division Westridge Division Tariqabad Division
Attock Circle
Taxila Division Pindigheb Division Attock Division
Chakwal Circle
Chakwal Division Talagang Division Dhudial Division Pind Dadan Khan Division
Jhelum Circle
Jhelum Division 1 Jhelum Division 2 Gujar Khan Division
15

Organizational Setup
Chief Executive Officer is the executive head responsible for efficient and effective running of the company. His team includes eight executive Directors:
Finance Director/Company Secretary Chief Engineer/Technical Director Chief Engineer/Operation Director Chief Engineer (Development) PMU Chief Engineer (P&E) Human Resource and Administration Director / Director General Chief Engineer / Customer Service Director Chief Engineer (O&M) T&G GSO
Other Manage rates
Manager Customer Services
Manager Material Management
Manager L&L
Manager Construction, Maintenance and Operation
Manager Grid System Operation
Manager Public Relation
Manager Computer Operation
Project Manager Construction Operation
Regional Manager Metering and Testing
Operational Setup
To ensure uninterrupted supply of electricity and most intimate customer services
IESCO is divided into four Circles, 19 Divisions and 94 Subdivisions.
Circle is headed by Superintending Engineers (SEs), Divisions are managed by
Executive Engineers (XENs) and Subdivisions are run by Sub Divisional Officers
(SDOs). Each division has a Customer Services Officer (CSO).
16

Area of Operation
Looks after the electricity distribution network in the administrative districts of
Rawalpindi, Chakwal, Attock, Jhelum and Federal Capital Islamabad.
17

GSO Circle 01
Operations Divisions 19
Operations Sub Divisions 102
Project directors Const/GSC 1 each
GSO/GSC/Tech Services Divisions 04 each
Construction Division 05
Construction Sub Division 18
18

3.4) Number of Employees:
S.# Category Distribution GSO Total
01 Officers Gr-18 & above 151 10 161
02 Assist: Managers 256 31 287
03 Assist: Managers (C.S) 25 0 25
04 LS-I 479 23 502
05 LS-II 408 5 413
06 SSO-I 1 109 110
07 SSO-II 1 218 219
08 Foreman 3 21 24
09 LFM-I (Foreman) 35 0 35
10 LFM-II (Foreman) 37 1 38
11 Commercial Assistant 637 0 637
12 LM-I (Lineman) 1559 63 1622
13 LM-II (Lineman) 1497 83 1580
14 ALM (Asstt: Lineman) 4154 53 4207
15 Meter Reader 1637 0 1637
16 Bill Distributor 440 0 440
17 Chowkidar / NQ 850 40 890
18 Clerks all types 957 24 981
19 Other Staff 2016 1369 3385
Grand Total 15143 2050 17193
19

4.) Organizational Structure:
4.1) Head Office:
WAPDA, the Pakistan Water and Power Development Authority, was created
in 1958 as a Semi-Autonomous Body for the purpose of coordinating and giving a
unified direction to the development of schemes in Water and Power Sectors, which
were previously being dealt with, by the respective Electricity and Irrigation
Department of the Provinces.
Since October 2007, WAPDA has been bifurcated into two distinct entities i.e.
WAPDA and Pakistan Electric Power Company (PEPCO). WAPDA is responsible for
water and hydropower development whereas PEPCO is vested with the
responsibility of thermal power generation, transmission, distribution and billing.
There is an independent Chairman and MD (PEPCO) www.pepco.gov.pk replacing
Chairman WAPDA and Member (Power) who were previously holding the additional
charges of these posts.
20

4.2) Geographical Map:
21

5). Board of Directors
Prime Minister of Pakistan has been pleased to approve reconstitution of IESCO Board Members. IESCO BOD consists of a blend of very experienced persons from Government/WAPDA and private sector.
22

Board of Directors
23

5.1) Attendance of Board MeetingsThe Board met eight (08) times during the FY-2011-12 an average participation of 74% of its members. The members' participation of the Board Meetings is:
N a m e Meetings * Attendance
Mr. Mohsin Khalid, Chairman 8 8
Mr. Javed Parvez, CEO/Director 8 6
Mr. Tariq Sadiq, Director 8 8
Asjad Imtiaz Ali, Director 8 8
Lt. Gen (R) Muhammad Asghar, Director 8 4
Mr. Muhammad Khalid Qureshi, Director 8 4
Dr. Sania Nishtar, Director 8 5
Mr. Farid Rehman, Director 8 3
Mr. Jawed Akhtar Bhatti, Director 6 5
Mr. Yassar Sakhi Butt, Director 6 5
Mr.Amjad Ali Khan, Director 2 2
Mr. Shahid Hussain Raja, Director 6 3
Mr.Mehfooz Ellahi, Director 2 2
Syed Ali Raza Saeed Shah, Director 2 2
88 65
24

Board of Director
Board Operations and Finance Committee Board Human Resource
CommitteeBoard Audit Committee
Chief Executive Officer
Executive Management
25

5.2) Auditing Committee
The Auditing Committee supervises all the operations and accounts of the IESCO.
The Office of the Governor is obliged to furnish all the information and documents
requested by the Auditing Committee. The Auditing Committee, having no
administrative power, submits its opinions in writing to the Board and also presents a
copy thereof to the Prime Ministry. The Committee submits to the General Assembly
a report to be drawn up on the operations and accounts of the IESCO as at the end of
the year. Members of the Auditing Committee serve for a term of two years. Members
of the Auditing Committee may not share in the profits of the IESCO.
5.3) Risk Management Committee of Board
The department is responsible for assessing and controlling the financial and
operational risks associated with the financial and real-estate investments of the
IESCO's capital, foreign exchange reserves, supplementary pension fund and other
euro and foreign currency portfolios.
It monitors decisions regarding the strategic allocation and tactical management of the
IESCO's portfolios and the supplementary pension fund.
It examines the methods of assessing and controlling financial risks, measures the
degree of risk present in the IESCO's portfolios and checks compliance with the limits
imposed on their management.
It oversees the management of the IESCO's equity holdings, including their risk
profile.
It is also responsible for assessing the risks associated with assets provided as
collateral for financing transactions.
26

5.4) Human Resources Manager
1. HR manager and his department is responsible provides proposals to the top
management for setting the IESCO’s personnel policy and for its effective
application;
2. recruits the personnel suitable to the IESCO’s needs, determines their
employment conditions and employs them in the organization according to
their qualifications;
3. conducts and follows the matters of all kinds pertaining to personnel;
4. executes the preparatory works for determination and development of the
remuneration policy;
5. informs the employees of the regulation pertaining to personnel, personal
rights, and social security;
6. Makes arrangements in the organization of the IESCO in order to increase the
productivity of operations, to cut the costs, to enhance the service quality and
develops the appropriate methods to this end.
7. conducts job analysis, job and task descriptions and their standardization
works; develops and implements the ways that set the productivity standards
of the employees and conducts analysis on the training needs of the personnel;
8. develops an effective training system in accordance with the IESCO’s general
objective and policy as well as technological, economic and social
developments, conducts research in this area, prepares, implements and
evaluates the training plans and programs.
27

Billing & Collection Profile:
28

Transmission lines and grids:
29

T & D Line Losses:
Transmission Losses:
Distribution Losses:
30

6). Board Committees Formulation:
Various committees comprising of honorable Board Members preferably from the
relevant field of expertise have been formulated to accord necessary approvals and
have a keen look into the day to day affairs of the company.
6.1) Auditing Committee:
The present Auditors M/S Taseer Hadi & co. Chartered Accountants retired and have
completed 12th years as Auditor have offered themselves for re-appointment.
Auditors' Report to the Members:-
We have audited the annexed balance sheet of Islamabad Electric Supply Company
Limited the Company as at 30 June 2012 and the related profit and loss account,
statement of comprehensive income, cash flow statement and statement of changes in
equity together with the notes forming part thereof, for the year then ended and we
state that we have obtained all the information" and explanations which, to the best of
our knowledge and belief, were necessary for the purposes of our audit.
It is the responsibility of the Company's management to establish and maintain a
system of internal control, and prepare and present the above said statements in
conformity with the approved accounting standards and the requirements of
Companies Ordinance, 1984. Our responsibility is to express an opinion on these
statements based on our audit.
We conducted our audit in accordance with the auditing standards as applicable in
Pakistan. These standards require that we plan and perform the audit to obtain
reasonable assurance about whether the financial statements are free of any material
misstatement. An audit includes examining on a test basis, evidence supporting the
amounts and disclosures in the above said statements.
An audit also includes assessing the accounting policies and significant estimates
made by management, as well as, evaluating the overall presentation of the above said
statements.
31

We believe that our audit provides a reasonable basis for our opinion and, after due
verification, we report that:
a) The Company's management based on its interpretation of the short order of
Honorable Islamabad High Court dated 24 October 2012 has not reversed electricity
sales the revenue amounting to Rs.14, 554.34 million relating to the years from 30
June 2009 to 2012.
Had the electricity sales been reversed, loss for the year ended 30 June 2012 would
have increased by Rs.9, 634.28 million with the effect of reversal of electricity sales
for the year ended 30 June 2012 and Rs.4, 920.06 million with the effect of reversal of
electricity sales relating to prior years and accumulated loss as at 30 June 2012 would
have increased by Rs.14, 554.34 million.
b) In our opinion:
i) Except for the effect of the matter described in paragraph (a) above, the balance
sheet and profit and loss account together with the notes thereon have been drawn up
in conformity with the Companies Ordinance, 1984, and are in agreement with the
books of account and are further in accordance with the accounting policies
consistently applied.
ii) The expenditure incurred during the year was for the purpose of the Company's
business and
iii) The business conducted, investments made and the expenditure incurred during
the year were in accordance with the objects of the Company;
c) The balance sheet, profit and loss account, statement of comprehensive income,
cash flow statement and statement of changes in equity together with the notes
forming part thereof conform with the approved accounting standards as applicable
in Pakistan, and give the information required by the Companies Ordinance, 1984, in
the manner so required and respectively give a true and fair view of the state of the
Company's affairs as at 30 June 2012 and of the loss, its cash flows and changes in
equity for the year then ended.
32

Where it has been explained along with the other matters that the management has
taken up the matter of long outstanding receivable of Rs.10,076 million from the
Government of Azad Jammu and Kashmir (GoAJK) with the Ministry of Water and
Power, Government of Pakistan (MOW&P) and MOW&P has confirmed that the
matter is under deliberation with Ministry of Finance and GoAJK and early
settlement is expected.
Further MOW&P in a meeting with the Chief Executives of distribution companies
has instructed note to recognized provision against this receivable as there are bright
chances of recovery of this amount. Accordingly the management is confident of
complete recovery of this amount. Our opinion is not qualified in this regard.
4.4) Self Generation:
Keeping in view the worst Energy crisis prevailing in the country at present and due
to mounting public pressure on DISCO's dealing the end consumers, the management
of company may think to go for self-generation in the upcoming years.
4.5) Enterprise Resource Planning:
IESCO's Management is enthusiastically heading towards implementation of ERP and
all possible efforts are being carried out to implement ERP during 2012-2013.
33

4.6: Reports
1. Income Statement
Income statement or report of income, indicate the amount of revenue received and
expenses incurred over a specific period of time. Income statement is record of
financial flow over time. Actual income report is usually more complicated than this
simple statement because each item may have several component accounts. Its
major’s items are:
Interest IncomeInterest Expense Non Interest IncomeNon Interest Expense
So, the difference between all revenues and expenses is net income. Thus:
Net income = Total revenue items – Total expense items
IESCOs take deposits from savers and pay interest on some of these accounts. They
pass these funds on to borrowers and receive interest on the loans. Their profits are
derived from the spread between the rate they pay for funds and the rate they receive
from borrowers. This ability to pool deposits from many sources that can be lent to
many different borrowers creates the flow of funds inherent in the IESCO system. By
managing this flow of funds, IESCO generate profits, acting as the intermediary of
interest paid and interest received, and taking on the risks of offering credit.
2. Balance Sheet
IESCO’s balance sheet displays the yield generated from earning assets and interest
bearing deposits. IESCO provide first of all, the balance sheet a balance of Assets,
Liabilities and equity items balance at the end of the period. Balances provide for
better analytical framework to help understand the financial performance. Balance of
Assets, Liabilities and equity item there is a corresponding cash, loan, deposit,
advances reveres etc.
3.
34

3. Loan Report
Loan/Credit reports is prepare for mortgage rates, credit card approvals and apartment
requests. Reviewing credit reports helps management catch signs of identity theft
early. Loan report contain following information:
Which type of loan sanction
Volume of loan
Time line
Up to date on loans
4. Compliance Report
Statement of compliance of IESCO is prepared in accordance with the approved
accounting standards as applicable in Pakistan. Approved accounting standards
comprise of such International Financial Reporting Standards (I FRS) issued by the
International Accounting Standards Board and Islamic Financial Accounting
Standards issued by the Institute of Chartered Accountants of Pakistan as are notified
under the Companies Ordinance, 1984, provisions of and directives issued under the
Companies Ordinance, 1984.
5: FINANCIAL RISK MANAGEMENT
The Company has exposure to the following risks from its use of financial instruments:
Credit riskLiquidity riskMarket risk
This note presents information about the company's exposure to each of the above
risks, the Company's objectives, policies and processes for measuring and managing
risk and management of capital. Further quantitative disclosures are included
throughout these financial statements.
35

5.1. Risk management frame work:
The Board of Directors has overall responsibility for the establishment and oversight
of the Company's risk management framework. The Board is responsible for
developing and monitoring the Company's risk management policies.
The Company's risk management policies are established to identify and analyze the
risks faced by the Company, to set appropriate risk limits and controls, and to
monitor risks and adherence to limits. Risk management policies and systems are
reviewed regularly to reflect changes in market conditions and the Company's
activities. The Company, through its training and management standards and
procedures, aims to develop a disciplined and constructive control environment in
which all employees understand their roles and obligations.
The Company's Board oversees how management monitors compliance with the
company's risk management policies and procedures and reviews the adequacy of
the risk management framework in relation to the risks faced by the Company. The
Board is assisted in its oversight role by Internal Audit. Internal Audit undertakes
both regular and ad hoc reviews of risk management controls and procedures, the
results of which are reported to the Board.
5.2: Credit risk:
Credit risk is the risk of financial loss to the Company if a consumer or counterparty
to a financial instrument fails to meet its contractual obligations. The Company is
exposed to credit risk to the extent of loans, deposits and advances, trade debts,
interest accrued, other receivables and IESCO balances. The Company deals with
regular and permanent consumers who normally make payments on time.
36

The Company controls its credit risk by continuous monitoring of its receivables. The
management believes that there is no credit risk involved in respect of receivables
from the Government of Pakistan.
5.3: Market risk
Market risk is the risk that changes in market prices, such as foreign exchange rates,
interest rates and equity prices will affect the company's income or the value of its
holdings of financial instruments. The objective of market risk management is to
manage and control market risk exposures within acceptable parameters, while
optimizing the return. The Company is exposed to currency risk and interest rate risk
only.
37

5.4: Exposure to currency risk
The Company is exposed to currency risk on long term loans in a currency other than
the respective functional currency of the Company, primarily in U.S. Dollars. The
Company's exposure to foreign currency risk is as follows:
6: BRANCH:
6.1 : Account Officer
An account officer is responsible to look after the financial part of IESCO. He is also
given the responsibility of financial planning and record keeping of all the account.
Essential Duties:
The main purpose of an account officer is to analyze financial activities.
He is also responsible for promotion of all the products.
An account officer maintains the growth targets of finance in IESCO.
Helps in solving due accounts of the past.
The looks after managing financial risks.
He reviews all the necessary documents to avoid disputes.
If any financial problem arises, it is his duty to look after the matter and solve it.
He is responsible for all the client communications.
38

Account officers prepare the budget for the IESCO they are working under. He
compares previous year's budgets and tries to improve the drawbacks.
They should be prepared to lead during crisis.
An account officer must maintain payments and receipts.
He must ensure all the bills are paid properly.
He files of return in FBR.
Another important duty of an account officer is to look whether all the audit
objectives and audit statements are responded properly.
He should allocate works to staffs according to workload.
Look after weekly/monthly reports.
6.2: Clearing Officer
Compiles settlement data and submits checks, drafts, and other items to clearinghouse
association for exchange and settlement with other IESCOs: Sorts items into bundles,
lists items, and totals amounts, using adding machine or calculator. Clearing officer
posts totals to clearinghouse settlement sheet.
Mails or delivers items to clearinghouse. Accepts items from clearinghouse that have been drawn on own IESCO and posts totals on settlement sheet. Totals debit and credit columns and computes net balance. Clearing officer have submits sheet to clearinghouse for verification. May maintain telephone contact with IESCO personnel and others to locate missing checks, correct errors, and reconcile differences in records.
Essential Duties:
Outward clearing: Receive and verify outward cheques from branches and
process them for clearing
Inward clearing: Attend clearing house sessions to collect inward cheques and
thereafter post and distribute them to branches
On a daily basis balance Head Office clearing accounts
Processing EFTs: Collect and process EFT’s from inter IESCO and other WAPDA
branches by attending the clearing house sessions and thereafter credit the
corresponding beneficiary customer account.
Processing Telegraphic Transfers by assist customers in filling in Telegraphic
Transfers form instructions
Process Telegraphic Transfers instructions in SWIFT system
39

Prepare daily and monthly Exchange report to Head office
Process funds transfers (both internal and inter branch) as instructed by State
IESCO Pakistan
Reconcile cheques both inward and outward on head office clearing account
and IESCO clearing statement
Liaise with the reconciliation officer to point out outstanding transactions
6.3: Cashier
A teller is an employee of IESCO who deals directly with most customers. In some
places, this employee is known as a cashier. In IESCO teller jobs require cash
handling experience and a high school diploma. Most IESCO provide on the job
training.
Primary fun actions are:
Cashing cheques
Checking statements
Processing payments
Making money transfers
Updating account details
This is because they are the first people that a customer sees at the IESCO and are
also the people most likely to detect and stop fraudulent transactions in order to
prevent losses at IESCO (counterfeit currency and checks, identity theft, confidence
tricks, etc.). In IESCO also requires tellers to be friendly and interact with the
customers, providing them with information about customers' accounts and IESCO
services.
Tellers work from a station, usually located on a Teller Line. Most stations have:
A teller system, which includes cash drawers, receipt validate/printers, proof work
sorters, and paperwork used for completing IESCO transactions.
40

These transactions include:
Check cashing, depositing, transfers, wire transfers
Receive checking and savings deposits: verify cash and endorsements, receive
proper identification for cash back, and issue receipts of deposit.
Examine checks deposited and determine proper funds availability based on
regulation requirements and complete Hold Notices.
Answer basic customer inquiries regarding interest rates, service charges, and
account histories while complying with disclosure requirements, regulations
and consumer privacy policies.
Cross-sell IESCO products and services.
Issuing negotiable items (cashier's checks, traveler's cheques, money orders,
federal draft issuances, etc.)
Payment collecting
Savings bond purchase or redemption
Resolving customer issues
6.4 : Customer Service Officer
A Customer Service Officer at IESCO, often known as a new accounts representative,
helps customers set up new checking, savings, and investment accounts. Even though
they work with loan officers to meet client needs, they usually only help with
preliminary customer requests and general product offerings but don't perform
underwriting duties or finalize loans.
41

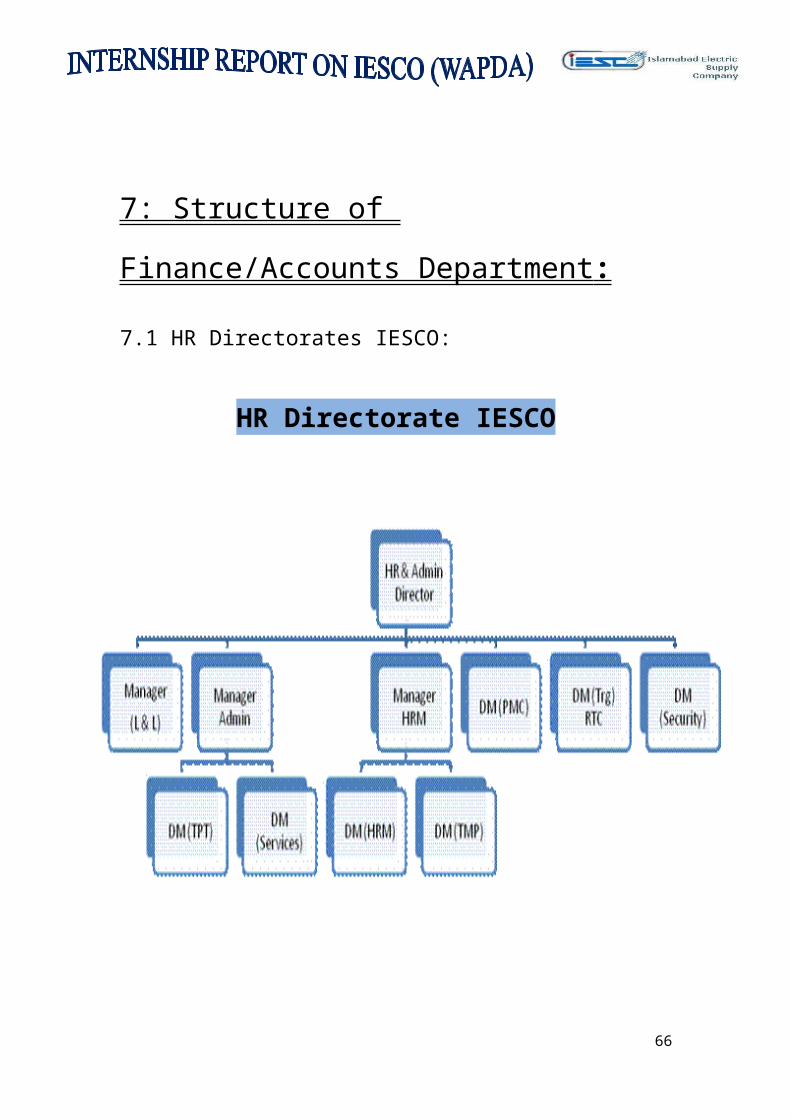
7: Structure of Finance/Accounts Department :
7.1 HR Directorates IESCO:
HR Directorate IESCO
42

Operation Directorate
The basic tasks performed by the operation directorate are:
Operation and maintenance of distribution system
Operation and maintenance of sub-transmission and grid systems
The Directorate consists of the following departments: -
O&M (T&Gs) Department
The Operation & Maintenance (Transmission and Grid Stations) - O&M (T&Gs)
department headed by a Senior Manager is responsible for the electrical network at
132KV and 66KV and has under its purview 67 132KV and 15 66KV Grid Stations
and 1515 KMs of 132KV and 628 KMs of 66KV lines. The department carries out its
functions in the field through the Superintending Engineer (Grid System Operation)
SE (GSO) by issuing guidelines, schedules and authorization for the preventive and
emergency maintenance programs, and carries out frequent inspection to ensure
compliance by the field organization.
O&M (Dist) Department
The Operation & Maintenance (Distribution) - O&M (Dist) department
headed by a Senior Manager, is responsible for the electrical system at 11KV and
400V. Policy guidelines, schedules and authorization for maintenance of feeders are
issued to the 6 operating circles in the field headed by then Superintending Engineers
and frequent inspections are carried out to ensure compliance. The department also
has a civil engineering division headed by an Executive Engineer for the design,
construction and maintenance of all the buildings of IESCO.
43

Technical Services Department
The Technical Services Department carries out the testing, calibration and
repair of all the energy meters, and also the installation of the maximum demand
meters. It is headed by 02 Managers who have 03 distribution circles each as their
areas of responsibility.
PDC Department
The Power Distribution Control Department headed by an Executive Engineer
has been set up to monitor the entire electrical network of IESCO round the clock.
Information about the supply breakdowns, major equipment damages and occurrences
of importance are received through telephone and fax from the field and are
transmitted to the highest level in IESCO and WAPDA, and then instructions are
passed for situation management.
Safety Department
The Safety Department headed by a Deputy Manager ensures that the system
is operated in compliance with the statutory provisions regarding safety for the
employees and the public. Frequent inspections are carried out and safety parades by
the employees are held to ensure that working practices are safe and the employees
are adequately trained in safety measures. Every accident occurring to an employee,
member of public or animal is investigated meticulously and lessons learnt and
disseminated.
In order to update the assets information and to monitor the efficacy of its
operation, maintenance and safety policies and programs related to the entire IESCO
electrical network, the following returns are prepared and issued.
44

Technical Services and Operations
M&T organization is one of the most important departments in IESCO, the
company revenue depends on accurate functioning of its cash box i.e., energy meter,
M&T deals with checking installation, testing and re-calibration of energy meters the
importance of M&T can’t be over emphasized. It also attends any fault in metering
equipment involving panels, MDI meter, C.Ts, P.Ts or cable and this ensures
continuity of supply to consumer using electricity in bulk. The low losses in B-2 & B-
3 units of IESCO speak volumes for efficiency of M&T department. It has dedicated
and devoted staff and ready for duty at call at any time. This department also enables
operation wing to reutilize defective T&P meters and thus saving a large amount of
revenue by repairing these meters.
Material Management Directorate
Pre qualification and Registration of firms for supply of distribution / GSO Material
Procurement of material through tender Disposal of unserviceable material / vehicles
through tender and auction Formation of rate contract for regular supply of material
with firms.
Arrangement of all kinds of material including T&P items from other DISCOs as per
requirement of field formations.
Maintaining of minimum and maximum level of material in stores
Issuance of material as per requirements of field formation
(A) Private New Connection & Extension of Load
(B) Government Connection
(C) Housing Schemes
(D) Others Works
45

Training Centers
IESCO also provides refresher courses to the employees for working in
computer based and modern systems. The newly induced employees are enrolled for
newly induction program and they are trained for IESCO environment and systems.
Since the situation of Law and Order is very spoil in our county therefore security
staff of the IESCO is also provided refresher courses to familiar with advance security
systems and arms. For this purpose a Training center is established in 220KV Grid
Station Bund Road Lahore. All the newly induced officials and officers are required
to pass their newly induction courses. The departmental promotion exams and training
is also performed in this center.
Customer Services Directorate
The tasks assigned to Customer Services Directorate in IESCO are:
Implementation of Commercial Policies
Monitoring and management of recovery process
Monitoring of line losses and preparation of accurate line losses statements
Settling consumer disputes involving technical, commercial and tariff issues
Processing and monitoring policies and procedures for Customer Services
Processing/sanctioning of various incentives for customers and employees
introduced from time to time.
Effective marketing of electricity
Tariff structuring and management of other tariff related matters
Compilation of statistical data and management returns
Co-ordination with Manager MIS for regulating effective billing program
Surveillance and detection of electricity theft
Taking effective measures for prevention of electricity theft
46

8: CRITICAL ANALYSIS:
Risk Framework of IESCO
Almost all of the IESCO explain their risk management framework in their annual
reports. Management of risk is a core function of IESCO. The reason is that it
performs vital activities of measuring, monitoring, controlling and reporting credit,
market, liquidity and operational risks. According to the Annual Report 2010 of
IESCO the economic and security situation witnessed by Pakistan during 2010
demanded further strengthening of the IESCO's internal risk and management
controls through a renewed focus on special asset and portfolio management. In order
to be in a better position to respond to all the challenges faced by the IESCO and to
effectively monitor and control the resulting shocks the Risk Management Framework
was revitalized through integrated risk management approach for managing credit
risk, market risk, liquidity risk and operational risk. A dedicated Risk Management
Division (RMD) is in place with the General Manager of RMD department reporting
directly to the Chief Executive Officer. Risk Management Division has been
structured to address credit, market, IT and operational risk. This division consists of
highly capable people. The IESCOs face a number of risk during their operations
however there are a certain number of risks that are considered to be the main types of
risks. IESCO is no exception to that as it also faces the same types of risk faced by
other commercial IESCOs in the market. These main risks are:
1- Credit Risk: Risk from the borrower as he fails to repay the money to the
IESCO.
2- Liquidity Risk: Risk than a security/asset cannot be traded in a quick time
frame in the market.
3- Market Risk: Risk of the reduction in value of a portfolio due to market
conditions.
4- Operational Risk: Risk due to the transactions of the business.
47

48

B A L A N C E S H E E TB A L A N C E S H E E T
ITEMS2011PKR in Min
2010PKR in Min
2009PKR in Min
2008PKR in Min
2007PKR in Min
ASSETS
Cash and Balance 8,959 7,248 6,471 5,647 5,861
Balances 879 1,400 1,497 3,909 4,350Lending to financial and Other Institutions
813 2,532 2,755 3,990 3,175
Investment 45,776 34,986 29,537 14,053 19,182
Advances 65,340 54,676 48,727 47,575 40,154
Operating fixed assets 3,834 3,469 3,334 3,127 2,151Deferred tax assets- net 362 385 108 126 --
Other assets 3,769 3,410 2,881 2,550 1,981Total Assets 129,732 108,106 95,310 80,977 76,854
LIABILITIES
Deposits and other accounts 99,734 82,017 73,548 61,634 60,150Borrowings 14,557 12,371 9,386 8,441 5,865Bills payable 1,571 1,858 1,763 1,255 1,641Other liabilities 1,995 1,745 1,612 1,336 964Deferred tax liabilities – net -- -- -- -- 425
Sub-ordinate loans 898 1,197 1,198 1,198 1,199
Total Liabilities 118,755 99,188 87,507 73,864 70,244
REPRESENTED BY:
Share Capital 8,028 6,023 5,019 4,114 4,114
Reserves 1,183 2,029 2,004 2,017 1,877
Inappropriate profit 1,026 329 158 835 239Surplus on revaluation of assets (net of tax)
740 537 622 147 380
Total Equity 10,977 8,918 7,803 7,113 6,610Net worth (assets=liabilities + equity )
129,732 108,106 95,310 80,977 76,854
49

P R O F I T & L O S S S T A T E M E N TP R O F I T & L O S S S T A T E M E N T
ITEMS
2011
Rs.in Min
2010
Rs.in Min
2009
Rs.in Min
2008
Rs.in Min
2007
Rs.in Min
Profit 12,895 10,250 9,337 7,823 6,272
Fee, commission, brokerage and exchange income
915 603 673 638 472
Capital gain and dividend income 428 175 120 268 331
Other income 612 450 375 320 263
TOTAL INCOME 14,850 11,478 10,505 9,049 7,338
Profit 8,997 7,203 6,603 4,878 4,334
Operating expenses 3,503 2,683 2,079 1,952 1,293
Provisions 1,272 1,452 1,633 1,266 235
Taxation 294 15 45 252 476
TOTAL EXPENSES (14,066) (11,353) (10,360) (8,348) (6,338)
PROFIT AFTER TAXATION 784 125 145 701 1,000
50

9: Ratio Analysis
A ratio is simple arithmetical expression of the relationship of one number to another.
It may be defined as the indicated quotient of two mathematical expressions.
According to Accountant’s Handbook by Wixon, Kell and Bedford, “a ratio is an
expression of the quantitative relationship between two numbers”.
Ratio analysis is the process of determining and presenting the relationship of items
and group of items in the statements. According to Batty J. Management Accounting,
“Ratio can assist management in its basic functions of forecasting, planning
coordination, control and communication”.
It is helpful to know about the liquidity, solvency, capital structure and profitability
of an organization. It is helpful tool to aid in applying judgments, otherwise complex
situations. Ratio analysis can represent following three methods and can say, may be
expressed in the following three ways:
1. Pure Ratio or Simple Ratio: - It is expressed by the simple division of one
number by another
2. ‘Rate’ or ‘so Many Times: - In this type, it is calculated how many times a
figure is, in comparison to another figure.
3. Percentage: - In this type, the relation between two figures is expressed in
hundredth.
ADVANTAGE OF RATIO ANALYSIS
1. Helpful in locating the weak spots of the business.
2. Helpful in forecasting and estimate about the trend of the business.
3. Fixation of ideal standards.
4. Study of financial soundness and effective control
Limitations of Ratio Analysis
1. Comparison not possible if different firms adopt different accounting policies.
2. Ratio analysis becomes less effective due to price level changes.
3. Ratio may be misleading in the absence of absolute data.
4. Limited use of a single data.
5. Lack of proper standards.
6. False accounting data gives false ratio.
51

10: IESCO RATIO ANALYSIS
A. PERFORMANCE
1. Return On Equity
2. Return On Assets
3. Provision Expense / Pre Provision Profit
4. Cost To Income Ratio:
5. Other Operating Income / Total Net Revenue
6. Internal Growth Rate
7. Capital Gearing Ratio
8. Working Capital Turnover Ratio
B. CAPITAL ADEQUACY
9. Capital Ratio
10. Capital Formation Rate (Internal Capital Generation)
11. Leverage Ratio = Total Assets Equity Capital
12. Leverage Ratio (2) =Loan Loss Reserve Tot Loans
13. Weighted Average Cost Of Capital (WACC)
14. Working Capital
15. Employed Capital
16. Fixed Assets To Proprietor’s Fund Ratio
C. LIQUIDITY
17. Current Ratio
18. Liquid Assets / Deposits And Borrowings
19. Loans / Deposits
20. Loans / Deposits And Borrowing
21. Loans / Total Assets
22. Cash & Due From BanksTotal Assets
23. CASA Ratio
D. OPERATING EFFICIENCY
24. Total Operating Expense Operating Income
25. Operating Income/ Assets
26. Net Profit Margin =Net Profit Gross Operating Income
27. Net Interest Margin =Total Non-Interest IncomeTotal Assets
28. Interest Expense/ Operating Income
29. Interest Expense/ Total Income
30. Total Interest ExpTotal Assets
31. Internal Fund = Retaining Earning +Deprecation
52

E. CREDIT PERFORMANCE
32. Provisions/ Gross Advance
33. Liquid Asset To Deposits And Short Term Loan (LADST)
34. Interest Coverage Ratio
F.INTERMEDIATION EFFICIENCY
35. NIMR (Net Interest/Mark-Up Revenue) / Avg. Assets Investments)]
36. Yield On Asset =[Interest Earned/Average (Earning Assets-Equity)]
37. Yield On Assets(2) = Total Interest IncomeTotal Assets
38. Yield On Assets (4)= Total Interest Expense Total Assets
39. Yield On Assets(3) = Interest Expense/Gross Operating Income
40. [Cost Of Interest Expensed / Average (Deposits + Borrowings)]
41. Spread
G. TAX MANAGEMENT MEASURES
42. Tax Exempt Position =Loan Loss Provision Total Income
43. Provision Expense / Pre Provision Profit
44. Interest Paid / Pre- Interest And Tax Profit
45. Deprecation /Pre- Depreciation, Interest And Tax Profit
10.1 : IESCO RATIO ANALYSIS
A. PERFORMANCE
Return On Equity
Return On Assets
Provision Expense / Pre Provision Profit
Cost To Income Ratio:
Other Operating Income / Total Net Revenue
Internal Growth Rate
Capital Gearing Ratio
Working Capital Turnover Ratio
53

1. Return on Equity:
Return on Equity / Return on Assets
Returns on equity and assets are well-established metrics long used in fundamental analysis
across a wide range of industries. Return on equity is especially useful in the valuation of banks,
as traditional cash flow models can be very difficult to construct for IESCO, and return-on-
equity models can offer similar information.
Return on Equity 2011
%
2010
%
2009
%
2008
%
2007
%
6.18814 5.57138 5.26597 5.080455 5.353007
Comment
By dividing profit after tax on share capital for 5 years I come to know that IESCO return on
equity is lie between the ranges of 5-6 in increasing trend. IESCO is raising capital and profit
side by side.
54

2. Return on Assets
Return on Assets 2011
%
2010
%
2009
%
2008
%
2007
%
0.604323 0.115627
0.152135 0.865678 1.301168
Comments
IESCO ROA overall decrease which show IESCO management not properly deploy asset into
earning 2007 it was 1.3% but afterward it decrease. But in 2011 ROA restart to improve.
55

3. Provision Expense / Pre Provision Profit
Provision Expense / Pre Provision Profit
2011 2010 2009 2008 2007
ITEMS Rs.in Min Rs.in MinRs.in Min
Rs.in Min
Rs.in Min
Provisions Expense
1,272 1,452 1,633 1,266 235
Pre Provision Profit
2,350 1,592 1,823 2,219 1,711
Formula : Provision Expense / Pre Provision Profit
PERCENTAGE 54.12766 91.20603 89.57762 57.05273 13.73466
Comments
IESCO deducts provision form Total income to know actual profit. This act can save bank form huge
amount of Tax and a good indicator of bank performance.
56
PRE PROVISION PROFIT
(Working 1)
a) Profit after taxation
784 125 145 701 1,000
b) Provisions Expense
1,272 1,452 1,633 1,266 235
c) Taxation 294 15 45 252 476
Pre Provision Profit = a +b + c
Pre Provision Profit 2,350 1,592 1,823 2,219 1,711

4. Other Operating Income / Total Net Revenue
Operating Income / Total Net Revenue
ITEMS 2011 2010 2009 2008 2007
Rs.in Min Rs.in Min Rs.in Min Rs.in MinRs.in Min
Operating Income 1343 778 793 906 803
Total Net Revenue 784 125 145 701 1000
Formula: Operating Income / Total Net Revenue
% % % % %
Operating Income /Total Net Revenue
1.71301 6.224 5.4689 1.2924 0.803
Working 2
ITEMS
2011 2010 2009 2008 2007
Rs.in Min
Rs.in Min
Rs.in Min
Rs.in Min
Rs.in Min
Fee, commission, brokerage and exchange income
915 603 673 638 472
Capital gain and dividend income
428 175 120 268 331
Total Operating Income 1343 778 793 906 803
Comments
57

Here, I use the ratio of” Operating Income / Total Net Revenue” to analysis how much IESCO
earns other then interest income to measure the performance.
In 2007 Operating Income / Total Net Revenue was less than 1 % in 2008-2010 it increase but in
2011 Operating Income / Total Net Revenue ratio again decrease.
Reason behind it is that management mostly relay on interest income.
5. Internal Growth Rate
Internal growth rate is measure by divide retain earning on net assets. Internal growth is use to
evaluate the management performances.
Internal Growth Rate
2011 2010 2009 2008 2007
ITEMS Rs.in Min Rs.in Min Rs.in Min Rs.in Min Rs.in Min
Retain Earning
588 93.75 108.75 525.75 750
Net Assets
129,732 108,106 95,310 80,977 76,854
Internal Growth Rate = Retain earning/ net assets
IG Rate 0.45% 0.09% 0.11% 0.65% 0.98%
IESCO deploy retain earning into assets at the ratio of .98% while 1% is benchmark which IESCO fail to achieve. From 2007 to 2010 it decrease and in 2011 it increase at .45%.
6. Capital Gearing Ratio
Capital Gearing ratio establishes a relationship between equity capital (including all reserves
and undistributed profits) and fixed cost bearing capital. If the amount of fixed cost bearing
capital is more than the equity share capital including reserves an undistributed profits), it will be
called high capital gearing and if it is less, it will be called low capital gearing.
58

59

Formula:
Capital Gearing Ratio = [Equity Share Capital+ Reserves + P&L Balance/ Fixed Cost
Bearing Capital]
Capital Gearing Ratio
2011 2010 2009 2008 2007
Items PKR in Min PKR in Min PKR in Min PKR in Min PKR in Min
1. Share Capital 8,028 6,023 5,019 4,114 4,114
2. Reserves 1,183 2,029 2,004 2,017 1,877
3. P&L Balance 784 125 145 701 1,000
Total (1+2+3) 9,995 8,177 7,168 6,832 6,991
Fixed Cost Bearing Capital
14557 12371 9386 8441 5865
[Equity Share Capital+ Reserves + P&L Balance/ Fixed Cost Bearing Capital]
Capital Gearing Ratio 69% 66% 76% 81% 119%
Whereas, Fixed Cost Bearing Capital = Preference Share Capital + Debentures + Long Term
Loan (IESCO neither issue preference stock nor debentures) so long term loan only consider as
fixed cost bearing capital.
Comments
IESCO Capital Gearing ratio is too high like 119% in 2007 and 69-81% in 2008-11 and high
gearing will be beneficial to equity shareholders when the rate of interest/dividend payable on
fixed cost bearing capital is lower than the rate of return on investment in business.
60

7. Working Capital Turnover Ratio
This ratio reveals how efficiently working capital has been utilized in making income.
Formula: - Working Capital Turnover Ratio = operating Expense / Working Capital
This ratio is of particular importance in banks where current assets play a major role in generating income. It shows the number of times working capital has been rotated in producing sales.
A high working capital turnover ratio shows efficient use of working capital and quick turnover of current assets like stock and debtors. A low working capital turnover ratio indicates under-utilization of working capital.
Working Capital Turnover Ratio
2011 2010 2009 2008 2007
ITEMS PKR in Min PKR in Min PKR in MinPKR in Min
PKR in Min
Operating expenses 3,503 2,683 2,079 1,952 1,293
Working Capital 5,905 4,596 4,290 3,844 5,066
Formula: - Operating Expense / Working Capital
Working Capital Turnover Ratio
59% 58% 48% 51% 26%
Times Times Times Times Times
3:5 3:5 1:2 1:2 1:4
IESCO Working Capital Turnover Ratio is good in 2007 because if operating Expense is 1 then Working
Capital is 4 and 2007-11 Working Capital is more then it operating expense. Ratio has increase trends
which is significance of good performance.
61

8. Capital Ratio
CAPITAL RATIO
2011 2010 2009 2008 2007
ITEMS PKR in Min PKR in Min PKR in Min PKR in Min PKR in Min
Share Capital 10,977 8,918 7,803 7,113 6,610
Total assets 129,732 108,106 95,310 80,977 76,854
Formula: Capital Ratio=Equity / Total Assets
% % % % %
Equity / Total Assets
8.4612894 8.24931086 8.1869688 8.7839757 8.600723
Formula = Retained Earnings / Capital Equity
Comments: IESCO ICGR in 2007 was good as 11% but 7% in 2008 in 2009-10 it decrease at its lower level
as 1%. Because IESCO income was low in these period. 2001 it increase at 5% due to increase in income.
62
Internal Capital Generation Rate (ICGR) 2011 2010 2009 2008 2007
ITEMS Rs.in Min Rs.in Min Rs.in Min
Rs.in Min
Rs.in Min
Retained Earnings
588 93.75 108.75 525.75 750
Total Equity
10,977 8,918 7,803 7,113 6,610
Formula = Retained Earnings / Capital Equity ICGR 5.36% 1.05% 1.39% 7.39% 11.35%

9. Leverage Ratio = Total Assets Equity Capital
Leverage Ratio
2011 2010 2009 2008 2007
ITEMS PKR in MinPKR in Min
PKR in Min
PKR in Min
PKR in Min
Total assets
129,732 108,106 95,310 80,977 76,854
Total equity
10,977 8,918 7,803 7,113 6,610
Leverage Ratio = Total Assets Equity Capital
Leverage Ratio
11.8185297 12.12222 12.21453 11.38437 11.62693
Comments
IESCO leverage ratio is 11-12 times in five years management maintain assets and increasing
trend. IESCO have enough leverage to meet liquidity crunch.
63

10. Working Capital
Working Capital
Items 2011 2010 2009 2008 2007
PKR in Min PKR in Min PKR in Min PKR in Min PKR in Min
Current Assets 121,767 100,842 88,987 75,174 72,722
Current Liabilities 115,862 96,246 84,697 71,330 67,656
Formula= Current Assets – Current Liabilities
Working Capital 5,905 4,596 4,290 3,844 5,066
Comment IESCO enjoy working capital in 2007 good but decrease in 2008 -9 in 2010-11 almost get back
their sustain able situation. Decreasing (reason - raison d'être) is increase in current liabilities.
Current Ratio
This ratio explains the relationship between current assets and current liabilities of IESCO.
Current Assets:-‘Current assets’ includes those assets which can be converted into cash with in a year’s
time.
Current Assets = Cash in Hand + Cash at Bank + B/R + Short Term Investment + Debtors (Debtors –
Provision) + Prepaid Expenses.
Current Liabilities: - ‘Current liabilities’ include those liabilities which are repayable in a year’s time.
Current Liabilities = Bank Overdraft + B/P + Creditors + Provision for Taxation + Proposed Dividend +
Unclaimed Dividends + Outstanding Expenses + Loans Payable within a Year.
64

Comments
According to accounting principles, a current ratio of 2:1 is supposed to be an ideal ratio. It means that
current assets of a business should, at least, be twice of its current liabilities. IESCO higher ratio indicates
the better liquidity position; the firm will be able to pay its current liabilities more easily. If the ratio is
less than 2:1, it indicates lack of liquidity and shortage of working capital.
65
working
Current Assets2011 2010 2009 2008 2007
PKR in Min PKR in Min PKR in Min PKR in Min PKR in Min
Cash and Balance 8,959 7,248 6,471 5,647 5,861
Balances with Other WAPDA branches
879 1,400 1,497 3,909 4,350
Lending to financial and Other Institutions
813 2,532 2,755 3,990 3,175
Investment 45,776 34,986 29,537 14,053 19,182
Advances 65,340 54,676 48,727 47,575 40,154
TOTAL 121,767 100,842 88,987 75,174 72,722
Current Liabilities2011 2010 2009 2008 2007
PKR in Min PKR in Min PKR in Min PKR in Min PKR in Min
Deposits and other accounts
99,734 82,017 73,548 61,634 60,150
Borrowings 14,557 12,371 9,386 8,441 5,865
Bills payable 1,571 1,858 1,763 1,255 1,641
TOTAL 115,862 96,246 84,697 71,330 67,656
The biggest drawback of the current ratio is that it is susceptible to “window dressing”. This ratio can be
improved by an equal decrease in both current assets and current liabilities.
11. Liquid Assets / Deposits And Borrowings
Liquid Assets / Deposits And Borrowings
2011 2010 2009 2008 2007
ITEMS PKR in Min PKR in Min
PKR in Min PKR in Min
PKR in Min
Liquid Assets 125601 104311 92321 78301 74873
Deposits + Borrowings 114,291 94,388 82,934 70,075 66,015
Liquid Assets / Deposits And Borrowings
Liquid Assets / Deposits And Borrowings
1.098958 1.1051298 1.113186 1.117389 1.134182
Comments
IESCO liquid assets to deposits and borrowings ratio is 1 over 5 years. And it has no big change.
Because IESCO keep equal liquid asset equal to Deposit and browning.
66

12. Loans / Deposits
Loans / Deposits
2011 2010 2009 2008 2007
ITEMS PKR in Min PKR in Min PKR in Min PKR in Min PKR in Min
Loans 65,340 54,676 48,727 47,575 40,154
Deposits 99,734 82,017 73,548 61,634 60,150
Formula: Loans / Deposits
% % % % %
Loans / Deposits 65.51427 66.6642366.2519
7 77.189538 66.75644
Comments:
The loan/deposit ratio helps assess IESCO’s liquidity, and by extension, the aggressiveness of the bank's
management. IESCO the loan/deposit ratio is too high; the bank could be vulnerable to any sudden
adverse changes in its deposit base. 2007-11 Loans / Deposits ratio is 66 %.
67

13. Loans / Deposits And Borrowing
Loans / Deposits And Borrowing
2011 2010 2009 2008 2007
ITEMS PKR in Min
PKR in Min
PKR in Min
PKR in Min PKR in Min
Loans 65,340 54,676 48,727 47,575 40,154
Deposits + Borrowings 114,291 94,388 82,934 70,075 66,015
Formula: Loans / Deposits And Borrowing
% % % % %
Loans /Deposits And Borrowing 57.169 57.926 58.753 67.8915 60.825
Comments:
IESCO should keep loans / deposits and borrowing ratio 45% but their ratio is 57-60% which can create
liquidity crunch.
68

14. Loans / Total Assets
Loans / Total Assets
2011 2010 2009 2008 2007
ITEMS PKR in Min PKR in Min PKR in Min PKR in Min PKR in Min
Loans 65,340 54,676 48,727 47,575 40,154
Total assets 129,732 108,106 95,310 80,977 76,854
Formula: Loans / Deposits And Borrowing
% % % % %
Loans / Total Assets 50.36537 50.57629
51.12475 58.75125 52.24712
Comments:
IESCO loan to total asset is about 50% over 2007-11 which is satisfactory. IESCO follow time matching
police which improve it liquidity ratio.
69

15. Cash & Due From Banks to Total Assets
Cash & Due From Banks /Total Assets
2011 2010 2009 2008 2007
ITEMS PKR in Min PKR in Min PKR in Min PKR in Min PKR in Min
Balances with Other Banks
879 1,400 1,497 3,909 4,350
Total assets 129,732 108,106 95,310 80,977 76,854
Formula: Cash & Due From Banks/Total Assets
% % % % %
Cash & Due From Banks Total Assets
0.677551 1.2950251.570664
4.8272966
5.660083
Comments:
In 2007 IESCO cash & due from banks /total assets ratio is higher but 2008-11 it decrease the reason is
that IESCO decrease balance in banks and advance money into market because in these day’s interest
rate was high.
70
16. Total Operating Expense Operating Income
Total Operating Expense Operating Income
ITEMS2011 2010 2009 2008 2007
Rs.in Min Rs.in Min Rs.in Min Rs.in Min Rs.in Min
Operating expenses
3,503 2,683 2,079 1,952 1,293
Total Operating Income
1343 778 793 906 803
Total Operating Expense Operating Income
Times 2.60834 3.44859 2.62169 2.15453 1.61021
Comments:
For IESCO these ratios indicate the relationship between expenses and income. The operating ratio
reveals the ratio of total operating expenses in relation to income but some of the expenses include in
operating ratio may be increasing while some may be decreasing. Hence, specific expenses ratio are
computed by dividing each type of expense with the net sales to analyze the causes of variation in each
type of expense. 2077-11 operating income lies in 1-2 time of operating expense.
71
working
ITEMS2011 2010 2009 2008 2007
Rs.in Min Rs.in Min Rs.in Min Rs.in Min Rs.in Min
Fee, commission, brokerage and exchange income
915 603 673 638 472
Capital gain and dividend income
428 175 120 268 331
Total Operating Income 1343 778 793 906 803

72

17. Operating Income/ Assets
Operating Income/ Assets
2011 2010 2009 2008 2007
ITEMS PKR in Min PKR in Min PKR in Min PKR in Min PKR in Min
Total Operating Income 1343 778 793 906 803
Total assets 129,732 108,106 95,310 80,977 76,854
Formula = Operating Income/ Assets
Ratio 1.035% 0.720% 0.832% 1.119% 1.045%
Comments: IESCO has 1% operating income over total assets in 2007 and same in2008 but in
2009-10 it decrease to less than one percent and 2011 it ratio again 1%.
18. Net Interest Margin =Total Interest IncomeTotal Assets
Net Interest Margin =Total Interest Income/Total Assets
2011 2010 2009 2008 2007
ITEMS PKR in MinPKR in Min
PKR in Min PKR in Min PKR in Min
Interest Earned
12,895 10,250 9,337 7,823 6,272
Total Assets 129,732 108,106 95,310 80,977 76,854
Formula=Total Interest Income/Total Assets
Ratio 9.94% 9.48% 9.80% 9.66% 8.16%
Comments
73

IESCO net interest margin is good in 2007-11 it show increasing treads. Reason is that rate of interest is
high in Pakistan.
19. Interest Expense/ Operating Income
Interest Expense/ Operating Income
2011 2010 2009 2008 2007
ITEMS PKR in Min PKR in MinPKR in
MinPKR in Min PKR in Min
Interest Expensed 8,997 7,203 6,603 4,878 4,334
Total Operating Income w2 1343 778 793 906 803
Formula= Interest Expense/ Operating Income
6.70 9.26 8.33 5.38 5.40
Comments
IESCO interest expense ratio is increase in 2007-10 and decrease in 2011 because 2007-10 interest
expense is low in compare to total income and in 2011 interest expense is high than operating income.
74

20. Interest Expense/ Total Income
Interest Expense/ Total Income
2011 2009 2008 2007
ITEMS PKR in Min PKR in Min PKR in Min
PKR in Min PKR in Min
Interest Expensed
8,997 7,203 6,603 4,878 4,334
Total Income 14,850 11,478 10,505 9,049 7,338
Formula= Interest Expense/ Total Income
61% 63% 63% 54% 59%
Comments
Interest expense of IESCO is increase 2007-10 because it directly relate to deposits. In 2007-10 interest
expense is increase because interest rate is high and decrease in 2011 because interest rates decrease.
21. Total Interest ExpTotal Assets
Total Interest ExpTotal Asset
2011 2010 2009 2008 2007
ITEMS PKR in Min PKR in Min PKR in Min PKR in Min PKR in Min
Interest Expensed
8,997 7,203 6,603 4,878 4,334
Total assets 129,732 108,106 95,310 80,977 76,854
Total Interest ExpTotal Assets
7% 7% 7% 6% 6%
75

76

Comments:
IESCO interest expense over total asset is 6% which is so good form 2007-08 and increase in 2009-11 at 7% the valid reason is increase in interest rate hike this ratio.
22. Internal fund = retaining earning +deprecation
Internal Fund
2011 2010 2009 2008 2007
ITEMS PKR in Min PKR in Min PKR in Min PKR in Min PKR in Min
Retaining Earning
588 93.75 108.75 525.75 750
Depreciation 541,733 470,131 450,120 430,550 401,077
Internal Fund = Retaining Earning +Deprecation
Internal Fund 542,321.00 470,224.75 450,228.75 431,075.75 401,827.00
Comment
IESCO has handsome internal finance and can face liquidities crunch by itself internal fund is
continuously increasing from 2007 to 2011 which indicate IESCO is financially too strong.
77

10.2: Horizontal Analyses
orizontal analysis (also known as trend analysis) is a financial statement analysis technique that shows changes in the amounts of corresponding financial statement items over a period of time. It is a useful tool to evaluate the trend situations. Here, statements
for five year periods are used in horizontal analysis. The earliest period is usually used as the base period and the items on the statements for all later periods are compared with items on the statements of the base period. The changes are generally shown in percentage.
H
A procedure in fundamental analysis in which an analyst compares ratios or line items in IESCO financial statements over a certain period of time. The analyst will use his or her discretion when choosing a particular timeline; however, the decision is often based on the investing time horizon under consideration.
In meanwhile, a Horizontal analysis is the comparison of historical financial information over a series of reporting periods, or of the ratios derived from this financial information. The analysis is most commonly a simple grouping of information that is sorted by period, but the numbers in each succeeding period can also be expressed as a percentage of the amount in the baseline year, with the baseline amount being listed as 100%.
A common problem with horizontal analysis is that the aggregation of information in the financial may have changed over time, due to ongoing changes in the chart of accounts, so that revenues, expenses, assets, or liabilities may shift between different accounts and therefore appear to cause variances when comparing account balances from one period to the next.
78

When conducting a horizontal analysis of IESCO, it is useful to conduct the analysis for all of the financial statements at the same time, so the complete impact of operational results on IESCO's financial condition over the review 5 years period.
10.3: Horizontal Analysis of the Balance Sheet
Horizontal analysis of the balance sheet is also usually in a two-year format, such as the one shown below, with a variance showing the difference between the two years for each line item. An alternative format is to add as many years as will fit on the page, without showing a variance, so that you can see general changes by account over multiple years. A less-used format is to include a vertical analysis of each year in the report, so that each year shows each line item as a percentage of the total assets in that year.
79

B A L A N C E S H E E TB A L A N C E S H E E T
I T E M S
2011
%
2010 2009
%
2008
%
2007
%
ASSETS
Cash and Balance 123.6065
B A
S E
Y
E A
R
B A
S E
Y
E A
R
89.2798 77.91115 80.86369
Balances 62.78571 106.9286 279.2143 310.7143
Lending to financial 32.109 108.8073 157.5829 125.3949
Investment 130.8409 84.4252 40.1675 54.82765Advances 119.504 89.11954 87.01258 73.4399
Operating fixed assets 110.5218 96.10839 90.14125 62.00634Deferred tax assets- net 94.02597 28.05195 32.72727 --
Other assets 110.5279 84.4868 74.78006 58.09384
Total assets 120.0044 84.4868 74.90519 71.09134
LIABILITIES
Deposits and other accounts 121.6016 88.16347 75.14784 73.33845Borrowings 117.6704 89.67409 68.23216 47.40926Bills payable 84.55328 94.88698 67.54575 88.32078Other liabilities 114.3266 92.37822 76.5616 55.24355Deferred tax liabilities – net -- -- -- 00Sub-ordinate loans 75.02089 100.0835 100.0835 100.1671
Total liabilities 119.7272 88.22337 74.46869 70.81905REPRESENTED BY:Share Capital 133.2891 83.33057 68.30483 68.30483
Reserves 58.30458 98.76787 99.40858 92.50862
Inappropriate profit 311.8541 48.02432 253.7994 72.64438
Surplus on revaluation of assets (net of tax)
137.8026 115.8287 27.3743 70.7635
123.0881 100 88.22337 74.46869 70.81905
80

Cash and Balance
Cash is current asset of IESCO and in horizontal analysis 2010 is taken as base year “cash and balance with treasury banks” trend is increase over the time. In 2008 cash and balance with treasury banks was decrease because in this year IESCO Demand was high otherwise 2009 to 2011 its trend show growth.
Balances
81

IESCO has huge amount in bank balance in 2007 but it starts decrease in 2008-11 because management uses this asset in investments.
Lending to financial and Other Institutions
Lending to financial and Other Institutions is a earning asset in 2007, 2008 and 2009 IESCO lend huge amount as compare base year 2010 this increase is due to handsome interest rate. In 2011 government decrease interest rate so, IESCO decrease Lending to financial and Other Institutions.
Investment
From 2007 to 2009 there was a huge liquidity crunch in banking market. That’s why IESCO had
enough fund to invest form 2007-09 but in 2011 IESCO properly able to invest.
82

Advances
Comments
Earning asset of IESCO is advance and it increase step by step form 2007-11 and by analysis on
base year2010 its ratio is low 207-09 and increase in 2011.
83

84

Operating Fixed Assets
Comments: Operating assets are in the minority form base year form 2007-9 and increase in
2011. But in 2011 it increase but variance is only 14% actually management 2007-9 deploy cash
into assets but in 2010-11 reduce operating assets. And mobilize fund into investment
Deferred Tax Assets- Net
85

Comments
In 2007-09 and 2011 defer tax asset are low then 2010. In n2007 IESCO has no deferred assets.
In 2008-09 and 2010 management have low focus on these assts.
Other Assets
IESCO other asset are increase form 2007-11 on base year 2010, 2007-09’s other assets are less
than 100 % and in 2011 it is increase.
Total Assets
2007-09 Total asset of IESCO is variances less than 100% from 2010. And inn 2011 total assets
are increase due to progress in IESCO business.
86

Liabilities
Sub ordinate loan is like base year in 2007-09 and in 2011 it reduce because IESCO intends to
allow loan to business. Other all liabilities are low in2007-09 and increase in 2011. This is
depends on growth bases.
87

Total Liabilities: Total liabilities low in 2007-09 and increase in 2011. Reason is that 2007-09 total
worth of IESCO business is less than 2010 worth.
Equity: IESCO total equity is combination of share capital, reserves, inappropriate profit and
surpluses on revaluation of assets. In 2007 total equity of is less then base years but in 2008
inappropriate profit 250% high than base years. In 2009 only Surplus on revaluation of asset is
high than 2010 and in 2011 inappropriate profit 300% on base year.
88

Horizontal analysis can be miss-used to report skewed findings. This can happen when the analyst modifies the number of comparison periods used to make the results appear unusually good or bad. For example, the current period's profits may appear excellent when only compared with those of the previous month, but are actually quite poor when compared to the results for the same month in the preceding year. Consistent use of comparison periods can mitigate this problem.
10.3 Horizontal Analysis of the Income Statement
Horizontal analysis of the income statement is usually in a two-year format, such as the one shown below, with a variance also shown that states the difference between the two years for each line item. An alternative format is to simply add as many years as will fit on the page, without showing a variance, so that you can see general changes by account over multiple years. A third format is to include a vertical analysis of each year in the report, so that each year shows expenses as a percentage of the total revenue in that year.
89

HORIZONTAL ANALYSES OFHORIZONTAL ANALYSES OFP R O F I T & L O S S S T A T E M E N TP R O F I T & L O S S S T A T E M E N T
I T E M S 2011%
2010%
2009%
2008%
2007%
profit / Return / Interest Earned 125.8049
B A
S E
Y
E A
R
91.09268 76.32195 61.19024
Fee, commission, brokerage and exchange income
151.7413 111.6086 105.8043 78.27529
Capital gain and dividend income 244.5714 68.57143 153.1429 189.1429
Other income 136 83.33333 71.11111 58.44444
Total Income 129.3779 91.52291 78.83778 63.931
profit / Return / Interest Expensed
124.9063 91.67014 67.72178 60.16937
Operating expenses 130.5628 77.48789 72.75438 48.19232
Provisions 87.60331 112.4656 87.19008 16.18457
Taxation 1960 300 1680 3173.333
Total Expenses 123.8968 91.25341 73.53123 55.82665
Profit After Taxation 627.2 116 560.8 800
90

91

Analytical Comments
Return / Interest Earned
IESCO interest income low base years 2010 in 2007-9 but in 2011 it increase 25% more than base year. But overall it trend is increase.
Fee, commission, brokerage and exchange income
IESCO Fee, commission, brokerage and exchange income is blow than base year form 2007-09. Decreasing reason is low amount of Fee, commission, brokerage and exchange income in 2007-09 as compare to base year 2010. And increase in 2011 overall trend is increasing.
Capital gain and dividend income, other income and Total Income
Capital gain and dividend income is high in 2007-8 and in 2009 it decrease from base year and increase in 2011 this variance is depended on stock exchange conditions. Other income and total income variance is less than 100% in 2007-09 and increase in 2011 reason behind is growth in IESCO business.
92

Return / Interest Expensed
IESCO Return / Interest Expensed are correlates with interest income. From 2007-09 interest expense is decrease and in 2011 increase over base year. This variance is related with interest rate on deposit accounts.
Operating expenses, Provisions, Taxation and Total Expenses
From 2007-09 Operating expenses, Provisions, Taxation and Total Expenses is decrease and in 2011 increase over base year.
Profit after Taxation
IESCO net income over base year is too high because in 2010 IESCO profit is lowest profit in 5 years
profit. Reason of lower profit is that IESCO has large amount of reserve.
HORIZONTAL ANALYSES GRAPH OF PROFIT & LOSS STATEMENT
93

94

95

11: Vertical Analyses
ertical analysis of financial statements is a technique in which the relationship between items in the same financial statement is identified by expressing all amounts as a percentage a total amount. This method compares different items to a single item in the
same accounting period. V
Vertical Analysis Formula: =Account/Total*100
Account = value of require items
Total = total value of require items (assets, liabilities, equity)
The most common use of vertical analysis is within a financial statement for a single time period, so that you can see the relative proportions of account balances.
7.3)1.1 Vertical Analysis of the Balance Sheet
When creating a vertical analysis of a balance sheet is what to use as the denominator in the percentage calculation. An example of vertical analysis for a balance sheet is shown in the far right column of the following condensed balance sheet: the information provided by this balance sheet format is useful for noting changes in IESCO investment in capital and fixed assets over time, which may indicate an altered IESCO model that requires a different amount of ongoing funding.
96

VERTICAL ANALYSESVERTICAL ANALYSES OF ASSETSOF ASSETS
ITEMS2011
%2010
%2009
%2008
%2007
%Trend's Line
ASSETS
Cash and Balance
6.905775 6.704531 6.789424 6.973585 7.626148
Balances 0.677551 1.295025 1.570664 4.827297 5.660083
Lending (to financial and Other Institutions)
0.626677 2.342146 2.890568 4.927325 4.13121
Investment 35.28505 32.36268 30.99045 17.35431 24.95901
Advances 50.36537 50.57629 51.12475 58.75125 52.24712
Operating fixed assets
2.955323 3.208888 3.498059 3.86159 2.798813
Deferred tax assets- net
0.279037 0.356132 0.113314 0.1556 --
Other assets 2.90522 3.154312 3.022768 3.149042 2.577615
Total assets 100 100 100 100 100
97
Analytical Comments
Cash and Balance
Cash and Balance with Treasury Banks current asset of IESCO is decrease in five years because
IESCO deploy asset in profit able manner and more cash in hand is show management keep
assets idle.
Balances
Balance with Other Banks is decrease by time to time in five years 2007-11 reason is that IESCO
mobilized fund into investing activities rather then keep fund into banks accounts.
Lending/ Advances
Lending to financial and Other Institutions is one of major function of IESCO in 2007-08 it ratio
increase and afterward it decrease till 2011. Reason is that general interest rate was high and
internal bank interest rate was low IESCO was mostly interested in advance running finance to
general public.
Investment: IESCO mobilize fund into investment and advance. In 2007-11 ratio 24% to 35%
and has increasing trends which show IESCO growth.
Advances: IESCO advance ratio over 5 years period round about 50%. And have increasing
trends which show IESCO performed major function with efficiently.
Operating Fixed Assets
Operating fix asset of IESCO ratio increase in 2007-8 after this trend is starting decrease till
2011. This decease happened on base of management defocus on operating assts.
Deferred Tax Assets- Net
IESCO has no deferred tax in 2007. And after 2007, 2008-11 this ratio is increase reason; IESCO
has increase defer tax assets form 2008-11 as technique of well management of taxation.
98

Other Assets
In 2007-10 other assets ratio over total assets is increase and in 2011 slum down because IESCO
more focus on current assets.
VERTICAL ANALYSES OF LIABILITIESVERTICAL ANALYSES OF LIABILITIES
2011 2010 2009 2008 2007 Trend's Line
ITEMS % % % % %
Deposits and other accounts
83.9882.68
84.04 83.4485.63
Borrowings 12.2512.47
10.72 11.42 8.34
Bills payable 1.32 1.87 2.01 1.69 2.33
Other liabilities 1.67 1.75 1.84 1.80 1.37
Deferred tax liabilities – net -- -- -- --35.44
Sub-ordinate loans 0.75 1.20 1.36 1.62 1.70
Total liabilities 100 100 100 100 100 ---
99

Vertical Analysis Formula
Vertical Analysis =Account/Total*100
Account = value of require items
Total = total value of require items (income, Expense)
GRAPHICALLY PRESENTATION OF VERTICAL ANALYSIS OF EXPENSE
100

101

11.1: Future Prospects for IESCO WAPDA:-
The main future prospect of wapda is to open new branches
Target to capture new markets
Expand their business more and more
Invest in innovations developed in the country many sector.
Establish new and more departments in country.
Strengthening of HR base both at field and controlling offices.
The life cycle of an organization is comprised of threats as well as opportunities. If we say, today
the rates of challenges are too high but simultaneously the rate of opportunity is also too high. It is
obligatory to try to make progress with consistency as well as to adapt changes with the need of
time, in order to cope up with both conditions.
102

103

Strengths
One Window service facility at each Sub-Division
Establishment of Computerized Customer Service Centers in each Circle
Central Chief Executive Customer Service Center
Positioning of Field offices near geographic center of their jurisdiction and co-location of
XEN & RO offices
Printing of 12 months billing detail on bill
Printing of SDO's and XEN’s telephone numbers on the bill
Well defined and uniform policy for detection bills.
Enhanced allocation for Development and Maintenance.
More branches of scheduled banks and post offices authorized to collect bills
Establishment of Model Sub-Divisions
Restructuring of Stores to ensure prompt availability.
The IESCO top management is the combination of both experience and young energetic
professionals which are providing to be the real strength of IESCO.
IESCO website provides every information about IESCO to the customers and investors.
104

Weakness
Large time required for processing any project/job
Communication system between employees is not sufficient
Customer services centers required well trained and loyal staff
Lake of loyalty, consistency and regulatory in the staff
People has less trust over company
Customer’s giddiness is not sufficient
Customer’s complaint system is very old and execution on the complaint is very fatigue.
Customers and employees relation is very poor.
The administrative cost of the company is very high due to which the profitability of the
company decreases.
There is still improvement of technology in the IESCO like in computers.
The customer services are not up to mark they have to improve the customer services to
satisfy the customers.
The divisions are not well furnished they have the need to improve them.
Telecom and Media revolution.
Dependency on suppliers of power generation equipment.
Opportunities
Corporatization and commercialization goals as per plan.
Establishment of mobile customer services center at each circle.
Distribution system rehabilitation under System Augmentation Program (SAP) for
reduction in energy losses.
Timely execution of development works and LT/HT Proposals under SAP.
New Grid Stations and augmentation/extension of existing Grid Stations and
Transmission Lines
Establishment of Computer Billing Centers.
Conversion of petrol vehicles to CNG.
105

Purchase of new vehicles for field formation.
The IESCO is situated in the region where the customers are large in quantity and other
necessary related product is easily available in the market.
There is no competitor in the local market, there is a big opportunity to get more share.
Buyers of IESCO services are easily available in the local market.
The extension plan of divisions by the IESCO is very good to capture the market.
The IESCO has maintained better relationship in the market which helps the IESCO to
increase the customers.
The strategies of IESCO are very strong which help them to get advantages over the
competitors.
Research and development in power generation equipment.
Natural resources to increase water resources and cheaper power.
There are rapid changes in technology of power generation and to coup it ministry will
have to be planning for the future plans keeping in mind the changes.
New power projects have the bargaining power for higher prices keeping in view the high
demand and supply gap in power sector.
Threats
Since IESCO is a public organization, therefore political environments are Decreasing the
efficiency of the company.
Some other competitors like GEPCO have their own power
Generation system; therefore IESCO is dependent on those companies.
In future it is expected that the market value of the IESCO will be decreased.
Politics in the employees and labor unions are very awful for company.
Government’s pitiable projects also spoiling the publicity of the IESCO
The overall performance of the IESCO also decreasing.
One major threat to the IESCO is increasing number of customers day by day.
Due to fluctuation occur in the supply is permanent threat to the IESCO.
There is always a threat the government may impose some duties on the IESCO.
106

Another threat to the IESCO is change in day by day technology.
Withdrawal of support from suppliers.
Curtailment of budget.
Obsolescence of strategic equipment.
There is not a long list of suppliers in power sector and the suppliers enjoy monopoly to
some extent and they can change higher and delay supplies as there is long waiting list
for equipment supplies.
Conclusion & Recommendations
I got a lot of experience in IESCO. During my working I come to know that the different units
are working under one umbrella. I have noticed that they are getting the benefits by minimizing
different costs which earlier they were paying due to lack of technology of computer.
The IESCO has latest technology for its services and they are serving the local market very
well. IESCO has open door policy for all tackle all problems upfront Merit, Justice, Fair play be
the hallmark Transparency in all fields Accountability of everyone.This organization has vertical
management system. The top-level management has ample potential to make this company as an
excellent company. The middle level and bottom level management is also very hard working,
punctual and geniuses. But unfortunately the provision of equipments for maintenance purposes,
the government’s lengthy planes, and inexperienced customer services department is spoiling the
image of the company. The demand of electricity of the consumers must be fulfilled at top
priority. Necessary actions should be taken against the span between the demand and supply. The
response of the employees on the failure of the supply must be enhanced. Following conclusions
are described here:
Increase in Raw material
Slow speed of implementation must be eliminated
Make exact estimate of the demand
Reduce the political factors in IESCO’s projects and system augmentations.
107

Regarding De-Marketing, WAPDA or IESCO is going without planning, as being monopoly of
WAPDA; it should emphasis on energy saving measures in different ways like:
Reducing technical losses
Reducing non-technical losses like reduction in theft of energy by different tariff
consumers.
In this way, the Extra revenue generated may be used on different WAPDA Generation Projects,
so that energy conservation may use for extra consumers at villages where electricity in not still
provided.
Similarly electricity or energy may be saved for use in industries, by giving awareness to
domestic consumes for saving energy through different ways.
The progress of different companies of WAPDA like IESCO must be compared with
another company with good results regarding recovery and line losses, in spite of giving
targets to one company itself.
As no any competitor of WAPDA is there, so should be emphasis on uninterrupted power
supply to all kind of consumers at reasonable prices per KWH. This can be done by:
o Production of electricity by gas and fuel.
o Constructing naturally designed hydel dams like Kala Bagh Dam.
o Small hydel dams must be constructed and in this way, Vision 2025 plan of
WAPDA must be taken in consideration to fulfill future power needs.
108

References & Sources Used
Website of IESCO/WAPDA
Technical brushers of IESCO
Personal meetings with different mangers
IESCO new induction training program booklets
Standard Operating Procedural (SOP) documents
Annual Reports published by IESCO for FY 2009
Technical data prepared and collected by IESCO’s library.
www.iesco.com.pk
WAPDA commercial procedures power wing 3rd edition
Griffin Ricky w (1997) management 5th edition
109

110

Organizational Structure:
4.1) Head Office:
WAPDA, the Pakistan Water and Power Development Authority, was created in 1958 as
a Semi-Autonomous Body for the purpose of coordinating and giving a unified direction to the
development of schemes in Water and Power Sectors, which were previously being dealt with,
by the respective Electricity and Irrigation Department of the Provinces.
Since October 2007, WAPDA has been bifurcated into two distinct entities i.e. WAPDA
and Pakistan Electric Power Company (PEPCO). WAPDA is responsible for water and
hydropower development whereas PEPCO is vested with the responsibility of thermal power
generation, transmission, distribution and billing. There is an independent Chairman and MD
(PEPCO) www.pepco.gov.pk replacing Chairman WAPDA and Member (Power) who were
previously holding the additional charges of these posts.
Structure of Finance Accounts Department
111
Operation Manager
Audit officer Finance officer Account officer

B A L A N C E S H E E TB A L A N C E S H E E T
ITEMS2011PKR in Min
2010PKR in Min
2009PKR in Min
2008PKR in Min
2007PKR in Min
ASSETS
Cash and Balance 8,959 7,248 6,471 5,647 5,861
Balances 879 1,400 1,497 3,909 4,350Lending to financial 813 2,532 2,755 3,990 3,175
Investment 45,776 34,986 29,537 14,053 19,182
Advances 65,340 54,676 48,727 47,575 40,154
Operating fixed assets 3,834 3,469 3,334 3,127 2,151Deferred tax assets- net 362 385 108 126 --
Other assets 3,769 3,410 2,881 2,550 1,981Total Assets 129,732 108,106 95,310 80,977 76,854
LIABILITIES
Deposits and other accounts 99,734 82,017 73,548 61,634 60,150Borrowings 14,557 12,371 9,386 8,441 5,865Bills payable 1,571 1,858 1,763 1,255 1,641Other liabilities 1,995 1,745 1,612 1,336 964Deferred tax liabilities – net -- -- -- -- 425
Sub-ordinate loans 898 1,197 1,198 1,198 1,199
Total Liabilities 118,755 99,188 87,507 73,864 70,244
REPRESENTED BY:
Share Capital 8,028 6,023 5,019 4,114 4,114
Reserves 1,183 2,029 2,004 2,017 1,877
Inappropriate profit 1,026 329 158 835 239Surplus on revaluation of assets (net of tax)
740 537 622 147 380
Total Equity 10,977 8,918 7,803 7,113 6,610Net worth (assets=liabilities + equity )
129,732 108,106 95,310 80,977 76,854
112

P R O F I T & L O S S S T A T E M E N TP R O F I T & L O S S S T A T E M E N T
ITEMS2011
Rs.in Min2010
Rs.in Min2009
Rs.in Min2008
Rs.in Min2007
Rs.in Min
Profit 12,895 10,250 9,337 7,823 6,272
Fee, commission, brokerage and exchange income
915 603 673 638 472
Capital gain and dividend income 428 175 120 268 331
Other income 612 450 375 320 263
TOTAL INCOME 14,850 11,478 10,505 9,049 7,338
Profit 8,997 7,203 6,603 4,878 4,334
Operating expenses 3,503 2,683 2,079 1,952 1,293
Provisions 1,272 1,452 1,633 1,266 235
Taxation 294 15 45 252 476
TOTAL EXPENSES (14,066) (11,353) (10,360) (8,348) (6,338)
PROFIT AFTER TAXATION 784 125 145 701 1,000
113