Internet Appendix to Bank Ratings and Lending Supply ...mna11/pdfs/Sovereign_Ratings... · Internet...
15
Internet Appendix to “Bank Ratings and Lending Supply: Evidence from Sovereign Downgrades” Manuel Adelino Duke University [email protected] Miguel A. Ferreira Nova School of Business and Economics [email protected] This Version: September 2015
Transcript of Internet Appendix to Bank Ratings and Lending Supply ...mna11/pdfs/Sovereign_Ratings... · Internet...

Internet Appendix to “Bank Ratings and Lending Supply:
Evidence from Sovereign Downgrades”
Manuel Adelino Duke University
Miguel A. Ferreira Nova School of Business and Economics
This Version: September 2015

1
Table IA.1 – List of Treated Banks
This table shows the list of treated banks, defined as banks that have a predowngrade rating at the sovereign bound when a country is
downgraded, country of domicile, number of observations, and average bank rating in the quarter before and after the sovereign
downgrade.
Bank Name Country
Number of Observations
Average Rating Before Sov. Downgrade
Average Rating After Sov. Downgrade
Banco de Galicia Argentina 5 B+ B-
Banco de Galicia y Buenos Aires Argentina 6 B+ B-
State Bank of New South Wales Australia 1 AA+ AA+
Banco do Brasil Brazil 1 BB- B+
União de Bancos Brasileiros SA Brazil 2 BB- B+
Votorantim Participações SA Brazil 1 BB- B+
China Development Bank [CDB] China 1 BBB+ BBB
Export-Import Bank of China [China Eximbank] China 1 BBB+ BBB
Banque Misr SAE Egypt 1 B B-
Commercial International Bank (Egypt) SAE Egypt 5 BB B+
National Bank of Egypt SAE [NBE] Egypt 5 BB B+
Agence Française de Développement [AFD] France 1 AAA AA+
Caisse des Dépôts et Consignations France 1 AAA AA+
Alpha Bank AE Greece 1 CCC CCC
National Bank of Greece SA Greece 3 BB B+
Piraeus Bank SA Greece 1 CCC CCC
OTP Bank Rt [National Savings & Commercial Bank] Hungary 4 BBB BB+
Bank of Baroda India 1 BB+ BB
Bank Indonesia Indonesia 4 CCC+ CC
Bank Internasional Indonesia Indonesia 1 BB+ CCC-
Cassa Depositi e Prestiti SpA [CDP] Italy 2 A+ A-
Cassa di Risparmio di Parma e Piacenza Italy 2 A+ A
Intesa Sanpaolo SpA [ISP] Italy 2 A+ A-
Mediobanca SpA Italy 3 A+ A
UniCredit Italy 1 A BBB+
Development Bank of Japan Inc Japan 1 AA AA-
Japan Bank for International Cooperation Japan 2 AA+ AA
Toyota Financial Services Corp Japan 2 AA+ AA+
Export-Import Bank of Korea Korea (South) 1 AA- B+
Korea Development Bank Korea (South) 1 AA- B+
Banque Audi SAL Lebanon 4 B+ B
Malayan Banking Bhd Malaysia 1 A+ A
Banco BPI SA Portugal 1 A- BBB-
Banco Espirito Santo SA [BES] Portugal 1 A- BBB-
Caixa Geral de Depósitos SA [CGD] Portugal 3 A+ A-
Vnesheconombank [VEB] Russia 1 BBB+ BBB
VTB Bank JSC Russia 1 BBB+ BBB
FirstRand Bank Ltd [FRB] South Africa 1 BBB+ BBB
Standard Bank Group Ltd South Africa 1 BBB+ BBB
Banco Bilbao Vizcaya Argentaria SA [BBVA] Spain 3 A BBB+
Banco Santander SA Spain 2 AA AA-
Bangkok Bank Public Co Ltd Thailand 1 BBB BBB-
Dogus Holding AS Turkey 2 B+ B
TC Ziraat Bankasi AS Turkey 1 B+ CCC+
Türkiye İş Bankasi AS [İşbank] Turkey 2 B+ B
Inter-American Development Bank USA 1 AAA AAA
Total
89 BBB- BB+

2
Table IA.2 – Bank Rating Downgrade and Sovereign Downgrade: Logit Model
This table shows logit regression estimates of the effect of a sovereign downgrade on the probability of a rating downgrade for banks that have a predowngrade rating at the sovereign bound relative to other banks. The dependent variable is an indicator that takes the value of one if the bank is downgraded. Observations are at the lender-quarter level. Country macro controls (time varying) include the ratio of government debt to GDP, growth rate of GDP, inflation, ratio of private credit to GDP, banks’ holdings of government debt, and indicator variables for whether the country is experiencing a currency crisis, an inflation crisis, a sovereign domestic debt crisis, a sovereign external debt crisis, a banking crisis, or a recession. Variable definitions are provided in Table A.1 in the Appendix. Robust standard errors clustered by lender country are reported in parentheses. *, **, *** denote statistical significance at the 10%, 5%, and 1% levels, respectively.
(1) (2) (3) (4)
Lender Rating = Sov. Rating × Sov. Downgrade 6.35*** 7.45*** 4.68*** 5.04***
(1.13) (2.27) (0.66) (0.90)
Lender Rating = Sovereign Rating -0.70*** -0.84*** 0.14 0.39
(0.22) (0.26) (0.23) (0.28)
Sovereign Downgrade 2.79*** 2.08*** 2.61*** 2.04***
(0.32) (0.34) (0.20) (0.24)
Size
0.19***
0.80***
(0.05)
(0.23)
Profitability
-36.40***
-30.43***
(8.23)
(6.58)
Capital
-1.43
0.48
(1.88)
(3.81)
Liquidity
-0.57
-0.04
(0.41)
(0.84)
Deposits
-0.62
0.52
(0.41)
(0.81)
Country Macro Controls
Y
Y
Country FE Y Y
Quarter FE Y Y Y Y
Lender FE
Y Y
Number of Observations 17,372 12,962 15,219 11,545
R-Squared 0.26 0.37 0.30 0.42

3
Table IA.3 – Bank Lending and Sovereign Downgrade: Rating-Based Regulatory and Contractual
Constraints
This table shows OLS regression estimates of the effect of a sovereign downgrade on the growth rate of the number of loans of banks that have a predowngrade rating at the sovereign bound relative to other banks. The dependent variables are measured as the percentage change between the quarter before and two quarters after the sovereign downgrade. Observations are at the lender-quarter level. The rating categories are defined according to Basel II capital requirements rules: AAA to AA-; A+ to A-; BBB+ to BBB-; BB+ to B-; and below B-. Lender controls include the banks’ size, profitability, capital, liquidity, and deposits. Country macro controls (time varying) include the ratio of government debt to GDP, growth rate of GDP, inflation, ratio of private credit to GDP, banks’ holdings of government debt, and indicator variables for whether the country is experiencing a currency crisis, an inflation crisis, a sovereign domestic debt crisis, a sovereign external debt crisis, a banking crisis, or a recession. Variable definitions are provided in Table A.1 in the Appendix. Robust standard errors clustered by lender country are reported in parentheses. *, **, *** denote statistical significance at the 10%, 5%, and 1% levels, respectively.
Number of Loans
Number of Loans - Foreign
(1) (2) (3)
(4) (5) (6)
Lender Rating = Sov. Rating × Sov. Downgrade -0.54*** -0.47*** -0.59***
-0.58*** -0.60*** -0.92**
(Bank Downgrade into New Broad Rating Category) (0.15) (0.16) (0.16)
(0.15) (0.16) (0.44)
Lender Rating = Sov. Rating × Sov. Downgrade -0.48*** -0.45*** 0.02
-0.42*** -0.39*** -0.35
(Bank Downgrade within Broad Rating Category) (0.13) (0.13) (0.19)
(0.14) (0.14) (0.29)
Lender Rating = Sovereign Rating 0.01 0.04 0.05
0.04 0.04 0.08
(0.03) (0.04) (0.04)
(0.04) (0.05) (0.06)
Sovereign Downgrade -0.09 -0.06
-0.19** -0.12
(0.07) (0.07)
(0.08) (0.09)
Lender Controls
Y Y
Y Y
Country Macro Controls
Y
Y
Quarter FE Y Y
Y Y
Country FE Y Y
Y Y
Country × Quarter FE
Y
Y
Number of Observations 15,472 12,769 12,769
11,248 9,580 9,580
R-Squared 0.09 0.10 0.28
0.13 0.08 0.19

4
Table IA.4 – Bank Rating and Sovereign Upgrade
This table shows OLS regression estimates of the effect of a sovereign upgrade on the rating of banks that have a predowngrade rating at the sovereign bound relative to other banks. The dependent variable is the credit rating of the bank converted to a numeric scale one quarter after the sovereign downgrade. Observations are at the lender-quarter level. Lender controls include the banks’ size, profitability, capital, liquidity, and deposits. Country macro controls (time varying) include the ratio of government debt to GDP, growth rate of GDP, inflation, ratio of private credit to GDP, banks’ holdings of government debt, and indicator variables for whether the country is experiencing a currency crisis, an inflation crisis, a sovereign domestic debt crisis, a sovereign external debt crisis, a banking crisis, or a recession. Variable definitions are provided in Table A.1 in the Appendix. Robust standard errors clustered by lender country are reported in parentheses. *, **, *** denote statistical significance at the 10%, 5%, and 1% levels, respectively.
(1) (2) (3) (4)
Lender Rating = Sov. Rating × Sov. Upgrade -0.44 -0.26 -0.14 -0.05
(0.29) (0.23) (0.14) (0.14)
Lender Rating = Sovereign Rating 0.76*** 0.80*** 0.92*** 0.92***
(0.08) (0.09) (0.06) (0.06)
Sovereign Upgrade -0.01 0.00
(0.14) (0.12)
Lender Controls Y Y
Country Macro Controls
Y
Quarter FE Y Y
Country × Quarter FE
Y Y
Lender FE Y Y Y Y
Number of Observations 20,850 16,329 20,850 16,329
R-Squared 0.86 0.88 0.91 0.93

5
Table IA.5 – Bank Lending and Sovereign Upgrade
This table shows OLS regression estimates of the effect of a sovereign upgrade on the growth rate of the number of loans of banks that have a predowngrade rating at or above the sovereign bound relative to other banks. The dependent variables are measured as the percentage change between the quarter before and two quarters after the sovereign downgrade. Observations are at the lender-quarter level. Lender controls include the banks’ size, profitability, capital, liquidity, and deposits. Country macro controls (time varying) include the ratio of government debt to GDP, growth rate of GDP, inflation, ratio of private credit to GDP, banks’ holdings of government debt, and indicator variables for whether the country is experiencing a currency crisis, an inflation crisis, a sovereign domestic debt crisis, a sovereign external debt crisis, a banking crisis, or a recession. Variable definitions are provided in Table A.1 in the Appendix. Robust standard errors clustered by lender country are reported in parentheses. *, **, *** denote statistical significance at the 10%, 5%, and 1% levels, respectively.
Number of Loans
Number of Loans - Foreign
(1) (2) (3)
(4) (5) (6)
Lender Rating = Sov. Rating × Sov. Upgrade 0.04 0.02 -0.18
-0.11 -0.11 -0.16
(0.13) (0.15) (0.15)
(0.17) (0.16) (0.15)
Lender Rating = Sovereign Rating -0.02 0.03 0.05
0.02 0.04 0.08
(0.04) (0.04) (0.04)
(0.04) (0.05) (0.05)
Sovereign Upgrade -0.33*** -0.35**
-0.06 -0.08
(0.12) (0.14)
(0.07) (0.08)
Lender Controls
Y Y
Y Y
Country Macro Controls
Y
Y
Quarter FE Y Y
Y Y
Country FE Y Y
Y Y
Country × Quarter FE
Y
Y
Number of Observations 15,472 12,769 12,769
11,248 9,580 9,580
R-Squared 0.09 0.10 0.28
0.13 0.14 0.21

6
Table IA.6 – Bank Lending and Sovereign Downgrade: Lender Fixed Effects
This table shows OLS regression estimates of the effect of a sovereign downgrade on the growth rate of the number of loans of banks that have a predowngrade rating at the sovereign bound relative to other banks. The dependent variables are measured as the percentage change between the quarter before and two quarters after the sovereign downgrade. Observations are at the lender-quarter level. Lender controls include the banks’ size, profitability, capital, liquidity, and deposits. Country macro controls (time varying) include the ratio of government debt to GDP, growth rate of GDP, inflation, ratio of private credit to GDP, banks’ holdings of government debt, and indicator variables for whether the country is experiencing a currency crisis, an inflation crisis, a sovereign domestic debt crisis, a sovereign external debt crisis, a banking crisis, or a recession. Variable definitions are provided in Table A.1 in the Appendix. Robust standard errors clustered by lender country are reported in parentheses. *, **, *** denote statistical significance at the 10%, 5%, and 1% levels, respectively.
Number of Loans
Number of Loans - Foreign
(1) (2) (3)
(4) (5) (6)
Lender Rating = Sov. Rating × Sov. Downgrade -0.52*** -0.46*** -0.24**
-0.57*** -0.50*** -0.68***
(0.10) (0.09) (0.12)
(0.11) (0.11) (0.16)
Lender Rating = Sovereign Rating 0.02 -0.01 0.03
0.04 -0.01 0.13
(0.06) (0.05) (0.05)
(0.05) (0.05) (0.08)
Sovereign Downgrade -0.08 -0.05
-0.18** -0.10
(0.07) (0.08)
(0.08) (0.09)
Lender Controls
Y Y
Y Y
Country Macro Controls
Y
Y
Quarter FE Y Y
Y Y
Country × Quarter FE
Y
Y
Lender FE Y Y Y
Y Y Y
Number of Observations 15,472 12,769 12,769
11,248 9,580 9,580
R-Squared 0.11 0.12 0.30
0.17 0.17 0.24

7
Table IA.7 – Bank Lending and Sovereign Downgrade: Clustering by Country and Quarter
This table shows OLS regression estimates of the effect of a sovereign downgrade on the growth rate of the number of loans of banks that have a predowngrade rating at the sovereign bound relative to other banks. The dependent variables are measured as the percentage change between the quarter before and two quarters after the sovereign downgrade. Observations are at the lender-quarter level. Lender controls include the banks’ size, profitability, capital, liquidity, and deposits. Country macro controls (time varying) include the ratio of government debt to GDP, growth rate of GDP, inflation, ratio of private credit to GDP, banks’ holdings of government debt, and indicator variables for whether the country is experiencing a currency crisis, an inflation crisis, a sovereign domestic debt crisis, a sovereign external debt crisis, a banking crisis, or a recession. Variable definitions are provided in Table A.1 in the Appendix. Robust standard errors clustered by lender country and quarter are reported in parentheses. *, **, *** denote statistical significance at the 10%, 5%, and 1% levels, respectively.
Number of Loans
Number of Loans - Foreign
(1) (2) (3)
(4) (5) (6)
Lender Rating = Sov. Rating × Sov. Downgrade -0.50*** -0.46*** -0.25***
-0.49*** -0.48*** -0.63***
(0.13) (0.14) (0.08)
(0.13) (0.12) (0.22)
Lender Rating = Sovereign Rating 0.01 0.04 0.05
0.04 0.05 0.08
(0.03) (0.04) (0.04)
(0.04) (0.05) (0.05)
Sovereign Downgrade -0.09 -0.05
-0.19* -0.09
(0.08) (0.09)
(0.10) (0.11)
Lender Controls
Y Y
Y Y
Country Macro Controls
Y
Y
Quarter FE Y Y
Y Y
Country FE Y Y
Y Y
Country × Quarter FE
Y
Y
Number of Observations 15,472 12,769 12,769
11,248 9,580 9,580
R-Squared 0.09 0.10 0.28
0.13 0.14 0.21
8
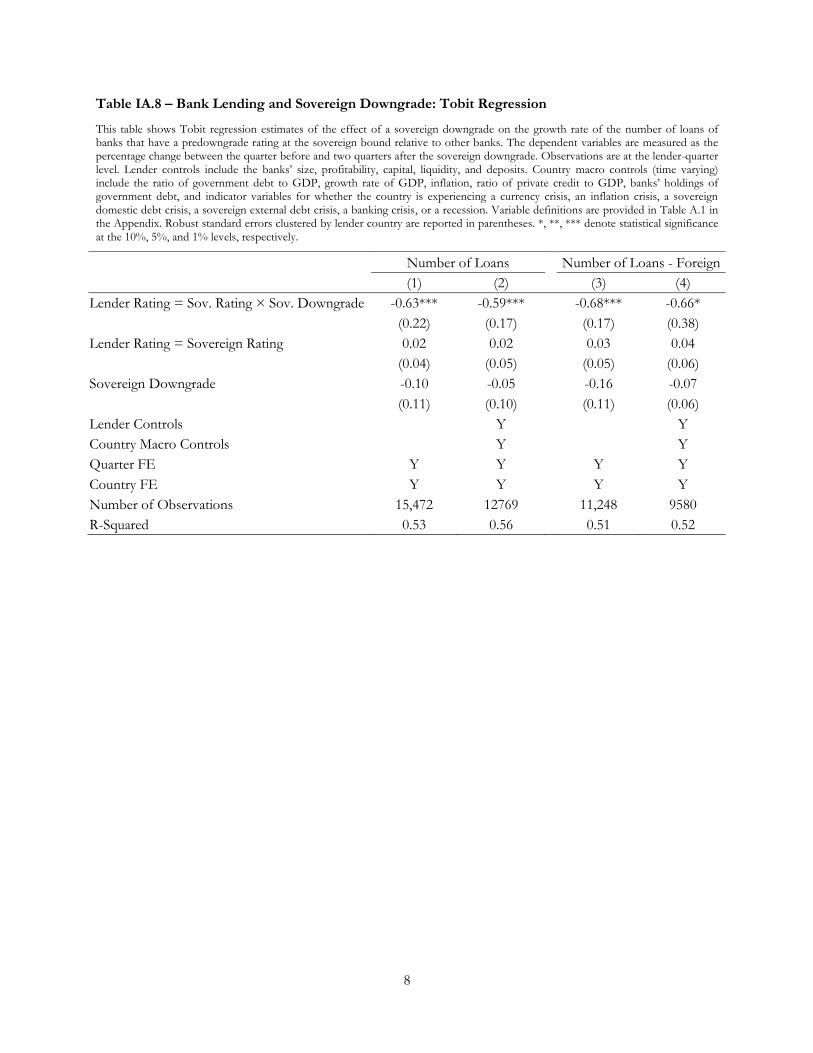
Table IA.8 – Bank Lending and Sovereign Downgrade: Tobit Regression
This table shows Tobit regression estimates of the effect of a sovereign downgrade on the growth rate of the number of loans of banks that have a predowngrade rating at the sovereign bound relative to other banks. The dependent variables are measured as the percentage change between the quarter before and two quarters after the sovereign downgrade. Observations are at the lender-quarter level. Lender controls include the banks’ size, profitability, capital, liquidity, and deposits. Country macro controls (time varying) include the ratio of government debt to GDP, growth rate of GDP, inflation, ratio of private credit to GDP, banks’ holdings of government debt, and indicator variables for whether the country is experiencing a currency crisis, an inflation crisis, a sovereign domestic debt crisis, a sovereign external debt crisis, a banking crisis, or a recession. Variable definitions are provided in Table A.1 in the Appendix. Robust standard errors clustered by lender country are reported in parentheses. *, **, *** denote statistical significance at the 10%, 5%, and 1% levels, respectively.
Number of Loans
Number of Loans - Foreign
(1) (2)
(3) (4)
Lender Rating = Sov. Rating × Sov. Downgrade -0.63*** -0.59***
-0.68*** -0.66*
(0.22) (0.17)
(0.17) (0.38)
Lender Rating = Sovereign Rating 0.02 0.02
0.03 0.04
(0.04) (0.05)
(0.05) (0.06)
Sovereign Downgrade -0.10 -0.05
-0.16 -0.07
(0.11) (0.10)
(0.11) (0.06)
Lender Controls
Y
Y
Country Macro Controls
Y
Y
Quarter FE Y Y
Y Y
Country FE Y Y
Y Y
Number of Observations 15,472 12769
11,248 9580
R-Squared 0.53 0.56
0.51 0.52

9
Table IA.9 – Bank Lending and Sovereign Downgrade: Level of Lending
This table shows OLS regression estimates of the effect of a sovereign downgrade on the log of one plus the number of loans of banks that have a predowngrade rating at the sovereign bound relative to other banks. The dependent variables are measured two quarters after the sovereign downgrade. Observations are at the lender-quarter level. Lender controls include the banks’ size, profitability, capital, liquidity, and deposits. Country macro controls (time varying) include the ratio of government debt to GDP, growth rate of GDP, inflation, ratio of private credit to GDP, banks’ holdings of government debt, and indicator variables for whether the country is experiencing a currency crisis, an inflation crisis, a sovereign domestic debt crisis, a sovereign external debt crisis, a banking crisis, or a recession. Variable definitions are provided in Table A.1 in the Appendix. Robust standard errors clustered by lender country are reported in parentheses. *, **, *** denote statistical significance at the 10%, 5%, and 1% levels, respectively.
Number of Loans
Number of Loans - Foreign
(1) (2) (3)
(4) (5) (6)
Lender Rating = Sov. Rating × Sov. Downgrade -0.39** -0.32* -0.28*
-0.26** -0.30** -0.26*
(0.16) (0.16) (0.16)
(0.13) (0.15) (0.15)
Lender Rating = Sovereign Rating -0.18** -0.22*** -0.16
-0.15 -0.10 -0.08
(0.08) (0.08) (0.10)
(0.09) (0.09) (0.11)
Sovereign Downgrade -0.12 -0.07
-0.17** -0.08
(0.12) (0.10)
(0.08) (0.07)
Lender Controls
Y Y
Y Y
Country Macro Controls Y Y
Quarter FE Y Y Y Y
Country × Quarter FE
Y
Y
Lender FE Y Y Y
Y Y Y
Number of Observations 15,472 12,769 12,769
11,248 9,580 9,580
R-Squared 0.81 0.82 0.48
0.84 0.86 0.64

10
Table IA.10 – Bank Lending and Sovereign Downgrade: Negative Binomial Regression
This table shows negative binomial regression estimates of the effect of a sovereign downgrade on the number of loans of banks that have a predowngrade rating at the sovereign bound relative to other banks. The dependent variables are measured two quarters after the sovereign downgrade. Observations are at the lender-quarter level. Lender controls include the banks’ size, profitability, capital, liquidity, and deposits. Country macro controls (time varying) include the ratio of government debt to GDP, growth rate of GDP, inflation, ratio of private credit to GDP, banks’ holdings of government debt, and indicator variables for whether the country is experiencing a currency crisis, an inflation crisis, a sovereign domestic debt crisis, a sovereign external debt crisis, a banking crisis, or a recession. Variable definitions are provided in Table A.1 in the Appendix. Robust standard errors clustered by lender country are reported in parentheses. *, **, *** denote statistical significance at the 10%, 5%, and 1% levels, respectively.
Number of Loans
Number of Loans as Lead
(1) (2)
(3) (4)
Lender Rating = Sov. Rating × Sov. Downgrade -0.47*** -0.34*
-0.45*** -0.34*
(0.16) (0.18)
(0.18) (0.17)
Lender Rating = Sovereign Rating -0.33*** -0.22***
-0.27*** -0.25***
(0.03) (0.03)
(0.03) (0.03)
Sovereign Downgrade -0.14*** -0.02
-0.22*** -0.08
(0.04) (0.05)
(0.05) (0.05)
Lender Controls
Y
Y
Country Macro Controls
Y
Y
Quarter FE Y Y
Y Y
Country FE Y Y
Y Y
Number of Observations 15,374 12,697
15,342 12,669
Pseudo R-Squared 0.63 0.71
0.64 0.79

11
Table IA.11 – Bank Lending and Sovereign Downgrade: Excluding Banks Above the Sovereign
Bound
This table shows OLS regression estimates of the effect of a sovereign downgrade on the growth rate of the number of loans of banks that have a predowngrade rating at the sovereign bound relative to banks below the bound. The dependent variables are measured as the percentage change between the quarter before and two quarters after the sovereign downgrade. Observations are at the lender-quarter level. Lender controls include the banks’ size, profitability, capital, liquidity, and deposits. Country macro controls (time varying) include the ratio of government debt to GDP, growth rate of GDP, inflation, ratio of private credit to GDP, banks’ holdings of government debt, and indicator variables for whether the country is experiencing a currency crisis, an inflation crisis, a sovereign domestic debt crisis, a sovereign external debt crisis, a banking crisis, or a recession. Variable definitions are provided in Table A.1 in the Appendix. Robust standard errors clustered by lender country are reported in parentheses. *, **, *** denote statistical significance at the 10%, 5%, and 1% levels, respectively.
Number of Loans
Number of Loans - Foreign
(1) (2) (3)
(4) (5) (6)
Lender Rating = Sov. Rating × Sov. Downgrade -0.52*** -0.49*** -0.34***
-0.49*** -0.51*** -0.64***
(0.10) (0.10) (0.11)
(0.11) (0.11) (0.22)
Lender Rating = Sovereign Rating 0.01 0.04 0.05
0.04 0.05 0.09
(0.03) (0.04) (0.04)
(0.04) (0.05) (0.06)
Sovereign Downgrade -0.07 -0.04
-0.19** -0.08
(0.07) (0.07)
(0.09) (0.09)
Lender Controls
Y Y
Y Y
Country Macro Controls
Y
Y
Quarter FE Y Y
Y Y
Country FE Y Y
Y Y
Country × Quarter FE
Y
Y
Number of Observations 15,064 12,459 12,459
10,885 9,299 9,299
R-Squared 0.09 0.10 0.29
0.13 0.14 0.21
12
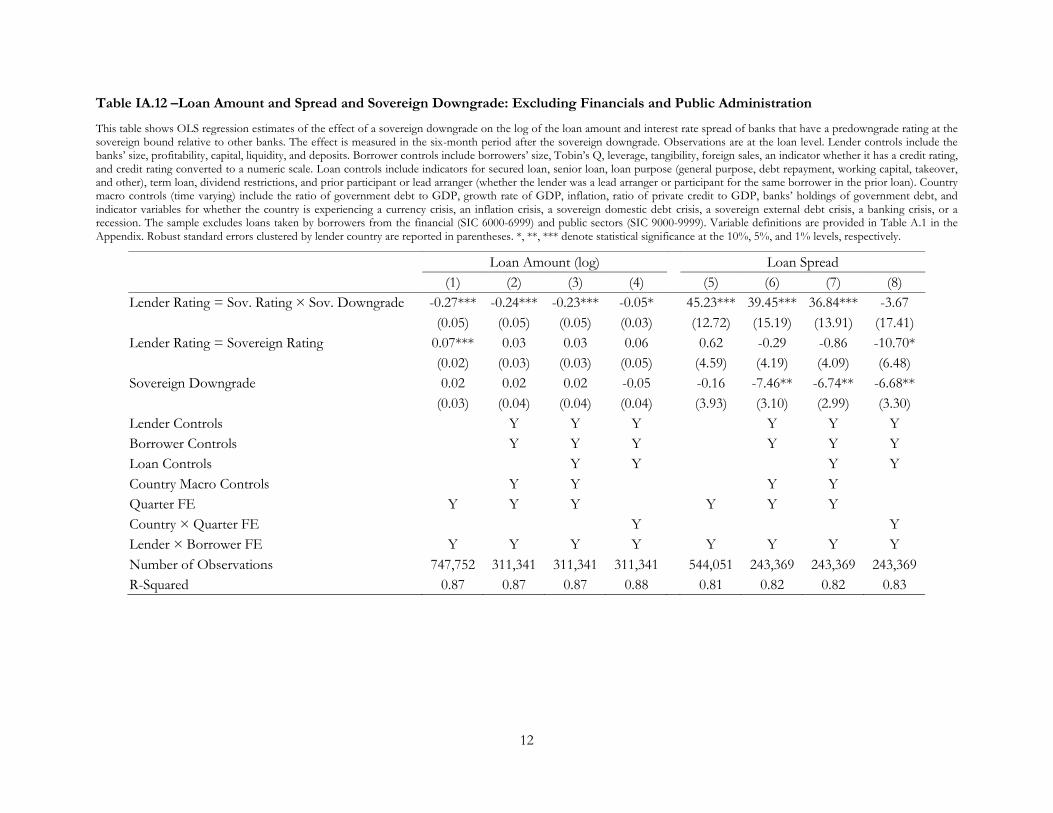
Table IA.12 –Loan Amount and Spread and Sovereign Downgrade: Excluding Financials and Public Administration
This table shows OLS regression estimates of the effect of a sovereign downgrade on the log of the loan amount and interest rate spread of banks that have a predowngrade rating at the sovereign bound relative to other banks. The effect is measured in the six-month period after the sovereign downgrade. Observations are at the loan level. Lender controls include the banks’ size, profitability, capital, liquidity, and deposits. Borrower controls include borrowers’ size, Tobin’s Q, leverage, tangibility, foreign sales, an indicator whether it has a credit rating, and credit rating converted to a numeric scale. Loan controls include indicators for secured loan, senior loan, loan purpose (general purpose, debt repayment, working capital, takeover, and other), term loan, dividend restrictions, and prior participant or lead arranger (whether the lender was a lead arranger or participant for the same borrower in the prior loan). Country macro controls (time varying) include the ratio of government debt to GDP, growth rate of GDP, inflation, ratio of private credit to GDP, banks’ holdings of government debt, and indicator variables for whether the country is experiencing a currency crisis, an inflation crisis, a sovereign domestic debt crisis, a sovereign external debt crisis, a banking crisis, or a recession. The sample excludes loans taken by borrowers from the financial (SIC 6000-6999) and public sectors (SIC 9000-9999). Variable definitions are provided in Table A.1 in the Appendix. Robust standard errors clustered by lender country are reported in parentheses. *, **, *** denote statistical significance at the 10%, 5%, and 1% levels, respectively.
Loan Amount (log)
Loan Spread
(1) (2) (3) (4)
(5) (6) (7) (8)
Lender Rating = Sov. Rating × Sov. Downgrade -0.27*** -0.24*** -0.23*** -0.05*
45.23*** 39.45*** 36.84*** -3.67
(0.05) (0.05) (0.05) (0.03)
(12.72) (15.19) (13.91) (17.41)
Lender Rating = Sovereign Rating 0.07*** 0.03 0.03 0.06
0.62 -0.29 -0.86 -10.70*
(0.02) (0.03) (0.03) (0.05)
(4.59) (4.19) (4.09) (6.48)
Sovereign Downgrade 0.02 0.02 0.02 -0.05
-0.16 -7.46** -6.74** -6.68**
(0.03) (0.04) (0.04) (0.04)
(3.93) (3.10) (2.99) (3.30)
Lender Controls
Y Y Y
Y Y Y
Borrower Controls
Y Y Y
Y Y Y
Loan Controls
Y Y
Y Y
Country Macro Controls
Y Y
Y Y
Quarter FE Y Y Y
Y Y Y
Country × Quarter FE
Y
Y
Lender × Borrower FE Y Y Y Y
Y Y Y Y
Number of Observations 747,752 311,341 311,341 311,341
544,051 243,369 243,369 243,369
R-Squared 0.87 0.87 0.87 0.88
0.81 0.82 0.82 0.83
13
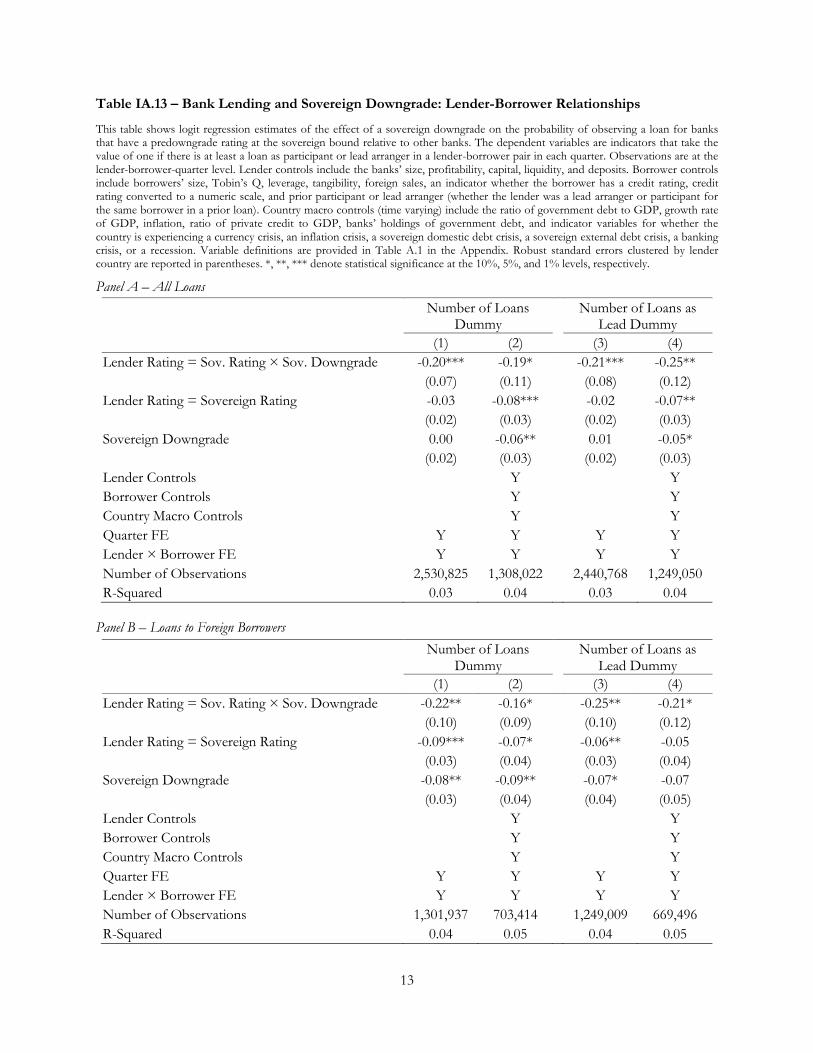
Table IA.13 – Bank Lending and Sovereign Downgrade: Lender-Borrower Relationships
This table shows logit regression estimates of the effect of a sovereign downgrade on the probability of observing a loan for banks that have a predowngrade rating at the sovereign bound relative to other banks. The dependent variables are indicators that take the value of one if there is at least a loan as participant or lead arranger in a lender-borrower pair in each quarter. Observations are at the lender-borrower-quarter level. Lender controls include the banks’ size, profitability, capital, liquidity, and deposits. Borrower controls include borrowers’ size, Tobin’s Q, leverage, tangibility, foreign sales, an indicator whether the borrower has a credit rating, credit rating converted to a numeric scale, and prior participant or lead arranger (whether the lender was a lead arranger or participant for the same borrower in a prior loan). Country macro controls (time varying) include the ratio of government debt to GDP, growth rate of GDP, inflation, ratio of private credit to GDP, banks’ holdings of government debt, and indicator variables for whether the country is experiencing a currency crisis, an inflation crisis, a sovereign domestic debt crisis, a sovereign external debt crisis, a banking crisis, or a recession. Variable definitions are provided in Table A.1 in the Appendix. Robust standard errors clustered by lender country are reported in parentheses. *, **, *** denote statistical significance at the 10%, 5%, and 1% levels, respectively.
Panel A – All Loans
Number of Loans
Dummy Number of Loans as
Lead Dummy
(1) (2)
(3) (4)
Lender Rating = Sov. Rating × Sov. Downgrade -0.20*** -0.19*
-0.21*** -0.25**
(0.07) (0.11)
(0.08) (0.12)
Lender Rating = Sovereign Rating -0.03 -0.08***
-0.02 -0.07**
(0.02) (0.03)
(0.02) (0.03)
Sovereign Downgrade 0.00 -0.06**
0.01 -0.05*
(0.02) (0.03)
(0.02) (0.03)
Lender Controls
Y
Y
Borrower Controls
Y
Y
Country Macro Controls
Y
Y
Quarter FE Y Y
Y Y
Lender × Borrower FE Y Y
Y Y
Number of Observations 2,530,825 1,308,022
2,440,768 1,249,050
R-Squared 0.03 0.04
0.03 0.04
Panel B – Loans to Foreign Borrowers
Number of Loans
Dummy Number of Loans as
Lead Dummy
(1) (2)
(3) (4)
Lender Rating = Sov. Rating × Sov. Downgrade -0.22** -0.16*
-0.25** -0.21*
(0.10) (0.09)
(0.10) (0.12)
Lender Rating = Sovereign Rating -0.09*** -0.07*
-0.06** -0.05
(0.03) (0.04)
(0.03) (0.04)
Sovereign Downgrade -0.08** -0.09**
-0.07* -0.07
(0.03) (0.04)
(0.04) (0.05)
Lender Controls
Y
Y
Borrower Controls
Y
Y
Country Macro Controls
Y
Y
Quarter FE Y Y
Y Y
Lender × Borrower FE Y Y
Y Y
Number of Observations 1,301,937 703,414
1,249,009 669,496
R-Squared 0.04 0.05
0.04 0.05

14
Table IA.14 – Bank Lending and Sovereign Downgrade: Government Support and Bondholdings
This table shows OLS regression estimates of the effect of a sovereign downgrade on the growth rate of the number of loans of banks that have a predowngrade rating at the sovereign bound relative to other banks. The dependent variables are measured as the percentage change between the quarter before and two quarters after the sovereign downgrade. Observations are at the lender-quarter level. Lender controls include the banks’ size, profitability, capital, liquidity, and deposits. Country macro controls (time varying) include the ratio of government debt to GDP, growth rate of GDP, inflation, ratio of private credit to GDP, banks’ holdings of government debt, and indicator variables for whether the country is experiencing a currency crisis, an inflation crisis, a sovereign domestic debt crisis, a sovereign external debt crisis, a banking crisis, or a recession. Columns (1) and (2) exclude banks with ratio of bank liabilities to GDP above the 75th percentile of the distribution. Columns (3) and (4) exclude state-owned banks. Columns (5) and (6) exclude banks with rating uplift (difference between the Moody’s Long-Term Issuer Rating and the Bank Financial Strength Rating) above the median of the distribution. Columns (7) and (8) exclude banks with ratio of holdings of government securities to total assets above the median of the distribution. Variable definitions are provided in Table A.1 in the Appendix. Robust standard errors clustered by lender country are reported in parentheses. *, **, *** denote statistical significance at the 10%, 5%, and 1% levels, respectively.
Sample: Excluding Too Big to
Fail Banks Excluding State-Owned Banks
Excluding High Rating Uplift Banks
Excluding High Gov. Bondholdings Banks
(1) (2)
(3) (4)
(5) (6)
(7) (8)
Lender Rating = Sov. Rating × Sov. Downgrade -0.61*** -0.22*
-0.42*** -0.39***
-0.61*** -0.59**
-0.46*** -0.28**
(0.21) (0.13)
(0.11) (0.15)
(0.13) (0.23)
(0.11) (0.11)
Lender Rating = Sovereign Rating 0.04 -0.01
0.04 0.06
0.14* 0.02
0.04 0.04
(0.08) (0.05)
(0.04) (0.05)
(0.07) (0.10)
(0.04) (0.05)
Sovereign Downgrade -0.08
-0.03
0.19*
-0.05
(0.13)
(0.08)
(0.10)
(0.07)
Lender Controls Y Y
Y Y
Y Y
Y Y
Country Macro Controls Y
Y
Y
Y
Quarter FE Y
Y
Y
Y
Country FE Y
Y
Y
Y
Country × Quarter FE
Y
Y
Y
Y
Number of Observations 6,555 6,555
11,427 11,427
5,393 5,393
12,030 12,030
R-Squared 0.07 0.30
0.10 0.31
0.12 0.29
0.09 0.30