
Internet - Jefferies · page 2 of 49 Jefferies US Internet Team, ... of front-end and back-end...
49
INDUSTRY NOTE USA | Technology Internet April 10, 2013 Internet Fulfillment / Same-Day: The Next Killer App EQUITY RESEARCH AMERICAS Jefferies US Internet Team * Jefferies Equity Research [email protected] Brian Pitz * Equity Analyst (212) 336-7413 [email protected] Brian Fitzgerald * Equity Analyst (212) 284-2491 [email protected] Timothy O'Shea * Equity Associate (212) 284-3415 [email protected] Sachin Khattar, CFA * Equity Associate (212) 323-3381 [email protected] Stan Velikov, CFA * Equity Associate (212) 284-2140 [email protected] * Jefferies LLC Key Takeaway We believe fulfillment and omni-channel capabilities represent the next high ground in the eCommerce war. The winners are not clear yet but major players are investing heavily. For now, Amazon and eBay have the most comprehensive offerings longer-term but leaders could change any time; more than a few other players are close behind. We reiterate our Buy ratings on AMZN and EBAY. Fulfillment is becoming critical for commerce as an impending online sales tax should soon neutralize any price advantage online retailers had. When this happens, we believe, fulfillment options will become a differentiating feature for many online (and offline) retailers. At the same time, Local becomes the new battleground in commerce. While 90% of all retail still happens in brick-and-mortar stores, 75% of total spending is within 15 miles of shoppers' homes. Mobile is changing the picture, too. It is driving the transition to a world where it is expanding commerce beyond conventional stores and eCommerce websites. In such an omni-channel world consumers have multiple touch points with a brand / retailer and these have to be well integrated and optimized for a seamless user experience. We believe the growing importance of fulfillment and omni- channel already drives retailers to explore options beyond free shipping. With free shipping now available on approximately 50% of orders, retailers already feel renewed pressure to explore new fulfillment options. Over the past 2-3 years, competitive pressure and customer expectations have pushed online retailers to offer free / reduced shipping on an increasing number of orders with constantly shrinking minimum order requirements. Today, free / reduced shipping is a "must have" in eCommerce and online retailers are focusing their attention on the next wave of options that could give them a leg up on competition. Currently, same-day delivery and delivery to local secure lockers where customers pick up their goods on their own time schedule seem to be the biggest focus. With most of these services still in beta test, the landscape is constantly changing but we believe the major contenders have already emerged. Major players: There are generally three types of players in fulfillment – those that only fulfill, those that sell and fulfill, and those that source, sell and fulfill. For now, the first type are largely niche (location based) start-ups that have expanded from running errands for customers into same-day delivery. The other two types have the highest stakes in the game and are the ones, we believe, most likely to drive fulfillment into new territories. Key players here include not only the usual suspects - Amazon and eBay - but also Google, big national retailers, and the USPS. Potential winners: While it is not clear yet if consumers are actually ready to pay (and how much) for same-day delivery and similar services, the competition in fulfillment is on and major players are already investing. Which aspects of fulfillment (e.g. speed, flexibility, cost) will prove more important to consumers could determine which of the existing offerings will survive and thrive. Currently, we believe, Amazon and eBay have the most compelling offerings. Amazon is a clear leader, based on number of services, global fulfillment center footprint, and ability to manage demand elasticity through its digital assets. And while many retailers are wary of using Amazon as a channel, we believe longer- term it could become their best partner, especially for branded products/retailers (selling exclusive inventory through Amazon). eBay has partnered with top national retailers (while maintaining neutrality) and, in our view, has the most compelling offering that helps retailers leverage their own brands and assets to evolve their multi-channel strategies. Its products enable retailers to address the full opportunity of the converging online and offline markets. And while most of the other contenders' offerings are still in beta mode (i.e. could change materially), a few stand out as potentially strong enough to compete with Amazon and eBay. We believe two to keep an eye on are Walmart and Google. Jefferies does and seeks to do business with companies covered in its research reports. As a result, investors should be aware that Jefferies may have a conflict of interest that could affect the objectivity of this report. Investors should consider this report as only a single factor in making their investment decision. Please see analyst certifications, important disclosure information, and information regarding the status of non-US analysts on pages 45 to 49 of this report.
Transcript of Internet - Jefferies · page 2 of 49 Jefferies US Internet Team, ... of front-end and back-end...

INDUSTRY NOTE
USA | Technology
Internet April 10, 2013
InternetFulfillment / Same-Day: The Next Killer App
EQU
ITY R
ESEARC
H A
MERIC
AS
Jefferies US Internet Team *Jefferies Equity Research
[email protected] Pitz *
Equity Analyst(212) 336-7413 [email protected]
Brian Fitzgerald *Equity Analyst
(212) 284-2491 [email protected] O'Shea *
Equity Associate(212) 284-3415 [email protected]
Sachin Khattar, CFA *Equity Associate
(212) 323-3381 [email protected] Velikov, CFA *
Equity Associate(212) 284-2140 [email protected]
* Jefferies LLC
Key TakeawayWe believe fulfillment and omni-channel capabilities represent the next highground in the eCommerce war. The winners are not clear yet but major playersare investing heavily. For now, Amazon and eBay have the most comprehensiveofferings longer-term but leaders could change any time; more than a fewother players are close behind. We reiterate our Buy ratings on AMZN and EBAY.
Fulfillment is becoming critical for commerce as an impending online sales taxshould soon neutralize any price advantage online retailers had. When this happens, webelieve, fulfillment options will become a differentiating feature for many online (andoffline) retailers. At the same time, Local becomes the new battleground in commerce.While 90% of all retail still happens in brick-and-mortar stores, 75% of total spending iswithin 15 miles of shoppers' homes. Mobile is changing the picture, too. It is driving thetransition to a world where it is expanding commerce beyond conventional stores andeCommerce websites. In such an omni-channel world consumers have multiple touchpoints with a brand / retailer and these have to be well integrated and optimized for aseamless user experience. We believe the growing importance of fulfillment and omni-channel already drives retailers to explore options beyond free shipping.
With free shipping now available on approximately 50% of orders, retailersalready feel renewed pressure to explore new fulfillment options. Over the past 2-3 years,competitive pressure and customer expectations have pushed online retailers to offer free /reduced shipping on an increasing number of orders with constantly shrinking minimumorder requirements. Today, free / reduced shipping is a "must have" in eCommerce andonline retailers are focusing their attention on the next wave of options that could give thema leg up on competition. Currently, same-day delivery and delivery to local securelockers where customers pick up their goods on their own time schedule seem to bethe biggest focus. With most of these services still in beta test, the landscape is constantlychanging but we believe the major contenders have already emerged.
Major players: There are generally three types of players in fulfillment – those that onlyfulfill, those that sell and fulfill, and those that source, sell and fulfill. For now, the firsttype are largely niche (location based) start-ups that have expanded from running errandsfor customers into same-day delivery. The other two types have the highest stakes in thegame and are the ones, we believe, most likely to drive fulfillment into new territories. Keyplayers here include not only the usual suspects - Amazon and eBay - but also Google,big national retailers, and the USPS.
Potential winners: While it is not clear yet if consumers are actually ready to pay (and howmuch) for same-day delivery and similar services, the competition in fulfillment is on andmajor players are already investing. Which aspects of fulfillment (e.g. speed, flexibility, cost)will prove more important to consumers could determine which of the existing offeringswill survive and thrive. Currently, we believe, Amazon and eBay have the mostcompelling offerings. Amazon is a clear leader, based on number of services, globalfulfillment center footprint, and ability to manage demand elasticity through its digitalassets. And while many retailers are wary of using Amazon as a channel, we believe longer-term it could become their best partner, especially for branded products/retailers (sellingexclusive inventory through Amazon). eBay has partnered with top national retailers (whilemaintaining neutrality) and, in our view, has the most compelling offering that helpsretailers leverage their own brands and assets to evolve their multi-channel strategies. Itsproducts enable retailers to address the full opportunity of the converging online and offlinemarkets. And while most of the other contenders' offerings are still in beta mode (i.e. couldchange materially), a few stand out as potentially strong enough to compete with Amazonand eBay. We believe two to keep an eye on are Walmart and Google.
Jefferies does and seeks to do business with companies covered in its research reports. As a result, investors should be aware that Jefferies may have a conflictof interest that could affect the objectivity of this report. Investors should consider this report as only a single factor in making their investment decision.Please see analyst certifications, important disclosure information, and information regarding the status of non-US analysts on pages 45 to 49 of this report.

Key Takeaways
Fulfillment is becoming critical for commerce as an impending online sales tax should
soon neutralize any price advantage online retailers had. When this happens, we believe,
fulfillment options will become a differentiating feature for many online (and offline)
retailers. At the same time, Local becomes the new battleground in commerce. While
90% of all retail still happens in brick-and-mortar stores, 75% of total spending is within
15 miles of shoppers' homes. Mobile is changing the picture, too. It is driving the
transition to a world where it is expanding commerce beyond conventional stores and
eCommerce websites.
Reiterating Buy ratings on AMZN and EBAY
In the ongoing eCommerce war, we believe, Amazon and eBay have the most
comprehensive next-gen offerings and seem best positioned to benefit from these
fundamental trends. Amazon is a clear leader, based on number of services, global
fulfillment center footprint, and ability to manage demand elasticity through its digital
assets. And while many retailers are wary of using Amazon as a channel, we believe
longer-term it could become their best partner, especially for branded products / retailers
(selling exclusive inventory through Amazon). eBay, at the same time, has partnered with
top national retailers (while maintaining neutrality) and, in our view, has the most
compelling offering that helps retailers leverage their own brands and assets to evolve
their multi-channel strategies. Its products enable retailers to address the full opportunity
of the converging online and offline markets.
Amazon
Near term, we will likely see a more significant impact to Amazon's CapEx growth as the
company continues to aggressively build out fulfillment centers domestically and
internationally. We expect FC build out for this year to peak in late Q2 into Q3, with a
slowdown just ahead of the 2013 holiday season. So far, Amazon has commitments (part
of state tax agreements) to build 9 new FCs in the US over the next 2 years and we
estimate it could eventually build 5-10 more to rationalize its US footprint. According to
Marc Wulfraat, President of MWPVL International, a supply chain and logistics consulting
firm, having 40-45 facilities in the US is probably sufficient to cover the Top 20 markets for
same-day delivery. However, internationally Amazon could grow its presence materially,
especially in Australia, South America, Eastern Europe, and India. We estimate it could
open another 10-15 within the next 2-3 years.
We continue to expect Amazon to support additional same-day and next-day shipping
tests, as we consistently see with Quidsi and Zappos products in several markets. We
anticipate same-day tests will begin and grow on the core Amazon.com site by year end
in some markets.
Longer term, as Amazon drives same-day and next-day shipping into the top 20 or top
50 US markets (and eventually into the larger international markets), we believe same-day
shipping will drive reaccelerating unit growth; the earliest impact could even begin in Q4
2013, but most likely will have a longer term impact in 2014 and beyond.
Technology
Internet
April 10, 2013
page 2 of 49 , Jefferies Equity Research, [email protected] US Internet Team
Please see important disclosure information on pages 45 - 49 of this report.

eBay
Near term, eBay may have the performance edge as the Marketplaces / PayPal / GSI
combo, with their combination of front-end and back-end eCommerce and digital
marketing solutions, gives retailers competing against Amazon a real fighting chance.
Further, the very nature of eBay being on the "retailers’ team" and enabling overall omni-
channel commerce will likely be a huge selling point for eBay's services, especially among
the offline sellers of commoditized goods.
Longer term, we believe the biggest challenges for eBay will be achieving significant
scale in fulfillment and same-day shipping, though we are in no way counting them out
of the competition.
Over time, as consumers begin to digest and appreciate the value of same-day shipping,
and eventually even start to EXPECT or REQUIRE near instantaneous shipping, we believe
the next leg down for traditional brick-and-mortar could begin... As competing with this
service level will likely be very difficult from a cost perspective.
Offline – who wins, who loses?
Amazon IS indeed a competitor in many product categories – again, namely in consumer
products – with the likes of Best Buy; that is unlikely to change. And we believe that same-
day shipping capabilities could provide the next level of pain for the offline retailers in
these categories. If Amazon is successful in its same-day shipping efforts, some of these
retailers could give Amazon exclusive inventory to ship same day, replacing their tradition
fulfillment businesses.
We believe that unique product brands that sell almost exclusively through their own
stores or exclusive channels could win while commodity product sellers of consumer
electronics, media (books, movies, video), etc. would likely lose.
The net of it all...
Amazon may actually become LESS of a competitor to some players in the offline world
over time as larger brands (specialty, luxury, exclusive) decide that "if you can't beat 'em,
join 'em" strategy could actually work and allocate a certain percentage of their inventory
to Amazon's FBA (many already provide eBay with access to exclusive SKUs and
inventory)... Think about it... Why should specialty retailers maintain 1,000's of specialty
stores / fulfillment centers when one could maintain a fraction of those stores as
strategically well-placed "showrooms" to allow consumers to satisfy their need to
occasionally view actual merchandise?
Let's use an example such as the offline retailer Lululemon; once the customer can try on
a pair of yoga pants and determine that she is size small in a flagship store; she can order
new styles and colors directly online - and potentially even have them delivered to her
hotel in a few hours if she forgets them on a business trip. (Note: there isn’t a single
Lululemon product to be found on Amazon’s site). Our sense is that Lululemon would
not pay to actually provide that level of service to their customer direct from their stores,
but why not someday leverage the most efficient supply chain platform in the world in an
exclusive merchandise deal with Amazon? Some 39% of units Amazon sells on its site are
already from third parties. Why, with the success of FBA, shouldn't that number represent
70% of total units? We think it could.
Technology
Internet
April 10, 2013
page 3 of 49 , Jefferies Equity Research, [email protected] US Internet Team
Please see important disclosure information on pages 45 - 49 of this report.
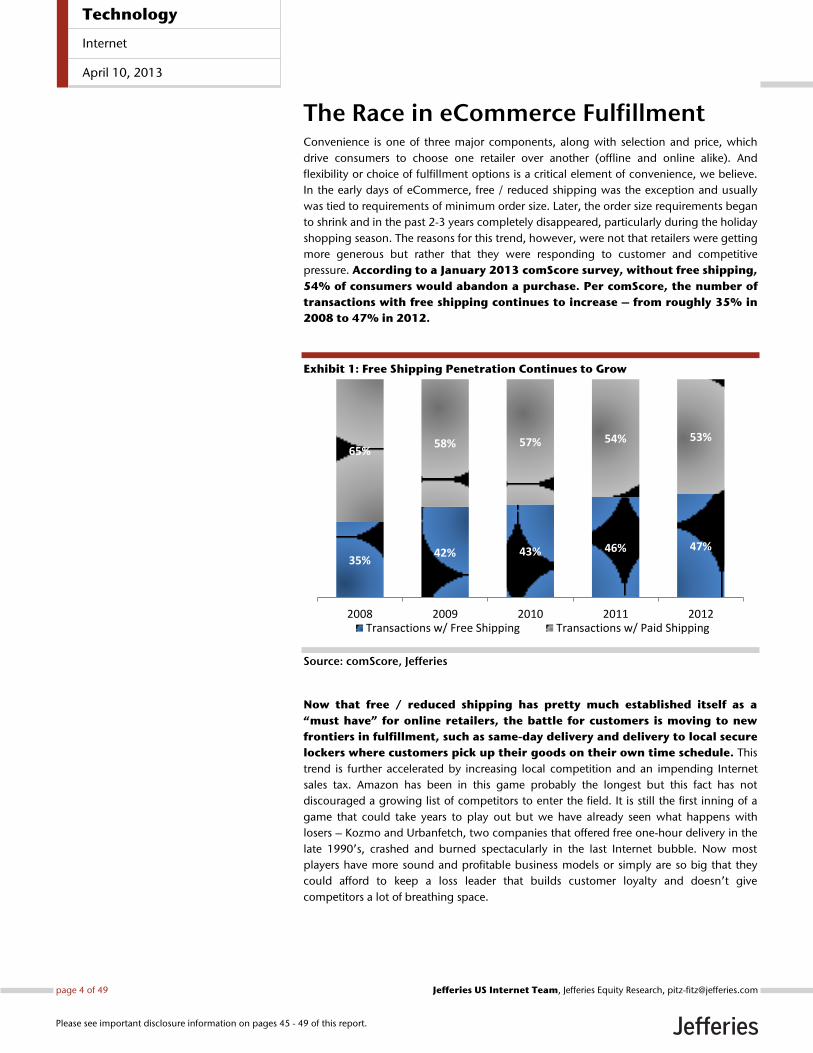
The Race in eCommerce Fulfillment Convenience is one of three major components, along with selection and price, which
drive consumers to choose one retailer over another (offline and online alike). And
flexibility or choice of fulfillment options is a critical element of convenience, we believe.
In the early days of eCommerce, free / reduced shipping was the exception and usually
was tied to requirements of minimum order size. Later, the order size requirements began
to shrink and in the past 2-3 years completely disappeared, particularly during the holiday
shopping season. The reasons for this trend, however, were not that retailers were getting
more generous but rather that they were responding to customer and competitive
pressure. According to a January 2013 comScore survey, without free shipping,
54% of consumers would abandon a purchase. Per comScore, the number of
transactions with free shipping continues to increase – from roughly 35% in
2008 to 47% in 2012.
Exhibit 1: Free Shipping Penetration Continues to Grow
Source: comScore, Jefferies
Now that free / reduced shipping has pretty much established itself as a
“must have” for online retailers, the battle for customers is moving to new
frontiers in fulfillment, such as same-day delivery and delivery to local secure
lockers where customers pick up their goods on their own time schedule. This
trend is further accelerated by increasing local competition and an impending Internet
sales tax. Amazon has been in this game probably the longest but this fact has not
discouraged a growing list of competitors to enter the field. It is still the first inning of a
game that could take years to play out but we have already seen what happens with
losers – Kozmo and Urbanfetch, two companies that offered free one-hour delivery in the
late 1990’s, crashed and burned spectacularly in the last Internet bubble. Now most
players have more sound and profitable business models or simply are so big that they
could afford to keep a loss leader that builds customer loyalty and doesn’t give
competitors a lot of breathing space.
35%42% 43% 46% 47%
65%58% 57% 54% 53%
2008 2009 2010 2011 2012Transactions w/ Free Shipping Transactions w/ Paid Shipping
Technology
Internet
April 10, 2013
page 4 of 49 , Jefferies Equity Research, [email protected] US Internet Team
Please see important disclosure information on pages 45 - 49 of this report.

Key Players There are generally three types of players in the fulfillment game – those that only fulfill
(F), those that sell and fulfill (SF), and those that source, sell and fulfill (SSF). Currently,
in addition to Amazon (SSF), major players include eBay (SF), Walmart (SSF) and Google
(SF) – all three of them testing a variation on same-day delivery service (and all three still
in beta). The list of other players includes Barnes & Noble (SSF), Nordstrom (SSF), the US
Postal Service (F) and start-ups such as Exec (F), Instacart (F), Postmates (F), Shutl (F),
TaskRabbit (F), and WunWun (F).
Amazon Amazon is one of the largest online retailers in the world and currently has one of the
most comprehensive fulfillment offerings; it includes free shipping, same-day delivery,
and delivery to a neighborhood locker.
Free Shipping
Amazon Prime, the company’s membership program, offers free two-day shipping on
millions of eligible items with no minimum order size; for all other items, standard or no-
rush shipping is also free. Shipping upgrades for expedited delivery in the US are available
too. Prime Members also enjoy unlimited instant streaming of more than 33,000 movies
and TV episodes as well as access to the Kindle Owners’ Lending Library where they can
borrow one Kindle book for free each month. All this for a $79 annual fee. By far, in our
opinion, Amazon Prime has been the gold standard in free / reduced shipping that other
online retailers are trying to match.
Exhibit 2: Amazon Prime
Source: Amazon, Jefferies
Same-Day Delivery
Amazon also offers Local Express Delivery, a same-day delivery service available in 10
metro areas – Baltimore, Boston, Chicago, Indianapolis, Las Vegas, New York City (and
parts of New Jersey), Philadelphia, Phoenix, Seattle, and Washington, DC. It costs $3.99
per item for Prime members and $8.99 per shipment + $0.99 per item for non-members
(gift cards $3.99 per shipment). The cut-off times vary from 7am in Chicago and
Amazon Prime offers free two-
day shipping on millions of
eligible items with no minimum
order size; for all other items,
standard or no-rush shipping is
also free
Technology
Internet
April 10, 2013
page 5 of 49 , Jefferies Equity Research, [email protected] US Internet Team
Please see important disclosure information on pages 45 - 49 of this report.

Indianapolis to 12pm in Seattle. Orders placed after the deadline are delivered the next
business day with Saturday and Sunday delivery available for certain locations.
Local Express Delivery was launched in October 2009 in seven metro areas – Baltimore,
Boston, Las Vegas, New York City, Philadelphia, Seattle, and Washington, DC. It covered
thousands of items and cost $5.99 per item for Prime members and $15-$20 per item
(based on category) for non-members. By holiday season 2009 it had expanded to
include Chicago, Indianapolis and Phoenix. Customers ordering as late as 10:00am-
10:30am (1:00pm for Seattle) could get their orders delivered the same day.
Delivery to Neighborhood Locker
Amazon Locker, another shipping service by the company, solves a different problem.
Shoppers who are unable to wait at home for delivery can pick up their Amazon package
from a secure locker at their own convenience. At check-out, for eligible items, users can
select a convenient locker location and, once the package arrives there, they receive an e-
mail or text message with instructions and a unique pick-up code. Packages are available
for pick-up for three business days after receipt of notice. Complementary to other
shipping options, Amazon Locker is free and is currently available in Seattle, New York
City, and some shopping centers in the UK. Reportedly, Amazon has signed agreements
with 7-Eleven, RadioShack, Rite Aid, and Staples for hosting its lockers in their national
chain locations.
Exhibit 3: Amazon Locker
Source: Internet, Jefferies
“White Truck” Network for Localized Delivery
Reportedly, for the “last mile” of its services Amazon has engaged several “white truck”
companies that offer local delivery in numerous cities. The list of its partners includes A-1
Express and Dynamex, for Local Express Delivery, and Ensenda, LaserShip, OnTrac,
and Prestige for Prime deliveries. While it’s hard to control the quality of user experience
completely, by leveraging third-party carriers with established infrastructure in major
Technology
Internet
April 10, 2013
page 6 of 49 , Jefferies Equity Research, [email protected] US Internet Team
Please see important disclosure information on pages 45 - 49 of this report.

markets, Amazon can enter new markets quickly and can spare itself the investment in a
fleet of its own. Later, the company can always decide to bring this aspect of fulfillment
in-house, once demand levels and the economics become clearer.
Excellence in Order Processing
Another piece of Amazon’s fulfillment platform is Kiva Systems, maker of robotic order
fulfillment systems which streamline the process of picking, packing and shipping
eCommerce orders for delivery. Amazon closed the acquisition of Kiva in May 2012 but its
Quidsi (Soap.com and Diapers.com) business had been using Kiva robots since before
2010. While we believe management may not initially plan to retrofit Kiva robots into all
existing FCs (based on existing fulfillment centers’ layout / type), we believe all newly-
built ones will feature the systems. Kiva’s integrated inventory storage, quality control
and order fulfillment systems not only expedite order processing (2-3x vs. pick-to-
conveyor and 5-6x vs. manual pick-to-cart / pick-to-pallet environments, according to
MWPVL International) but also improve order accuracy and optimize warehousing. Its
adaptive and dynamic software algorithms are constantly seeking new efficiencies to
improve throughput. Such optimization helps cut costs in more than one way. According
to the two Quidsi co-founders, thanks to Kiva robots, the company was able to offer free
overnight shipping on orders over $25 to customers in about 70% of the US.
Kiva began working with companies like Staples and Walgreens in 2004 and today it
counts among its customers more than a dozen of the biggest retailers in the US
including Crate & Barrel, Drugstore.com, Gap, Gilt Groupe, Office Depot, Saks Fifth
Avenue, and Toys “R” Us. Kiva Systems might as well prove the driver behind Amazon’s
Local Express Delivery service as its efficiency is hard to match. Since Kiva does not require
batching and waving of orders, any online order can be processed in as little as 15
minutes (from the time a shopper places the order to when his/her picked, packed and
labeled package is sitting on a delivery truck). This compares to a roughly 2-hour average
processing time in current Amazon fulfillment centers.
Exhibit 4: Kiva Robots in Action at a Warehouse
Source: Internet, Jefferies
While Kiva has many advantages, it may not be well-suited for all fulfillment settings. Kiva
systems sacrifice cubic volume and there is no way to take advantage of warehouse
height. In addition, according to some retailers (Kiva customers), its replenishment
software is not as robust as other applications and it doesn't integrate well with outbound
sortation software of any kind. We believe this is an opportunity for Amazon to improve
Online orders can be processed
in as little as 15 min in FCs with
Kiva robots (pictured below) vs.
an average of ~2 hrs for current
Amazon FCs
Technology
Internet
April 10, 2013
page 7 of 49 , Jefferies Equity Research, [email protected] US Internet Team
Please see important disclosure information on pages 45 - 49 of this report.

Kiva’s software stack (Amazon is well known for its expertise) and re-launch its products
in the market. Perhaps this was one reason Amazon bought Kiva in the first place – being
able to re-engineer the product and make it even better.
Digital Content
While it may seem strange, digital content is another weapon in Amazon’s arsenal that
helps the company control shipping costs if not make its fulfillment offerings better than
competitors’. Starting in 2H11, Amazon began offering Prime Members who would agree
to downgrade their shipping (from the standard for Prime 2-day shipping) the option to
earn credit ($1 per order, increased to $3 in 2H12) that can be used for digital downloads
from the Amazon MP3 Store or for a movie from Amazon Instant Video. The new shipping
option, called No-Rush Shipping, allows Amazon to ship orders for delivery in 5-7 days
and thus more effectively balance shipping loads during critical shopping periods.
Exhibit 5: Digital Content as Load Balancer
Source: Amazon, Jefferies
The combination of Prime, Amazon Locker, and Local Express Delivery helps create the
most comprehensive fulfillment service existing today, in our view. How these services fit
into Amazon’s overall strategy can be gleaned, we believe, from the company’s evolving
position on the question of online sales tax and its push for new domestic fulfillment
centers. Until 2011-12, Amazon waged a high-profile war on the issue of eCommerce tax
with populous states such as New York, California, and Texas (note: its New York tax case
is currently in state appeals court); and new fulfillment center locations, we think, may
have been equally based on proximity to customers as well as on state tax laws.
Expanding Domestic Footprint While Striking Advantageous Tax Windows
Then, in late 2011, the company made an abrupt turn and began striking deals with state
and local governments that granted Amazon tax holidays of different length in exchange
for commitments to build new fulfillment centers and employ thousands of people. It also
initiated a campaign to encourage comprehensive resolution of the tax question on the
federal level instead of the piecemeal approach by individual states. This, we believe, was
triggered by Amazon’s insight that 1) the days of no online sales tax were numbered, 2)
fast local delivery can be a great competitive weapon that reinforces an online retailer’s
offline presence, and 3) many state and local governments were willing to sign
accelerated deals given their financial situations. In a matter of 16 months (beginning
with California in September 2011) Amazon reached agreements with 8 states.
While some might argue that an online tax is a potential near-term negative catalyst for
eCommerce stocks, we believe the real impact should be fairly insignificant. Amazon has
been collecting for years punitive VAT in many international locations and this has not
had any discernible impact on international sales growth rates. In fact, as we have seen in
states such as NY, the imposition of sales tax did not really impact sales;
Technology
Internet
April 10, 2013
page 8 of 49 , Jefferies Equity Research, [email protected] US Internet Team
Please see important disclosure information on pages 45 - 49 of this report.

ultimately – price, selection and service (along with convenience and speed, which are
service-related derivatives) are the main levers that resonate with online shoppers.
In Exhibit 6 below, we take a look at Amazon’s US operational footprint with a tax overlay.
We believe, the company will continue to expand its presence in select states, primarily
those that provide optimal infrastructure and proximity to markets with high
concentration of Amazon.com customers who are most likely to choose same-day
delivery if offered.
Exhibit 6: Current View of Amazon’s US Sales Tax Footprint
Source: Amazon, Jefferies
Amazon currently collects taxes in 9 states – Arizona, California, Kansas,
Kentucky, New York, North Dakota, Pennsylvania, Texas, and Washington. In
the second half of 2013, the company has agreed to begin collecting taxes in 4 other
states – Connecticut, Massachusetts, New Jersey, and Virginia. Following that, in 2014
Amazon will begin collecting taxes in Indiana, Nevada and Tennessee; and in 2016 it adds
South Carolina to its tax rosters. So that’s 16 states by 2016.
Currently, the company has operations in the following (21) states: Arizona, California,
Delaware, Georgia, Indiana, Kansas, Kentucky, Michigan, New Jersey, Nevada, New
Hampshire, New York, North Dakota, Pennsylvania, South Carolina, Tennessee, Texas,
Virginia, Washington, Wisconsin, and West Virginia. Included here is a mix of both
operational / business headquarters as well as fulfillment (FC) and customer service (CSC)
centers. The following exhibit shows Amazon’s current customer service center footprint.
The company has announced plans to open 1 new CSC in Kentucky in 2013.
●States currently collecting online sales taxes (AZ, CA, KS, KY, NY, ND, PA, TX, WA)
●States collecting online sales taxes starting in 2H13(CT, MA, NJ, VA)
●States collecting online sales taxes starting in 2014(IN, NV, TN)
●States collecting online sales taxes starting in 2016(SC)
●States with an Amazon.com point-of-presence or affiliated business -- zappos, woot!, audible.com, quidsi, etc.(AZ, CA, DE, GA, IN, KS, KY, MI, NJ, NV, NH, NY, ND, PA, SC, TN, TX, VA, WA, WI, WV)
Technology
Internet
April 10, 2013
page 9 of 49 , Jefferies Equity Research, [email protected] US Internet Team
Please see important disclosure information on pages 45 - 49 of this report.

Exhibit 7: Amazon Customer Service Centers
Source: Amazon (http://www.amazon.com/b/?node=239366011), Jefferies
The following exhibit shows what we believe is Amazon’s worldwide fulfillment center
footprint as of 1Q13. By our estimates, excluding Quidsi and Zappos, the company
operates close to 90 fulfillment centers globally with a total space in excess of
55MM square feet. Reportedly, Amazon had plans to open a fulfillment center in
Mumbai, India in 2012 but we couldn’t find a confirmation of this. In addition, we
understand that a new fulfillment center is planned to open in France sometime in 2013.
Exhibit 8: Amazon International Fulfillment Centers
Source: Amazon, MWPVL International, Foursquare, Google, FCC.gov, Jefferies
Americas Europe Asia
United States United Kingdom China
North Dakota Edinburgh, Scotland Beijing
Washington Ireland India
West Virginia Cork Hyderabad
Costa Rica Germany Japan
Heredia Berlin Sapporo
San Jose Regensburg
North America Europe Asia
United States United Kingdom China
Arizona (4) Hemel Hempsted, Hertfordshire Beijing (2)
California Marston Gate, Milton Keynes Chengdu
Delaware (2) Swansea, Wales Guangzhou
Indiana (5) Dunfermline, Fife, Scotland Shenyang
Kansas Gourock, Inverclyde, Scotland Suzhou
Kentucky (7) Doncaster, South Yorkshire Wuhan
Nevada (2) Peterborough, Cambridgeshire Xiamen
New Hampshire Rugeley, Staffordshire Xi'ian
Pennsylvania (6) Germany HaErbin
South Carolina (2) Augsburg Kunshan
Tennessee (5) Bad Hersfeld (2) Nanning
Virginia (3) Koblenz Tianjin
Washington (2) Leipzig Japan
Canada Pforzheim Ichikawa
Toronto Rheinberg Sakai
Vancouver Werne Yachiyo
France Daito
Montelimar Kawagoe City
Saran (Orléans) Kawajima
Sevrey Sayama
Italy Tajimi
Castel San Giovanni Tokoname City
Spain Tosu
San Fernando de Henares Yoshinodai
By our estimates, Amazon
operates close to 90 Fulfillment
Centers globally with a total
space in excess of 55MM sq ft
See pages 12-15 for a more
detailed listing of Amazon’s
Global Fulfillment Center
footprint including size,
location, etc.
Technology
Internet
April 10, 2013
page 10 of 49 , Jefferies Equity Research, [email protected] US Internet Team
Please see important disclosure information on pages 45 - 49 of this report.

The following exhibit shows Amazon’s current US fulfillment center footprint. The
company operates 41 fulfillment centers with an estimated 33MM square feet of space
and has announced plans for 9 new FCs to open over the next 2 years.
Exhibit 9: Amazon US Fulfillment Centers (Total Number if >1)
Source: Amazon, MWPVL International, Foursquare, Google, FCC.gov, Jefferies
State Operational Planned
Arizona Goodyear
Phoenix (3)
California Ontario / San Bernardino Patterson
Tracy
Connecticut TBD
Delaware Middletown
New Castle
Indiana Indianapolis
Jeffersonville
Plainfield (2)
Whitestown
Kansas Coffeyville
Kentucky Campbellsville
Hebron (3)
Lexington (2)
Louisville
Nevada Fernley
Las Vegas
New Hampshire Nashua
New Jersey Robbinsville
TBD
Pennsylvania Breinigsville / Allentown (2)
Carlisle (2)
Hazleton
Lewisberry
South Carolina Cayce / Lexington
Spartanburg
Tennessee Charleston / Cleveland
Chattanooga
Lebanon (2)
Murfreesboro
Texas Schertz
Coppell
Haslet
Virginia Chester
Petersburg
Sterling
Washington Bellevue DuPont
Sumner
Technology
Internet
April 10, 2013
page 11 of 49 , Jefferies Equity Research, [email protected] US Internet Team
Please see important disclosure information on pages 45 - 49 of this report.

The continuing build out of fulfillment centers is helping the company manage shipping
costs more effectively. While these costs keep growing (outpacing revenue growth from
4Q10 to 1Q12), the pace is currently decelerating and in 4Q12 reached its lowest point in
over three years.
The following exhibit gives a comprehensive view of Amazon’s global presence from a
geo-spatial perspective. It includes offices, fulfillment centers, customer service centers,
data centers, and software development centers.
Exhibit 10: Amazon Global Locations
Source: Amazon
Table 1: Amazon Worldwide Fulfillment Centers State / Country Amazon.com
Identifier
Address / Location Opened Size Type
Arizona PHX4 16920 W Commerce Dr
Goodyear, AZ 85338-3620
Jun '08 1.4MM sq ft Non-sortable
PHX3 6835 W Buckeye Rd
Phoenix, AZ 85043-4428
Sep '07 1.0MM sq ft Big sortable
PHX6 4750 W Mohave St
Phoenix, AZ 85043
Oct '10 1.2MM sq ft Big sortable
PHX7 800 N 75th Ave
Phoenix, AZ 85043
Sep '11 1.2MM sq ft
California ONT2 1910 E Central Ave
San Bernardino, CA 92408
Oct '12 950K sq ft
Delaware PHL7 560 Merrimac Ave
Middletown, DE 19709-4652
Oct '12 1.2MM sq ft
PHL1 1 Centerpoint Blvd
New Castle, DE 19720-4172
Nov '97 202K sq ft Big sortable
Indiana IND4 710 S Girls School Rd
Indianapolis, IN 46231-1132
Jun '11 903K sq ft
Technology
Internet
April 10, 2013
page 12 of 49 , Jefferies Equity Research, [email protected] US Internet Team
Please see important disclosure information on pages 45 - 49 of this report.
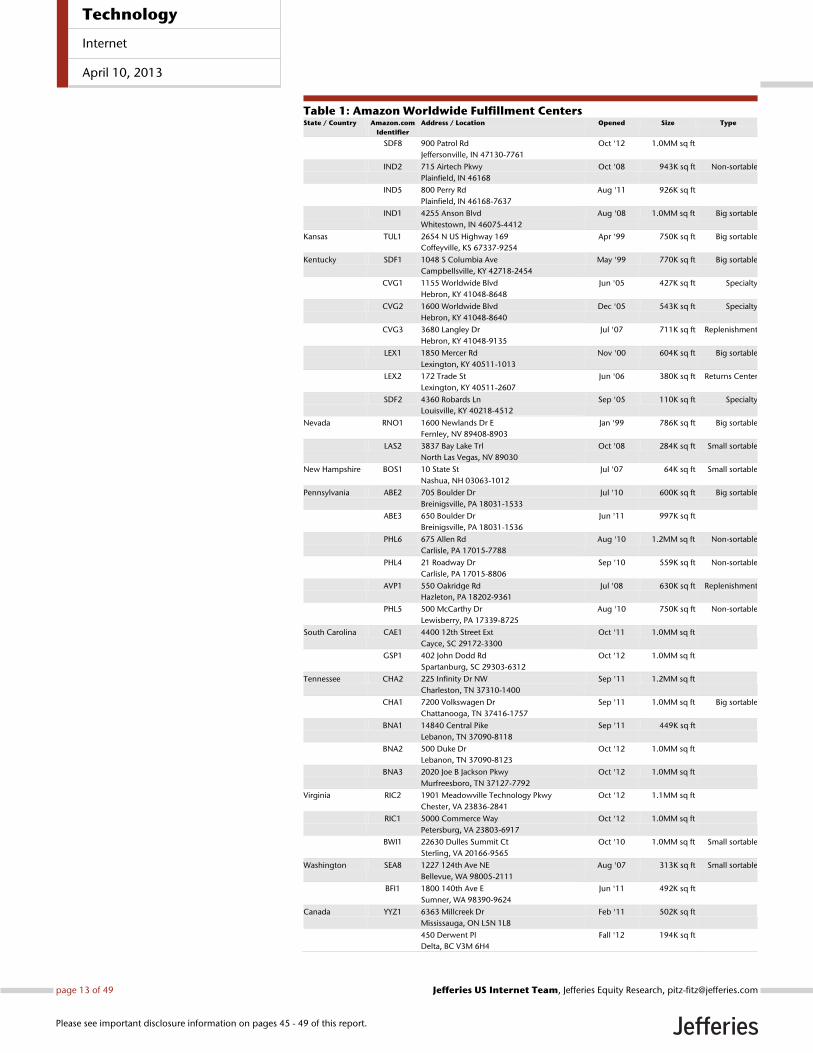
Table 1: Amazon Worldwide Fulfillment Centers State / Country Amazon.com
Identifier
Address / Location Opened Size Type
SDF8 900 Patrol Rd
Jeffersonville, IN 47130-7761
Oct '12 1.0MM sq ft
IND2 715 Airtech Pkwy
Plainfield, IN 46168
Oct '08 943K sq ft Non-sortable
IND5 800 Perry Rd
Plainfield, IN 46168-7637
Aug '11 926K sq ft
IND1 4255 Anson Blvd
Whitestown, IN 46075-4412
Aug '08 1.0MM sq ft Big sortable
Kansas TUL1 2654 N US Highway 169
Coffeyville, KS 67337-9254
Apr '99 750K sq ft Big sortable
Kentucky SDF1 1048 S Columbia Ave
Campbellsville, KY 42718-2454
May '99 770K sq ft Big sortable
CVG1 1155 Worldwide Blvd
Hebron, KY 41048-8648
Jun '05 427K sq ft Specialty
CVG2 1600 Worldwide Blvd
Hebron, KY 41048-8640
Dec '05 543K sq ft Specialty
CVG3 3680 Langley Dr
Hebron, KY 41048-9135
Jul '07 711K sq ft Replenishment
LEX1 1850 Mercer Rd
Lexington, KY 40511-1013
Nov '00 604K sq ft Big sortable
LEX2 172 Trade St
Lexington, KY 40511-2607
Jun '06 380K sq ft Returns Center
SDF2 4360 Robards Ln
Louisville, KY 40218-4512
Sep '05 110K sq ft Specialty
Nevada RNO1 1600 Newlands Dr E
Fernley, NV 89408-8903
Jan '99 786K sq ft Big sortable
LAS2 3837 Bay Lake Trl
North Las Vegas, NV 89030
Oct '08 284K sq ft Small sortable
New Hampshire BOS1 10 State St
Nashua, NH 03063-1012
Jul '07 64K sq ft Small sortable
Pennsylvania ABE2 705 Boulder Dr
Breinigsville, PA 18031-1533
Jul '10 600K sq ft Big sortable
ABE3 650 Boulder Dr
Breinigsville, PA 18031-1536
Jun '11 997K sq ft
PHL6 675 Allen Rd
Carlisle, PA 17015-7788
Aug '10 1.2MM sq ft Non-sortable
PHL4 21 Roadway Dr
Carlisle, PA 17015-8806
Sep '10 559K sq ft Non-sortable
AVP1 550 Oakridge Rd
Hazleton, PA 18202-9361
Jul '08 630K sq ft Replenishment
PHL5 500 McCarthy Dr
Lewisberry, PA 17339-8725
Aug '10 750K sq ft Non-sortable
South Carolina CAE1 4400 12th Street Ext
Cayce, SC 29172-3300
Oct '11 1.0MM sq ft
GSP1 402 John Dodd Rd
Spartanburg, SC 29303-6312
Oct '12 1.0MM sq ft
Tennessee CHA2 225 Infinity Dr NW
Charleston, TN 37310-1400
Sep '11 1.2MM sq ft
CHA1 7200 Volkswagen Dr
Chattanooga, TN 37416-1757
Sep '11 1.0MM sq ft Big sortable
BNA1 14840 Central Pike
Lebanon, TN 37090-8118
Sep '11 449K sq ft
BNA2 500 Duke Dr
Lebanon, TN 37090-8123
Oct '12 1.0MM sq ft
BNA3 2020 Joe B Jackson Pkwy
Murfreesboro, TN 37127-7792
Oct '12 1.0MM sq ft
Virginia RIC2 1901 Meadowville Technology Pkwy
Chester, VA 23836-2841
Oct '12 1.1MM sq ft
RIC1 5000 Commerce Way
Petersburg, VA 23803-6917
Oct '12 1.0MM sq ft
BWI1 22630 Dulles Summit Ct
Sterling, VA 20166-9565
Oct '10 1.0MM sq ft Small sortable
Washington SEA8 1227 124th Ave NE
Bellevue, WA 98005-2111
Aug '07 313K sq ft Small sortable
BFI1 1800 140th Ave E
Sumner, WA 98390-9624
Jun '11 492K sq ft
Canada YYZ1 6363 Millcreek Dr
Mississauga, ON L5N 1L8
Feb '11 502K sq ft
450 Derwent Pl
Delta, BC V3M 6H4
Fall '12 194K sq ft
Technology
Internet
April 10, 2013
page 13 of 49 , Jefferies Equity Research, [email protected] US Internet Team
Please see important disclosure information on pages 45 - 49 of this report.

Table 1: Amazon Worldwide Fulfillment Centers State / Country Amazon.com
Identifier
Address / Location Opened Size Type
UK LTN1 Marston Gate Distribution Centre
Ridgmont
Milton Keynes, Bedfordshire MK43 0ZA
1998 550K sq ft
GLA1 2 Cloch Road, Faulds Park
Gourock, Inverclyde, Scotland PA19 1BQ
Jul '04 300K sq ft
CWL1 Ffordd Amazon
Crymlyn Burrows
Swansea, South Wales SA1 8QX
Apr '08 800K sq ft
EUK5 Phase Two, Kingston Park
Flaxley Road
Peterborough, Cambridgeshire PE2 9EN
Oct '09 500K sq ft
LBA1 Unit 1, Balby Carr Bank
Doncaster, South Yorkshire DN4 5JS
Dec '10 415K sq ft
BHX1 Towers Business Park
Power Station Road
Rugeley, Staffordshire WS15 1NZ
Aug '11 700K sq ft
EDI4 Amazon Way
Dunfermline, Fife, Scotland KY11 8ST
Nov '11 1.0MM sq ft
LTN2 Boundary Way
Hemel Hempsted, Hertfordshire HP2 7LF
Nov '12 450K sq ft
Germany FRA1 Am Schloss Eichhof 1
36251 Bad Hersfeld, Hessen
Aug '99 452K sq ft
FRA3 Obere Kuehnbach/ Amazonstrasse 1
36251 Bad Hersfeld, Hessen
Aug '99 1.2MM sq ft
LEJ1 Amazonstrasse 1
04347 Leipzig, Saxony
Sep '06 807K sq ft
EDE4 Wahrbrink 25
59368 Werne, North Rhine-Westphalia
Sep '11 1.4MM sq ft
DUS2 Amazonstrasse 1
47495 Rheinberg, North Rhine-Westphalia
Dec '11 1.2MM sq ft
MUC3 Amazonstrasse 1
86863 Graben, Bavaria
Dec '11 1.2MM sq ft
STR1 Amazonstrasse 1 / Bauschlotter Strasse
75177 Pforzheim, Baden-Wurttemberg
Sep '12 1.2MM sq ft
CGN1 Amazonstrasse 1 / Am Autobahnkreuz
56072 Koblenz, Rheinland-Pfalz
Nov '12 1.2MM sq ft
France ORY1 1401 Rue du Champ Rouge, Pole 45
45770 Saran, Loiret
Dec '07 753K sq ft
MRS1 Building 2 Rue Joseph Garde
ZAC Les Portes de Provence
26200 Montelimar
Aug '10 388K sq ft
LYS1 ZAC du Parc d'Activite du Val de Bourgogne
1 Rue Amazon
71100 Sevrey, Burgundy
Sep '12 431K sq ft
Italy MXP1 Parco Logistico Bertola
Via Dogana Po 2
29015 Castel San Giovanni
Oct '11 269K sq ft
Spain MAD4 Avenida de la Astronomia 24
28830 San Fernando de Henares (Madrid)
Jul '12 301K sq ft
China PEK3 Yizhuang, Beijing Apr '04 400K sq ft
SHA1 Suzhou, Jiangsu Nov '06 500K sq ft
CAN1 Guangzhou, Guangdong May '07 120K sq ft
CTU1 Chengdu, Sichuan Nov '09 194K sq ft
PEK5 Tongzhou, Beijing 2010 180K sq ft
XIY1 Xi'an, Shaanxi Aug '10
WUH1 Wuhan, Hubei Sep '10 300K sq ft
XMN1 Xiamen, Fujian Sep '10 17K sq ft
SHE1 Shenyang, Liaoning Oct '10
SHA2 Kunshan, Jiangsu Oct '11 1.3MM sq ft
TSN2 Tianjin, Tianjin Jan '12
NNG1 Nanning, Guangxi Nov '12 538K sq ft
HRB1 Harbin, Heilongjiang
Japan NRT1 Ichikawa, Chiba Nov '05 670K sq ft
KIX1 Sakai, Osaka Aug '09 731K sq ft
Technology
Internet
April 10, 2013
page 14 of 49 , Jefferies Equity Research, [email protected] US Internet Team
Please see important disclosure information on pages 45 - 49 of this report.

Table 1: Amazon Worldwide Fulfillment Centers State / Country Amazon.com
Identifier
Address / Location Opened Size Type
NRT2 Yachiyo, Chiba Oct '07 367K sq ft
NRT5 Kawagoe City, Saitama Jul '10 419K sq ft
KIX2 Daito, Osaka Nov '10 271K sq ft
HND1 Yoshinodai, Saitama 2011
HND2 Sayama, Saitama 2011
HND3 Kawajima, Saitama 2011
NGO1 Tokoname City, Aichi Apr '11
HSG1 Tosu, Saga Jul '12 244K sq ft
Tajimi, Gifu Dec '12 861K sq ft
India BOM1 Mumbai, Maharashtra 2012
Source: MWPVL International; Amazon, FCC.gov, Google, Foursquare, Jefferies
Technology
Internet
April 10, 2013
page 15 of 49 , Jefferies Equity Research, [email protected] US Internet Team
Please see important disclosure information on pages 45 - 49 of this report.
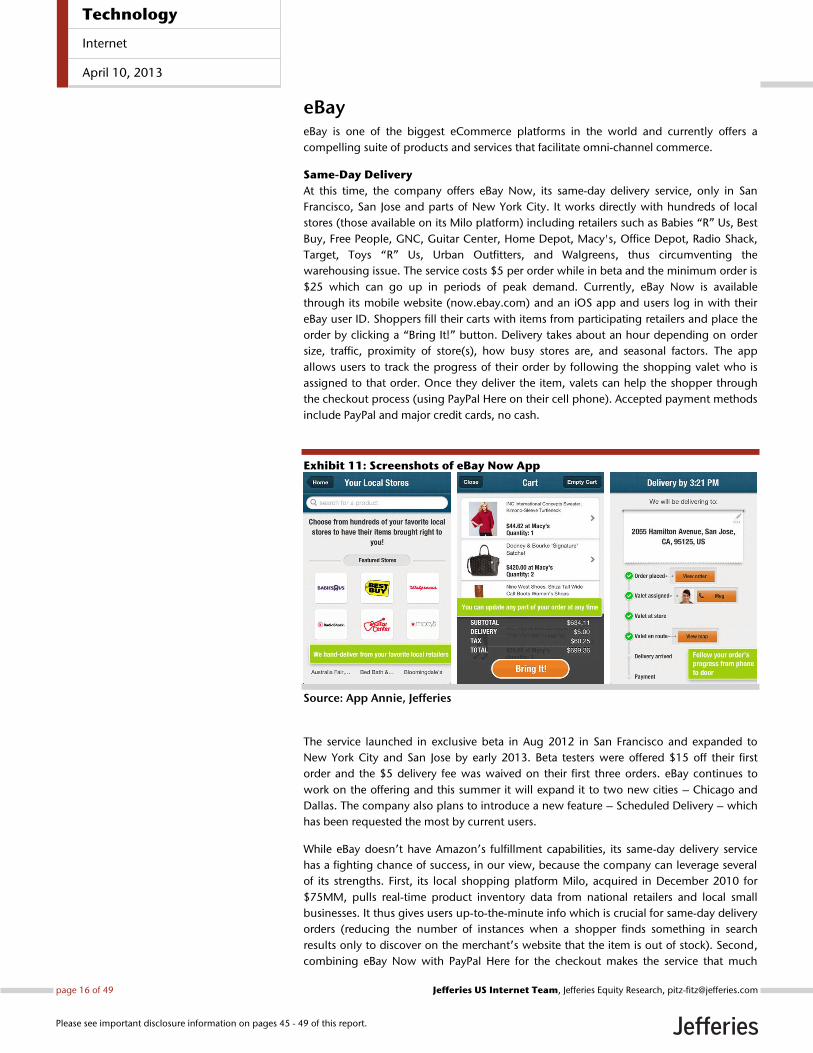
eBay eBay is one of the biggest eCommerce platforms in the world and currently offers a
compelling suite of products and services that facilitate omni-channel commerce.
Same-Day Delivery
At this time, the company offers eBay Now, its same-day delivery service, only in San
Francisco, San Jose and parts of New York City. It works directly with hundreds of local
stores (those available on its Milo platform) including retailers such as Babies “R” Us, Best
Buy, Free People, GNC, Guitar Center, Home Depot, Macy's, Office Depot, Radio Shack,
Target, Toys “R” Us, Urban Outfitters, and Walgreens, thus circumventing the
warehousing issue. The service costs $5 per order while in beta and the minimum order is
$25 which can go up in periods of peak demand. Currently, eBay Now is available
through its mobile website (now.ebay.com) and an iOS app and users log in with their
eBay user ID. Shoppers fill their carts with items from participating retailers and place the
order by clicking a “Bring It!” button. Delivery takes about an hour depending on order
size, traffic, proximity of store(s), how busy stores are, and seasonal factors. The app
allows users to track the progress of their order by following the shopping valet who is
assigned to that order. Once they deliver the item, valets can help the shopper through
the checkout process (using PayPal Here on their cell phone). Accepted payment methods
include PayPal and major credit cards, no cash.
Exhibit 11: Screenshots of eBay Now App
Source: App Annie, Jefferies
The service launched in exclusive beta in Aug 2012 in San Francisco and expanded to
New York City and San Jose by early 2013. Beta testers were offered $15 off their first
order and the $5 delivery fee was waived on their first three orders. eBay continues to
work on the offering and this summer it will expand it to two new cities – Chicago and
Dallas. The company also plans to introduce a new feature – Scheduled Delivery – which
has been requested the most by current users.
While eBay doesn’t have Amazon’s fulfillment capabilities, its same-day delivery service
has a fighting chance of success, in our view, because the company can leverage several
of its strengths. First, its local shopping platform Milo, acquired in December 2010 for
$75MM, pulls real-time product inventory data from national retailers and local small
businesses. It thus gives users up-to-the-minute info which is crucial for same-day delivery
orders (reducing the number of instances when a shopper finds something in search
results only to discover on the merchant’s website that the item is out of stock). Second,
combining eBay Now with PayPal Here for the checkout makes the service that much
Technology
Internet
April 10, 2013
page 16 of 49 , Jefferies Equity Research, [email protected] US Internet Team
Please see important disclosure information on pages 45 - 49 of this report.

more desirable for small local businesses that would likely choose PayPal over other
payment services if that comes with being able to list their inventory in the eBay Now
database. Third, eBay’s no conflict of interest could be another strong magnet for national
and local retailers. Theoretically, as it gathers enough data over time, eBay may decide to
start sourcing and selling the most popular products itself but we believe this is very
unlikely to happen as it runs against the company’s credo. Fourth, eBay offers local and
national retailers access to 60MM+ monthly shoppers (avg. monthly unique visitors in
2012) which only a few other players could match (i.e. Google and Amazon). And lastly,
eBay already has 150,000 stores on eBay Local.
Omni-Channel Capabilities
As the lines between online and offline commerce are blurring, we believe it is important
for retailers of all sizes to embrace omni-channel in order to grow their business and stay
ahead. Today's consumers expect an omni-channel experience, but retailers still think and
operate in terms of multiple channels – the digital store, the physical store, the
wholesalers, their outlets, and the resellers, among others. eBay, through GSI Commerce
and PayPal / Marketplaces, helps retailers respond by enabling them to have a meaningful
online presence. eBay’s product line helps these retailers leverage their own brands and
assets to evolve their multi-channel strategies to seamlessly meet the increasing demands
of the omni-channel consumer.
GSI’s products enable retailers to address the full opportunity of the online and offline
markets. It has built solutions to help clients attract, engage, convert, and retain their
customers through a combination of demand generation, commerce technology, and
multichannel operations. By leveraging GSI’s full omni-channel portfolio, retailers are able
to 1) attract, engage, and retain customers through demand generation and digital
marketing; 2) deliver a seamless brand experience through eCommerce technology and
multichannel operations; and 3) offer a highly-functional Web store, order management,
fulfillment, and customer service. The combination of GSI and eBay extends eBay’s open
commerce platform capabilities and helps retailers win in a connected environment,
allowing them to grow faster and more profitably than on their own.
Technology
Internet
April 10, 2013
page 17 of 49 , Jefferies Equity Research, [email protected] US Internet Team
Please see important disclosure information on pages 45 - 49 of this report.

Two Omni-Channel Case Studies: Dick’s Sporting Goods and Fifth & Pacific /
Kate Spade
#1 Dick’s Sporting Goods is a good example of a leading retailer trying to optimize
omni-channel. Some of its key pain points include:
1) be where customers want to be 24/7 (in store, online, on a smartphone or
tablet);
2) offer fast and free shipping to customers;
3) leverage better physical stores and employees;
4) enable ship-from-store;
5) enable in-store pick-up for online orders;
6) engage and convert more shoppers across all channels and 500+ physical
stores.
The results (powered by GSI products): Leveraging multi-channel solutions,
including Web-enabled store associate ordering system, ship-from-store, and in-store
pick-up technologies, Dick's has created a virtual distribution network closer to their
customers, enabling fast and free shipping. The company also improved optimization of
inventory across its network, making inventory more productive, reducing out-of-stock
items, and capturing incremental sales.
#2 Fifth & Pacific / Kate Spade provide another example of how GSI, in combination
with PayPal / eBay, is producing results. The relationship with Kate Spade evolved from
being a single-solution provider to being a strategy and innovation partner – developing
solutions for a connected consumer that win. The pain points for Kate Spade include:
1) transition from brick and mortar-only to truly omni-channel;
2) enable overnight ship capability with 9pm cutoff time;
3) use stores to drive more demand to the web and use the web to drive more
demand to the stores;
4) drive more users, deeper loyalty, more transactions, higher transaction value,
and grow the brand.
The results (powered by GSI / PayPal / Marketplaces): eBay Marketplaces has
evolved into a way to source new users into the Kate Spade NY franchise (rather than
being a clearance vehicle to get rid of excess inventory). Kate Spade is in the process of
rolling out an entirely new POS system (incorporating PayPal) to every store in the world,
driven by the need to have a system in the store to support true multi-channel marketing
and sales. Across all three brands, multi-channel customers are more loyal, more
committed, and LTV is meaningfully higher than for single-channel customers.
Technology
Internet
April 10, 2013
page 18 of 49 , Jefferies Equity Research, [email protected] US Internet Team
Please see important disclosure information on pages 45 - 49 of this report.

Google While Google is known as the world’s leading search engine and one of the largest
players in online advertising, the company’s presence in eCommerce fulfillment should
not be surprising – shopping is one of its key advertising verticals.
Same-Day Delivery
Another one of the big players – Google – has been reportedly testing in private a same-
day delivery service in San Francisco since October 2012. The company just announced
last week the new service officially and opened it to a limited number of external testers
for a trial period of six months. Google Shopping Express, as the service is called, allows a
user to search for and purchase in-stock items from local retailers without leaving the
Google page. Then the user can select a delivery window and a Google courier delivers
the goods in one of the company-inscribed vans.
Exhibit 12: Google Shopping Express
Source: Google, Jefferies
The service, as it currently exists, will require Google to partner with local or national
retailers but it frees the company from investing in physical fulfillment centers. Current
Beta Testers of the service are given a free six-month membership for unlimited same-day
delivery with the following reputable brands and local retailers: American Eagle Outfitters,
Blue Bottle Coffee, Office Depot, Palo Alto Sport Shop & Toy World, Raley’s Nob Hill,
Staples, Target, Toys “R” Us / Babies “R” Us, and Walgreens. The company plans to add
more merchants over the next six months. Reportedly, participating retailers do pay
Google for the leads and, we believe, at rates that likely exceed traditional CPC given the
transaction is immediately consummated. While it is expected that users would be paying
for the service too, after the trial period, Google is still evaluating the economics and
pricing is not available; the company is supposedly considering either an annual fee ($64
or $69) or a per-delivery per-store shipping charge ($4.99). Note, it is still early and both
the implementation and pricing are likely to change.
Technology
Internet
April 10, 2013
page 19 of 49 , Jefferies Equity Research, [email protected] US Internet Team
Please see important disclosure information on pages 45 - 49 of this report.
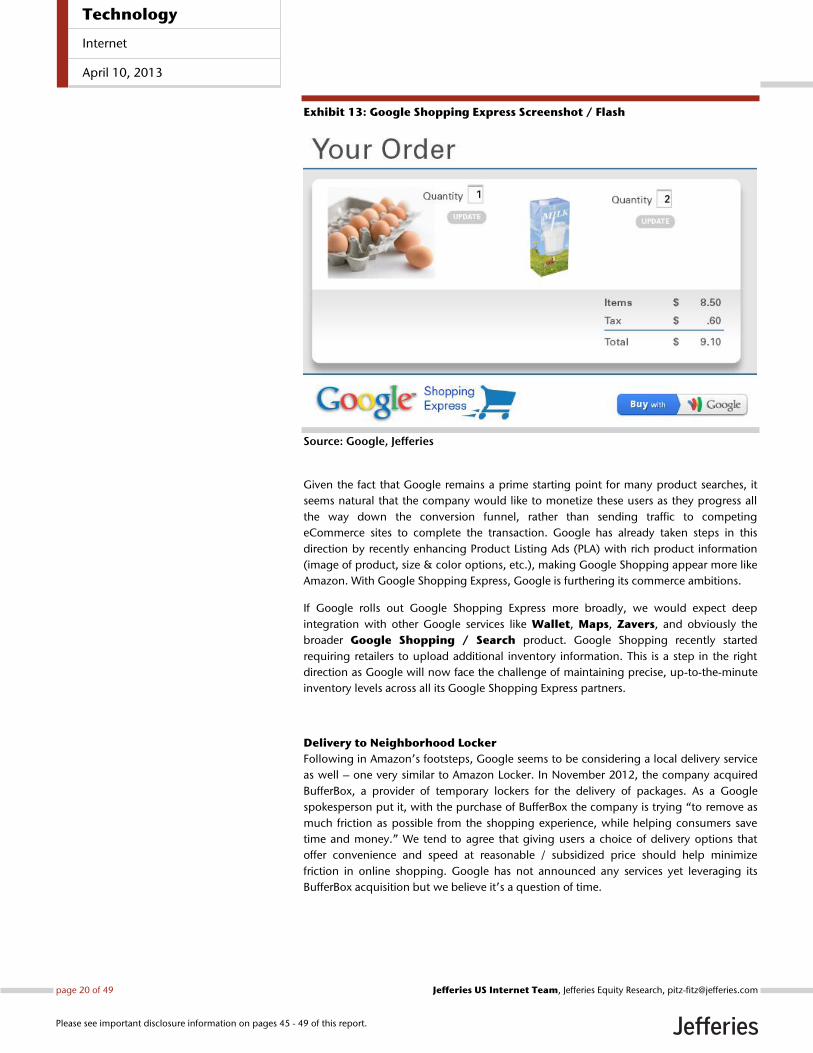
Exhibit 13: Google Shopping Express Screenshot / Flash
Source: Google, Jefferies
Given the fact that Google remains a prime starting point for many product searches, it
seems natural that the company would like to monetize these users as they progress all
the way down the conversion funnel, rather than sending traffic to competing
eCommerce sites to complete the transaction. Google has already taken steps in this
direction by recently enhancing Product Listing Ads (PLA) with rich product information
(image of product, size & color options, etc.), making Google Shopping appear more like
Amazon. With Google Shopping Express, Google is furthering its commerce ambitions.
If Google rolls out Google Shopping Express more broadly, we would expect deep
integration with other Google services like Wallet, Maps, Zavers, and obviously the
broader Google Shopping / Search product. Google Shopping recently started
requiring retailers to upload additional inventory information. This is a step in the right
direction as Google will now face the challenge of maintaining precise, up-to-the-minute
inventory levels across all its Google Shopping Express partners.
Delivery to Neighborhood Locker
Following in Amazon’s footsteps, Google seems to be considering a local delivery service
as well – one very similar to Amazon Locker. In November 2012, the company acquired
BufferBox, a provider of temporary lockers for the delivery of packages. As a Google
spokesperson put it, with the purchase of BufferBox the company is trying “to remove as
much friction as possible from the shopping experience, while helping consumers save
time and money.” We tend to agree that giving users a choice of delivery options that
offer convenience and speed at reasonable / subsidized price should help minimize
friction in online shopping. Google has not announced any services yet leveraging its
BufferBox acquisition but we believe it’s a question of time.
Technology
Internet
April 10, 2013
page 20 of 49 , Jefferies Equity Research, [email protected] US Internet Team
Please see important disclosure information on pages 45 - 49 of this report.

Exhibit 14: BufferBox Locker
Source: Google, Jefferies
Currently, BufferBox operates in Canada only and particularly in the Greater Toronto Area.
Pick-up stations are located at about 20 locations in GO Stations and 7-Eleven and Sobeys
stores. Users can register on the BufferBox website and receive a BufferBox Shipping
Address. At the check-out of any online retailer, they can enter that address for shipping
and get the goods deliver to a nearby BufferBox location. Once delivered, the user
receives a PIN that opens the door of the locker containing their package. Users have 72
hours (excluding Sundays and holidays) to pick up their packages. After that, packages
are removed to a warehouse and, if not requested for re-delivery within seven days,
shipped back to the sender. In cases when the BufferBox is full, the service holds the
package until space opens for delivery. Deliveries requiring signature or tax / duty
payment (COD) are accepted too. BufferBox signs for the parcel or covers any fees and
bills the user (including a 9% processing fee for the latter) before sending the PIN email.
Technology
Internet
April 10, 2013
page 21 of 49 , Jefferies Equity Research, [email protected] US Internet Team
Please see important disclosure information on pages 45 - 49 of this report.

Walmart On the other end of the spectrum, Walmart already has the storage capacity and ships
directly from its stores (just over 4,000 in the US). Its service, Walmart To Go, is available
in San Jose / San Francisco, Northern Virginia (outside Washington D.C.), Philadelphia,
Minneapolis, and Denver. The delivery fee varies by region and by day of the week / time
of day as does the minimum order size. Currently, a Californian can get a delivery for $6-9
(two-hour delivery slot) or $5 (four-hour delivery slot) on a minimum order of $45. The
categories eligible for this service include most grocery items, electronics & home office,
home & furniture, sports & fitness, and toys & video games.
Exhibit 15: Walmart To Go
Source: Walmart, Jefferies
Walmart To Go started in April 2010 in San Jose / San Francisco as a home delivery service
for online grocery purchases. In October 2012, the company began a test of same-day
delivery for the holiday season. Priced at $10 per order (regardless of number of items /
no minimum requirement), it was available in Minneapolis, Northern Virginia (outside
Washington D.C.), Philadelphia, and San Jose / San Francisco. Selection of goods was
specific to a user’s location (likely limited to items available in local stores) and included
approximately 5,000 items from the 1MM+ in Walmart’s online catalog. Customers could
place an order until 12pm local time and then choose a four-hour window (i.e., 4-8pm, 5-
9pm, 6-10pm) for delivery the same day. The company had not specified a particular end
date and currently it is not clear if the test is over or it has been extended into a
permanent offering.
Executives at Walmart have said that as it ramps digital online investments, it is serving
both high-income consumers as well as its in-store shoppers ($30-60K average annual
Technology
Internet
April 10, 2013
page 22 of 49 , Jefferies Equity Research, [email protected] US Internet Team
Please see important disclosure information on pages 45 - 49 of this report.

income). Interestingly, we note that the proportion of people who had shopped online in
the previous three months rose steadily from 62% among households with annual
household income <$25K to 84% among those with $100K+. And the company is quick
to highlight that its shoppers also purchase from its website, often on smartphones rather
than computers. Walmart expects its online sales to exceed $9B this year (<2% of total).
Walmart believes its ability to combine digital assets with local points of presence give it a
clear advantage as it could potentially use its 4,000+ US stores as warehouses to fulfill
online orders quickly. Walmart also announced that later this year it would begin testing
its own self-service lockers that customers can use to receive online orders (initial tests are
scheduled in roughly a dozen stores).
Jefferies Broadline & Hardline Retail Analyst Dan Binder believes that Walmart (and
eventually Target) may use their stores as fulfillment centers at some point. However, he
expects longer-term Walmart will have to charge a fee for same-day delivery, so the
market opportunity will probably be small. After all, Walmart’s customers aren’t exactly
Nordstrom’s customers where money is less of an issue. In addition to testing same-day
delivery in 4 cities, Walmart is already offering in-store pick-up for online orders.
Binder also believes that players like BestBuy are very unlikely to ever use Amazon for
fulfillment. He thinks that scale matters and Amazon’s offerings may work for small
businesses but for big businesses and especially for big competitors (such as BestBuy), it
doesn’t seem very logical. We do not agree entirely here as we believe that using Amazon
as a channel could work for branded products / retailers. While Amazon might compete
with 3P merchants that sell commoditized products, we don’t think it does for branded
ones. Thus brands / specialty retailers can benefit from being able to leverage Amazon’s
platform by offering limited / exclusive SKUs. Perhaps over time this would enable these
retailers to lower overhead and still maintain their brands.
Jefferies Specialty Retail team think that while many of the mature specialty retailers are
rationalizing square footage after being “over-stored” when the recession hit (and also
probably in some part due to a shift to online sales), further acceleration of store closures
is unlikely. Most of these retailers still view the store environment as a key marketing tool
for the brand and an important aspect of the user experience (i.e. as a venue for shoppers
to actually try on apparel and view apparel/accessories in person before buying). In
addition, most specialty retailers have begun making significant investments to improve
their in-house e-commerce platforms and make the brands more omni-channel.
We largely agree but believe that costs may outweigh the value longer term – especially
as the high value proposition of same-day delivery begins to take off among consumers
(who did not realize they “needed” it until they had it). Further, since specialty retailers
would not be able to provide such level of service, why wouldn’t they shift some
percentage of inventory to Amazon or eBay if they don’t compete with them?
Technology
Internet
April 10, 2013
page 23 of 49 , Jefferies Equity Research, [email protected] US Internet Team
Please see important disclosure information on pages 45 - 49 of this report.

Nordstrom Nordstrom is another national retailer that offers same-day delivery in select markets.
Launched in November 2011, the service is available every day of the week (including
Saturday and Sunday) and costs $15 per order. Orders placed by 1pm Pacific time are
delivered by 7pm the same day to addresses in over 100 zip codes in Seattle, WA,
Bellevue, WA, and La Jolla, CA.
Exhibit 16: Same-Day Delivery by Nordstrom
Source: Nordstrom, Jefferies
Technology
Internet
April 10, 2013
page 24 of 49 , Jefferies Equity Research, [email protected] US Internet Team
Please see important disclosure information on pages 45 - 49 of this report.
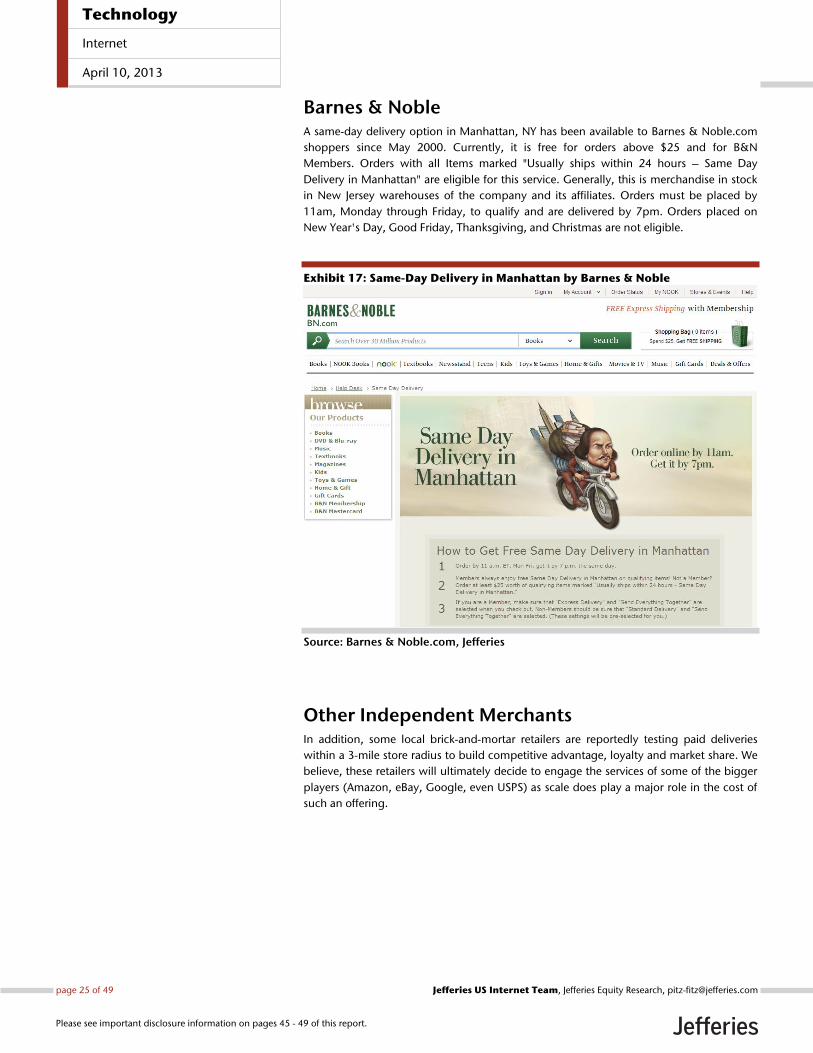
Barnes & Noble A same-day delivery option in Manhattan, NY has been available to Barnes & Noble.com
shoppers since May 2000. Currently, it is free for orders above $25 and for B&N
Members. Orders with all Items marked "Usually ships within 24 hours – Same Day
Delivery in Manhattan" are eligible for this service. Generally, this is merchandise in stock
in New Jersey warehouses of the company and its affiliates. Orders must be placed by
11am, Monday through Friday, to qualify and are delivered by 7pm. Orders placed on
New Year's Day, Good Friday, Thanksgiving, and Christmas are not eligible.
Exhibit 17: Same-Day Delivery in Manhattan by Barnes & Noble
Source: Barnes & Noble.com, Jefferies
Other Independent Merchants In addition, some local brick-and-mortar retailers are reportedly testing paid deliveries
within a 3-mile store radius to build competitive advantage, loyalty and market share. We
believe, these retailers will ultimately decide to engage the services of some of the bigger
players (Amazon, eBay, Google, even USPS) as scale does play a major role in the cost of
such an offering.
Technology
Internet
April 10, 2013
page 25 of 49 , Jefferies Equity Research, [email protected] US Internet Team
Please see important disclosure information on pages 45 - 49 of this report.

USPS The US Postal Service began a 1-year experiment in December 2012 for same-day delivery
of in-store and online purchases from participating retailers in San Francisco, CA. While in
beta, the USPS will work with a maximum of 10 retailers with at least 10 physical locations
nationally (one or more within defined major metro areas). Orders completed by 2pm get
picked up after 3pm and delivered between 4pm and 8pm the same day. While pricing is
up to the participating retailer, the regulatory filing for the service states that USPS will be
charging in excess of $2.90 per delivery / package. Only residential addresses are covered
in the test and there are some restrictions on weight and size but they are the same as for
other USPS services. Users can check delivery status through USPS’ Track and Confirm
tool. For returns, merchandise can be returned to the store or sent back with USPS (pick-
up can be scheduled online). According to the USPS website, the service would be
available eventually through its mobile app too. While the experiment started with a
single retailer (1-800-FLOWERS.COM), new ones were in late-stage negotiations as of
January 2013, according to a USPS spokesperson. If the test is successful, the service will
be expanded to other big metro areas such as Boston, Chicago, Los Angeles, and New
York.
Exhibit 18: Metro Post by USPS
Source: USPS, Jefferies
Technology
Internet
April 10, 2013
page 26 of 49 , Jefferies Equity Research, [email protected] US Internet Team
Please see important disclosure information on pages 45 - 49 of this report.

Postmates Get It Now is a one-hour delivery service available in San Francisco since May 2012 and in
Seattle since March 2013. Users, who have downloaded the iOS app, can place an order
between 8am and midnight every day of the week. The order gets assigned to the best
courier for the job seconds after being placed. Then the courier, called Postmate,
purchases the ordered goods on behalf of the user and delivers them to a drop-off
address. During this time, users can track their delivery from the app in real-time and can
contact the Postmate if a change is needed (e.g. add or cancel an item, change delivery
address, etc.). However, such changes get forwarded to HQ as they might require a fee
adjustment. The delivery fee, currently starting at $4.99, is determined dynamically by an
algorithm that accounts for the distance, time required and effort involved in the delivery.
Exhibit 19: Screenshots of Postmates’ Get It Now App
Source: App Annie, Jefferies
While Postmates (the company) is still managing the inventory of items that users can
order through the service (currently from ~4,000 different locations in San Francisco and
1,000+ in Seattle), it plans to offer a self-serve platform that will allow local businesses to
take control of their venue’s listings and update inventory themselves. In addition, users
can simply prepare a shopping list of items (if the merchant’s inventory is not listed in the
app) and the Postmate will purchase them. Technically, users can order from any retail
store or merchant in the city that accepts credit cards. Another feature in the app (a
nearby tab) allows users to browse stores close to their current location. It updates
dynamically and is powered by Foursquare.
Postmates has been running on-demand same-day deliveries in San Francisco and vicinity
since December 2011. It launched its one-hour delivery service Get It Now in closed beta
in March 2012 and officially in May 2012. The Seattle beta launch happened in February
2013 with the official launch in March. We believe the next city in the company’s
expansion plan is New York (based on its application form for prospective Postmates). The
delivery fee has declined over time to the current $4.99+ but it was $6.99+ when the
service first started. Postmates currently has nearly 200 couriers in San Francisco and just
over 40 in Seattle.
Technology
Internet
April 10, 2013
page 27 of 49 , Jefferies Equity Research, [email protected] US Internet Team
Please see important disclosure information on pages 45 - 49 of this report.

Exec Exec is an errand-running service, similar to TaskRabbit, which provides companies and
individuals access to on-demand personal assistants for delivery, furniture assembly, and
other errands. Once users post what they need, an in-house trained Exec gets assigned on
the task within 10 minutes. Users can track the progress of their errand and stay in touch
with the Exec through messages. The service gets everything done for $25/hour and is
available from 9am to 9pm. The company and its services are currently based in San
Francisco.
Exhibit 20: Exec Errands
Source: Exec, Jefferies
Technology
Internet
April 10, 2013
page 28 of 49 , Jefferies Equity Research, [email protected] US Internet Team
Please see important disclosure information on pages 45 - 49 of this report.

Instacart Instacart is a unique same-day delivery service, which focuses solely on same-day grocery
delivery from Trader Joe’s, Safeway and Whole Foods. Customers can shop directly from
their iPhones from 10am to 9pm every day. The company has a one-hour or a three-hour
promised delivery window for a flat $9.99 and $3.99, respectively. The service is currently
live in San Francisco, Palo Alto and Mountain View. The company has plans to expand
into other verticals.
Exhibit 21: Screenshots of Instacart App
Source: App Annie, Jefferies
Shutl Shutl is another start-up that provides same-day delivery in the Bay Area, with ambitions
to launch soon in New York City, Chicago, Miami, and several other metro areas in the
US. The company’s technology integrates with online retailers and connects them with a
network of local, same-day carriers, which purportedly provide faster, more flexible
delivery options than the traditional delivery providers such as UPS and FedEx.
Exhibit 22: Shutl
Source: Shutl, Jefferies
Technology
Internet
April 10, 2013
page 29 of 49 , Jefferies Equity Research, [email protected] US Internet Team
Please see important disclosure information on pages 45 - 49 of this report.

TaskRabbit TaskRabbit, one of the original errand outsourcing services, recently launched a Deliver
Now feature, where customers can have same-day delivery from any local business.
Deliver Now costs $10 and is currently only available in San Francisco, while TaskRabbit
itself is based in 9 metro areas. The feature allows regular users to solicit same-day
deliveries for orders from local businesses such as restaurants and stores that do not
themselves provide a delivery service.
Exhibit 23: Screenshots of TaskRabbit App
Source: App Annie, Jefferies
WunWun WunWun is a product / service similar to TaskRabbit and Exec with a twist. WunWun has
an on-demand network of Helpers. Once your request is received, a Helper is designated
to see it through. When a request requires a specialized provider, WunWun acts as a
personal concierge service. For deliveries, it’s a flat $15 fee and $2 for every 5 minutes of
other services. Currently, WunWun is in beta in New York City.
Exhibit 24: Screenshots of WunWun App
Source: App Annie, Jefferies
Technology
Internet
April 10, 2013
page 30 of 49 , Jefferies Equity Research, [email protected] US Internet Team
Please see important disclosure information on pages 45 - 49 of this report.
Potential Winners Whether same-day delivery will become prevalent over time or remain a high-touch add-
on service is not clear yet. Some recent studies reveal that free delivery and lower prices
are much more important to shoppers. According to a BCG survey, conducted in
November 2012, only 9% of participants cited same-day delivery as a top factor that
would improve their online shopping experience. Overwhelmingly more, 74% and 50%
cited free delivery and lower prices, respectively, as top factors. However, that same
survey showed that affluent millennials (18 to 34-year olds with household income in
excess of $150K) were willing to pay up to $10 for same-day delivery vs. up to $6 by
other consumers. The affluent millennial cohort is also spending online about 2 times
more than the average US consumer. Only time will show if millennials again will drive a
change in eCommerce fulfillment as they did with other aspects of everyday life already.
While it is not clear yet if consumers are actually ready to pay (and how much) for such
services, the competition in fulfillment is already on and major players are investing.
Which aspects of fulfillment (e.g. speed, flexibility, cost) will prove more important to
consumers could determine which of the existing offerings will survive and thrive.
We believe that the most compelling offerings, for now, come from Amazon, eBay and
Walmart as each dwells on a competitive strength. However, Amazon is currently the
undisputed leader as it appears to have perfected the logistics function and is likely to
start building new fulfillment centers closer to customers, now that it has signed tax
agreements with a host of states. We also think that the proceeds of its November 2012
debt offering of $3B will be used for fulfillment center build-out, to a large extent. eBay
seems to have solved the inventory / warehousing problem and built scale by partnering
with top national retailers while maintaining neutrality. It also has the most compelling
offering that helps retailers leverage their own brands and assets to evolve their multi-
channel strategies to seamlessly meet the increasing demands of the omni-channel
consumer. Its products enable retailers to address the full opportunity of the converging
online and offline markets. And finally, Walmart has already established a presence in all
key markets and needs only to master the “last mile” or partner with / acquire someone
with the logistics acumen.
We believe Google is another one to keep an eye on as it remains a prime starting point
for many product searches. The company has already taken steps to monetize these
better by enhancing its Product Listing Ads with rich product information (product image,
size & color options, etc.). If Google rolls out Google Shopping Express more broadly, we
would expect deep integration with its other services like Wallet, Maps, Zavers, and
obviously the broader Google Shopping / Search product.
Among the other players, we believe the ones that manage to remain retailer-neutral, to
offer the highest flexibility (accepting orders 24/7 at the extreme), and to remain
competitive on pricing without going bust, are the most likely to succeed. And we do
believe it is not a winner-take-all game. Smaller / local / niche players should be able to
find a place on the table among the bigger players too.
Technology
Internet
April 10, 2013
page 31 of 49 , Jefferies Equity Research, [email protected] US Internet Team
Please see important disclosure information on pages 45 - 49 of this report.
Appendix
A. Jefferies US eCommerce Model
B. Amazon Model
C. eBay Model
D. Google Model
Technology
Internet
April 10, 2013
page 32 of 49 , Jefferies Equity Research, [email protected] US Internet Team
Please see important disclosure information on pages 45 - 49 of this report.

A. Jefferies US eCommerce Model
Exhibit 25: Jefferies US eCommerce Model ($ in Millions)
Source: US Department of Commerce, comScore, Jefferies
F2012 F2013
Q1 12A Q2 12A Q3 12A Q4 12A Q1 13E Q2 13E Q3 13E Q4 13E 2011A 2012A 2013E
Total US Retail Sales* $1,080,064 $1,076,950 $1,091,897 $1,106,823 $1,121,106 $1,118,951 $1,137,757 $1,152,147 $4,157,173 $4,355,734 $4,529,962
% Y/Y Growth 6.2% 4.3% 4.6% 4.0% 3.8% 3.9% 4.2% 4.1% 8.3% 4.8% 4.0%
Total US Retail eCommerce Sales* $53,091 $54,936 $57,034 $59,545 $60,490 $61,554 $63,753 $65,913 $193,722 $224,606 $251,710
% Y/Y Growth 15.3% 15.5% 17.4% 15.6% 13.9% 12.0% 11.8% 10.7% 15.1% 15.9% 12.1%
eCommerce Penetration - % of Retail 4.9% 5.1% 5.2% 5.4% 5.4% 5.5% 5.6% 5.7% 4.7% 5.2% 5.6%
Y/Y Penetration Increases (bps) 0.38% 0.49% 0.57% 0.54% 0.48% 0.40% 0.38% 0.34% 0.28% 0.50% 0.40%
Online Travel** $25,614 $28,023 $26,292 $23,021 $27,893 $30,630 $28,659 $25,035 $94,485 $102,951 $112,216
% Y/Y Growth 10.3% 8.7% 8.9% 7.8% 8.9% 9.3% 9.0% 8.7% 11.0% 9.0% 9.0%
eBay US Auctions GMV $2,968 $2,883 $2,809 $2,890 $3,043 $3,048 $3,114 $3,295 $11,556 $11,524 $12,497
% Fixed Price vs. Auction Format 61.0% 62.0% 64.0% 66.0% 65.0% 65.5% 66.0% 67.4% 59.3% 63.4% 66.0%
% Y/Y Growth -1.4% -1.8% 0.2% 2.8% 2.5% 5.7% 10.8% 14.0% 1.2% -0.3% 8.4%
US eCommerce Sales (Adjusted) $81,673 $85,842 $86,136 $85,456 $91,426 $95,232 $95,526 $94,242 $299,763 $339,081 $376,423
% Y/Y Growth 13.0% 12.5% 14.0% 12.9% 11.9% 10.9% 10.9% 10.3% 13.1% 13.1% 11.0%
eCommerce Penetration (Adj) - % of Retail 7.4% 7.7% 7.7% 7.5% 7.9% 8.3% 8.2% 8.0% 7.0% 7.6% 8.1%
Y/Y Penetration Increase 0.43% 0.56% 0.63% 0.59% 0.57% 0.51% 0.48% 0.44% 0.30% 0.55% 0.50%
*US Department of Commerce; Does not include auctions, travel, financial services, or event ticket sales -- http://www.census.gov/mrts/www/ecomm.html
**comScore
Technology
Internet
April 10, 2013
page 33 of 49 , Jefferies Equity Research, [email protected] US Internet Team
Please see important disclosure information on pages 45 - 49 of this report.

B. Amazon Model
Exhibit 26: Amazon - Income Statement ($000s)
Source: Company data, Jefferies estimates
Q1 12A Q2 12A Q3 12A Q4 12A Q1 13E Q2 13E Q3 13E Q4 13E F2012A F2013E F2014E
Net Revenue $13,185,000 $12,834,000 $13,806,000 $21,268,000 $16,271,675 $16,006,550 $17,351,585 $27,103,649 $61,093,000 $76,733,459 $96,334,698
North America Net Revenue 7,427,000 7,326,000 7,884,000 12,175,000 9,171,631 9,166,226 9,959,790 15,704,269 34,812,000 44,001,916 55,616,677
International Net Revenue 5,758,000 5,508,000 5,922,000 9,093,000 7,100,044 6,840,324 7,391,795 11,399,380 26,281,000 32,731,543 40,718,021
% Y/Y Growth 34% 29% 27% 22% 23% 25% 26% 27% 27% 26% 26%
% Q/Q Growth (24) (3) 8 54 (23) (2) 8 56 -- -- --
Cost of Net Revenue 10,027,000 9,488,000 10,319,000 16,136,000 12,182,149 11,671,457 12,786,070 20,316,006 45,970,000 56,955,683 71,037,101
Total Gross Profit $3,158,000 $3,346,000 $3,487,000 $5,132,000 $4,089,526 $4,335,093 $4,565,514 $6,787,643 $15,123,000 $19,777,776 $25,297,597
% Margin 24.0% 26.1% 25.3% 24.1% 25.1% 27.1% 26.3% 25.0% 24.8% 25.8% 26.3%
Fulfillment 1,258,000 1,298,000 1,454,000 2,196,000 1,643,626 1,674,887 1,830,879 2,803,973 6,206,000 7,953,365 10,033,186
Marketing 468,000 521,000 524,000 833,000 678,446 701,012 672,452 1,075,116 2,346,000 3,127,025 3,973,978
Technology & Content 860,000 970,000 1,080,000 1,221,000 1,128,000 1,278,000 1,413,000 1,578,000 4,131,000 5,397,000 6,297,000
General & Administrative 174,000 197,000 197,000 204,000 222,000 254,000 260,000 268,000 772,000 1,004,000 1,224,000
GAAP Operating Income / (Loss) incl Stock Comp & Amort. of Intangibles192,000 107,000 (28,000) 405,000 142,255 77,374 56,233 716,054 676,000 991,917 2,183,096
% Margin 1.5% 0.8% (0.2%) 1.9% 0.9% 0.5% 0.3% 2.6% 1.1% 1.3% 2.3%
% Y/Y Growth (40) (47) (135) 56 (26) (28) -- 77 (22) 47 120
% Q/Q Growth (26) (44) (126) -- (65) (46) (27) 1,173 -- -- --
EBITDA $855,000 $845,000 $786,000 $1,340,000 $1,079,217 $1,067,880 $1,024,144 $1,694,852 $3,826,000 $4,866,092 $6,582,224
% Margin 6.5% 6.6% 5.7% 6.3% 6.6% 6.7% 5.9% 6.3% 6.3% 6.3% 6.8%
% Y/Y Growth 28 34 46 63 26 26 30 26 44 27 35
% Q/Q Growth 4 (1) (7) 70 (19) (1) (4) 65 -- -- --
Net Interest (Income) and Other (Income) 108,000 (39,000) (6,000) 68,000 60,477 (26,644) (8,005) 49,226 131,000 75,055 36,887
Adjusted Pre-Tax Profit / (Loss) $290,000 $399,000 $238,000 $610,000 $356,978 $453,838 $397,188 $1,013,328 $1,537,000 $2,221,332 $3,732,546
% Effective Tax Rate 33% 43% 62% 43% 30.7% 36.5% 30.7% 44.7% 44% 38% 36%
Provision / (Benefit) for Income Taxes 43,000 109,000 83,000 194,000 40,889 78,013 38,543 366,755 429,000 524,201 944,332
Tax Adjustments for Non-GAAP Items 51,500 63,250 65,000 68,250 68,800 87,455 83,238 86,625 248,000 326,118 396,584
Minority Interest (89,000) 30,000 169,000 46,000 35,000 35,000 35,000 35,000 156,000 140,000 126,000
Operating Net Income / (Loss) $284,500 $196,750 ($79,000) $301,750 $212,289 $253,369 $240,408 $524,947 $704,000 $1,231,014 $2,265,630
% Margin 2.2% 1.5% (0.6%) 1.4% 1.3% 1.6% 1.4% 1.9% 1.2% 1.6% 2.4%
% Y/Y Growth (8) (40) (140) (8) (25) 29 -- 74 (40) 75 84
% Q/Q Growth (13) (31) (140) -- (30) 19 (5) 118 -- -- --
Other Operating Expense/Amortization of Intangibles 46,000 32,000 43,000 38,000 40,000 36,000 40,000 41,000 159,000 157,000 152,000
Stock-Based Compensation 160,000 221,000 217,000 235,000 235,200 313,820 292,950 305,500 833,000 1,147,470 1,434,338
Tax Effect of Non-GAAP Entries (51,500) (63,250) (65,000) (68,250) (68,800) (87,455) (83,238) (86,625) (248,000) (326,118) (396,584)
Reported GAAP Net Income / (Loss) $130,000 $7,000 ($274,000) $97,000 $5,889 ($8,996) ($9,305) $265,072 ($40,000) $252,661 $1,075,877
% Margin 1.0% 0.1% (2.0%) 0.5% 0.0% (0.1%) (0.1%) 1.0% (0.1%) 0.3% 1.1%
% Y/Y Growth (35) (96) (535) (45) (95) (229) -- 173 (106) -- 326
% Q/Q Growth (27) (95) (4,014) -- (94) (253) -- -- -- -- --
Weighted Avg. Diluted Shares Outstanding 460,000 458,000 460,000 461,000 462,613 462,659 462,781 463,092 453,000 462,786 462,344
Operating EPS $0.62 $0.43 ($0.17) $0.65 $0.46 $0.55 $0.52 $1.13 $1.55 $2.66 $4.90
% Y/Y Growth (8%) (40%) (140%) (8%) (26%) 27% -- 73% (39%) 71% 84%
% Q/Q Growth (13) (31) (140) -- (30) 19 (5) 118 -- -- --
Reported GAAP EPS $0.28 $0.02 ($0.60) $0.21 $0.01 ($0.02) ($0.02) $0.57 ($0.09) $0.55 $2.33
% Y/Y Growth (35%) (96%) (536%) (45%) (95%) (227%) -- 172% (106%) -- 326%
% Q/Q Growth (26) (95) (3,997) -- (94) (253) -- -- -- -- --
F2012 F2013
Technology
Internet
April 10, 2013
page 34 of 49 , Jefferies Equity Research, [email protected] US Internet Team
Please see important disclosure information on pages 45 - 49 of this report.
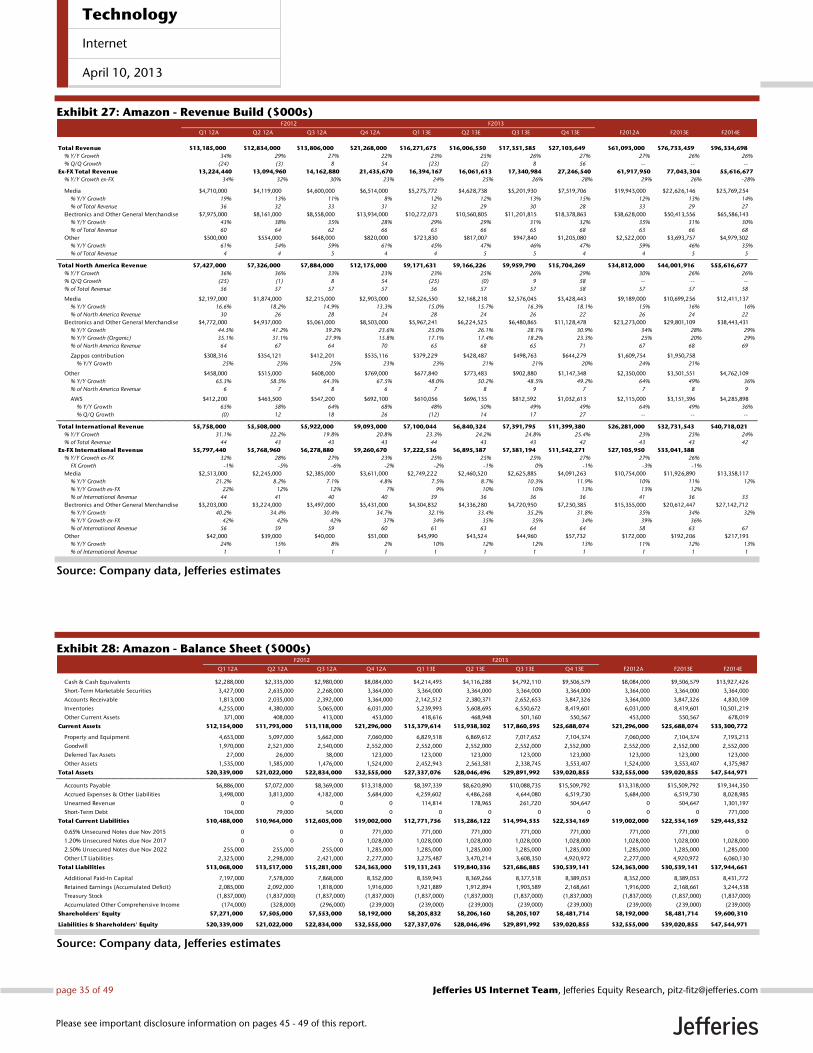
Exhibit 27: Amazon - Revenue Build ($000s)
Source: Company data, Jefferies estimates
Exhibit 28: Amazon - Balance Sheet ($000s)
Source: Company data, Jefferies estimates
Q1 12A Q2 12A Q3 12A Q4 12A Q1 13E Q2 13E Q3 13E Q4 13E F2012A F2013E F2014E
Total Revenue $13,185,000 $12,834,000 $13,806,000 $21,268,000 $16,271,675 $16,006,550 $17,351,585 $27,103,649 $61,093,000 $76,733,459 $96,334,698
% Y/Y Growth 34% 29% 27% 22% 23% 25% 26% 27% 27% 26% 26%
% Q/Q Growth (24) (3) 8 54 (23) (2) 8 56 -- -- --
Ex-FX Total Revenue 13,224,440 13,094,960 14,162,880 21,435,670 16,394,167 16,061,613 17,340,984 27,246,540 61,917,950 77,043,304 55,616,677
% Y/Y Growth ex-FX 34% 32% 30% 23% 24% 25% 26% 28% 29% 26% -28%
Media $4,710,000 $4,119,000 $4,600,000 $6,514,000 $5,275,772 $4,628,738 $5,201,930 $7,519,706 $19,943,000 $22,626,146 $25,769,254
% Y/Y Growth 19% 13% 11% 8% 12% 12% 13% 15% 12% 13% 14%
% of Total Revenue 36 32 33 31 32 29 30 28 33 29 27
Electronics and Other General Merchandise $7,975,000 $8,161,000 $8,558,000 $13,934,000 $10,272,073 $10,560,805 $11,201,815 $18,378,863 $38,628,000 $50,413,556 $65,586,143
% Y/Y Growth 43% 38% 35% 28% 29% 29% 31% 32% 35% 31% 30%
% of Total Revenue 60 64 62 66 63 66 65 68 63 66 68
Other $500,000 $554,000 $648,000 $820,000 $723,830 $817,007 $947,840 $1,205,080 $2,522,000 $3,693,757 $4,979,302
% Y/Y Growth 61% 54% 59% 61% 45% 47% 46% 47% 59% 46% 35%
% of Total Revenue 4 4 5 4 4 5 5 4 4 5 5
Total North America Revenue $7,427,000 $7,326,000 $7,884,000 $12,175,000 $9,171,631 $9,166,226 $9,959,790 $15,704,269 $34,812,000 $44,001,916 $55,616,677
% Y/Y Growth 36% 36% 33% 23% 23% 25% 26% 29% 30% 26% 26%
% Q/Q Growth (25) (1) 8 54 (25) (0) 9 58 -- -- --
% of Total Revenue 56 57 57 57 56 57 57 58 57 57 58
Media $2,197,000 $1,874,000 $2,215,000 $2,903,000 $2,526,550 $2,168,218 $2,576,045 $3,428,443 $9,189,000 $10,699,256 $12,411,137
% Y/Y Growth 16.6% 18.2% 14.9% 13.3% 15.0% 15.7% 16.3% 18.1% 15% 16% 16%
% of North America Revenue 30 26 28 24 28 24 26 22 26 24 22
Electronics and Other General Merchandise $4,772,000 $4,937,000 $5,061,000 $8,503,000 $5,967,241 $6,224,525 $6,480,865 $11,128,478 $23,273,000 $29,801,109 $38,443,431
% Y/Y Growth 44.5% 41.2% 39.2% 23.6% 25.0% 26.1% 28.1% 30.9% 34% 28% 29%
% Y/Y Growth (Organic) 35.1% 31.1% 27.9% 15.8% 17.1% 17.4% 18.2% 23.3% 25% 20% 29%
% of North America Revenue 64 67 64 70 65 68 65 71 67 68 69
Zappos contribution $308,316 $354,121 $412,201 $535,116 $379,229 $428,487 $498,763 $644,279 $1,609,754 $1,950,758
% Y/Y Growth 25% 25% 25% 23% 23% 21% 21% 20% 24% 21%
Other $458,000 $515,000 $608,000 $769,000 $677,840 $773,483 $902,880 $1,147,348 $2,350,000 $3,501,551 $4,762,109
% Y/Y Growth 65.3% 58.5% 64.3% 67.5% 48.0% 50.2% 48.5% 49.2% 64% 49% 36%
% of North America Revenue 6 7 8 6 7 8 9 7 7 8 9
AWS $412,200 $463,500 $547,200 $692,100 $610,056 $696,135 $812,592 $1,032,613 $2,115,000 $3,151,396 $4,285,898
% Y/Y Growth 65% 58% 64% 68% 48% 50% 49% 49% 64% 49% 36%
% Q/Q Growth (0) 12 18 26 (12) 14 17 27 -- -- --
Total International Revenue $5,758,000 $5,508,000 $5,922,000 $9,093,000 $7,100,044 $6,840,324 $7,391,795 $11,399,380 $26,281,000 $32,731,543 $40,718,021
% Y/Y Growth 31.1% 22.2% 19.8% 20.8% 23.3% 24.2% 24.8% 25.4% 23% 25% 24%
% of Total Revenue 44 43 43 43 44 43 43 42 43 43 42
Ex-FX International Revenue $5,797,440 $5,768,960 $6,278,880 $9,260,670 $7,222,536 $6,895,387 $7,381,194 $11,542,271 $27,105,950 $33,041,388
% Y/Y Growth ex-FX 32% 28% 27% 23% 25% 25% 25% 27% 27% 26%
FX Growth -1% -5% -6% -2% -2% -1% 0% -1% -3% -1%
Media $2,513,000 $2,245,000 $2,385,000 $3,611,000 $2,749,222 $2,460,520 $2,625,885 $4,091,263 $10,754,000 $11,926,890 $13,358,117
% Y/Y Growth 21.2% 8.2% 7.1% 4.8% 7.5% 8.7% 10.3% 11.9% 10% 11% 12%
% Y/Y Growth ex-FX 22% 12% 12% 7% 9% 10% 10% 13% 13% 12%
% of International Revenue 44 41 40 40 39 36 36 36 41 36 33
Electronics and Other General Merchandise $3,203,000 $3,224,000 $3,497,000 $5,431,000 $4,304,832 $4,336,280 $4,720,950 $7,250,385 $15,355,000 $20,612,447 $27,142,712
% Y/Y Growth 40.2% 34.4% 30.4% 34.7% 32.1% 33.4% 35.2% 31.8% 35% 34% 32%
% Y/Y Growth ex-FX 42% 42% 42% 37% 34% 35% 35% 34% 39% 36%
% of International Revenue 56 59 59 60 61 63 64 64 58 63 67
Other $42,000 $39,000 $40,000 $51,000 $45,990 $43,524 $44,960 $57,732 $172,000 $192,206 $217,193
% Y/Y Growth 24% 15% 8% 2% 10% 12% 12% 13% 11% 12% 13%
% of International Revenue 1 1 1 1 1 1 1 1 1 1 1
F2012 F2013
Q1 12A Q2 12A Q3 12A Q4 12A Q1 13E Q2 13E Q3 13E Q4 13E F2012A F2013E F2014E
Cash & Cash Equivalents $2,288,000 $2,335,000 $2,980,000 $8,084,000 $4,214,493 $4,116,288 $4,792,110 $9,506,579 $8,084,000 $9,506,579 $13,927,426
Short-Term Marketable Securities 3,427,000 2,635,000 2,268,000 3,364,000 3,364,000 3,364,000 3,364,000 3,364,000 3,364,000 3,364,000 3,364,000
Accounts Receivable 1,813,000 2,035,000 2,392,000 3,364,000 2,142,512 2,380,371 2,652,653 3,847,326 3,364,000 3,847,326 4,830,109
Inventories 4,255,000 4,380,000 5,065,000 6,031,000 5,239,993 5,608,695 6,550,672 8,419,601 6,031,000 8,419,601 10,501,219
Other Current Assets 371,000 408,000 413,000 453,000 418,616 468,948 501,160 550,567 453,000 550,567 678,019
Current Assets $12,154,000 $11,793,000 $13,118,000 $21,296,000 $15,379,614 $15,938,302 $17,860,595 $25,688,074 $21,296,000 $25,688,074 $33,300,772
Property and Equipment 4,653,000 5,097,000 5,662,000 7,060,000 6,829,518 6,869,612 7,017,652 7,104,374 7,060,000 7,104,374 7,193,213
Goodwill 1,970,000 2,521,000 2,540,000 2,552,000 2,552,000 2,552,000 2,552,000 2,552,000 2,552,000 2,552,000 2,552,000
Deferred Tax Assets 27,000 26,000 38,000 123,000 123,000 123,000 123,000 123,000 123,000 123,000 123,000
Other Assets 1,535,000 1,585,000 1,476,000 1,524,000 2,452,943 2,563,581 2,338,745 3,553,407 1,524,000 3,553,407 4,375,987
Total Assets $20,339,000 $21,022,000 $22,834,000 $32,555,000 $27,337,076 $28,046,496 $29,891,992 $39,020,855 $32,555,000 $39,020,855 $47,544,971
Accounts Payable $6,886,000 $7,072,000 $8,369,000 $13,318,000 $8,397,339 $8,620,890 $10,088,735 $15,509,792 $13,318,000 $15,509,792 $19,344,350
Accrued Expenses & Other Liabilities 3,498,000 3,813,000 4,182,000 5,684,000 4,259,602 4,486,268 4,644,080 6,519,730 5,684,000 6,519,730 8,028,985
Unearned Revenue 0 0 0 0 114,814 178,965 261,720 504,647 0 504,647 1,301,197
Short-Term Debt 104,000 79,000 54,000 0 0 0 0 0 0 0 771,000
Total Current Liabilities $10,488,000 $10,964,000 $12,605,000 $19,002,000 $12,771,756 $13,286,122 $14,994,535 $22,534,169 $19,002,000 $22,534,169 $29,445,532
0.65% Unsecured Notes due Nov 2015 0 0 0 771,000 771,000 771,000 771,000 771,000 771,000 771,000 0
1.20% Unsecured Notes due Nov 2017 0 0 0 1,028,000 1,028,000 1,028,000 1,028,000 1,028,000 1,028,000 1,028,000 1,028,000
2.50% Unsecured Notes due Nov 2022 255,000 255,000 255,000 1,285,000 1,285,000 1,285,000 1,285,000 1,285,000 1,285,000 1,285,000 1,285,000
Other LT Liabilities 2,325,000 2,298,000 2,421,000 2,277,000 3,275,487 3,470,214 3,608,350 4,920,972 2,277,000 4,920,972 6,060,130
Total Liabilities $13,068,000 $13,517,000 $15,281,000 $24,363,000 $19,131,243 $19,840,336 $21,686,885 $30,539,141 $24,363,000 $30,539,141 $37,944,661
Additional Paid-In Capital 7,197,000 7,578,000 7,868,000 8,352,000 8,359,943 8,369,266 8,377,518 8,389,053 8,352,000 8,389,053 8,431,772
Retained Earnings (Accumulated Deficit) 2,085,000 2,092,000 1,818,000 1,916,000 1,921,889 1,912,894 1,903,589 2,168,661 1,916,000 2,168,661 3,244,538
Treasury Stock (1,837,000) (1,837,000) (1,837,000) (1,837,000) (1,837,000) (1,837,000) (1,837,000) (1,837,000) (1,837,000) (1,837,000) (1,837,000)
Accumulated Other Comprehensive Income (174,000) (328,000) (296,000) (239,000) (239,000) (239,000) (239,000) (239,000) (239,000) (239,000) (239,000)
Shareholders' Equity $7,271,000 $7,505,000 $7,553,000 $8,192,000 $8,205,832 $8,206,160 $8,205,107 $8,481,714 $8,192,000 $8,481,714 $9,600,310
Liabilities & Shareholders' Equity $20,339,000 $21,022,000 $22,834,000 $32,555,000 $27,337,076 $28,046,496 $29,891,992 $39,020,855 $32,555,000 $39,020,855 $47,544,971
F2012 F2013
Technology
Internet
April 10, 2013
page 35 of 49 , Jefferies Equity Research, [email protected] US Internet Team
Please see important disclosure information on pages 45 - 49 of this report.
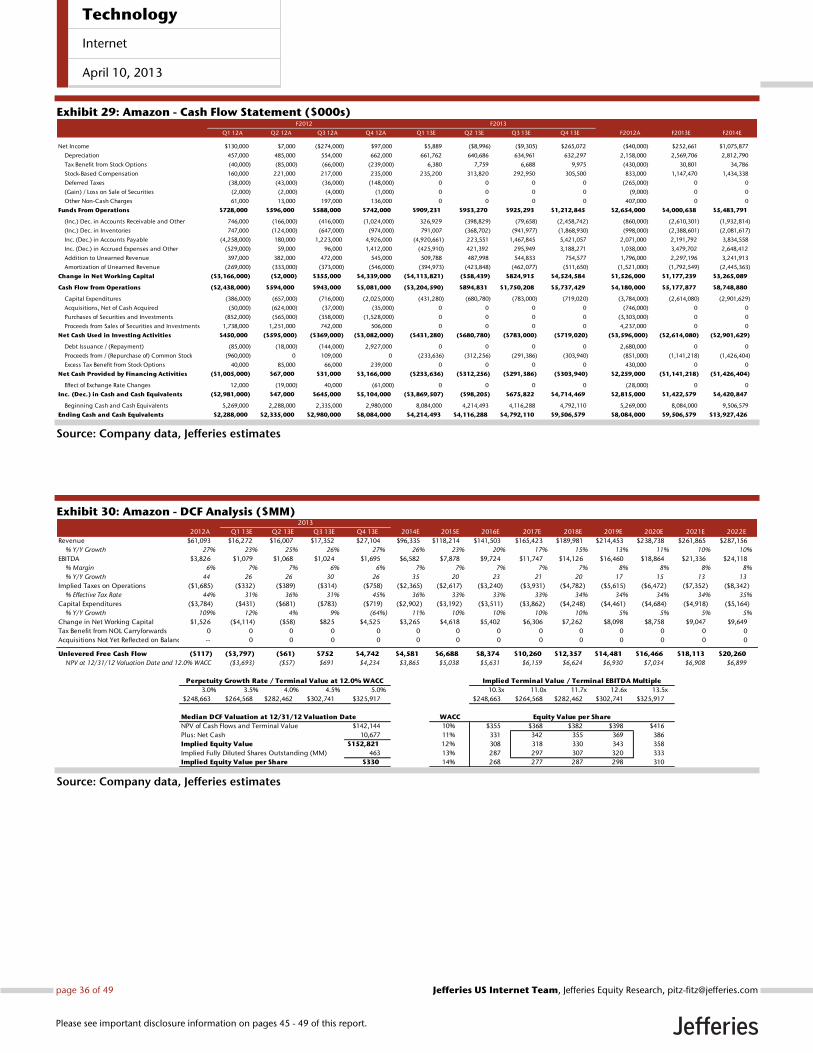
Exhibit 29: Amazon - Cash Flow Statement ($000s)
Source: Company data, Jefferies estimates
Exhibit 30: Amazon - DCF Analysis ($MM)
Source: Company data, Jefferies estimates
Q1 12A Q2 12A Q3 12A Q4 12A Q1 13E Q2 13E Q3 13E Q4 13E F2012A F2013E F2014E
Net Income $130,000 $7,000 ($274,000) $97,000 $5,889 ($8,996) ($9,305) $265,072 ($40,000) $252,661 $1,075,877
Depreciation 457,000 485,000 554,000 662,000 661,762 640,686 634,961 632,297 2,158,000 2,569,706 2,812,790
Tax Benefit from Stock Options (40,000) (85,000) (66,000) (239,000) 6,380 7,759 6,688 9,975 (430,000) 30,801 34,786
Stock-Based Compensation 160,000 221,000 217,000 235,000 235,200 313,820 292,950 305,500 833,000 1,147,470 1,434,338
Deferred Taxes (38,000) (43,000) (36,000) (148,000) 0 0 0 0 (265,000) 0 0
(Gain) / Loss on Sale of Securities (2,000) (2,000) (4,000) (1,000) 0 0 0 0 (9,000) 0 0
Other Non-Cash Charges 61,000 13,000 197,000 136,000 0 0 0 0 407,000 0 0
Funds From Operations $728,000 $596,000 $588,000 $742,000 $909,231 $953,270 $925,293 $1,212,845 $2,654,000 $4,000,638 $5,483,791
(Inc.) Dec. in Accounts Receivable and Other 746,000 (166,000) (416,000) (1,024,000) 326,929 (398,829) (79,658) (2,458,742) (860,000) (2,610,301) (1,932,814)
(Inc.) Dec. in Inventories 747,000 (124,000) (647,000) (974,000) 791,007 (368,702) (941,977) (1,868,930) (998,000) (2,388,601) (2,081,617)
Inc. (Dec.) in Accounts Payable (4,258,000) 180,000 1,223,000 4,926,000 (4,920,661) 223,551 1,467,845 5,421,057 2,071,000 2,191,792 3,834,558
Inc. (Dec.) in Accrued Expenses and Other (529,000) 59,000 96,000 1,412,000 (425,910) 421,392 295,949 3,188,271 1,038,000 3,479,702 2,648,412
Addition to Unearned Revenue 397,000 382,000 472,000 545,000 509,788 487,998 544,833 754,577 1,796,000 2,297,196 3,241,913
Amortization of Unearned Revenue (269,000) (333,000) (373,000) (546,000) (394,973) (423,848) (462,077) (511,650) (1,521,000) (1,792,549) (2,445,363)
Change in Net Working Capital ($3,166,000) ($2,000) $355,000 $4,339,000 ($4,113,821) ($58,439) $824,915 $4,524,584 $1,526,000 $1,177,239 $3,265,089
Cash Flow from Operations ($2,438,000) $594,000 $943,000 $5,081,000 ($3,204,590) $894,831 $1,750,208 $5,737,429 $4,180,000 $5,177,877 $8,748,880
Capital Expenditures (386,000) (657,000) (716,000) (2,025,000) (431,280) (680,780) (783,000) (719,020) (3,784,000) (2,614,080) (2,901,629)
Acquisitions, Net of Cash Acquired (50,000) (624,000) (37,000) (35,000) 0 0 0 0 (746,000) 0 0
Purchases of Securities and Investments (852,000) (565,000) (358,000) (1,528,000) 0 0 0 0 (3,303,000) 0 0
Proceeds from Sales of Securities and Investments 1,738,000 1,251,000 742,000 506,000 0 0 0 0 4,237,000 0 0
Net Cash Used in Investing Activities $450,000 ($595,000) ($369,000) ($3,082,000) ($431,280) ($680,780) ($783,000) ($719,020) ($3,596,000) ($2,614,080) ($2,901,629)
Debt Issuance / (Repayment) (85,000) (18,000) (144,000) 2,927,000 0 0 0 0 2,680,000 0 0
Proceeds from / (Repurchase of) Common Stock (960,000) 0 109,000 0 (233,636) (312,256) (291,386) (303,940) (851,000) (1,141,218) (1,426,404)
Excess Tax Benefit from Stock Options 40,000 85,000 66,000 239,000 0 0 0 0 430,000 0 0
Net Cash Provided by Financing Activities ($1,005,000) $67,000 $31,000 $3,166,000 ($233,636) ($312,256) ($291,386) ($303,940) $2,259,000 ($1,141,218) ($1,426,404)
Effect of Exchange Rate Changes 12,000 (19,000) 40,000 (61,000) 0 0 0 0 (28,000) 0 0
Inc. (Dec.) in Cash and Cash Equivalents ($2,981,000) $47,000 $645,000 $5,104,000 ($3,869,507) ($98,205) $675,822 $4,714,469 $2,815,000 $1,422,579 $4,420,847
Beginning Cash and Cash Equivalents 5,269,000 2,288,000 2,335,000 2,980,000 8,084,000 4,214,493 4,116,288 4,792,110 5,269,000 8,084,000 9,506,579
Ending Cash and Cash Equivalents $2,288,000 $2,335,000 $2,980,000 $8,084,000 $4,214,493 $4,116,288 $4,792,110 $9,506,579 $8,084,000 $9,506,579 $13,927,426
F2012 F2013
2013
2012A Q1 13E Q2 13E Q3 13E Q4 13E 2014E 2015E 2016E 2017E 2018E 2019E 2020E 2021E 2022E
Revenue $61,093 $16,272 $16,007 $17,352 $27,104 $96,335 $118,214 $141,503 $165,423 $189,981 $214,453 $238,738 $261,865 $287,156
% Y/Y Growth 27% 23% 25% 26% 27% 26% 23% 20% 17% 15% 13% 11% 10% 10%
EBITDA $3,826 $1,079 $1,068 $1,024 $1,695 $6,582 $7,878 $9,724 $11,747 $14,126 $16,460 $18,864 $21,336 $24,118
% Margin 6% 7% 7% 6% 6% 7% 7% 7% 7% 7% 8% 8% 8% 8%
% Y/Y Growth 44 26 26 30 26 35 20 23 21 20 17 15 13 13
Implied Taxes on Operations ($1,685) ($332) ($389) ($314) ($758) ($2,365) ($2,617) ($3,240) ($3,931) ($4,782) ($5,615) ($6,472) ($7,352) ($8,342)
% Effective Tax Rate 44% 31% 36% 31% 45% 36% 33% 33% 33% 34% 34% 34% 34% 35%
Capital Expenditures ($3,784) ($431) ($681) ($783) ($719) ($2,902) ($3,192) ($3,511) ($3,862) ($4,248) ($4,461) ($4,684) ($4,918) ($5,164)
% Y/Y Growth 109% 12% 4% 9% (64%) 11% 10% 10% 10% 10% 5% 5% 5% 5%
Change in Net Working Capital $1,526 ($4,114) ($58) $825 $4,525 $3,265 $4,618 $5,402 $6,306 $7,262 $8,098 $8,758 $9,047 $9,649
Tax Benefit from NOL Carryforwards 0 0 0 0 0 0 0 0 0 0 0 0 0 0
Acquisitions Not Yet Reflected on Balance Sheet -- 0 0 0 0 0 0 0 0 0 0 0 0 0
Unlevered Free Cash Flow ($117) ($3,797) ($61) $752 $4,742 $4,581 $6,688 $8,374 $10,260 $12,357 $14,481 $16,466 $18,113 $20,260
NPV at 12/31/12 Valuation Date and 12.0% WACC ($3,693) ($57) $691 $4,234 $3,865 $5,038 $5,631 $6,159 $6,624 $6,930 $7,034 $6,908 $6,899
Perpetuity Growth Rate / Terminal Value at 12.0% WACC Implied Terminal Value / Terminal EBITDA Multiple
3.0% 3.5% 4.0% 4.5% 5.0% 10.3x 11.0x 11.7x 12.6x 13.5x
$248,663 $264,568 $282,462 $302,741 $325,917 $248,663 $264,568 $282,462 $302,741 $325,917
Median DCF Valuation at 12/31/12 Valuation Date WACC Equity Value per Share
NPV of Cash Flows and Terminal Value $142,144 10% $355 $368 $382 $398 $416
Plus: Net Cash 10,677 11% 331 342 355 369 386
Implied Equity Value $152,821 12% 308 318 330 343 358
Implied Fully Diluted Shares Outstanding (MM) 463 13% 287 297 307 320 333
Implied Equity Value per Share $330 14% 268 277 287 298 310
Technology
Internet
April 10, 2013
page 36 of 49 , Jefferies Equity Research, [email protected] US Internet Team
Please see important disclosure information on pages 45 - 49 of this report.

C. eBay Model
Exhibit 31: eBay - Income Statement ($000s)
Source: Company data, Jefferies estimates
Exhibit 32: eBay - Revenue Build ($000s)
Source: Company data, Jefferies estimates
Q1 12A Q2 12A Q3 12A Q4 12A Q1 13E Q2 13E Q3 13E Q4 13E F2012A F2013E F2014E
Net Revenues $3,277,000 $3,398,000 $3,404,000 $3,992,000 $3,749,989 $3,956,527 $4,012,053 $4,768,613 $14,071,000 $16,487,182 $19,523,884
% Y/Y Growth 29% 23% 15% 18% 14% 16% 18% 19% 21% 17% 18%
Cost of Net Revenues 948,000 954,000 989,000 1,192,000 1,090,455 1,118,722 1,173,688 1,426,054 4,083,000 4,808,919 5,694,653
Total Gross Profit $2,329,000 $2,444,000 $2,415,000 $2,800,000 $2,659,534 $2,837,806 $2,838,365 $3,342,559 $9,988,000 $11,678,263 $13,829,231
% Margin 71.1% 71.9% 70.9% 70.1% 70.9% 71.7% 70.7% 70.1% 71.0% 70.8% 70.8%
Sales and Marketing 647,000 683,000 691,000 757,000 723,510 789,330 806,409 897,046 2,778,000 3,216,294 3,759,879
Product Development 344,000 357,000 355,000 379,000 386,000 411,000 429,000 447,000 1,435,000 1,673,000 1,973,000
General and Administrative 321,000 346,000 326,000 391,000 369,000 382,000 390,000 405,000 1,384,000 1,546,000 1,726,000
Provision for Transaction & Loan Losses 134,000 131,000 148,000 168,000 144,375 147,183 169,435 190,745 581,000 651,736 757,527
Adjusted Operating Income / (Loss) $883,000 $927,000 $895,000 $1,105,000 $1,036,649 $1,108,294 $1,043,522 $1,402,769 $3,810,000 $4,591,232 $5,612,825
% Margin 26.9% 27.3% 26.3% 27.7% 27.6% 28.0% 26.0% 29.4% 27.1% 27.8% 28.7%
% Y/Y Growth (9) 5 (3) 23 (6) 7 (6) 34 20 21 22
EBITDA $1,059,000 $1,114,000 $1,103,000 $1,323,000 $1,254,367 $1,321,475 $1,256,780 $1,618,235 $4,599,000 $5,450,857 $6,713,098
% Margin 32.3% 32.8% 32.4% 33.1% 33.4% 33.4% 31.3% 33.9% 32.7% 33.1% 34.4%
% Y/Y Growth (7) 5 (1) 20 (5) 5 (5) 29 21 19 23
Net Interest (Income) and Other (Income) (25,000) (33,000) 1,000 (29,000) 4,513 3,084 2,152 (91,091) (86,000) (81,341) (90,544)
Adjusted Pre-Tax Profit / (Loss) $908,000 $960,000 $894,000 $1,134,000 $1,032,135 $1,105,209 $1,041,370 $1,493,859 $3,896,000 $4,672,574 $5,703,368
% Effective Tax Rate 20% 24% 20% 18% 21% 22% 22% 21% 20% 22% 22%
Provision / (Benefit) for Income Taxes 114,000 159,000 75,000 126,000 168,325 199,254 185,583 266,797 474,000 819,960 1,083,927
Tax Adjustments for Non-GAAP Items 69,000 71,000 101,000 81,000 47,020 48,394 47,328 48,556 322,000 191,298 180,020
Operating Net Income / (Loss) $725,000 $730,000 $718,000 $927,000 $816,790 $857,561 $808,459 $1,178,506 $3,100,000 $3,661,316 $4,439,422
% Margin 22% 21% 21% 23% 22% 22% 20% 25% 22% 22% 23%
% Y/Y Growth (8) 1 (2) 29 (12) 5 (6) 46 16 18 21
Amortization of Acquired Intagible Assets 105,000 103,000 103,000 101,000 100,000 98,000 97,000 95,000 412,000 390,000 300,000
Stock-Based Compensation 111,000 127,000 122,000 127,000 121,101 140,970 136,640 144,780 487,000 543,491 576,100
Employer Payroll Taxes on Stock Options Gains 14,000 2,000 3,000 3,000 14,000 3,000 3,000 3,000 22,000 23,000 24,000
1x Charges 0 (5,000) (2,000) 30,000 0 0 0 0 23,000 0 0
(Gain) / Loss on Sale of Investments (6,000) (118,000) (4,000) (4,000) (35,000) (35,000) (35,000) (35,000) (132,000) (140,000) (120,000)
Tax Effect of Non-GAAP Entries (69,000) (71,000) (101,000) (81,000) (47,020) (48,394) (47,328) (48,556) (322,000) (191,298) (180,020)$0
Reported GAAP Net Income / (Loss) $570,000 $692,000 $597,000 $751,000 $663,709 $698,985 $654,147 $1,019,282 $2,610,000 $3,036,123 $3,839,341
% Margin 17% 20% 18% 19% 18% 18% 16% 21% 19% 18% 20%
% Y/Y Growth (71) 21 (14) 26 (12) 5 (6) 56 (19) 16 26
Weighted Avg. Diluted Shares Outstanding 1,308,000 1,309,000 1,314,000 1,318,000 1,327,162 1,328,233 1,329,681 1,332,031 1,312,250 1,329,277 1,337,219
Operating EPS $0.55 $0.56 $0.55 $0.70 $0.62 $0.65 $0.61 $0.88 $2.36 $2.75 $3.32
% Q/Q Growth (8%) 1% (2%) 29% (12%) 5% (6%) 46% 16% 17% 21%
Reported GAAP EPS $0.44 $0.53 $0.45 $0.57 $0.50 $0.53 $0.49 $0.77 $1.99 $2.28 $2.87
% Q/Q Growth (71%) 21% (14%) 25% (12%) 5% (7%) 56% (19%) 15% 26%
F2012 F2013
Q1 12A Q2 12A Q3 12A Q4 12A Q1 13E Q2 13E Q3 13E Q4 13E F2012A F2013E F2014E
Total Net Revenues $3,277,000 $3,398,000 $3,404,000 $3,992,000 $3,749,989 $3,956,527 $4,012,053 $4,768,613 $14,071,000 $16,487,182 $19,523,884
% Y/Y Growth 28.7% 23.1% 14.8% 18.1% 14.4% 16.4% 17.9% 19.5% 20.8% 17.2% 18.4%
Marketplaces 1,728,000 1,814,000 1,806,000 2,050,000 1,909,221 2,023,710 2,026,036 2,337,864 7,398,000 8,296,831 9,539,188
% Y/Y Growth 11.2% 9.1% 9.3% 15.7% 10.5% 11.6% 12.2% 14.0% 11.4% 12.1% 15.0%
% of Total Net Revenues 52.7% 53.4% 53.1% 51.4% 50.9% 51.1% 50.5% 49.0% 52.6% 50.3% 48.9%
Transaction Revenues 1,425,000 1,491,000 1,490,000 1,672,000 1,588,950 1,667,118 1,674,960 1,916,016 6,078,000 6,847,044 7,935,724
% Y/Y Growth 10.9% 10.5% 10.1% 15.8% 11.5% 11.8% 12.4% 14.6% 11.9% 12.7% 15.9%
Marketing Services & Other Revenues 303,000 323,000 316,000 378,000 320,271 356,592 351,076 421,848 1,320,000 1,449,787 1,603,464
% Y/Y Growth 12.8% 2.9% 5.6% 14.9% 5.7% 10.4% 11.1% 11.6% 9.0% 9.8% 10.6%
Payments 1,309,000 1,357,000 1,366,600 1,541,000 1,593,768 1,689,817 1,736,017 1,963,749 5,573,600 6,983,351 8,592,211
% Y/Y Growth 31.9% 26.5% 23.4% 24.3% 21.8% 24.5% 27.0% 27.4% 26.3% 25.3% 23.0%
% of Total Net Revenues 39.9% 39.9% 40.1% 38.6% 42.5% 42.7% 43.3% 41.2% 39.6% 42.4% 44.0%
Transaction Revenues 1,216,000 1,234,000 1,264,400 1,432,000 1,482,912 1,538,798 1,603,259 1,821,504 5,146,400 6,446,473 7,935,609
% Y/Y Growth 29.0% 24.5% 22.4% 23.8% 22.0% 24.7% 26.8% 27.2% 24.8% 25.3% 23.1%
Marketing Services & Other Revenues 93,000 123,000 102,200 109,000 110,856 151,019 132,758 142,245 427,200 536,878 656,602
% Y/Y Growth 87.4% 50.2% 37.4% 31.4% 19.2% 22.8% 29.9% 30.5% 47.9% 25.7% 22.3%
Other Revenue 3,000 6,000 5,400 3,000 5,000 5,000 5,000 5,000 17,400 20,000 21,500
% Y/Y Growth 77.9% -35.5% 66.7% -16.7% -7.4% 66.7% 126.4% 14.9% 7.5%
GSI Commerce 237,000 221,000 226,000 398,000 242,000 238,000 245,000 462,000 1,082,000 1,187,000 1,370,985
% Y/Y Growth 15.0% 9.0% 11.5% 9.5% 2.1% 7.7% 8.4% 16.1% 83.4% 9.7% 15.5%
% of Total Net Revenues 7.2% 6.5% 6.6% 10.0% 6.5% 6.0% 6.1% 9.7% 7.7% 7.2% 7.0%
F2012 F2013
Technology
Internet
April 10, 2013
page 37 of 49 , Jefferies Equity Research, [email protected] US Internet Team
Please see important disclosure information on pages 45 - 49 of this report.

Exhibit 33: eBay - Metrics ($000s)
Source: Company data, Jefferies estimates
F2012 F2013
Q1 12A Q2 12A Q3 12A Q4 12A Q1 13E Q2 13E Q3 13E Q4 13E F2012A F2013E F2014E
Marketplaces Metrics
Gross Merchandise Volume (GMV) $18,077,000 $18,192,000 $18,275,000 $20,832,000 $20,222,000 $20,548,113 $20,815,612 $24,031,512 $75,376,000 $85,617,237 $98,753,917
% Y/Y Growth 9.3% 7.5% 8.7% 13.5% 11.9% 13.0% 13.9% 15.4% 9.8% 13.6% 15.3%
US GMV $7,610,417 $7,586,064 $7,803,425 $8,499,456 $8,695,460 $8,835,689 $9,158,869 $10,093,235 $31,499,362 $36,783,253 $42,760,446
% Y/Y Growth 8.7% 8.6% 11.3% 14.9% 14.3% 16.5% 17.4% 18.8% 10.9% 16.8% 16.2%
% of Total GMV 42% 42% 43% 41% 43% 43% 44% 42% 42% 43% 43%
International GMV $10,466,583 $10,605,936 $10,471,575 $12,332,544 $11,526,540 $11,712,425 $11,656,743 $13,938,277 $43,876,638 $48,833,984 $55,993,471
% Y/Y Growth 9.6% 6.8% 6.8% 12.6% 10.1% 10.4% 11.3% 13.0% 9.0% 11.3% 14.7%
Mobile GMV $1,950,000 $2,350,000 $3,250,000 $5,350,000 $3,500,000 $3,700,000 $5,050,000 $7,800,000 $12,900,000 $20,050,000 $27,067,500
% Y/Y Growth 169.0% 161.1% 160.0% 170.9% 79.5% 57.4% 55.4% 45.8% 166.0% 55.4% 35.0%
Mobile as % of Total 10.8% 12.9% 17.8% 25.7% 17.3% 18.0% 24.3% 32.5% 17.1% 23.4% 27.4%
Fixed-Price GMV (excl Vehicles) $11,100,000 $11,300,000 $11,700,000 $13,700,000 $13,144,300 $13,459,014 $13,738,304 $16,187,206 $47,800,000 $56,528,824 $67,152,664
% Y/Y Growth 16.8% 15.3% 15.8% 21.2% 18.4% 19.1% 17.4% 18.2% 17.4% 18.3% 18.8%
Fixed-Price as % of Total GMV 61% 62% 64% 66% 65% 66% 66% 67% 63.4% 66.0% 68.0%
Fixed-Price as % of Non-Vehicle GMV 68% 70% 72% 72% 70% 72% 72% 73% 71% 72% 73%
Marketplaces Transaction Revenue ($'000)$1,425,000 $1,491,000 $1,490,000 $1,672,000 $1,588,950 $1,667,118 $1,674,960 $1,916,016 $6,078,000 $6,847,044 $7,935,724
% Y/Y Growth 10.9% 10.5% 10.1% 15.8% 11.5% 11.8% 12.4% 14.6% 11.9% 12.7% 15.9%
US Marketplaces, ex-Vehicles
US GMV ex-Vehicles 6,366,000 6,241,000 6,479,000 7,338,000 7,359,096 7,252,042 7,606,346 8,592,798 $26,424,000 $30,810,282 $35,770,737
Y/Y Growth 13.1% 13.7% 15.9% 19.2% 15.6% 16.2% 17.4% 17.1% 15.6% 16.6% 16.1%
Q/Q Growth 3.4% -2.0% 3.8% 13.3% 0.3% -1.5% 4.9% 13.0% -- -- --
% of Total 35.2% 34.3% 35.5% 35.2% 36.4% 35.3% 36.5% 35.8% 35.1% 36.0% 36.2%
International Marketplaces, ex-Vehicles
Int'l GMV ex-Vehicles 9,840,000 9,930,000 9,801,000 11,767,000 11,296,320 11,439,360 11,349,558 13,673,254 $41,338,000 $47,758,492 $56,402,779
Y/Y Growth 11.0% 8.0% 8.0% 13.9% 14.8% 15.2% 15.8% 16.2% 10.3% 15.5% 18.1%
FX-neutral Y/Y Growth 13.0% 16.0% 15.0%
Q/Q Growth -4.8% 0.9% -1.3% 20.1% -4.0% 1.3% -0.8% 20.5% -- -- --
% of Total 54.4% 54.6% 53.6% 56.5% 55.9% 55.7% 54.5% 56.9% 54.8% 55.8% 57.1%
Global Marketplaces, Vehicles
Vehicles GMV 1,871,000 2,021,000 1,994,000 1,727,000 1,566,584 1,856,711 1,859,708 1,765,460 $7,613,000 $7,048,463 $6,580,401
Y/Y Growth -8.7% -9.7% -7.2% -7.3% -16.3% -8.1% -6.7% 2.2% -8.3% -7.4% -6.6%
FX-neutral Y/Y Growth -8.0% -7.0% -5.0%
Q/Q Growth 0.4% 8.0% -1.3% -13.4% -9.3% 18.5% 0.2% -5.1% -- -- --
% of Total 10.4% 11.1% 10.9% 8.3% 7.7% 9.0% 8.9% 7.3% 10.1% 8.2% 6.7%
Active Users ('000) 102,400 104,800 108,300 112,300 112,128 114,756 118,589 122,969 112,300 122,969
% Y/Y Growth 6.8% 7.8% 9.7% 11.9% 9.5% 9.5% 9.5% 9.5% 12% 10%
Payments Metrics
Total Payment Volume ($'000) $33,857,000 $34,451,000 $35,159,000 $41,471,000 $43,487,155 $45,126,041 $46,606,372 $53,260,351 $144,938,000 $188,479,919 $235,477,997
% Y/Y Growth 23.7% 19.9% 20.1% 24.3% 28.4% 31.0% 32.6% 28.4% 22.0% 30.0% 24.9%
On-eBay Volume $11,424,000 $11,337,000 $11,455,000 $13,444,000 $14,792,591 $14,869,031 $15,209,990 $17,322,440 $47,660,000 $62,194,051 $77,707,739
% Y/Y Growth 16.6% 14.7% 14.9% 17.8% 29.5% 31.2% 32.8% 28.8% 16.1% 30.5% 24.9%
% Y/Y Growth (FX-Neutral) 18.0% 18.0% 18.0% 18.0%
% of Total Payment Volume 33.7% 32.9% 32.6% 32.4% 34.0% 33.0% 32.6% 32.5% 32.9% 33.0% 33.0%
Merchant Services (Off-eBay) Volume $22,433,000 $23,114,000 $23,704,000 $28,027,000 $28,694,565 $30,257,011 $31,396,383 $35,937,911 $97,278,000 $126,285,868 $157,770,258
% Y/Y Growth 27.7% 22.5% 22.7% 27.6% 27.9% 30.9% 32.5% 28.2% 25.2% 29.8% 24.9%
% Y/Y Growth (FX-Neutral) 28.0% 26.0% 26.0% 28.0%
Bill Me Later TPV $650,000 $696,000 $775,000 $1,034,000 $927,756 $1,027,992 $1,154,750 $1,558,238 $3,155,000 $4,668,736 $6,256,106
% Y/Y Growth 50.8% 39.5% 36.9% 30.9% 42.7% 47.7% 49.0% 50.7% 38.0% 48.0% 34.0%
Mobile TPV $1,825,000 $2,625,000 $3,525,000 $5,750,000 $4,100,000 $4,250,000 $4,900,000 $6,772,500 $13,725,000 $20,022,500 $27,030,375
% Y/Y Growth 247.6% 238.7% 235.7% 228.6% 124.7% 61.9% 39.0% 17.8% 234.8% 45.9% 35.0%
Mobile as % of Total 5.4% 7.6% 10.0% 13.9% 9.4% 9.4% 10.5% 12.7% 9.5% 10.6% 11.5%
Transaction Take Rate 3.87% 3.94% 3.89% 3.72%
Transaction Expense Rate 1.07% 1.07% 1.07% 1.03%
Transaction Loss Rate 0.26% 0.26% 0.30% 0.28%
Transaction Margin 65.6% 66.3% 64.8% 64.7%
Active Registered Accounts ('000) 109,800 113,200 117,400 122,700 123,470 126,841 130,373 136,320 122,700 136,320 150,633
% Y/Y Growth 12.4% 12.9% 14.0% 15.4% 12.5% 12.1% 11.1% 11.1% 15.4% 11.1% 10.5%
Net Number of Payments ('000) 555,700 564,800 589,200 691,700 711,296 720,685 741,803 851,483 2,401,400 3,025,266 3,678,468
% Y/Y Growth 30.9% 30.7% 28.3% 26.2% 28.0% 27.6% 25.9% 23.1% 28.8% 26.0% 21.6%
Transaction Average Size $60.93 $61.00 $59.67 $59.96 $61.14 $62.62 $62.83 $62.55 $60.36 $62.30 $64.02
% Y/Y Growth -5.5% -8.3% -6.4% -1.5% 0.3% 2.7% 5.3% 4.3% -5.3% 3.2% 2.8%
Payments Transaction Revenue ($'000)$1,216,000 $1,234,000 $1,264,400 $1,432,000 $1,482,912 $1,538,798 $1,603,259 $1,821,504 $5,146,400 $6,446,473 $7,935,609
% Y/Y Growth 29.0% 24.5% 22.4% 23.8% 21.9% 24.7% 26.8% 27.2% 24.8% 25.3% 23.1%
Payments Take Rate 3.59% 3.58% 3.60% 3.45% 3.41% 3.41% 3.44% 3.42% 3.55% 3.42% 3.37%
Technology
Internet
April 10, 2013
page 38 of 49 , Jefferies Equity Research, [email protected] US Internet Team
Please see important disclosure information on pages 45 - 49 of this report.
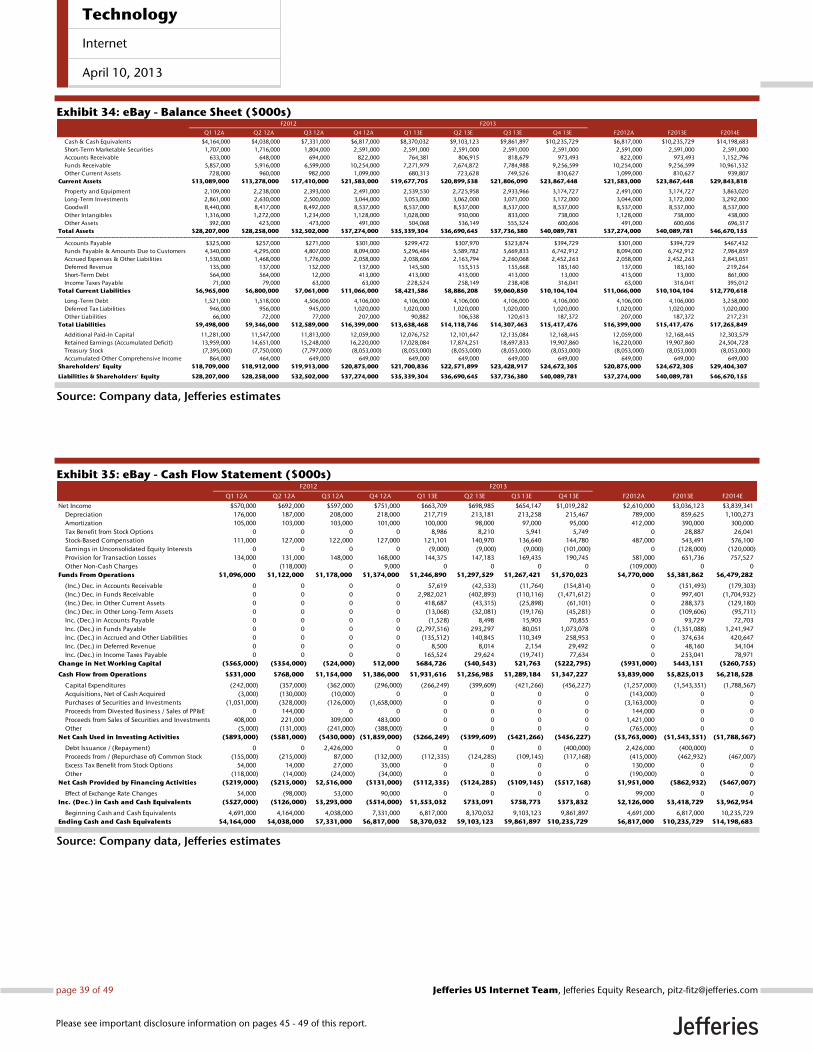
Exhibit 34: eBay - Balance Sheet ($000s)
Source: Company data, Jefferies estimates
Exhibit 35: eBay - Cash Flow Statement ($000s)
Source: Company data, Jefferies estimates
Q1 12A Q2 12A Q3 12A Q4 12A Q1 13E Q2 13E Q3 13E Q4 13E F2012A F2013E F2014E
Cash & Cash Equivalents $4,164,000 $4,038,000 $7,331,000 $6,817,000 $8,370,032 $9,103,123 $9,861,897 $10,235,729 $6,817,000 $10,235,729 $14,198,683
Short-Term Marketable Securities 1,707,000 1,716,000 1,804,000 2,591,000 2,591,000 2,591,000 2,591,000 2,591,000 2,591,000 2,591,000 2,591,000
Accounts Receivable 633,000 648,000 694,000 822,000 764,381 806,915 818,679 973,493 822,000 973,493 1,152,796
Funds Receivable 5,857,000 5,916,000 6,599,000 10,254,000 7,271,979 7,674,872 7,784,988 9,256,599 10,254,000 9,256,599 10,961,532
Other Current Assets 728,000 960,000 982,000 1,099,000 680,313 723,628 749,526 810,627 1,099,000 810,627 939,807
Current Assets $13,089,000 $13,278,000 $17,410,000 $21,583,000 $19,677,705 $20,899,538 $21,806,090 $23,867,448 $21,583,000 $23,867,448 $29,843,818
Property and Equipment 2,109,000 2,238,000 2,393,000 2,491,000 2,539,530 2,725,958 2,933,966 3,174,727 2,491,000 3,174,727 3,863,020
Long-Term Investments 2,861,000 2,630,000 2,500,000 3,044,000 3,053,000 3,062,000 3,071,000 3,172,000 3,044,000 3,172,000 3,292,000
Goodwill 8,440,000 8,417,000 8,492,000 8,537,000 8,537,000 8,537,000 8,537,000 8,537,000 8,537,000 8,537,000 8,537,000
Other Intangibles 1,316,000 1,272,000 1,234,000 1,128,000 1,028,000 930,000 833,000 738,000 1,128,000 738,000 438,000
Other Assets 392,000 423,000 473,000 491,000 504,068 536,149 555,324 600,606 491,000 600,606 696,317
Total Assets $28,207,000 $28,258,000 $32,502,000 $37,274,000 $35,339,304 $36,690,645 $37,736,380 $40,089,781 $37,274,000 $40,089,781 $46,670,155
Accounts Payable $325,000 $257,000 $271,000 $301,000 $299,472 $307,970 $323,874 $394,729 $301,000 $394,729 $467,432
Funds Payable & Amounts Due to Customers 4,340,000 4,295,000 4,807,000 8,094,000 5,296,484 5,589,782 5,669,833 6,742,912 8,094,000 6,742,912 7,984,859
Accrued Expenses & Other Liabilities 1,530,000 1,468,000 1,776,000 2,058,000 2,038,606 2,163,794 2,260,068 2,452,263 2,058,000 2,452,263 2,843,051
Deferred Revenue 135,000 137,000 132,000 137,000 145,500 153,513 155,668 185,160 137,000 185,160 219,264
Short-Term Debt 564,000 564,000 12,000 413,000 413,000 413,000 413,000 13,000 413,000 13,000 861,000
Income Taxes Payable 71,000 79,000 63,000 63,000 228,524 258,149 238,408 316,041 63,000 316,041 395,012
Total Current Liabilities $6,965,000 $6,800,000 $7,061,000 $11,066,000 $8,421,586 $8,886,208 $9,060,850 $10,104,104 $11,066,000 $10,104,104 $12,770,618
Long-Term Debt 1,521,000 1,518,000 4,506,000 4,106,000 4,106,000 4,106,000 4,106,000 4,106,000 4,106,000 4,106,000 3,258,000
Deferred Tax Liabilities 946,000 956,000 945,000 1,020,000 1,020,000 1,020,000 1,020,000 1,020,000 1,020,000 1,020,000 1,020,000
Other Liabilities 66,000 72,000 77,000 207,000 90,882 106,538 120,613 187,372 207,000 187,372 217,231
Total Liabilities $9,498,000 $9,346,000 $12,589,000 $16,399,000 $13,638,468 $14,118,746 $14,307,463 $15,417,476 $16,399,000 $15,417,476 $17,265,849
Additional Paid-In Capital 11,281,000 11,547,000 11,813,000 12,059,000 12,076,752 12,101,647 12,135,084 12,168,445 12,059,000 12,168,445 12,303,579
Retained Earnings (Accumulated Deficit) 13,959,000 14,651,000 15,248,000 16,220,000 17,028,084 17,874,251 18,697,833 19,907,860 16,220,000 19,907,860 24,504,728
Treasury Stock (7,395,000) (7,750,000) (7,797,000) (8,053,000) (8,053,000) (8,053,000) (8,053,000) (8,053,000) (8,053,000) (8,053,000) (8,053,000)
Accumulated Other Comprehensive Income 864,000 464,000 649,000 649,000 649,000 649,000 649,000 649,000 649,000 649,000 649,000
Shareholders' Equity $18,709,000 $18,912,000 $19,913,000 $20,875,000 $21,700,836 $22,571,899 $23,428,917 $24,672,305 $20,875,000 $24,672,305 $29,404,307
Liabilities & Shareholders' Equity $28,207,000 $28,258,000 $32,502,000 $37,274,000 $35,339,304 $36,690,645 $37,736,380 $40,089,781 $37,274,000 $40,089,781 $46,670,155
F2012 F2013
Q1 12A Q2 12A Q3 12A Q4 12A Q1 13E Q2 13E Q3 13E Q4 13E F2012A F2013E F2014E
Net Income $570,000 $692,000 $597,000 $751,000 $663,709 $698,985 $654,147 $1,019,282 $2,610,000 $3,036,123 $3,839,341
Depreciation 176,000 187,000 208,000 218,000 217,719 213,181 213,258 215,467 789,000 859,625 1,100,273
Amortization 105,000 103,000 103,000 101,000 100,000 98,000 97,000 95,000 412,000 390,000 300,000
Tax Benefit from Stock Options 0 0 0 0 8,986 8,210 5,941 5,749 0 28,887 26,041
Stock-Based Compensation 111,000 127,000 122,000 127,000 121,101 140,970 136,640 144,780 487,000 543,491 576,100
Earnings in Unconsolidated Equity Interests 0 0 0 0 (9,000) (9,000) (9,000) (101,000) 0 (128,000) (120,000)
Provision for Transaction Losses 134,000 131,000 148,000 168,000 144,375 147,183 169,435 190,745 581,000 651,736 757,527
Other Non-Cash Charges 0 (118,000) 0 9,000 0 0 0 0 (109,000) 0 0
Funds From Operations $1,096,000 $1,122,000 $1,178,000 $1,374,000 $1,246,890 $1,297,529 $1,267,421 $1,570,023 $4,770,000 $5,381,862 $6,479,282
(Inc.) Dec. in Accounts Receivable 0 0 0 0 57,619 (42,533) (11,764) (154,814) 0 (151,493) (179,303)
(Inc.) Dec. in Funds Receivable 0 0 0 0 2,982,021 (402,893) (110,116) (1,471,612) 0 997,401 (1,704,932)
(Inc.) Dec. in Other Current Assets 0 0 0 0 418,687 (43,315) (25,898) (61,101) 0 288,373 (129,180)
(Inc.) Dec. in Other Long-Term Assets 0 0 0 0 (13,068) (32,081) (19,176) (45,281) 0 (109,606) (95,711)
Inc. (Dec.) in Accounts Payable 0 0 0 0 (1,528) 8,498 15,903 70,855 0 93,729 72,703
Inc. (Dec.) in Funds Payable 0 0 0 0 (2,797,516) 293,297 80,051 1,073,078 0 (1,351,088) 1,241,947
Inc. (Dec.) in Accrued and Other Liabilities 0 0 0 0 (135,512) 140,845 110,349 258,953 0 374,634 420,647
Inc. (Dec.) in Deferred Revenue 0 0 0 0 8,500 8,014 2,154 29,492 0 48,160 34,104
Inc. (Dec.) in Income Taxes Payable 0 0 0 0 165,524 29,624 (19,741) 77,634 0 253,041 78,971
Change in Net Working Capital ($565,000) ($354,000) ($24,000) $12,000 $684,726 ($40,543) $21,763 ($222,795) ($931,000) $443,151 ($260,755)
Cash Flow from Operations $531,000 $768,000 $1,154,000 $1,386,000 $1,931,616 $1,256,985 $1,289,184 $1,347,227 $3,839,000 $5,825,013 $6,218,528
Capital Expenditures (242,000) (357,000) (362,000) (296,000) (266,249) (399,609) (421,266) (456,227) (1,257,000) (1,543,351) (1,788,567)
Acquisitions, Net of Cash Acquired (3,000) (130,000) (10,000) 0 0 0 0 0 (143,000) 0 0
Purchases of Securities and Investments (1,051,000) (328,000) (126,000) (1,658,000) 0 0 0 0 (3,163,000) 0 0
Proceeds from Divested Business / Sales of PP&E 0 144,000 0 0 0 0 0 0 144,000 0 0
Proceeds from Sales of Securities and Investments 408,000 221,000 309,000 483,000 0 0 0 0 1,421,000 0 0
Other (5,000) (131,000) (241,000) (388,000) 0 0 0 0 (765,000) 0 0
Net Cash Used in Investing Activities ($893,000) ($581,000) ($430,000) ($1,859,000) ($266,249) ($399,609) ($421,266) ($456,227) ($3,763,000) ($1,543,351) ($1,788,567)
Debt Issuance / (Repayment) 0 0 2,426,000 0 0 0 0 (400,000) 2,426,000 (400,000) 0
Proceeds from / (Repurchase of) Common Stock (155,000) (215,000) 87,000 (132,000) (112,335) (124,285) (109,145) (117,168) (415,000) (462,932) (467,007)
Excess Tax Benefit from Stock Options 54,000 14,000 27,000 35,000 0 0 0 0 130,000 0 0
Other (118,000) (14,000) (24,000) (34,000) 0 0 0 0 (190,000) 0 0
Net Cash Provided by Financing Activities ($219,000) ($215,000) $2,516,000 ($131,000) ($112,335) ($124,285) ($109,145) ($517,168) $1,951,000 ($862,932) ($467,007)
Effect of Exchange Rate Changes 54,000 (98,000) 53,000 90,000 0 0 0 0 99,000 0 0
Inc. (Dec.) in Cash and Cash Equivalents ($527,000) ($126,000) $3,293,000 ($514,000) $1,553,032 $733,091 $758,773 $373,832 $2,126,000 $3,418,729 $3,962,954
Beginning Cash and Cash Equivalents 4,691,000 4,164,000 4,038,000 7,331,000 6,817,000 8,370,032 9,103,123 9,861,897 4,691,000 6,817,000 10,235,729
Ending Cash and Cash Equivalents $4,164,000 $4,038,000 $7,331,000 $6,817,000 $8,370,032 $9,103,123 $9,861,897 $10,235,729 $6,817,000 $10,235,729 $14,198,683
F2012 F2013
Technology
Internet
April 10, 2013
page 39 of 49 , Jefferies Equity Research, [email protected] US Internet Team
Please see important disclosure information on pages 45 - 49 of this report.

Exhibit 36: eBay - DCF Analysis ($MM)
Source: Company data, Jefferies estimates
2013
2012A Q1 13E Q2 13E Q3 13E Q4 13E 2014E 2015E 2016E 2017E 2018E 2019E 2020E 2021E 2022E
Revenue $14,071 $3,750 $3,957 $4,012 $4,769 $19,524 $23,310 $27,135 $30,813 $34,319 $37,615 $40,535 $42,944 $45,110
% Y/Y Growth 21% 14% 16% 18% 19% 18% 19% 16% 14% 11% 10% 8% 6% 5%
EBITDA $4,599 $1,254 $1,321 $1,257 $1,618 $6,713 $8,209 $9,859 $11,545 $13,292 $15,060 $16,816 $18,392 $19,901
% Margin 33% 33% 33% 31% 34% 34% 35% 36% 37% 39% 40% 41% 43% 44%
% Y/Y Growth 21 18 19 14 22 23 22 20 17 15 13 12 9 8
Implied Taxes on Operations ($940) ($262) ($296) ($281) ($342) ($1,488) ($1,831) ($2,203) ($2,582) ($2,971) ($3,365) ($3,754) ($4,097) ($4,423)
% Effective Tax Rate 20% 21% 22% 22% 21% 22% 22% 22% 22% 22% 22% 22% 22% 22%
Capital Expenditures ($1,257) ($266) ($400) ($421) ($456) ($1,789) ($2,089) ($2,377) ($2,638) ($2,869) ($3,070) ($3,227) ($3,333) ($3,411)
% Y/Y Growth 30% 10% 12% 18% 54% 16% 17% 14% 11% 9% 7% 5% 3% 2%
Change in Net Working Capital ($931) $685 ($41) $22 ($223) ($261) ($335) ($350) ($344) ($337) ($324) ($295) ($248) ($229)
Tax Benefit from NOL Carryforwards 0 0 0 0 0 0 0 0 0 0 0 0 0 0
Acquisitions Not Yet Reflected on Balance Sheet-- 0 0 0 0 0 0 0 0 0 0 0 0 0
Unlevered Free Cash Flow $1,471 $1,411 $585 $576 $598 $3,176 $3,955 $4,929 $5,982 $7,114 $8,301 $9,540 $10,714 $11,838
NPV at 12/31/12 Valuation Date and 12.3% WACC $1,371 $552 $528 $532 $2,669 $2,959 $3,283 $3,548 $3,758 $3,904 $3,994 $3,994 $3,930
Perpetuity Growth Rate / Terminal Value at 12.3% WACC Implied Terminal Value / Terminal EBITDA Multiple
3.0% 3.5% 4.0% 4.5% 5.0% 7.0x 7.4x 7.9x 8.4x 9.1x
$138,851 $147,452 $157,090 $167,964 $180,327 $138,851 $147,452 $157,090 $167,964 $180,327
Median DCF Valuation at 12/31/12 Valuation Date WACC Equity Value per Share
NPV of Cash Flows and Terminal Value $81,463 10% $71 $73 $76 $78 $82
Plus: Cash and Equivalents 7,933 11% 66 68 71 73 76
Implied Equity Value $89,396 12% 62 64 66 68 71
Implied Fully Diluted Shares Outstanding (MM) 1,353 13% 58 60 62 64 66
Implied Equity Value per Share $66 14% 55 56 58 60 62
Technology
Internet
April 10, 2013
page 40 of 49 , Jefferies Equity Research, [email protected] US Internet Team
Please see important disclosure information on pages 45 - 49 of this report.
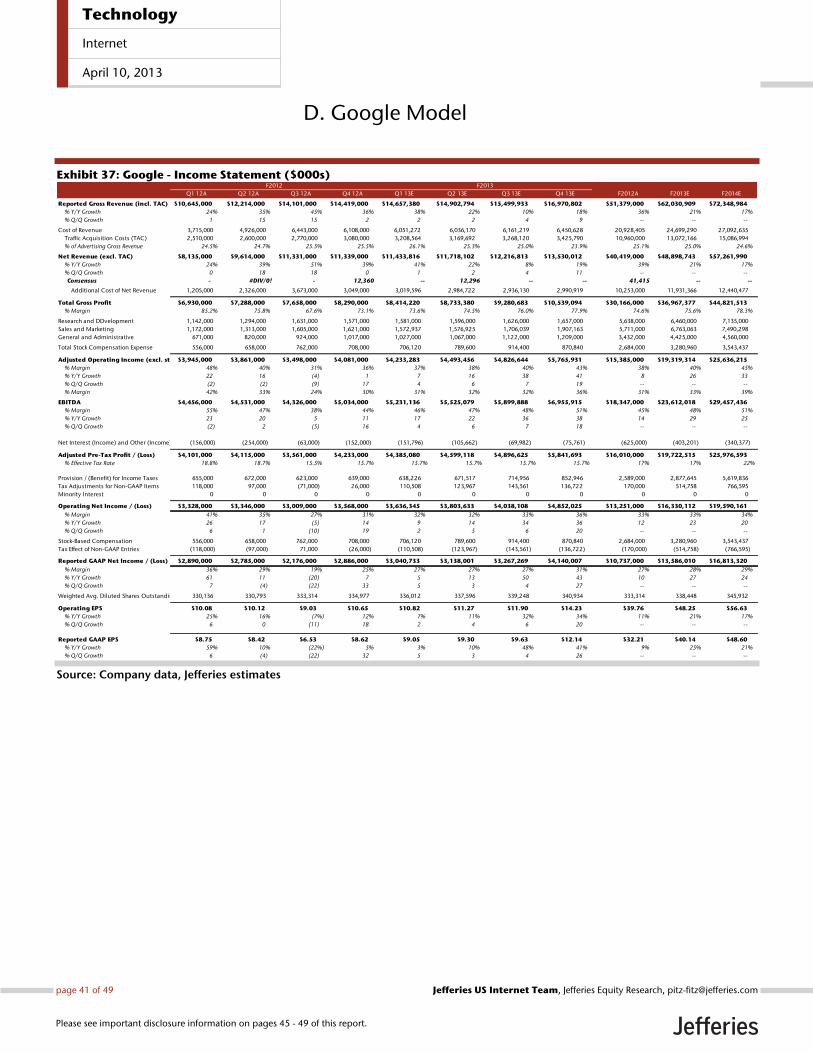
D. Google Model
Exhibit 37: Google - Income Statement ($000s)
Source: Company data, Jefferies estimates
Q1 12A Q2 12A Q3 12A Q4 12A Q1 13E Q2 13E Q3 13E Q4 13E F2012A F2013E F2014E
Reported Gross Revenue (incl. TAC) $10,645,000 $12,214,000 $14,101,000 $14,419,000 $14,657,380 $14,902,794 $15,499,933 $16,970,802 $51,379,000 $62,030,909 $72,348,984
% Y/Y Growth 24% 35% 45% 36% 38% 22% 10% 18% 36% 21% 17%
% Q/Q Growth 1 15 15 2 2 2 4 9 -- -- --
Cost of Revenue 3,715,000 4,926,000 6,443,000 6,108,000 6,051,272 6,036,170 6,161,219 6,450,628 20,928,405 24,699,290 27,092,635
Traffic Acquisition Costs (TAC) 2,510,000 2,600,000 2,770,000 3,080,000 3,208,564 3,169,692 3,268,120 3,425,790 10,960,000 13,072,166 15,086,994
% of Advertising Gross Revenue 24.5% 24.7% 25.5% 25.5% 26.1% 25.3% 25.0% 23.9% 25.1% 25.0% 24.6%
Net Revenue (excl. TAC) $8,135,000 $9,614,000 $11,331,000 $11,339,000 $11,433,816 $11,718,102 $12,216,813 $13,530,012 $40,419,000 $48,898,743 $57,261,990
% Y/Y Growth 24% 39% 51% 39% 41% 22% 8% 19% 39% 21% 17%
% Q/Q Growth 0 18 18 0 1 2 4 11 -- -- --
Consensus - #DIV/0! - 12,360 -- 12,296 -- -- 41,415 -- --
Additional Cost of Net Revenue 1,205,000 2,326,000 3,673,000 3,049,000 3,019,596 2,984,722 2,936,130 2,990,919 10,253,000 11,931,366 12,440,477
Total Gross Profit $6,930,000 $7,288,000 $7,658,000 $8,290,000 $8,414,220 $8,733,380 $9,280,683 $10,539,094 $30,166,000 $36,967,377 $44,821,513
% Margin 85.2% 75.8% 67.6% 73.1% 73.6% 74.5% 76.0% 77.9% 74.6% 75.6% 78.3%
Research and DDvelopment 1,142,000 1,294,000 1,631,000 1,571,000 1,581,000 1,596,000 1,626,000 1,657,000 5,638,000 6,460,000 7,135,000
Sales and Marketing 1,172,000 1,313,000 1,605,000 1,621,000 1,572,937 1,576,925 1,706,039 1,907,163 5,711,000 6,763,063 7,490,298
General and Administrative 671,000 820,000 924,000 1,017,000 1,027,000 1,067,000 1,122,000 1,209,000 3,432,000 4,425,000 4,560,000
Total Stock Compensation Expense 556,000 658,000 762,000 708,000 706,120 789,600 914,400 870,840 2,684,000 3,280,960 3,543,437
Adjusted Operating Income (excl. stock comp.)$3,945,000 $3,861,000 $3,498,000 $4,081,000 $4,233,283 $4,493,456 $4,826,644 $5,765,931 $15,385,000 $19,319,314 $25,636,215
% Margin 48% 40% 31% 36% 37% 38% 40% 43% 38% 40% 45%
% Y/Y Growth 22 16 (4) 1 7 16 38 41 8 26 33
% Q/Q Growth (2) (2) (9) 17 4 6 7 19 -- -- --
% Margin 42% 33% 24% 30% 31% 32% 32% 36% 31% 33% 39%
EBITDA $4,456,000 $4,531,000 $4,326,000 $5,034,000 $5,231,136 $5,525,079 $5,899,888 $6,955,915 $18,347,000 $23,612,018 $29,457,436
% Margin 55% 47% 38% 44% 46% 47% 48% 51% 45% 48% 51%
% Y/Y Growth 23 20 5 11 17 22 36 38 14 29 25
% Q/Q Growth (2) 2 (5) 16 4 6 7 18 -- -- --
Net Interest (Income) and Other (Income) (156,000) (254,000) (63,000) (152,000) (151,796) (105,662) (69,982) (75,761) (625,000) (403,201) (340,377)
Adjusted Pre-Tax Profit / (Loss) $4,101,000 $4,115,000 $3,561,000 $4,233,000 $4,385,080 $4,599,118 $4,896,625 $5,841,693 $16,010,000 $19,722,515 $25,976,593
% Effective Tax Rate 18.8% 18.7% 15.5% 15.7% 15.7% 15.7% 15.7% 15.7% 17% 17% 22%
Provision / (Benefit) for Income Taxes 655,000 672,000 623,000 639,000 638,226 671,517 714,956 852,946 2,589,000 2,877,645 5,619,836
Tax Adjustments for Non-GAAP Items 118,000 97,000 (71,000) 26,000 110,508 123,967 143,561 136,722 170,000 514,758 766,595
Minority Interest 0 0 0 0 0 0 0 0 0 0 0
Operating Net Income / (Loss) $3,328,000 $3,346,000 $3,009,000 $3,568,000 $3,636,345 $3,803,633 $4,038,108 $4,852,025 $13,251,000 $16,330,112 $19,590,161
% Margin 41% 35% 27% 31% 32% 32% 33% 36% 33% 33% 34%
% Y/Y Growth 26 17 (5) 14 9 14 34 36 12 23 20
% Q/Q Growth 6 1 (10) 19 2 5 6 20 -- -- --
Stock-Based Compensation 556,000 658,000 762,000 708,000 706,120 789,600 914,400 870,840 2,684,000 3,280,960 3,543,437
Tax Effect of Non-GAAP Entries (118,000) (97,000) 71,000 (26,000) (110,508) (123,967) (143,561) (136,722) (170,000) (514,758) (766,595)
Reported GAAP Net Income / (Loss) $2,890,000 $2,785,000 $2,176,000 $2,886,000 $3,040,733 $3,138,001 $3,267,269 $4,140,007 $10,737,000 $13,586,010 $16,813,320
% Margin 36% 29% 19% 25% 27% 27% 27% 31% 27% 28% 29%
% Y/Y Growth 61 11 (20) 7 5 13 50 43 10 27 24
% Q/Q Growth 7 (4) (22) 33 5 3 4 27 -- -- --
Weighted Avg. Diluted Shares Outstanding 330,136 330,793 333,314 334,977 336,012 337,596 339,248 340,934 333,314 338,448 345,932
Operating EPS $10.08 $10.12 $9.03 $10.65 $10.82 $11.27 $11.90 $14.23 $39.76 $48.25 $56.63
% Y/Y Growth 25% 16% (7%) 12% 7% 11% 32% 34% 11% 21% 17%
% Q/Q Growth 6 0 (11) 18 2 4 6 20 -- -- --
Reported GAAP EPS $8.75 $8.42 $6.53 $8.62 $9.05 $9.30 $9.63 $12.14 $32.21 $40.14 $48.60
% Y/Y Growth 59% 10% (22%) 5% 3% 10% 48% 41% 9% 25% 21%
% Q/Q Growth 6 (4) (22) 32 5 3 4 26 -- -- --
F2012 F2013
Technology
Internet
April 10, 2013
page 41 of 49 , Jefferies Equity Research, [email protected] US Internet Team
Please see important disclosure information on pages 45 - 49 of this report.

Exhibit 38: Google - Revenue Build ($000s)
Source: Company data, Jefferies estimates
Q1 12A Q2 12A Q3 12A Q4 12A Q1 13E Q2 13E Q3 13E Q4 13E F2012A F2013E F2014E
Gross Revenue (including TAC)
Google Revenue (Advertising & Other) $10,645,000 $12,214,000 $14,101,000 $14,419,000 $13,188,800 $13,448,900 $14,031,500 $15,473,000 $46,040,000 $56,142,200 $66,048,065
% Y/Y Growth 24% 35% 45% 36% 24% 10% 0% 7% 21% 22% 18%
% Q/Q Growth 1 15 15 2 (9) 2 4 10 -- -- --
Advertising $10,225,000 $10,525,000 $10,860,000 $12,076,000 $12,300,400 $12,510,000 $13,047,400 $14,359,600 $43,686,000 $52,217,400 $61,328,300
% Y/Y Growth 23% 21% 16% 19% 20% 19% 20% 19% 20% 20% 17%
% Q/Q Growth 1% 3% 3% 11% 2% 2% 4% 10% -- -- --
% of Total Gross Revenue 96% 86% 77% 84% 93% 93% 93% 93% 95% 93% 93%
Search Revenue 8,850,000 9,000,000 8,910,000 9,704,000 9,770,400 9,900,000 10,157,400 11,159,600 $36,464,000 $40,987,400
% Y/Y Growth 17% 15% 7% 8% 10% 10% 14% 15% 11% 12%
Display Revenue (Youtube + ASC + AdMob) 1,375,000 1,525,000 1,950,000 2,372,000 2,530,000 2,610,000 2,890,000 3,200,000 $7,222,000 $11,230,000
% Y/Y Growth 81% 77% 95% 98% 84% 71% 48% 35% 89% 55%
Google Web Sites 7,312,000 7,542,000 7,727,000 8,640,000 8,701,280 9,050,400 9,426,940 10,627,200 $31,221,000 $37,805,820 44,610,868
% Y/Y Growth 24% 21% 15% 18% 19% 20% 22% 23% 19% 21% 18%
% of Total Gross Revenue 69% 62% 55% 60% 66% 67% 67% 69% 68% 67% 68%
Google.com 6,912,000 7,042,000 6,977,000 7,740,000 7,651,280 7,950,400 8,276,940 9,427,200 $28,671,000 $33,305,820
% Y/Y Growth 20% 17% 8% 11% 11% 13% 19% 22% 14% 16%
YouTube 400,000 500,000 750,000 900,000 1,050,000 1,100,000 1,150,000 1,200,000 $2,550,000 $4,500,000
% Y/Y Growth 186% 133% 200% 200% 163% 120% 53% 33% 182% 76%
Mobile O&O 511,840 678,780 849,970 1,123,200 1,218,179 1,357,560 1,508,310 1,806,624 $3,163,790 $5,890,674
% of Google Websites Revenue 7% 9% 11% 13% 14% 15% 16% 17% 11% 18%
Google Network 2,913,000 2,983,000 3,133,000 3,436,000 3,599,120 3,459,600 3,620,460 3,732,400 $12,465,000 $14,411,580 $16,717,433
% Y/Y Growth 20% 20% 21% 19% 24% 16% 16% 9% 20% 16% 16%
% of Total Gross Revenue 27% 24% 22% 24% 27% 26% 26% 24% 27% 26% 25%
AdSense Search 1,938,000 1,958,000 1,933,000 1,964,000 2,119,120 1,949,600 1,880,460 1,732,400 $7,793,000 $7,681,580
% Y/Y Growth 7% 6% 5% -1% 9% 0% -3% -12% 4% -1%
AdSense Display (PC) 700,000 700,000 700,000 722,000 725,000 750,000 840,000 900,000 $2,822,000 $3,215,000
% Y/Y Growth 49% 49% 27% 11% 4% 7% 20% 25% 32% 14%
AdMob 275,000 325,000 500,000 750,000 755,000 760,000 900,000 1,100,000 $1,850,000 $3,515,000
% Y/Y Growth 83% 86% 150% 200% 175% 134% 80% 47% 139% 90%
Licensing & Other $420,000 $439,000 $666,000 $829,000 $888,400 $938,900 $984,100 $1,113,400 $2,354,000 $3,924,800 $4,719,765
% Y/Y Growth 56% 42% 73% 102% 112% 114% 48% 34% 71% 67% 20%
% Q/Q Growth 2% 5% 52% 24% 7% 6% 5% 13% -- -- --
% of Total Gross Revenue 4% 4% 5% 6% 7% 7% 7% 7% 5% 7% 7%
Licensing excluding DCLK $180,000 $199,000 $181,000 $194,000 $203,400 $218,900 $199,100 $213,400 $754,000 $834,800 $893,236
% Y/Y Growth 82% 66% 25% 14% 13% 10% 10% 10% 41% 11% 7%
% Q/Q Growth 6% 11% -9% 7% 5% 8% -9% 7% -- -- --
DoubleClick (Ad Server License Only) $160,000 $160,000 $160,000 $160,000 $160,000 $160,000 $160,000 $160,000 $640,000 $640,000 $665,600
% Y/Y Growth -6% -6% 0% 0% 0% 0% 0% 0% -3% 0% 4%
% Q/Q Growth 0% 0% 0% 0% 0% 0% 0% 0% -- -- --
Nexus One/Google Phones/ITA $80,000 $80,000 $225,000 $350,000 $375,000 $400,000 $450,000 $550,000 $735,000 $1,775,000 $2,283,429
% Y/Y Growth -- 300% 181% 338% 369% 400% 100% 57% 308% 141% 29%
% Q/Q Growth 0% 0% 181% 56% 7% 7% 13% 22% -- -- --
Google Play $0 $0 $100,000 $125,000 $150,000 $160,000 $175,000 $190,000 $225,000 $675,000 $877,500
% Y/Y Growth -- -- -- -- -- -- 75% 52% -- 200% 30%
% Q/Q Growth - - - 25% 20% 7% 9% 9% -- -- --
Add: Hedging Revenue (Forecast periods) ($15,000) ($15,000) ($15,000) ($15,000)
Motorola Revenue (Hardware & Other) $1,250,000 $2,575,000 $1,514,000 $1,468,580 $1,453,894 $1,468,433 $1,497,802 $5,339,000 $5,888,709 $6,300,919
% Y/Y Growth -- -- -- -- -- -- -- -- 10% 7%
% Q/Q Growth -3% -1% 1% 2% -- -- --
F2012 F2013
Technology
Internet
April 10, 2013
page 42 of 49 , Jefferies Equity Research, [email protected] US Internet Team
Please see important disclosure information on pages 45 - 49 of this report.
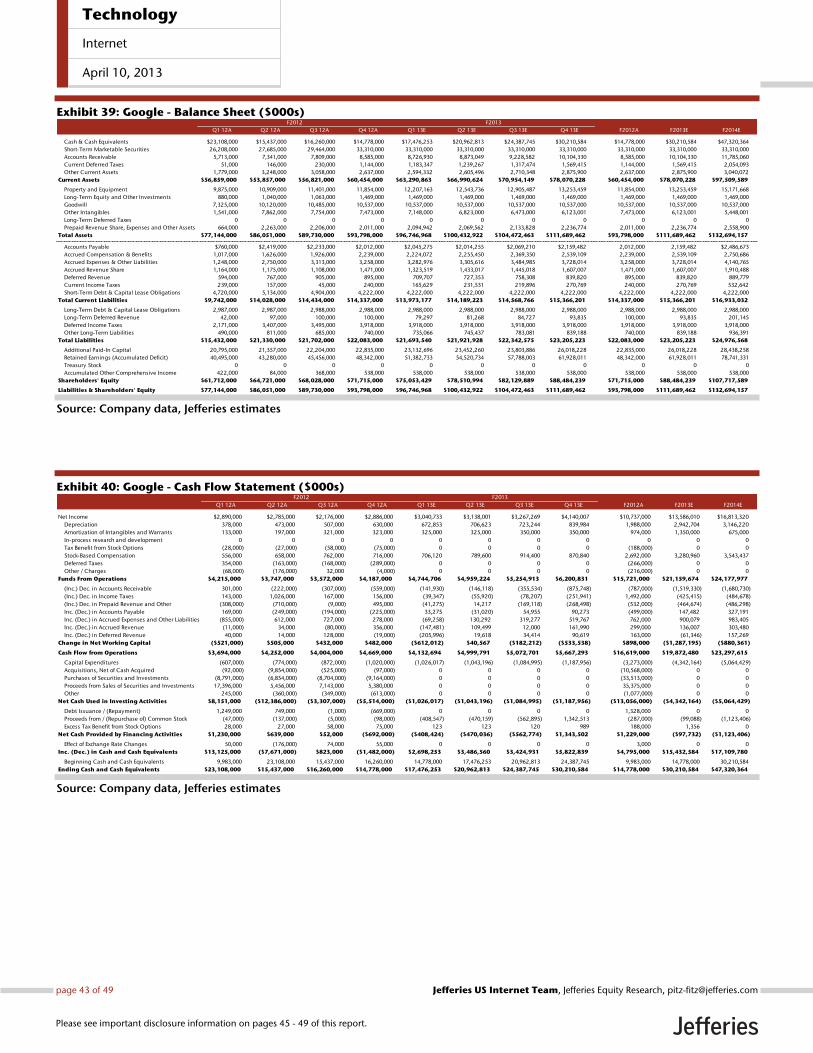
Exhibit 39: Google - Balance Sheet ($000s)
Source: Company data, Jefferies estimates
Exhibit 40: Google - Cash Flow Statement ($000s)
Source: Company data, Jefferies estimates
Q1 12A Q2 12A Q3 12A Q4 12A Q1 13E Q2 13E Q3 13E Q4 13E F2012A F2013E F2014E
Cash & Cash Equivalents $23,108,000 $15,437,000 $16,260,000 $14,778,000 $17,476,253 $20,962,813 $24,387,745 $30,210,584 $14,778,000 $30,210,584 $47,320,364
Short-Term Marketable Securities 26,208,000 27,685,000 29,464,000 33,310,000 33,310,000 33,310,000 33,310,000 33,310,000 33,310,000 33,310,000 33,310,000
Accounts Receivable 5,713,000 7,341,000 7,809,000 8,585,000 8,726,930 8,873,049 9,228,582 10,104,330 8,585,000 10,104,330 11,785,060
Current Deferred Taxes 51,000 146,000 230,000 1,144,000 1,183,347 1,239,267 1,317,474 1,569,415 1,144,000 1,569,415 2,054,093
Other Current Assets 1,779,000 3,248,000 3,058,000 2,637,000 2,594,332 2,605,496 2,710,348 2,875,900 2,637,000 2,875,900 3,040,072
Current Assets $56,859,000 $53,857,000 $56,821,000 $60,454,000 $63,290,863 $66,990,624 $70,954,149 $78,070,228 $60,454,000 $78,070,228 $97,509,589
Property and Equipment 9,875,000 10,909,000 11,401,000 11,854,000 12,207,163 12,543,736 12,905,487 13,253,459 11,854,000 13,253,459 15,171,668
Long-Term Equity and Other Investments 880,000 1,040,000 1,063,000 1,469,000 1,469,000 1,469,000 1,469,000 1,469,000 1,469,000 1,469,000 1,469,000
Goodwill 7,325,000 10,120,000 10,485,000 10,537,000 10,537,000 10,537,000 10,537,000 10,537,000 10,537,000 10,537,000 10,537,000
Other Intangibles 1,541,000 7,862,000 7,754,000 7,473,000 7,148,000 6,823,000 6,473,000 6,123,001 7,473,000 6,123,001 5,448,001
Long-Term Deferred Taxes 0 0 0 0 0 0 0 0 0 0 0
Prepaid Revenue Share, Expenses and Other Assets 664,000 2,263,000 2,206,000 2,011,000 2,094,942 2,069,562 2,133,828 2,236,774 2,011,000 2,236,774 2,558,900
Total Assets $77,144,000 $86,051,000 $89,730,000 $93,798,000 $96,746,968 $100,432,922 $104,472,463 $111,689,462 $93,798,000 $111,689,462 $132,694,157
Accounts Payable $760,000 $2,419,000 $2,233,000 $2,012,000 $2,045,275 $2,014,255 $2,069,210 $2,159,482 2,012,000 2,159,482 $2,486,673
Accrued Compensation & Benefits 1,017,000 1,626,000 1,926,000 2,239,000 2,224,072 2,255,450 2,369,350 2,539,109 2,239,000 2,539,109 2,750,686
Accrued Expenses & Other Liabilities 1,248,000 2,750,000 3,313,000 3,258,000 3,282,976 3,305,616 3,484,985 3,728,014 3,258,000 3,728,014 4,140,765
Accrued Revenue Share 1,164,000 1,175,000 1,108,000 1,471,000 1,323,519 1,433,017 1,445,018 1,607,007 1,471,000 1,607,007 1,910,488
Deferred Revenue 594,000 767,000 905,000 895,000 709,707 727,353 758,308 839,820 895,000 839,820 889,779
Current Income Taxes 239,000 157,000 45,000 240,000 165,629 231,531 219,896 270,769 240,000 270,769 532,642
Short-Term Debt & Capital Lease Obligations 4,720,000 5,134,000 4,904,000 4,222,000 4,222,000 4,222,000 4,222,000 4,222,000 4,222,000 4,222,000 4,222,000
Total Current Liabilities $9,742,000 $14,028,000 $14,434,000 $14,337,000 $13,973,177 $14,189,223 $14,568,766 $15,366,201 $14,337,000 $15,366,201 $16,933,032
Long-Term Debt & Capital Lease Obligations 2,987,000 2,987,000 2,988,000 2,988,000 2,988,000 2,988,000 2,988,000 2,988,000 2,988,000 2,988,000 2,988,000
Long-Term Deferred Revenue 42,000 97,000 100,000 100,000 79,297 81,268 84,727 93,835 100,000 93,835 201,145
Deferred Income Taxes 2,171,000 3,407,000 3,495,000 3,918,000 3,918,000 3,918,000 3,918,000 3,918,000 3,918,000 3,918,000 3,918,000
Other Long-Term Liabilities 490,000 811,000 685,000 740,000 735,066 745,437 783,081 839,188 740,000 839,188 936,391
Total Liabilities $15,432,000 $21,330,000 $21,702,000 $22,083,000 $21,693,540 $21,921,928 $22,342,575 $23,205,223 $22,083,000 $23,205,223 $24,976,568
Additional Paid-In Capital 20,795,000 21,357,000 22,204,000 22,835,000 23,132,696 23,452,260 23,803,886 26,018,228 22,835,000 26,018,228 28,438,258
Retained Earnings (Accumulated Deficit) 40,495,000 43,280,000 45,456,000 48,342,000 51,382,733 54,520,734 57,788,003 61,928,011 48,342,000 61,928,011 78,741,331
Treasury Stock 0 0 0 0 0 0 0 0 0 0 0
Accumulated Other Comprehensive Income 422,000 84,000 368,000 538,000 538,000 538,000 538,000 538,000 538,000 538,000 538,000
Shareholders' Equity $61,712,000 $64,721,000 $68,028,000 $71,715,000 $75,053,429 $78,510,994 $82,129,889 $88,484,239 $71,715,000 $88,484,239 $107,717,589
Liabilities & Shareholders' Equity $77,144,000 $86,051,000 $89,730,000 $93,798,000 $96,746,968 $100,432,922 $104,472,463 $111,689,462 $93,798,000 $111,689,462 $132,694,157
F2012 F2013
Q1 12A Q2 12A Q3 12A Q4 12A Q1 13E Q2 13E Q3 13E Q4 13E F2012A F2013E F2014E
Net Income $2,890,000 $2,785,000 $2,176,000 $2,886,000 $3,040,733 $3,138,001 $3,267,269 $4,140,007 $10,737,000 $13,586,010 $16,813,320
Depreciation 378,000 473,000 507,000 630,000 672,853 706,623 723,244 839,984 1,988,000 2,942,704 3,146,220
Amortization of Intangibles and Warrants 133,000 197,000 321,000 323,000 325,000 325,000 350,000 350,000 974,000 1,350,000 675,000
In-process research and development 0 0 0 0 0 0 0 0 0 0 0
Tax Benefit from Stock Options (28,000) (27,000) (58,000) (75,000) 0 0 0 0 (188,000) 0 0
Stock-Based Compensation 556,000 658,000 762,000 716,000 706,120 789,600 914,400 870,840 2,692,000 3,280,960 3,543,437
Deferred Taxes 354,000 (163,000) (168,000) (289,000) 0 0 0 0 (266,000) 0 0
Other / Charges (68,000) (176,000) 32,000 (4,000) 0 0 0 0 (216,000) 0 0
Funds From Operations $4,215,000 $3,747,000 $3,572,000 $4,187,000 $4,744,706 $4,959,224 $5,254,913 $6,200,831 $15,721,000 $21,159,674 $24,177,977
(Inc.) Dec. in Accounts Receivable 301,000 (222,000) (307,000) (559,000) (141,930) (146,118) (355,534) (875,748) (787,000) (1,519,330) (1,680,730)
(Inc.) Dec. in Income Taxes 143,000 1,026,000 167,000 156,000 (39,347) (55,920) (78,207) (251,941) 1,492,000 (425,415) (484,678)
(Inc.) Dec. in Prepaid Revenue and Other (308,000) (710,000) (9,000) 495,000 (41,275) 14,217 (169,118) (268,498) (532,000) (464,674) (486,298)
Inc. (Dec.) in Accounts Payable 169,000 (249,000) (194,000) (225,000) 33,275 (31,020) 54,955 90,273 (499,000) 147,482 327,191
Inc. (Dec.) in Accrued Expenses and Other Liabilities (855,000) 612,000 727,000 278,000 (69,258) 130,292 319,277 519,767 762,000 900,079 983,405
Inc. (Dec.) in Accrued Revenue (11,000) 34,000 (80,000) 356,000 (147,481) 109,499 12,000 161,990 299,000 136,007 303,480
Inc. (Dec.) in Deferred Revenue 40,000 14,000 128,000 (19,000) (205,996) 19,618 34,414 90,619 163,000 (61,346) 157,269
Change in Net Working Capital ($521,000) $505,000 $432,000 $482,000 ($612,012) $40,567 ($182,212) ($533,538) $898,000 ($1,287,195) ($880,361)
Cash Flow from Operations $3,694,000 $4,252,000 $4,004,000 $4,669,000 $4,132,694 $4,999,791 $5,072,701 $5,667,293 $16,619,000 $19,872,480 $23,297,615
Capital Expenditures (607,000) (774,000) (872,000) (1,020,000) (1,026,017) (1,043,196) (1,084,995) (1,187,956) (3,273,000) (4,342,164) (5,064,429)
Acquisitions, Net of Cash Acquired (92,000) (9,854,000) (525,000) (97,000) 0 0 0 0 (10,568,000) 0 0
Purchases of Securities and Investments (8,791,000) (6,854,000) (8,704,000) (9,164,000) 0 0 0 0 (33,513,000) 0 0
Proceeds from Sales of Securities and Investments 17,396,000 5,456,000 7,143,000 5,380,000 0 0 0 0 35,375,000 0 0
Other 245,000 (360,000) (349,000) (613,000) 0 0 0 0 (1,077,000) 0 0
Net Cash Used in Investing Activities $8,151,000 ($12,386,000) ($3,307,000) ($5,514,000) ($1,026,017) ($1,043,196) ($1,084,995) ($1,187,956) ($13,056,000) ($4,342,164) ($5,064,429)
Debt Issuance / (Repayment) 1,249,000 749,000 (1,000) (669,000) 0 0 0 0 1,328,000 0 0
Proceeds from / (Repurchase of) Common Stock (47,000) (137,000) (5,000) (98,000) (408,547) (470,159) (562,895) 1,342,513 (287,000) (99,088) (1,123,406)
Excess Tax Benefit from Stock Options 28,000 27,000 58,000 75,000 123 123 120 989 188,000 1,356 0
Net Cash Provided by Financing Activities $1,230,000 $639,000 $52,000 ($692,000) ($408,424) ($470,036) ($562,774) $1,343,502 $1,229,000 ($97,732) ($1,123,406)
Effect of Exchange Rate Changes 50,000 (176,000) 74,000 55,000 0 0 0 0 3,000 0 0
Inc. (Dec.) in Cash and Cash Equivalents $13,125,000 ($7,671,000) $823,000 ($1,482,000) $2,698,253 $3,486,560 $3,424,931 $5,822,839 $4,795,000 $15,432,584 $17,109,780
Beginning Cash and Cash Equivalents 9,983,000 23,108,000 15,437,000 16,260,000 14,778,000 17,476,253 20,962,813 24,387,745 9,983,000 14,778,000 30,210,584
Ending Cash and Cash Equivalents $23,108,000 $15,437,000 $16,260,000 $14,778,000 $17,476,253 $20,962,813 $24,387,745 $30,210,584 $14,778,000 $30,210,584 $47,320,364
F2012 F2013
Technology
Internet
April 10, 2013
page 43 of 49 , Jefferies Equity Research, [email protected] US Internet Team
Please see important disclosure information on pages 45 - 49 of this report.
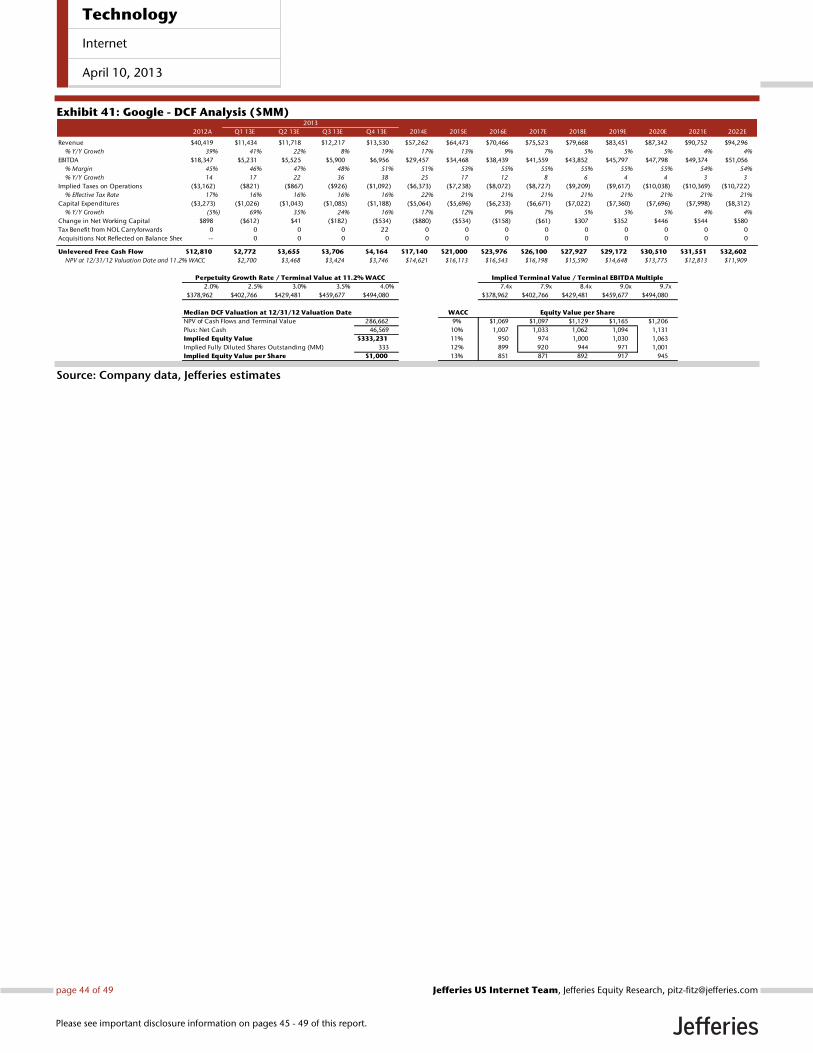
Exhibit 41: Google - DCF Analysis ($MM)
Source: Company data, Jefferies estimates
2013
2012A Q1 13E Q2 13E Q3 13E Q4 13E 2014E 2015E 2016E 2017E 2018E 2019E 2020E 2021E 2022E
Revenue $40,419 $11,434 $11,718 $12,217 $13,530 $57,262 $64,473 $70,466 $75,523 $79,668 $83,451 $87,342 $90,752 $94,296
% Y/Y Growth 39% 41% 22% 8% 19% 17% 13% 9% 7% 5% 5% 5% 4% 4%
EBITDA $18,347 $5,231 $5,525 $5,900 $6,956 $29,457 $34,468 $38,439 $41,559 $43,852 $45,797 $47,798 $49,374 $51,056
% Margin 45% 46% 47% 48% 51% 51% 53% 55% 55% 55% 55% 55% 54% 54%
% Y/Y Growth 14 17 22 36 38 25 17 12 8 6 4 4 3 3
Implied Taxes on Operations ($3,162) ($821) ($867) ($926) ($1,092) ($6,373) ($7,238) ($8,072) ($8,727) ($9,209) ($9,617) ($10,038) ($10,369) ($10,722)
% Effective Tax Rate 17% 16% 16% 16% 16% 22% 21% 21% 21% 21% 21% 21% 21% 21%
Capital Expenditures ($3,273) ($1,026) ($1,043) ($1,085) ($1,188) ($5,064) ($5,696) ($6,233) ($6,671) ($7,022) ($7,360) ($7,696) ($7,998) ($8,312)
% Y/Y Growth (5%) 69% 35% 24% 16% 17% 12% 9% 7% 5% 5% 5% 4% 4%
Change in Net Working Capital $898 ($612) $41 ($182) ($534) ($880) ($534) ($158) ($61) $307 $352 $446 $544 $580
Tax Benefit from NOL Carryforwards 0 0 0 0 22 0 0 0 0 0 0 0 0 0
Acquisitions Not Reflected on Balance Sheet / Shares-- 0 0 0 0 0 0 0 0 0 0 0 0 0
Unlevered Free Cash Flow $12,810 $2,772 $3,655 $3,706 $4,164 $17,140 $21,000 $23,976 $26,100 $27,927 $29,172 $30,510 $31,551 $32,602
NPV at 12/31/12 Valuation Date and 11.2% WACC $2,700 $3,468 $3,424 $3,746 $14,621 $16,113 $16,543 $16,198 $15,590 $14,648 $13,775 $12,813 $11,909
Perpetuity Growth Rate / Terminal Value at 11.2% WACC Implied Terminal Value / Terminal EBITDA Multiple
2.0% 2.5% 3.0% 3.5% 4.0% 7.4x 7.9x 8.4x 9.0x 9.7x
$378,962 $402,766 $429,481 $459,677 $494,080 $378,962 $402,766 $429,481 $459,677 $494,080
Median DCF Valuation at 12/31/12 Valuation Date WACC Equity Value per Share
NPV of Cash Flows and Terminal Value 286,662 9% $1,069 $1,097 $1,129 $1,165 $1,206
Plus: Net Cash 46,569 10% 1,007 1,033 1,062 1,094 1,131
Implied Equity Value $333,231 11% 950 974 1,000 1,030 1,063
Implied Fully Diluted Shares Outstanding (MM) 333 12% 899 920 944 971 1,001
Implied Equity Value per Share $1,000 13% 851 871 892 917 945
Technology
Internet
April 10, 2013
page 44 of 49 , Jefferies Equity Research, [email protected] US Internet Team
Please see important disclosure information on pages 45 - 49 of this report.

Analyst CertificationI, Jefferies US Internet Team, certify that all of the views expressed in this research report accurately reflect my personal views about the subjectsecurity(ies) and subject company(ies). I also certify that no part of my compensation was, is, or will be, directly or indirectly, related to the specificrecommendations or views expressed in this research report.I, Brian Pitz, certify that all of the views expressed in this research report accurately reflect my personal views about the subject security(ies) and subjectcompany(ies). I also certify that no part of my compensation was, is, or will be, directly or indirectly, related to the specific recommendations or viewsexpressed in this research report.I, Brian Fitzgerald, certify that all of the views expressed in this research report accurately reflect my personal views about the subject security(ies) andsubject company(ies). I also certify that no part of my compensation was, is, or will be, directly or indirectly, related to the specific recommendationsor views expressed in this research report.I, Timothy O'Shea, certify that all of the views expressed in this research report accurately reflect my personal views about the subject security(ies) andsubject company(ies). I also certify that no part of my compensation was, is, or will be, directly or indirectly, related to the specific recommendationsor views expressed in this research report.I, Sachin Khattar, CFA, certify that all of the views expressed in this research report accurately reflect my personal views about the subjectsecurity(ies) and subject company(ies). I also certify that no part of my compensation was, is, or will be, directly or indirectly, related to the specificrecommendations or views expressed in this research report.I, Stan Velikov, CFA, certify that all of the views expressed in this research report accurately reflect my personal views about the subject security(ies) andsubject company(ies). I also certify that no part of my compensation was, is, or will be, directly or indirectly, related to the specific recommendationsor views expressed in this research report.As is the case with all Jefferies employees, the analyst(s) responsible for the coverage of the financial instruments discussed in this report receivescompensation based in part on the overall performance of the firm, including investment banking income. We seek to update our research asappropriate, but various regulations may prevent us from doing so. Aside from certain industry reports published on a periodic basis, the large majorityof reports are published at irregular intervals as appropriate in the analyst's judgement.
Company Specific Disclosures
Meanings of Jefferies RatingsBuy - Describes stocks that we expect to provide a total return (price appreciation plus yield) of 15% or more within a 12-month period.Hold - Describes stocks that we expect to provide a total return (price appreciation plus yield) of plus 15% or minus 10% within a 12-month period.Underperform - Describes stocks that we expect to provide a total negative return (price appreciation plus yield) of 10% or more within a 12-monthperiod.The expected total return (price appreciation plus yield) for Buy rated stocks with an average stock price consistently below $10 is 20% or more withina 12-month period as these companies are typically more volatile than the overall stock market. For Hold rated stocks with an average stock priceconsistently below $10, the expected total return (price appreciation plus yield) is plus or minus 20% within a 12-month period. For Underperformrated stocks with an average stock price consistently below $10, the expected total return (price appreciation plus yield) is minus 20% within a 12-month period.NR - The investment rating and price target have been temporarily suspended. Such suspensions are in compliance with applicable regulations and/or Jefferies policies.CS - Coverage Suspended. Jefferies has suspended coverage of this company.NC - Not covered. Jefferies does not cover this company.Restricted - Describes issuers where, in conjunction with Jefferies engagement in certain transactions, company policy or applicable securitiesregulations prohibit certain types of communications, including investment recommendations.Monitor - Describes stocks whose company fundamentals and financials are being monitored, and for which no financial projections or opinions onthe investment merits of the company are provided.
Valuation MethodologyJefferies' methodology for assigning ratings may include the following: market capitalization, maturity, growth/value, volatility and expected totalreturn over the next 12 months. The price targets are based on several methodologies, which may include, but are not restricted to, analyses of marketrisk, growth rate, revenue stream, discounted cash flow (DCF), EBITDA, EPS, cash flow (CF), free cash flow (FCF), EV/EBITDA, P/E, PE/growth, P/CF,P/FCF, premium (discount)/average group EV/EBITDA, premium (discount)/average group P/E, sum of the parts, net asset value, dividend returns,and return on equity (ROE) over the next 12 months.
Conviction List Methodology
1. The aim of the conviction list is to publicise the best individual stock ideas from Jefferies Global Research2. Only stocks with a Buy rating are allowed to be included in the recommended list.3. Stocks are screened for minimum market capitalisation and adequate daily turnover. Furthermore, a valuation, correlation and style screen
is used to ensure a well-diversified portfolio.4. Stocks are sorted to a maximum of 30 stocks with the maximum country exposure at around 50%. Limits are also imposed on a sector basis.5. Once a month, analysts are invited to recommend their best ideas. Analysts’ stock selection can be based on one or more of the following:
non-Consensus investment view, difference in earnings relative to Consensus, valuation methodology, target upside/downside % relative
Technology
Internet
April 10, 2013
page 45 of 49 , Jefferies Equity Research, [email protected] US Internet Team
Please see important disclosure information on pages 45 - 49 of this report.
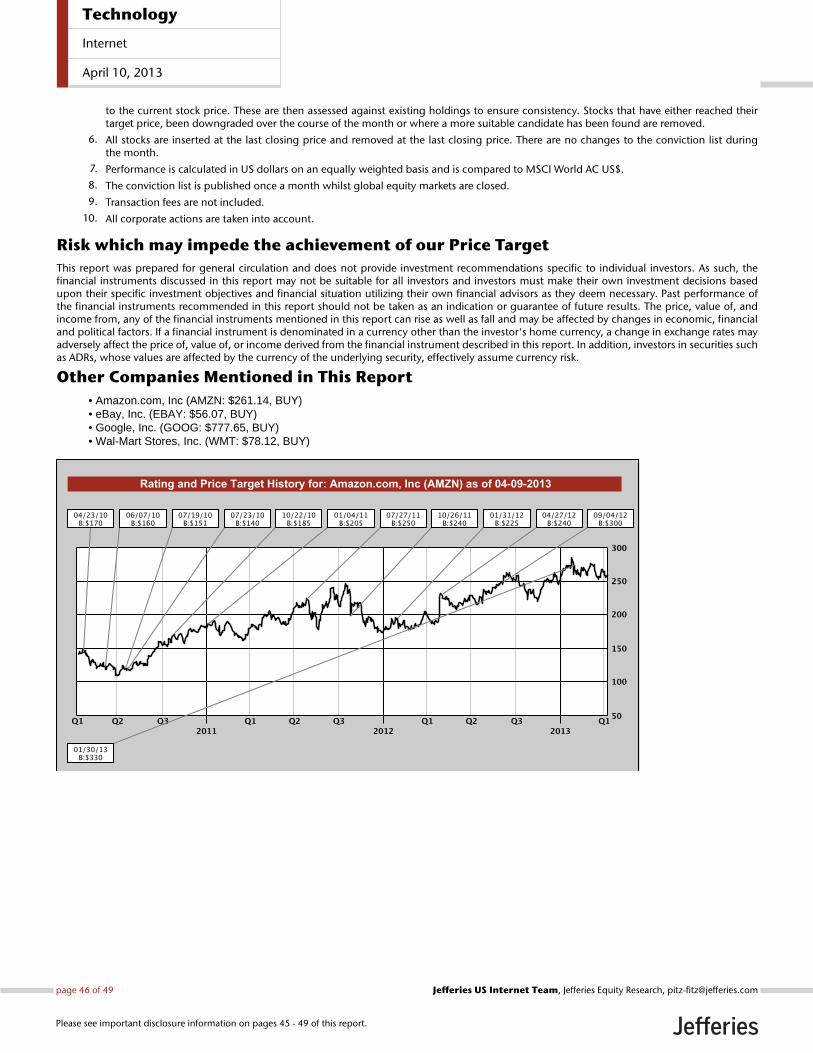
to the current stock price. These are then assessed against existing holdings to ensure consistency. Stocks that have either reached theirtarget price, been downgraded over the course of the month or where a more suitable candidate has been found are removed.
6. All stocks are inserted at the last closing price and removed at the last closing price. There are no changes to the conviction list duringthe month.
7. Performance is calculated in US dollars on an equally weighted basis and is compared to MSCI World AC US$.8. The conviction list is published once a month whilst global equity markets are closed.9. Transaction fees are not included.
10. All corporate actions are taken into account.
Risk which may impede the achievement of our Price TargetThis report was prepared for general circulation and does not provide investment recommendations specific to individual investors. As such, thefinancial instruments discussed in this report may not be suitable for all investors and investors must make their own investment decisions basedupon their specific investment objectives and financial situation utilizing their own financial advisors as they deem necessary. Past performance ofthe financial instruments recommended in this report should not be taken as an indication or guarantee of future results. The price, value of, andincome from, any of the financial instruments mentioned in this report can rise as well as fall and may be affected by changes in economic, financialand political factors. If a financial instrument is denominated in a currency other than the investor's home currency, a change in exchange rates mayadversely affect the price of, value of, or income derived from the financial instrument described in this report. In addition, investors in securities suchas ADRs, whose values are affected by the currency of the underlying security, effectively assume currency risk.
Other Companies Mentioned in This Report• Amazon.com, Inc (AMZN: $261.14, BUY)• eBay, Inc. (EBAY: $56.07, BUY)• Google, Inc. (GOOG: $777.65, BUY)• Wal-Mart Stores, Inc. (WMT: $78.12, BUY)
Technology
Internet
April 10, 2013
page 46 of 49 , Jefferies Equity Research, [email protected] US Internet Team
Please see important disclosure information on pages 45 - 49 of this report.

Technology
Internet
April 10, 2013
page 47 of 49 , Jefferies Equity Research, [email protected] US Internet Team
Please see important disclosure information on pages 45 - 49 of this report.
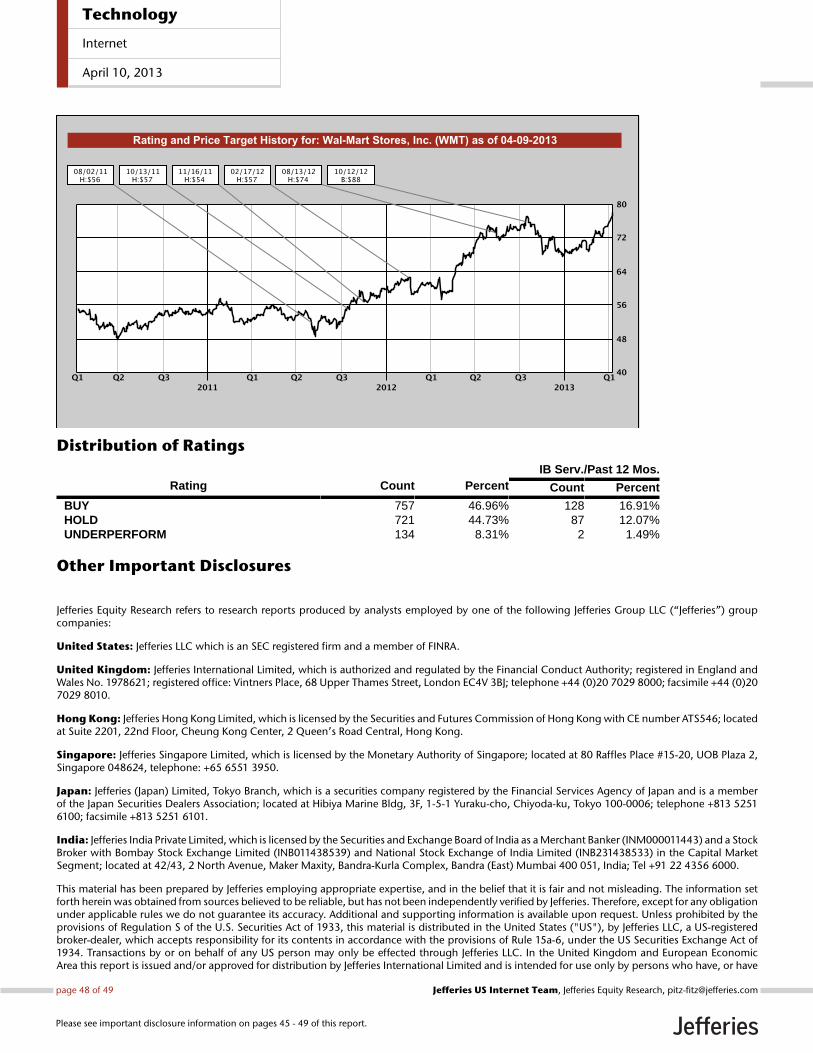
Distribution of RatingsIB Serv./Past 12 Mos.
Rating Count Percent Count Percent
BUY 757 46.96% 128 16.91%HOLD 721 44.73% 87 12.07%UNDERPERFORM 134 8.31% 2 1.49%
Other Important Disclosures
Jefferies Equity Research refers to research reports produced by analysts employed by one of the following Jefferies Group LLC (“Jefferies”) groupcompanies:
United States: Jefferies LLC which is an SEC registered firm and a member of FINRA.
United Kingdom: Jefferies International Limited, which is authorized and regulated by the Financial Conduct Authority; registered in England andWales No. 1978621; registered office: Vintners Place, 68 Upper Thames Street, London EC4V 3BJ; telephone +44 (0)20 7029 8000; facsimile +44 (0)207029 8010.
Hong Kong: Jefferies Hong Kong Limited, which is licensed by the Securities and Futures Commission of Hong Kong with CE number ATS546; locatedat Suite 2201, 22nd Floor, Cheung Kong Center, 2 Queen’s Road Central, Hong Kong.
Singapore: Jefferies Singapore Limited, which is licensed by the Monetary Authority of Singapore; located at 80 Raffles Place #15-20, UOB Plaza 2,Singapore 048624, telephone: +65 6551 3950.
Japan: Jefferies (Japan) Limited, Tokyo Branch, which is a securities company registered by the Financial Services Agency of Japan and is a memberof the Japan Securities Dealers Association; located at Hibiya Marine Bldg, 3F, 1-5-1 Yuraku-cho, Chiyoda-ku, Tokyo 100-0006; telephone +813 52516100; facsimile +813 5251 6101.
India: Jefferies India Private Limited, which is licensed by the Securities and Exchange Board of India as a Merchant Banker (INM000011443) and a StockBroker with Bombay Stock Exchange Limited (INB011438539) and National Stock Exchange of India Limited (INB231438533) in the Capital MarketSegment; located at 42/43, 2 North Avenue, Maker Maxity, Bandra-Kurla Complex, Bandra (East) Mumbai 400 051, India; Tel +91 22 4356 6000.
This material has been prepared by Jefferies employing appropriate expertise, and in the belief that it is fair and not misleading. The information setforth herein was obtained from sources believed to be reliable, but has not been independently verified by Jefferies. Therefore, except for any obligationunder applicable rules we do not guarantee its accuracy. Additional and supporting information is available upon request. Unless prohibited by theprovisions of Regulation S of the U.S. Securities Act of 1933, this material is distributed in the United States ("US"), by Jefferies LLC, a US-registeredbroker-dealer, which accepts responsibility for its contents in accordance with the provisions of Rule 15a-6, under the US Securities Exchange Act of1934. Transactions by or on behalf of any US person may only be effected through Jefferies LLC. In the United Kingdom and European EconomicArea this report is issued and/or approved for distribution by Jefferies International Limited and is intended for use only by persons who have, or have
Technology
Internet
April 10, 2013
page 48 of 49 , Jefferies Equity Research, [email protected] US Internet Team
Please see important disclosure information on pages 45 - 49 of this report.

been assessed as having, suitable professional experience and expertise, or by persons to whom it can be otherwise lawfully distributed. JefferiesInternational Limited has adopted a conflicts management policy in connection with the preparation and publication of research, the details of whichare available upon request in writing to the Compliance Officer. Jefferies International Limited may allow its analysts to undertake private consultancywork. Jefferies International Limited’s conflicts management policy sets out the arrangements Jefferies International Limited employs to manage anypotential conflicts of interest that may arise as a result of such consultancy work. For Canadian investors, this material is intended for use only byprofessional or institutional investors. None of the investments or investment services mentioned or described herein is available to other personsor to anyone in Canada who is not a "Designated Institution" as defined by the Securities Act (Ontario). In Singapore, Jefferies Singapore Limited isregulated by the Monetary Authority of Singapore. For investors in the Republic of Singapore, this material is provided by Jefferies Singapore Limitedpursuant to Regulation 32C of the Financial Advisers Regulations. The material contained in this document is intended solely for accredited, expert orinstitutional investors, as defined under the Securities and Futures Act (Cap. 289 of Singapore). If there are any matters arising from, or in connectionwith this material, please contact Jefferies Singapore Limited, located at 80 Raffles Place #15-20, UOB Plaza 2, Singapore 048624, telephone: +656551 3950. In Japan this material is issued and distributed by Jefferies (Japan) Limited to institutional investors only. In Hong Kong, this report isissued and approved by Jefferies Hong Kong Limited and is intended for use only by professional investors as defined in the Hong Kong Securities andFutures Ordinance and its subsidiary legislation. In the Republic of China (Taiwan), this report should not be distributed. The research in relation tothis report is conducted outside the PRC. This report does not constitute an offer to sell or the solicitation of an offer to buy any securities in the PRC.PRC investors shall have the relevant qualifications to invest in such securities and shall be responsible for obtaining all relevant approvals, licenses,verifications and/or registrations from the relevant governmental authorities themselves. In India this report is made available by Jefferies India PrivateLimited. In Australia this information is issued solely by Jefferies International Limited and is directed solely at wholesale clients within the meaning ofthe Corporations Act 2001 of Australia (the "Act") in connection with their consideration of any investment or investment service that is the subject ofthis document. Any offer or issue that is the subject of this document does not require, and this document is not, a disclosure document or productdisclosure statement within the meaning of the Act. Jefferies International Limited is authorised and regulated by the Financial Conduct Authorityunder the laws of the United Kingdom, which differ from Australian laws. Jefferies International Limited has obtained relief under Australian Securitiesand Investments Commission Class Order 03/1099, which conditionally exempts it from holding an Australian financial services licence under theAct in respect of the provision of certain financial services to wholesale clients. Recipients of this document in any other jurisdictions should informthemselves about and observe any applicable legal requirements in relation to the receipt of this document.
This report is not an offer or solicitation of an offer to buy or sell any security or derivative instrument, or to make any investment. Any opinion orestimate constitutes the preparer's best judgment as of the date of preparation, and is subject to change without notice. Jefferies assumes no obligationto maintain or update this report based on subsequent information and events. Jefferies, its associates or affiliates, and its respective officers, directors,and employees may have long or short positions in, or may buy or sell any of the securities, derivative instruments or other investments mentioned ordescribed herein, either as agent or as principal for their own account. Upon request Jefferies may provide specialized research products or servicesto certain customers focusing on the prospects for individual covered stocks as compared to other covered stocks over varying time horizons orunder differing market conditions. While the views expressed in these situations may not always be directionally consistent with the long-term viewsexpressed in the analyst's published research, the analyst has a reasonable basis and any inconsistencies can be reasonably explained. This materialdoes not constitute a personal recommendation or take into account the particular investment objectives, financial situations, or needs of individualclients. Clients should consider whether any advice or recommendation in this report is suitable for their particular circumstances and, if appropriate,seek professional advice, including tax advice. The price and value of the investments referred to herein and the income from them may fluctuate. Pastperformance is not a guide to future performance, future returns are not guaranteed, and a loss of original capital may occur. Fluctuations in exchangerates could have adverse effects on the value or price of, or income derived from, certain investments. This report has been prepared independently ofany issuer of securities mentioned herein and not in connection with any proposed offering of securities or as agent of any issuer of securities. Noneof Jefferies, any of its affiliates or its research analysts has any authority whatsoever to make any representations or warranty on behalf of the issuer(s).Jefferies policy prohibits research personnel from disclosing a recommendation, investment rating, or investment thesis for review by an issuer priorto the publication of a research report containing such rating, recommendation or investment thesis. Any comments or statements made herein arethose of the author(s) and may differ from the views of Jefferies.
This report may contain information obtained from third parties, including ratings from credit ratings agencies such as Standard & Poor’s. Reproductionand distribution of third party content in any form is prohibited except with the prior written permission of the related third party. Third party contentproviders do not guarantee the accuracy, completeness, timeliness or availability of any information, including ratings, and are not responsible forany errors or omissions (negligent or otherwise), regardless of the cause, or for the results obtained from the use of such content. Third party contentproviders give no express or implied warranties, including, but not limited to, any warranties of merchantability or fitness for a particular purpose oruse. Third party content providers shall not be liable for any direct, indirect, incidental, exemplary, compensatory, punitive, special or consequentialdamages, costs, expenses, legal fees, or losses (including lost income or profits and opportunity costs) in connection with any use of their content,including ratings. Credit ratings are statements of opinions and are not statements of fact or recommendations to purchase, hold or sell securities. Theydo not address the suitability of securities or the suitability of securities for investment purposes, and should not be relied on as investment advice.
Jefferies research reports are disseminated and available primarily electronically, and, in some cases, in printed form. Electronic research issimultaneously available to all clients. This report or any portion hereof may not be reprinted, sold or redistributed without the written consent ofJefferies. Neither Jefferies nor any officer nor employee of Jefferies accepts any liability whatsoever for any direct, indirect or consequential damagesor losses arising from any use of this report or its contents.
For Important Disclosure information, please visit our website at https://javatar.bluematrix.com/sellside/Disclosures.action or call 1.888.JEFFERIES
© 2013 Jefferies Group LLC
Technology
Internet
April 10, 2013
page 49 of 49 , Jefferies Equity Research, [email protected] US Internet Team
Please see important disclosure information on pages 45 - 49 of this report.


