International Wine Report: US and Brazil AGB 443 Amy Guerra, Caylie Soon, Wil Dasovich, Matt Murray.
47
International Wine Report: US and Brazil AGB 443 Amy Guerra, Caylie Soon, Wil Dasovich, Matt Murray
-
Upload
rolf-cunningham -
Category
Documents
-
view
217 -
download
0
Transcript of International Wine Report: US and Brazil AGB 443 Amy Guerra, Caylie Soon, Wil Dasovich, Matt Murray.

International Wine Report:US and Brazil
AGB 443Amy Guerra, Caylie Soon,
Wil Dasovich, Matt Murray
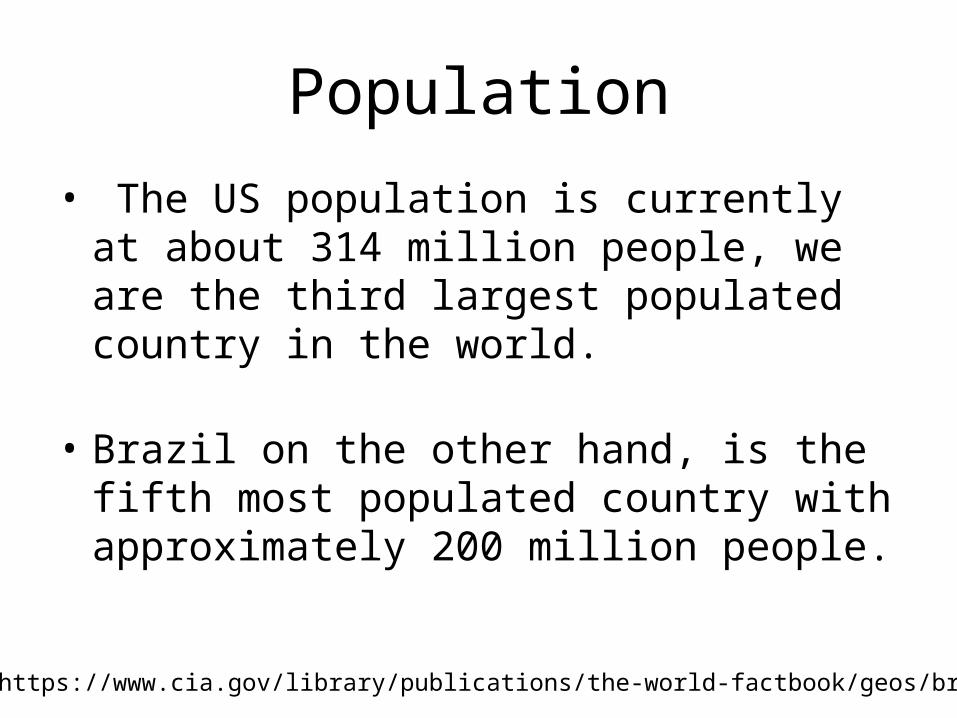
Population
• The US population is currently at about 314 million people, we are the third largest populated country in the world.
• Brazil on the other hand, is the fifth most populated country with approximately 200 million people.
Source: https://www.cia.gov/library/publications/the-world-factbook/geos/br.html

Brazil
• The colors of the Brazilian flag were first used to represent the first emperor and empress of the Brazilian Empire, which started in 1822.
• Currently, the green background is symbolic of the luscious plant life throughout the country; the yellow is for the abundance of minerals and the blue is for the sky that shines over state Rio de Janeiro.
• There are also 27 stars for each state that exists in the country
Source: https://www.cia.gov/library/publications/the-world-factbook/geos/br.html

United States of America
• The United States flag is similar the Brazilin flag in that it has a white star to represent each state in the country, only difference is there are more stars on the American flag, 50 to be exact.
• The red and white stripes are symbolic of the original 13 colonies. The red, white and blue coloring represent things like loyalty, courage, friendship and purity.
Source: https://www.cia.gov/library/publications/the-world-factbook/geos/br.html

Country MapsBrazil United States
Source: https://www.cia.gov/library/publications/the-world-factbook/geos/br.html

• The GDP total in Brazil is $2.324 trillion, this puts them in the 8th highest spot in comparison with the rest of the world.
• Brazil has a GDP growth rate of 2.7%, while the GDP per capita is $11,900.
• The average income for a family in Brazil is less than $4,477.40.
• The unemployment rate is at about 6%, this puts Brazil in the 63rd spot in comparison to the rest of the world.
Sources: https://www.cia.gov/library/publications/the-world-factbook/geos/br.html
http://www.oecdbetterlifeindex.org/countries/brazil/
Brazil Economic Statistics

Currency Values
• These are the values of what a US dollar would be in real (Brazilian currency) in the years 2007 to 2011:
1.85 (2007) 1.8644 (2008)2 (2009)1.7592 (2010 est.) 1.6728 (2011 est.)
• One US dollar was worth more than one real in all of these years, this was not a good thing for Brazil.
Source: https://www.cia.gov/library/publications/the-world-factbook/geos/br.html

United States Economic Statistics
• The GDP total in the US is $15.29 trillion, this makes the United States rank two in the world in terms of GDP.
• The Unites States has a GDP growth rate of 1.7%.• The average income for a US family is $51,941. • The GDP per capita is $49,000, this is more than
quadruple the amount of Brazil. • Higher than Brazil, the US has a 9%
unemployment rate, ranking 103 in the world. Source: https://www.cia.gov/library/publications/the-world-factbook/geos/br.htmlhttp://quickfacts.census.gov/qfd/states/00000.html

Headlines and Trends in Brazil• Brazil has seen a 13% increase in wine sales in terms of volume, and
expect it to keep rising.• Still light wines were a popularly growing wine type in 2011, this lead
Brazil along with importing countries to spend more money on improving these types of wines.
• Improvement was good and raised demand for a higher quality product, but it lead to higher wine prices, by 6%, and eventually inflation because of the competing countries.
• Sparkling wine was second in line for popularity in Brazil; this is because sparkling wine has recently become a beverage served at more than just a New Years Celebration!
• As of 2011, off-trade still wine consumption was dominant. • The sales of sparkling wine increased on-trade in 2011 due to the higher
availability of premium wines in clubs and restaurants.
Source: http://www.portal.euromonitor.com/Portal/Pages/Search/SearchResultsList.aspx

Headlines and Trends in the US• Sales grew minimally in the US in 2011; this is due to the recent recession
that occurred in 2009. • During the US recession in 2009 off-trade wine sales increased, but in 2011
on-trade sales dominated the off-trade sales proving to the wine industry that wine would always keep the tourist coming.
• In 2011, sparkling wine in the US was the fastest growing in terms of popularity, 5% in value, this has happened because of the more universal demand for the tasty and appealing beverage.
• Still rose wines seemed to, as usual, not do so well in the year of 2011. There was a 3% decrease in volume sales.
• Some foreign wines have quickly gained recognition in the US (Yellow Tail), creating competition for US wines.
• Overall, the trends in the US are relatively in line with what would be expected based on economic stance and traditional demand patterns.
Source: http://www.portal.euromonitor.com/Portal/Pages/Search/SearchResultsList.aspx

Product• In the last 3 years, the US produced 7,743.7 million liters of
wine, while Brazil produced only 1,097.9million liters, that’s more than 7 times less.
• From 2010 to 2011, wine production increased by 1.4%, and over the last 5 years, there was a 10% growth. If there was an average growth of 2% per year, 2010 was below average.
• Brazil had a whopping 15.2% growth rate in 2010, this year was big for Brazil especially considering that in the last five years there was a 22.4% growth rate.
• Even though Brazil produces significantly less wine, their growth in 2010 alone surpassed the US by 13.8%.
Source: http://www.portal.euromonitor.com/Portal/Pages/Search/SearchResultsList.aspx

Product
• Sparkling wine production in the US increased by 4.4% in 2010, and in the last five years it increased by 13.5%
• Just like the overall total growth rate of wine in Brazil, the rate of growth for sparkling wine specifically grew by 11.9%, over the last five years in grew in 55.5%.
Source: http://www.portal.euromonitor.com/Portal/Pages/Search/SearchResultsList.aspx

Total dollar sales of still light grapes & sparkling wine (millions of dollars)
2009 2010 2011
U.S. 30,513.40 31,580.10 32,429.00
Brazil 3,616.21 3,858.84 4,713.99
• Total dollar sales for still light grapes and sparkling wine have been increasing in both the U.S. and Brazil consistently.
2010-2011 2006-2011 Total
U.S. 3.85% 13.05%
Brazil 21.05% 83.85%
Total dollar sales of still light grapes & sparkling wine (% value growth)
Source: GMID

Sales of Still Red Wine by Grape/Varietal Type 2009-2011 (% total volume)
U.S.
2009 2010 2011
Cabernet Sauvignon 26.5 25.2 25.3
Lambrusco 0.8 0.8 0.7
Merlot 25.2 24.8 24.1
Pinot Noir 4.9 5.0 5.2
Shiraz/Syrah 6.4 5.9 5.5
Zinfandel 2.2 2.3 2.3
Others 34.0 36.0 36.8Total 100 100 100
Brazil
2009 2010 2011
Cabernet Franc 6.0 5.9 5.7
Cabernet Sauvignon 33.0 29.7 27.2
Malbec 10.4 10.7 11.1
Merlot 11.2 11.7 12.3
Shiraz/Syrah 7.2 7.6 7.9
Others 32.2 34.5 35.8
Total 100.0 100.0 100.0
• Cabernet Sauvignon had the highest percent total volume sales in both the U.S. and Brazil.
Source: GMID

Sales of Still White Wine by Grape/Varietal Type 2009-2011
(% total volume)
U.S.
2009 2010 2011
Chardonnay 49.0 48.7 47.7
Chenin Blanc 0.5 0.6 0.5
French Colombard 1.2 1.3 1.3
Garnacha/Grenache 4.1 4.0 3.0
Pinot Grigio/Pinot Gris 12.0 12.1 12.4
Riesling 5.6 5.7 5.7
Sauvignon/Fume Blanc 6.9 7.1 7.1
Others 20.7 20.5 22.3
Total 100 100 100
• Chardonnay had the highest percent total volume sales in both the U.S. and Brazil.
Brazil
2009 2010 2011
Chardonnay 46.9 47.2 47.6
Gewürztraminer 4 4 3.9
Riesling 5.2 5.4 5.8
Sauvignon Blanc 22.3 22.4 22.6
Others 21.5 21 20.1
Total 100 100 100
Source: GMID

Sales of Still Rose Wine by Grape/Varietal Type 2009-2011 (% total volume)
2009 2010 2011
Zinfandel White 48.0 48.3 48.5
Others 52.0 51.7 51.5
Total 100.0 100.0 100.0
• Zinfandel White had the highest percent total volume sales in the U.S. while Syrah had the highest percent total volume sales in Brazil.
U.S. Brazil2009 2010 2011
Gamay 3.1 3.1 3.2Shiraz/Syrah 27.8 27.6 27.5Others 69.1 69.3 69.3Total 100 100 100
Source: GMID

Total Volume of Imports and Exports in 2010 (in million liters)
liters % apparent consumption
Apparent Consumption
3,286.0 71%
Production 2,738.4
Imports 947.4
Exports 399.8
U.S.
liters % apparent consumption
Apparent Consumption
- N/A
Production - N/A
Imports 73.8 N/A
Exports 18 N/A
Brazil
Source: GMID
• The US consumes 71% of the total wine produced in the US• There is no record of the apparent amount of wine consumption in Brazil

Wine Exports by Country of Destination in 2010 (in million liters and % by liters)
liters % by LUnited Kingdom 126.6 32Italy 62.7 17Canada 51.5 12Japan 24.0 6Germany 22.4 5Hong Kong 20.9 5China 12.4 3Denmark 7.2 2Switzerland 7.1 2Other 68 17Total 399.8 100
U.S.liters % by L
Russia 8.4 46Paraguay 5.8 32Bolivia 2.6 14Mexico 0.3 2Japan 0.2 1US 0.2 1
United Kingdom 0.1 .5
Angola 0.1 .5Others 0.1 .5Total 18.0 100
Brazil
• The U.S. exports most of its wine to the U.K. while Brazil exports its wine primarily to Russia.
Source: GMID

Wine Exports by County of Destination in 2010 (total value in million dollars and percentage by value)
Dollars % by valueCanada 293.5 26United Kingdom 220.8 20
Hong Kong 117.2 11Japan 75.1 7Italy 56.0 5Germany 45.5 4China 43.6 4France 25.2 2Switzerland 24.0 2other 210.9 19Total 1,110 100
Brazilian Real U.S. Dollars % by valueRussia 4.33 1.97 33
US 1.93 .88 15
Angola 1.61 .73 12
Paraguay 1.19 .54 9United Kingdom .66 .30 5
Netherlands .66 .30 5
Belgium .44 .20 3
Japan .44 .20 3
Germany .33 .15 2.5
other 1.61 .73 12
Total 13.2 6 100
U.S. Brazil
• The majority of U.S. total value in exports is in Canada and the U.K. while the highest value in total exports for Brazil is Russia.
Source: GMID

Wine Imports by Country of Origin in 2010 (in million Liters and percentage by liters)
liters %Italy 254.0 27Australia 212.9 23Chile 122.7 13France 93.1 10Argentina 87.9 9Spain 55.4 6New Zealand 31.8 3Germany 30.7 3Canada 14.0 1Others 44.9 5Total 947.4 100
liters %Chile 26.0 35
Argentina 18.1 25
Italy 13.0 18
Portugal 8.1 11
France 3.6 5
Spain 2.0 3
Uruguay 1.3 2
South Africa 0.9 1
Australia 0.3 .4
Other 0.5 .6
Total 73.8 100
U.S. Brazil
• The U.S. imports most of its wine from Italy and Australia as Brazil imports mostly from Chile and Argentina
Source: GMID

Wine Imports by Country in 2010 (total value)
US (Million Dollars) %Italy 1,283.7 31France 1,016.7 25Australia 609.4 15Chile 278.1 7Argentina 271.1 6.5Spain 268.7 6
New Zealand 198.7 5
Germany 140.5 3Portugal 68.7 2Others 12.2 0.5Total 4147.8 100
U.S. BrazilReal (U.S. dollars %
Chile 139.7 (63.50) 29Argentina 106.4 (48.36) 22France 68.3 (31.06) 14Italy 63.9 (29.04) 13Portugal 57.2 (25.98) 12Spain 20.3 (9.22) 4South Africa 7 (3.20) 1Uruguay 6.2 (2.81) 1Australia 3.6 (1.63) .7Other 7.5 (3.40) 1.5Total 480 (218.20) 100
• Italy and France imported the highest dollar value from the U.S. as Chile and Argentina imported the highest dollar value from Brazil.
Source: GMID

2011 Top 10 Company Shares of StillLight Grape Wine by National Owner
Company % Share1 E&J Gallo Winery Inc. 23.22 The Wine Group Inc. 16.73 Vine One 74 Trinchero Family Estates 5.45 Treasury Wine Estates Ltd. 56 Centerra Wine Co. 4.37 Bronco Wine Co. 3.88 WJ Deutsch & Sons 3.49 Ste Michelle Wine Estates 2.510 Plam Bay International Inc. 2.3
Company % Share1 Cooperativa Vinicola Aurora Ltda 7.12 Vinhos Salton SA Industria e Comercio Ltda 3.63 Vinicola Miolo Ltda 3.14 Bacardi-Martini do Brasil Industria e
Comercio Ltda 2.7
5 Expand Importadora Ltda 26 Trop Cla de Comercio Exterior Ltda 1.67 Interfood Importacao Ltda 1.68 Cooperativa Vinicola Garibaldi Ltda 0.99 Carrefor Comercio e Industria Ltda 0.810 Diageo Brasil Ltda 0.7
US Brazil
Source: Euromonitor International from official statistics, trade associations, trade press, company research, store checks, trade interviews, trade sources

Top 3 Brands
US: 1. 2. 3.
Brazil: 1. 2. 3.

Top 3 Brands Price Packaging & VarietalsUS:
E&J Gallo Winery produces varietals such as Cabernet Sauvignon, Chardonnay, and Merlot. Prices range from $6 a bottle to $72 per case.
The Wine Group is known for Franzia boxed wine. Franzia distributes Chardonnay, White Zin, Merlot, and Sangria. Typically $9 to $12 a per box).
Vine One is a wholesale wine distributor. They produce wine varietals such as Chardonnay and Cabernet Sauvignon.
Brazil:
Cooperativa Vinicola Aurora Ltda is located in Southern Brazil in a place called Bento Goncalves. It is the largest wine cooperative in Brazil containg over 1,100 different families. It’s most popular is the brand name Marcus James. Which produces Chardonnay and Tempranillo for $10 to $15 a bottle.
Vinhos Salton SA Industria e Comercio creates the Salton brand name wine. Their Merlot and blends go for $360 per 6 pack of wine on the US market. It is also located in Bento Goncalves. This municipality is the largest producer of wine in all of Brazil.
Vinicola Miolo Ltda distributes the popular brand of Miolo. Miolo has been around since 1897 and creates Merlot, Cabernet Suvignon, and Gewurtraminer. Bottles price from $50 to $300.

Percentage Share of Top 10 Brands and Remaining Brands
Top 10 RemainingUS 73.6% 26.4%
Brazil 24.1% 75.9%
• The top 10 brands in Brazil do not control the majority of the market unlike US wines.
• Interestingly enough, the top 10 percentage for US is very similar to Brazil’s remaining companies.

Global Company Volume Shares of Still Light Grape Wine in 2011
Company % Share1 E&J Gallo Winery Inc 22.92 The Wine Group Inc 16.73 Constellation Brand Inc. 124 Trinchero Family Estates 5.45 Treasury Wine Estates Wine
Ltd5
6 Bronco Wine Co 3.87 Casella Wines Pty Ltd 38 Altria Group Inc 2.59 Vina Concha y Toto SA 2.110
Kendall-Jackson Wine Estates 1.9
Company % Share
1 Cooperativa Vinicula Aurora Ltda 7.1
2 Vinhos Salton SA Industria e Comercio
3.6
3 Vinicola Miola Ltda 3.1
4 Bacardi & Co Ltda 2.6
5 Vina Concha y Toro SA 1.6
6 Cia Cervecerias Unidas SA 1
7 Cooperativa Vinicola Garibaldi Ltda 0.9
8 Grupo Penaflor SA 0.8
9 Diageo Plc 0.7
10 Reh Kendermann 0.3
US Brazil

Top Three Global Company’s Top Brands
US:1. E&J Gallo Winery Inc: Barefoot Cellars, Carlo Rossi, Gallo Family Vineyard2. The Wine Group Inc.: Franzia, Concannon, Paul Masson Winery3. Constellation Brands Inc.: Robert Mondavi, Clos Du Bois, Blackstone

Top Three Global Companies Top Brands
Brazil:1. Cooperativa Vinicola Aurora Ltda: Dawn, Marcus James, Clos des Nobles2. Vinhos Salton SA Industria e Comercio: Vinicola Salton, Francesca Dinaldo and Figli, Prosecco3. Vinicola Miolo Ltda: Miolo, Terranova, Serval Estate

Percentage Share of Top 10 Global Companies and Remaining Brands
Top 10 Remaining
US 75.3% 24.7%
Brazil 21.7% 78.3%
Similarly to National sales, the top 10 Brazilian wines do not control the global market of wine sales. Even though they have been steadily increasing the past 5 years.
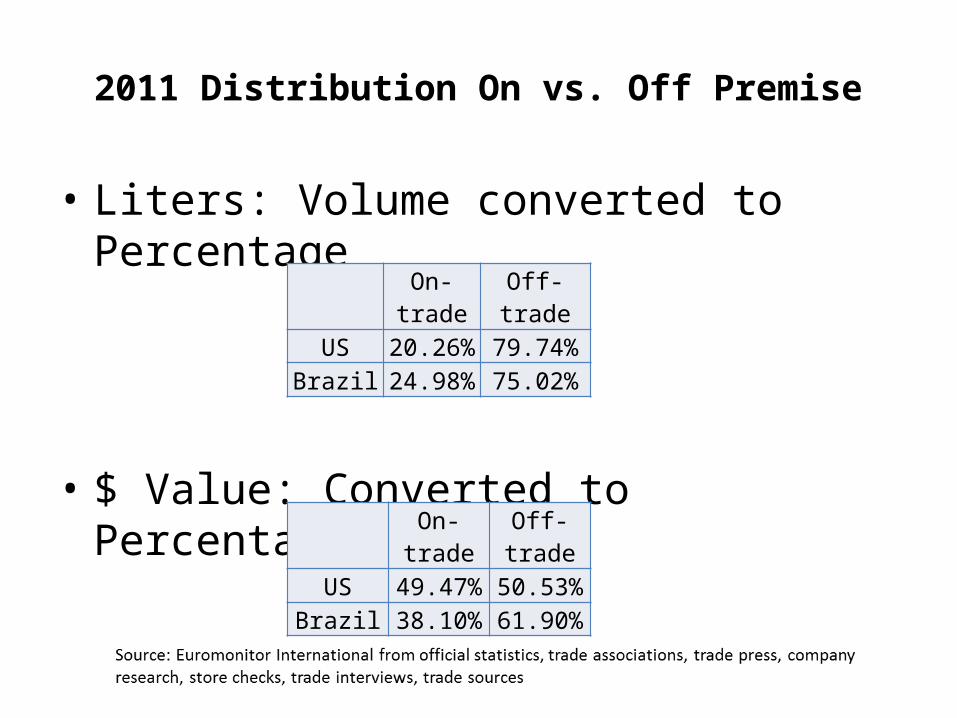
2011 Distribution On vs. Off Premise
• Liters: Volume converted to Percentage
• $ Value: Converted to Percentages
On-trade Off-tradeUS 20.26% 79.74%
Brazil 24.98% 75.02%
On-trade Off-tradeUS 49.47% 50.53%
Brazil 38.10% 61.90%

Percent Volume of Red Wine Sales by Price Category in 2011
• Exchange Rate: 1 Brazilian Real=0.4918 US Dollar
Price Category % Volume
Under $3.99 25.0
$4 to $9.49 37.8
$9.50 to $13.49 20.3
$13.50 to $18.49 7.9
$18.50 and above 9.1
Price Category US Dollar Value % Volume
Under R$4.99 Under $2.45 4.2
R$5 to R$9.99 $2.45 to $4.91 48.1
R$10 to R$23.99 $4.91 to $11.78 33.8
R$24 to R$64.99 $11.79 to $19.64 7.4
R$40 to R$64.99 $19.65 to $31.93 3.2
R$65 and above $31.94 and above 3.3
US Brazil

Percent Volume of White Wine Sales by Price Category in 2011
• Exchange Rate: 1 Brazilian Real=0.4918 US Dollar
Price Category US Dollar Value % VolumeUnder R$4.99 Under $2.44 3.7R$5 to R$9.99 $2.45 to $4.91 17.4
R$10 to R$15.99 $4.91 to $7.85 28.3R$16 to R$23.99 $7.86 to $11.78 35.4R$24 to R$39.99 $11.79 to $19.64 7.4R$40 to R$64.99 $19.65 to $31.93 4.1R$65 and above $31.94 and above 3.7
Price Category % Volume
Under $3.99 28.2
$4 to $9.49 36.6
$9.50 to $13.49 19.8
$13.50 to $18.49 7.5
$18.50 and above 7.9
US Brazil

Main Wine Growing Regions
US:• California (Napa, Sonoma, Central Coast), Washington, &
Oregon(http://www.winespectator.com/webfeature/show/id/42427)
Brazil• Rio Grande do Soul (Serra Gaucha, Campanha, Serra do Sudeste
and Campos de Cima da Serra) (http://www.winesofbrasil.com/Content.aspx?id=3)
• These areas are the best places in Brazil to grow grapes because they are below the equator. Anywhere closer to the equator would be too hot and grapes would not be able to survive.
• Bento Goncalves, home to many of the top companies in Brazil, is located near all of the regions.

Edna Valley Growing Region
• 51 wineries produce wines with the Edna Valley designation– 23 resident wineries (production facilities or
estates within the boundaries)– 28 non-resident wineries (producers outside the
appellation)
Source: http://wine.appellationamerica.com/wine-region/Edna-Valley.html

Edna Valley Growing Region
• Grape Varieties– Albarino– Chardonnay– Grenache– Merlot– Mourvedre/Mataro– Petite Syrah
– Pinot Gris/Grigio– Pinot Noir– Sauvignon Blanc– Syrah/Shiraz– Viognier– Zinfandel
Source: http://wine.appellationamerica.com/wine-region/Edna-Valley.html

Three Wineries in the Edna Valley
• Tolosa Winery– Average Pricing: Mid $30’s
Source: http://www.tolosawinery.com

Three Wineries in the Edna Valley
• Talley Vineyards– Average Pricing: $26-$36
Source: http://www.talleyvineyards.com

Three Wineries in the Edna Valley
• Salisbury Vineyards– Average pricing: Mid $20’s
Source: http://www.salisburyvineyards.com

Percentage of Wines Sold
• Red Wine – US: 9.1% volume sold at $18.5 and above– Brazil: 6.5% volume sold at $19.65 and above
• White Wine– US: 7.9% volume sold at $18.5 and above– Brazil: 7.8% volume sold at $19.65 and above

Legal Drinking Age & Wine Consumers
• United States– 21 years old– 193,671,000
population 21+
• Brazil– 18 years old– 118,583,576
population 18+
Sources: http://drinkingage.procon.org/view.resource.php?resourceID=004294http://wiki.answers.com/Q/What_is_US_population_over_21_years_oldhttps://www.cia.gov/library/publications/the-world-factbook/geos/br.html
• There are no regions in Brazil that prohibit the sale or consumption of wine.

Trade Agreements between US and Brazil
• US-Brazil Joint Initiative on Urban Sustainability
• Bilateral Tax Treaty• Removal of tariffs and subsidies on renewable
energy products• Discussions on Free Trade Agreement
Source: http://trade.gov/publications/ita-newsletter/0411/brazil.asp

Labeling Regulations in the US
• Vintage Date• Estate Bottled• Appellations of Origin• American Viticultural Areas• Alcohol Content• Declaration of Sulfites• Health Warning Statement• Brand Name• Varietal Designations
• Foreign Nongeneric Names Which Are Distinctive Designations of Specific Grape Wines
• Name and Address• Net Contents• Caloric and Carbohydrate
Representations• Voluntary Disclosure of Major
Food Allergens
Source: http://www.ttb.gov/pdf/brochures/p51901.pdf

Labeling Regulations in Brazil
• Brand name of product• Type of Product• Net Contents• Importer’s name,
address, and corporate ID number
• Producer or Manufacturer’s name and address
• MAPA Registration number of importer
• Country or Origin• Alcohol content• List of ingredients• Lot identification code • Period of validity• Gluten declaration• Warning statement
Sources: http://www.ttb.gov/itd/brazil.shtml

Summary
• Even though Brazil produces a lot less wine than the United States, Brazil’s wine industry has grown significantly more in a short period of time when compared to the United States.
• In both the United States and Brazil, sparkling wine is a highly popular beverage that is a large part of the wine industry. This popular celebration drink has become more mainstream in places like bars, restaurants and clubs.

Summary
• Top 3 brands are located in Bento Goncalves• There is an increase in volume purchase of
wines costing $5 and above in Brazil for both Red and White
• Top 10 brands in Brazil do not hold a majority of the market share unlike the US

Bibliography• http://www.portal.euromonitor.com/Portal/Pages/Search/
SearchResultsList.aspx• https://www.cia.gov/library/publications/the-world-factbook/geos/
br.html• http://quickfacts.census.go/qfd/states/00000.html• http://www.oecdbetterlifeindex.org/countries/brazil• http://www.winesofbrasil.com/Content.aspx?id=3• http://www.winespectator.com/webfeature/show/id/42427

Bibliography• http://wine.appellationamerica.com/wine-region/Edna-Valley.html• http://www.tolosawinery.com• http://www.talleyvineyards.com• http://www.salisburyvineyards.com• http://drinkingage.procon.org/view.resource.php?resourceID=004294• http://wiki.answers.com/Q/What_is_US_population_over_21_years_old• https://www.cia.gov/library/publications/the-world-factbook/geos/
br.html• http://trade.gov/publications/ita-newsletter/0411/brazil.asp• http://www.ttb.gov/pdf/brochures/p51901.pdf• http://www.ttb.gov/itd/brazil.shtml• GMID database website


![TERMS AND CONDITIONS zt{ / aGb]h · TERMS AND CONDITIONS zt{ / aGb]h ... 8](https://static.fdocuments.net/doc/165x107/5ecb9c6360da650bc655f7ac/terms-and-conditions-zt-agbh-terms-and-conditions-zt-agbh-8.jpg)