International whole industry including train...
203
International whole industry including train operating cost benchmarking Final report to the Rail Value for Money Study Department for Transport / Office of Rail Regulation Hamburg, May 9 th , 2011
Transcript of International whole industry including train...

International whole industry including train operating cost benchmarking
Final report to the Rail Value for Money Study
Department for Transport / Office of Rail Regulation
Hamburg, May 9th, 2011

20
11
05
23
_civ
ity_
Wh
ole
Ind
ustr
yC
ostB
en
ch
ma
rkin
g.p
ptx
©
civ
ity 2
01
0 /
//
2
Although this report was commissioned jointly by the Department for Transport (DfT) and the Office of Rail Regulation (ORR), the findings and recommendations are those of the authors and do not necessarily represent the views of the DfT and the ORR. While the DfT and the ORR have made all reasonable efforts to ensure the information in this document is accurate, the DfT and the ORR do not guarantee the accuracy, completeness or usefulness of that information; and cannot accept liability for any loss or damages of any kind resulting from reliance on the information or guidance this document contains. Department for Transport Office of Rail Regulation Great Minster House 1 Kemble Street 76 Marsham Street London London SW1P 4DR WC2B 4AN Telephone: 0300 330 3000 Telephone: 020 7282 2000 Website: www.dft.gov.uk Website: www.rail-reg.gov.uk
Crown copyright, 2011, except where otherwise stated You may re-use this information (not including logos or third-party material) free of charge in any format or medium, under the terms of the Open Government Licence. To view this licence, visit www.nationalarchives.gov.uk/doc/open-government-licence/ or write to the Information Policy Team, The National Archives, Kew, London TW9 4DU, or e-mail: [email protected]. To reproduce third-party material you need to obtain permission from the copyright holders concerned.
20
11
05
23
_civ
ity_
Wh
ole
Ind
ustr
yC
ostB
en
ch
ma
rkin
g.p
ptx
©
civ
ity 2
01
0 /
//
Content page
1. Introduction 3
2. Market development and structures 12
3. Performance 61
4. Infrastructure 71
5. Train operations (incl. Rolling stock) 116
6. Freight train operations 150
7. Funding and revenues 152
8. Market analysis Germany 162
9. Methodology 185
10. Conclusions 195
3

20
11
05
23
_civ
ity_
Wh
ole
Ind
ustr
yC
ostB
en
ch
ma
rkin
g.p
ptx
©
civ
ity 2
01
0 /
//
The Whole Industry Cost Benchmarking is part of DfT's and ORR's "Value for Money"-studies
Background
• The aim of the study is to examine railway systems in GB and other European
countries and to compare costs, revenues and outputs
• The scope of the study mainly encompasses
– The identification and breakdown of whole industry costs, consisting of
infrastructure, train operations and rolling stock
– The application of normalisation procedures to make costs comparable across
countries
– The identification of staff employed in different functions, including the cost for
employment
– The outputs produced in each country such as train kilometres, passenger
kilometres and tonnage, including development over time
– The funding and revenue streams of each country and the flow of financial means
– The underlying frameworks in the different countries, for example market structures,
allocation of responsibilities and different accounting treatments
4

20
11
05
23
_civ
ity_
Wh
ole
Ind
ustr
yC
ostB
en
ch
ma
rkin
g.p
ptx
©
civ
ity 2
01
0 /
//
A large share of the data and information has been provided directly by the railways
Approach (1 of 2)
• The study is based on data and information from a total of four "core countries" (GB,
France, Sweden and The Netherlands) and supplementary information from Germany
and Switzerland, covering a large number of infrastructure managers, train and freight
operators as well as rolling stock providers
• However, the approach to collect and discuss the data varies from country to country:
– GB
Data has been provided by DfT/ORR on 19 train operating companies, data from
Network Rail has been collected through a questionnaire
– Germany
The focus has been on the effects of public tendering services in regional services;
the data has been based on research
– France
Data have been provided by the infrastructure manager RFF and by SNCF through
a questionnaire
5
20
11
05
23
_civ
ity_
Wh
ole
Ind
ustr
yC
ostB
en
ch
ma
rkin
g.p
ptx
©
civ
ity 2
01
0 /
//
A large share of the data and information has been provided directly by the railways
Approach (2 of 2)
– Sweden
The data on Sweden's infrastructure have been provided by Trafikverket through a
questionnaire; data on SJ had to be gathered through research
– Switzerland
Data on Switzerland have been used partially and were collected through publicly
available sources
– The Netherlands
Both Nederlandse Spoorwegen as ProRail have provided their data and information
through a questionnaire
• Generally, data were requested for the year 2009
• For France, Sweden and The Netherlands data completeness and consistency was
assured by the means of meetings and personal contacts to discuss the input
• We are very grateful for the contribution made by all peers and DfT's/ORR's value for
money-team. Without their intensive support this study would not have been feasible
6
20
11
05
23
_civ
ity_
Wh
ole
Ind
ustr
yC
ostB
en
ch
ma
rkin
g.p
ptx
©
civ
ity 2
01
0 /
//
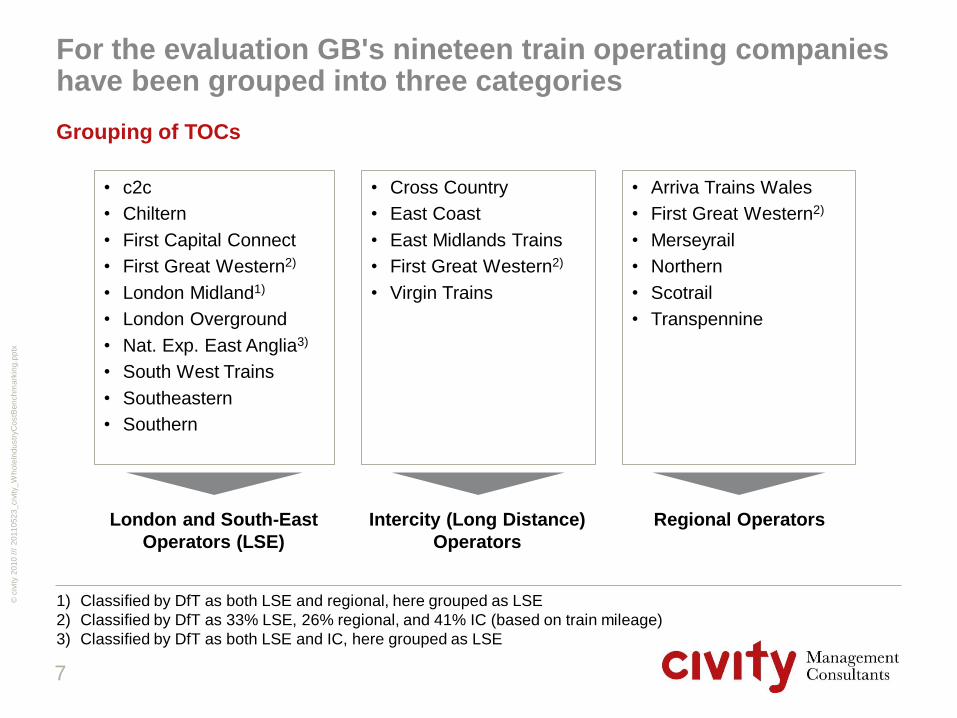
For the evaluation GB's nineteen train operating companies have been grouped into three categories
Grouping of TOCs
7
• c2c
• Chiltern
• First Capital Connect
• First Great Western2)
• London Midland1)
• London Overground
• Nat. Exp. East Anglia3)
• South West Trains
• Southeastern
• Southern
• Arriva Trains Wales
• First Great Western2)
• Merseyrail
• Northern
• Scotrail
• Transpennine
London and South-East
Operators (LSE)
Regional Operators
1) Classified by DfT as both LSE and regional, here grouped as LSE
2) Classified by DfT as 33% LSE, 26% regional, and 41% IC (based on train mileage)
3) Classified by DfT as both LSE and IC, here grouped as LSE
• Cross Country
• East Coast
• East Midlands Trains
• First Great Western2)
• Virgin Trains
Intercity (Long Distance)
Operators
20
11
05
23
_civ
ity_
Wh
ole
Ind
ustr
yC
ostB
en
ch
ma
rkin
g.p
ptx
©
civ
ity 2
01
0 /
//
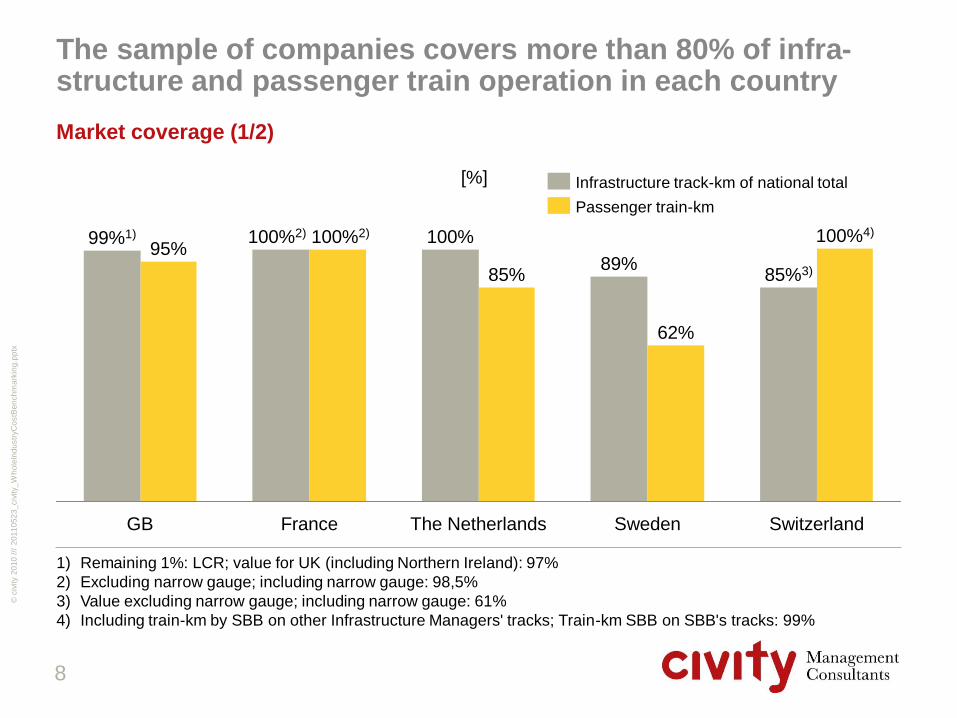
The sample of companies covers more than 80% of infra-structure and passenger train operation in each country
Market coverage (1/2)
8
GB The Netherlands France
99%1) 100%2) 100%2) 100%
85%
Sweden Switzerland
85%3)
62%
89% 95%
100%4)
Passenger train-km
Infrastructure track-km of national total [%]
1) Remaining 1%: LCR; value for UK (including Northern Ireland): 97%
2) Excluding narrow gauge; including narrow gauge: 98,5%
3) Value excluding narrow gauge; including narrow gauge: 61%
4) Including train-km by SBB on other Infrastructure Managers' tracks; Train-km SBB on SBB's tracks: 99%
20
11
05
23
_civ
ity_
Wh
ole
Ind
ustr
yC
ostB
en
ch
ma
rkin
g.p
ptx
©
civ
ity 2
01
0 /
//
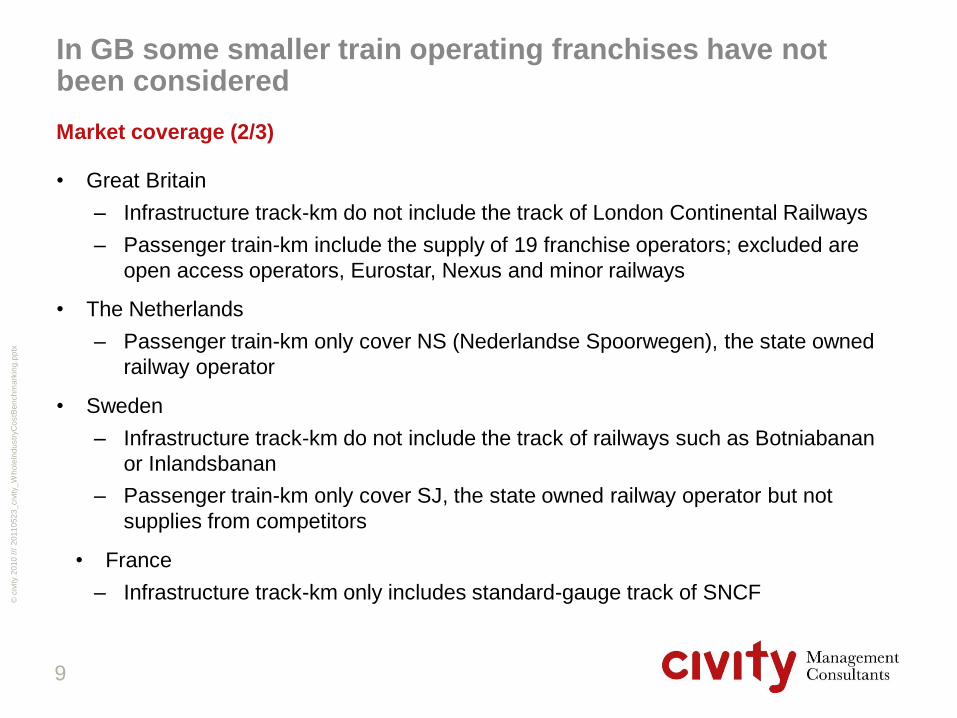
In GB some smaller train operating franchises have not been considered
Market coverage (2/3)
• Great Britain
– Infrastructure track-km do not include the track of London Continental Railways
– Passenger train-km include the supply of 19 franchise operators; excluded are
open access operators, Eurostar, Nexus and minor railways
• The Netherlands
– Passenger train-km only cover NS (Nederlandse Spoorwegen), the state owned
railway operator
• Sweden
– Infrastructure track-km do not include the track of railways such as Botniabanan
or Inlandsbanan
– Passenger train-km only cover SJ, the state owned railway operator but not
supplies from competitors
• France
– Infrastructure track-km only includes standard-gauge track of SNCF
9

20
11
05
23
_civ
ity_
Wh
ole
Ind
ustr
yC
ostB
en
ch
ma
rkin
g.p
ptx
©
civ
ity 2
01
0 /
//
In GB some smaller train operating franchises have not been considered
Market coverage (3/3)
• Switzerland
– Infrastructure track-km do only include SBB's network but not any track of
private railway lines
– Passenger train-km do only include passenger-km of SBB-trains. Passenger
train-km of SBB trains on other infrastructure managers' track are also included
10
20
11
05
23
_civ
ity_
Wh
ole
Ind
ustr
yC
ostB
en
ch
ma
rkin
g.p
ptx
©
civ
ity 2
01
0 /
//
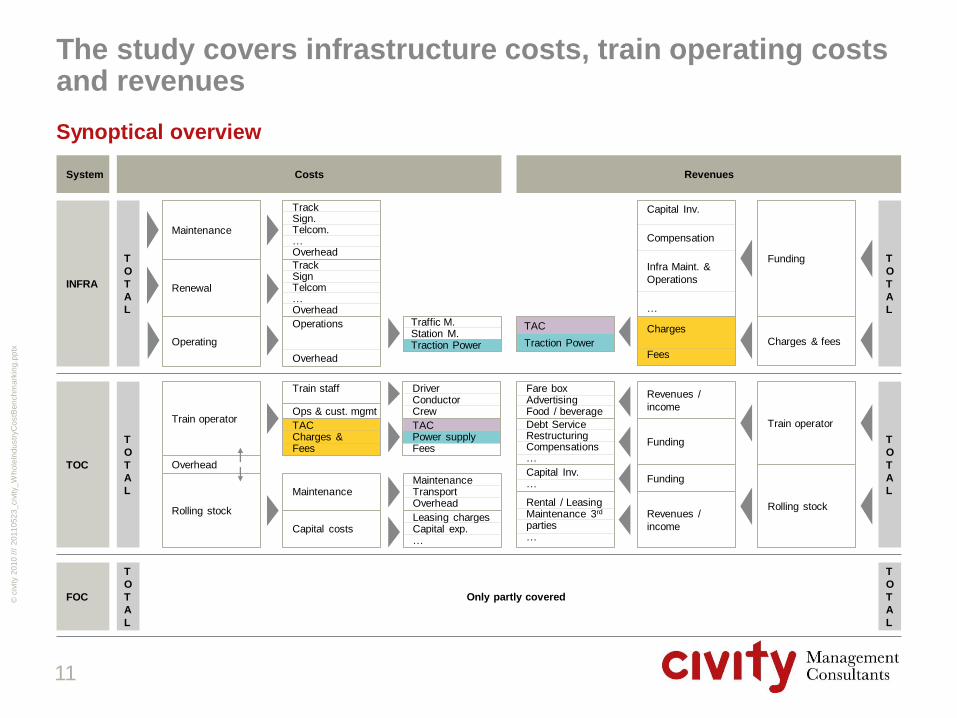
The study covers infrastructure costs, train operating costs and revenues
Synoptical overview
11
System Costs Revenues
INFRA
TOC
FOC
T
O
T
A
L
T
O
T
A
L
T
O
T
A
L
T
O
T
A
L
T
O
T
A
L
T
O
T
A
L
Maintenance
Renewal
Operating
Traffic M. Station M. Traction Power
Track Sign. Telcom. … Overhead
Operations Overhead
Track Sign Telcom … Overhead
Funding
Charges & fees
Capital Inv.
Compensation
Infra Maint. &
Operations
…
Charges
Fees
TAC
Traction Power
Only partly covered
Train operator
Rolling stock
Overhead
Maintenance
Capital costs
Train staff Ops & cust. mgmt
TAC Charges & Fees
Maintenance Transport Overhead
Leasing charges Capital exp. …
TAC Power supply Fees
Driver Conductor Crew
Train operator
Rolling stock
Revenues /
income
Funding
Revenues /
income
Funding
Fare box Advertising Food / beverage
Debt Service Restructuring Compensations …
Capital Inv. …
Rental / Leasing Maintenance 3rd parties …

20
11
05
23
_civ
ity_
Wh
ole
Ind
ustr
yC
ostB
en
ch
ma
rkin
g.p
ptx
©
civ
ity 2
01
0 /
//
Content page
1. Introduction 3
2. Market development and structures 12
3. Performance 61
4. Infrastructure 71
5. Train operations (incl. Rolling stock) 116
6. Freight train operations 150
7. Funding and revenues 152
8. Market analysis Germany 162
9. Methodology 185
10. Conclusions 195
12
20
11
05
23
_civ
ity_
Wh
ole
Ind
ustr
yC
ostB
en
ch
ma
rkin
g.p
ptx
©
civ
ity 2
01
0 /
//
2. Market development and structures
2.1. Long term development (comparison)
2.2. Long term development (by country)
2.3. Market structures
2.4. Market players
2.5. Conclusions
13
20
11
05
23
_civ
ity_
Wh
ole
Ind
ustr
yC
ostB
en
ch
ma
rkin
g.p
ptx
©
civ
ity 2
01
0 /
//
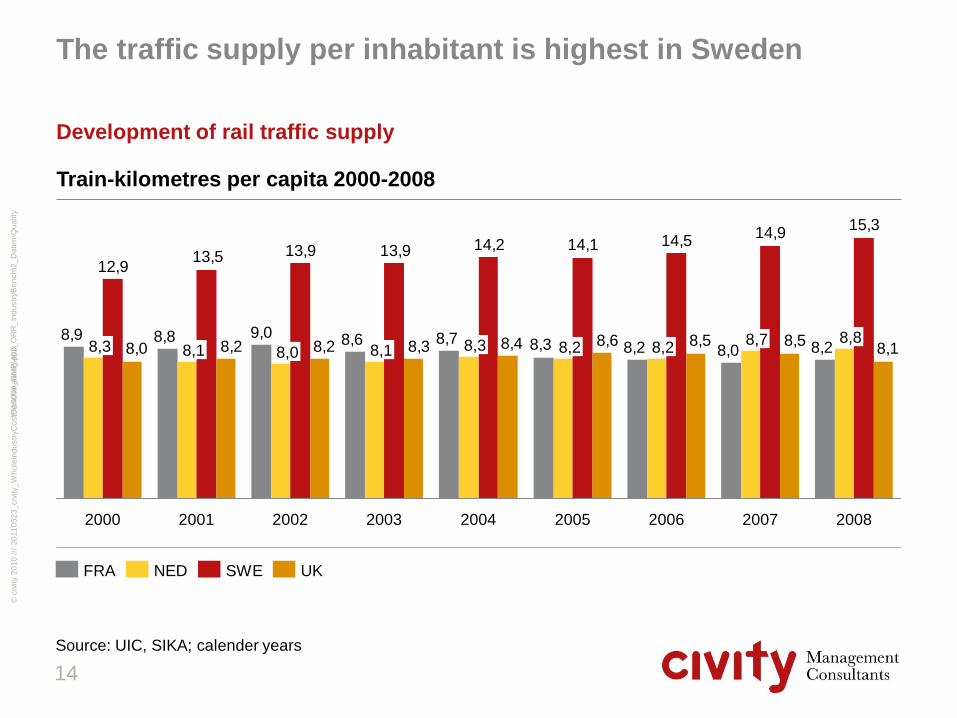
Development of rail traffic supply
The traffic supply per inhabitant is highest in Sweden
Source: UIC, SIKA; calender years
Train-kilometres per capita 2000-2008
8,28,08,28,38,78,69,08,88,9
15,314,9
14,514,114,213,913,913,512,9
8,18,58,58,68,48,38,28,28,0
2008
8,7
2006
8,8 8,2
2005 2007
8,3 8,2
2004
8,3
2003
8,1
2002
8,0
2001
8,1
2000
UK SWE NED FRA
Y:\
10
00
0_
GM
P\4
02
_O
RR
_In
du
str
yB
en
ch
\2_
Da
ten
\Qu
ality
14

20
11
05
23
_civ
ity_
Wh
ole
Ind
ustr
yC
ostB
en
ch
ma
rkin
g.p
ptx
©
civ
ity 2
01
0 /
//
The gap between Sweden and the other countries is due to both passenger and freight services
Traffic supply by freight and passenger services
Source: UIC, SIKA; calender years
6,78,0
10,2
7,4
UK
8,1
0,7
SWE
15,3
5,2
NED
8,8
0,8
FRA
8,2
1,4
6,37,6 8,4
7,2
UK
8,0
0,8
SWE
12,9
4,5
NED
8,3
0,7
FRA
8,9
2,6
Train-kilometres per capita 2000
Freight Rail
Passenger Services
Train-kilometres per capita 2008
Freight Rail
Passenger Services
Y:\
10
00
0_
GM
P\4
02
_O
RR
_In
du
str
yB
en
ch
\2_
Da
ten
\Qu
ality
15
20
11
05
23
_civ
ity_
Wh
ole
Ind
ustr
yC
ostB
en
ch
ma
rkin
g.p
ptx
©
civ
ity 2
01
0 /
//
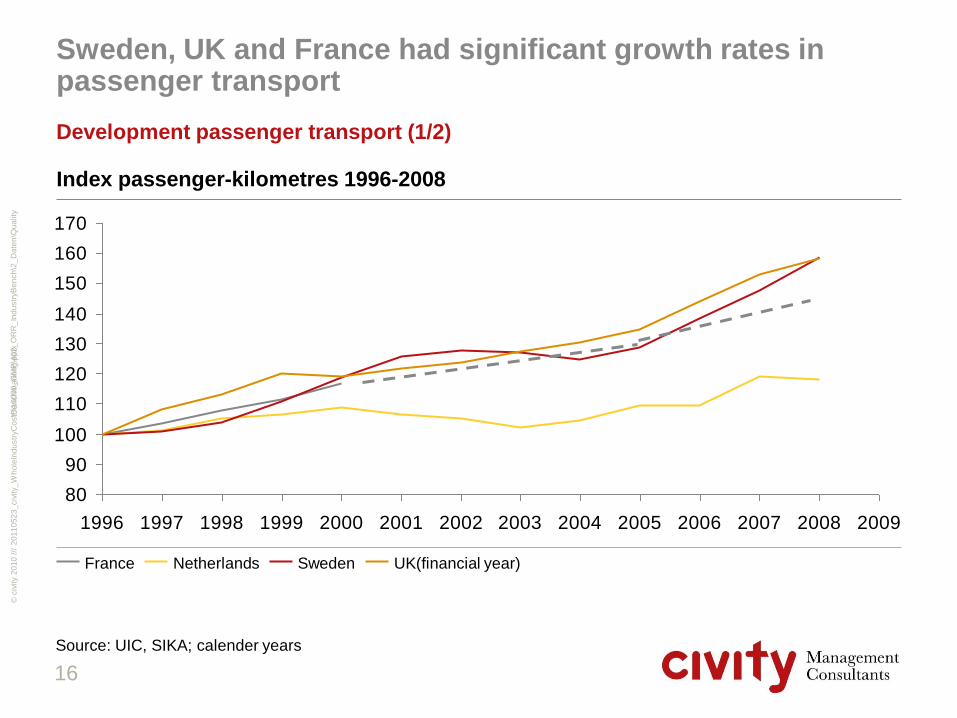
Sweden, UK and France had significant growth rates in passenger transport
Development passenger transport (1/2)
80
90
100
110
120
130
140
150
160
170
1996 1997 1998 1999 2000 2001 2002 2003 2004 2005 2006 2007 2008 2009
Source: UIC, SIKA; calender years
Index passenger-kilometres 1996-2008
UK(financial year) Sweden Netherlands France
Y:\
10
00
0_
GM
P\4
02
_O
RR
_In
du
str
yB
en
ch
\2_
Da
ten
\Qu
ality
16
20
11
05
23
_civ
ity_
Wh
ole
Ind
ustr
yC
ostB
en
ch
ma
rkin
g.p
ptx
©
civ
ity 2
01
0 /
//
Dutch growth rates have been rather modest
Development passenger transport (2/2)
• In contrast to the other countries in the Netherlands had rather modest growth rates
in railway passenger transport over the last decade
• This development is due to the following facts
– It is traditionally a very well developed network and one of the most densely used
networks in Europe
– It has mostly served for passenger transport and been a strong commuter
network with good intercity connections
– Over the past decades the network had only been slightly extended (track length
grew by only 5% since 1982)
17

20
11
05
23
_civ
ity_
Wh
ole
Ind
ustr
yC
ostB
en
ch
ma
rkin
g.p
ptx
©
civ
ity 2
01
0 /
//
In The Netherlands freight transport boomed but UK had also gained more than 40%
Development freight transport
60
80
100
120
140
160
180
200
220
240
260
1996 1997 1998 1999 2000 2001 2002 2003 2004 2005 2006 2007 2008
Source: UIC, SIKA; calender years
Index net-tonne-kilometres 1996-2008
UK (financial year) Sweden Netherlands France1)
1) Development of gross-tonnes kilometres
Y:\
10
00
0_
GM
P\4
02
_O
RR
_In
du
str
yB
en
ch
\2_
Da
ten
\Qu
ality
18
20
11
05
23
_civ
ity_
Wh
ole
Ind
ustr
yC
ostB
en
ch
ma
rkin
g.p
ptx
©
civ
ity 2
01
0 /
//
The Netherlands opened the market and created competition among operators
Development freight transport
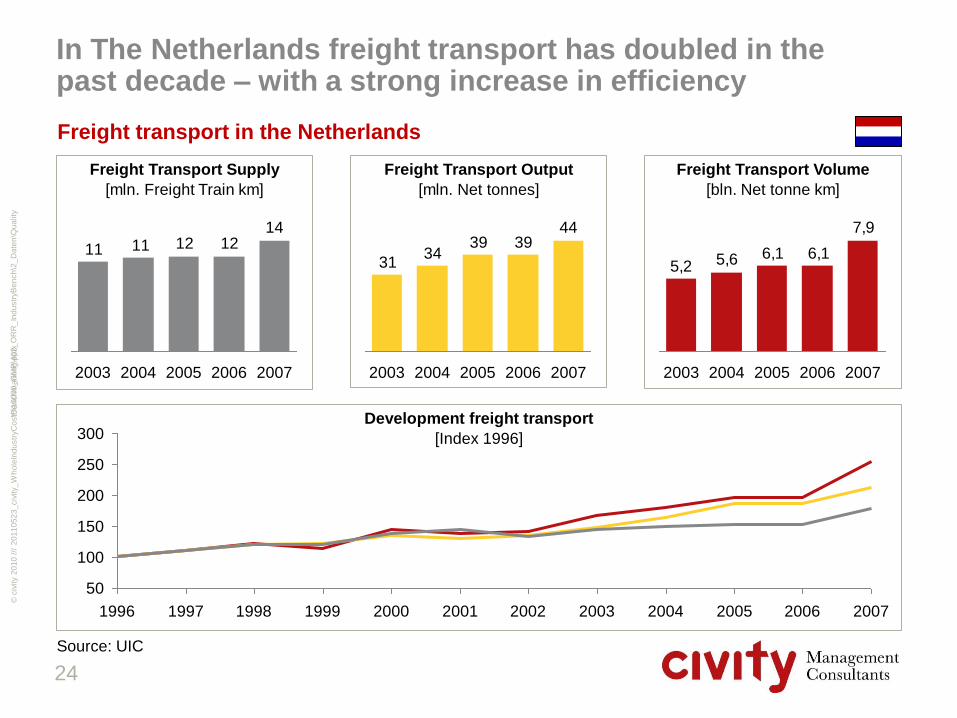
• In The Netherlands freight has more than doubled in the past decade for a number of
reasons:
– An increase in international transport
– Higher transport volumes of iron ore and coal to Germany
– A strong growth of container and swap body transport
– The introduction of the shuttle concept in the mid 90ies for transports between
The Netherlands and Germany
• This positive development has been supported by open access to the network and a
continuously growing number of market entrants
• Furthermore, new companies have entered the market for leasing rolling stock
providing for example flexible rental and lease agreements
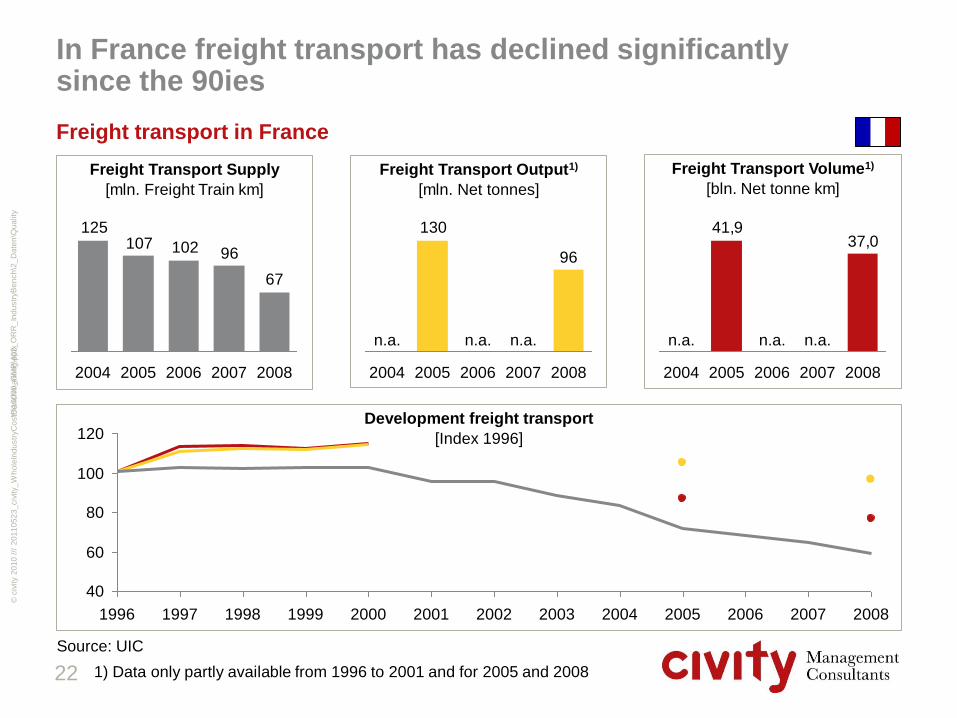
• France where SNCF is the only rail freight carrier has seen a massive decline due to
pressure from open access freight operators who are said to have fared much better
• Furthermore SNCF's performance is troubled by frequent strikes, restrictive working
policies and low efficiency and quality levels
19
20
11
05
23
_civ
ity_
Wh
ole
Ind
ustr
yC
ostB
en
ch
ma
rkin
g.p
ptx
©
civ
ity 2
01
0 /
//
2. Market development and structures
2.1. Long term development (comparison)
2.2. Long term development (by country)
2.3. Market structures
2.4. Market players
2.5. Conclusions
20

20
11
05
23
_civ
ity_
Wh
ole
Ind
ustr
yC
ostB
en
ch
ma
rkin
g.p
ptx
©
civ
ity 2
01
0 /
//
Development passenger transport
[Index 1996]
Passenger Transport Supply
[mln. Passenger Train km]
Passenger Transport Volume1)
[bln. Passenger km]
Passenger Transport Output1)
[mln. Journeys]
In France passenger transport has increased moderately and steadily in the long-term
Passenger transport in France
86,378,3
2009 2008 2007
n.a.
2006
n.a.
2005 2004
n.a.
963
2005 2004
n.a.
2008
1.075
2007
n.a.
2006
n.a.
425420401401397401
2009 2008 2007 2006 2005 2004
60
80
100
120
140
160
1996 1997 1998 1999 2000 2001 2002 2003 2004 2005 2006 2007 2008
Y:\
10
00
0_
GM
P\4
02
_O
RR
_In
du
str
yB
en
ch
\2_
Da
ten
\Qu
ality
21
Source: UIC, journeys and passenger km only available for 2005 and 2008
1) Data only partly available from 1996 to 2001 and for 2005 and 2008
20
11
05
23
_civ
ity_
Wh
ole
Ind
ustr
yC
ostB
en
ch
ma
rkin
g.p
ptx
©
civ
ity 2
01
0 /
//
Development freight transport
[Index 1996]
Freight Transport Supply
[mln. Freight Train km]
Freight Transport Volume1)
[bln. Net tonne km]
Freight Transport Output1)
[mln. Net tonnes]
In France freight transport has declined significantly since the 90ies
Freight transport in France
37,041,9
2008 2007
n.a.
2006
n.a.
2005 2004
n.a.
96
130
2008 2007
n.a.
2006
n.a.
2005 2004
n.a.
67
96102107125
2004 2008 2007 2006 2005
40
60
80
100
120
1996 1997 1998 1999 2000 2001 2002 2003 2004 2005 2006 2007 2008
Y:\
10
00
0_
GM
P\4
02
_O
RR
_In
du
str
yB
en
ch
\2_
Da
ten
\Qu
ality
22
Source: UIC
1) Data only partly available from 1996 to 2001 and for 2005 and 2008

20
11
05
23
_civ
ity_
Wh
ole
Ind
ustr
yC
ostB
en
ch
ma
rkin
g.p
ptx
©
civ
ity 2
01
0 /
//
Development passenger transport
[Index 1996]
Passenger Transport Supply
[mln. Passenger Train km]
Passenger Transport Volume
[bln. Passenger km]
Passenger Transport Output
[mln. Journeys]
In The Netherlands passenger transport has increased, with more and shorter journeys
Passenger transport in the Netherlands
16,216,315,015,014,3
2004 2005 2006 2008 2007
339362
339339325
2004 2005 2008 2006 2007
131129123123124
2004 2006 2005 2008 2007
80
90
100
110
120
130
140
1996 1997 1998 1999 2000 2001 2002 2003 2004 2005 2006 2007 2008
Y:\
10
00
0_
GM
P\4
02
_O
RR
_In
du
str
yB
en
ch
\2_
Da
ten
\Qu
ality
23
Source: UIC
20
11
05
23
_civ
ity_
Wh
ole
Ind
ustr
yC
ostB
en
ch
ma
rkin
g.p
ptx
©
civ
ity 2
01
0 /
//
Development freight transport
[Index 1996]
Freight Transport Supply
[mln. Freight Train km]
Freight Transport Volume
[bln. Net tonne km]
Freight Transport Output
[mln. Net tonnes]
In The Netherlands freight transport has doubled in the past decade – with a strong increase in efficiency
Freight transport in the Netherlands
7,9
6,16,15,2 5,6
2007 2006 2005 2004 2003
443939
3431
2007 2006 2005 2004 2003
1412121111
2007 2006 2005 2004 2003
50
100
150
200
250
300
1996 1997 1998 1999 2000 2001 2002 2003 2004 2005 2006 2007
Source: UIC
Y:\
10
00
0_
GM
P\4
02
_O
RR
_In
du
str
yB
en
ch
\2_
Da
ten
\Qu
ality
24
20
11
05
23
_civ
ity_
Wh
ole
Ind
ustr
yC
ostB
en
ch
ma
rkin
g.p
ptx
©
civ
ity 2
01
0 /
//
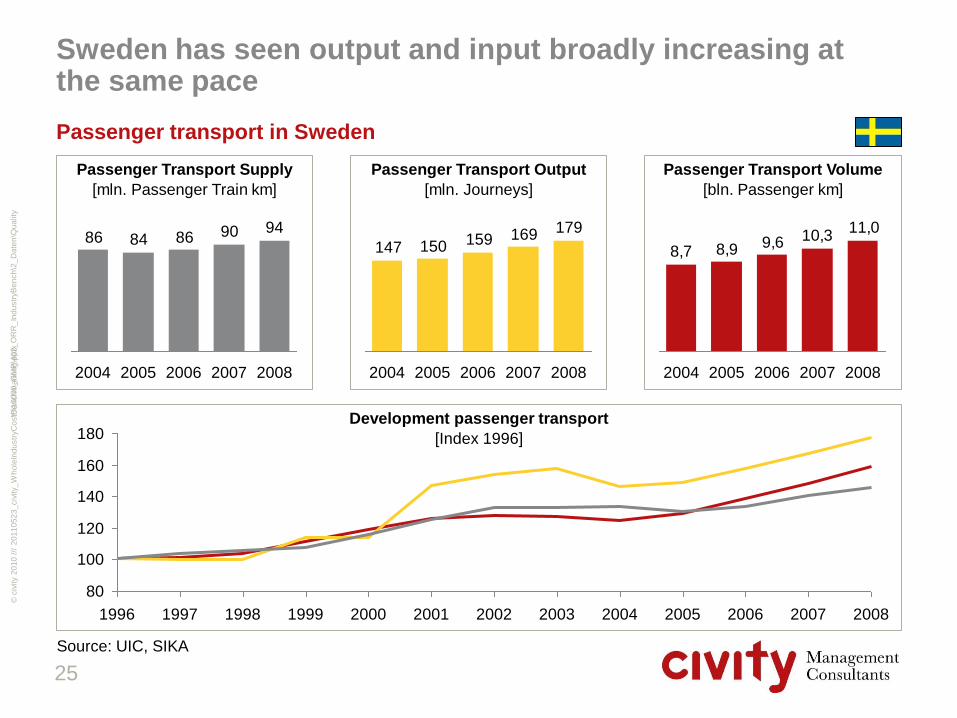
Development passenger transport
[Index 1996]
Passenger Transport Supply
[mln. Passenger Train km]
Passenger Transport Volume
[bln. Passenger km]
Passenger Transport Output
[mln. Journeys]
Sweden has seen output and input broadly increasing at the same pace
Passenger transport in Sweden
11,010,39,68,98,7
2008 2007 2006 2005 2004
179169159150147
2008 2007 2006 2005 2004
9490868486
2008 2007 2006 2005 2004
80
100
120
140
160
180
1996 1997 1998 1999 2000 2001 2002 2003 2004 2005 2006 2007 2008
Y:\
10
00
0_
GM
P\4
02
_O
RR
_In
du
str
yB
en
ch
\2_
Da
ten
\Qu
ality
25
Source: UIC, SIKA
20
11
05
23
_civ
ity_
Wh
ole
Ind
ustr
yC
ostB
en
ch
ma
rkin
g.p
ptx
©
civ
ity 2
01
0 /
//
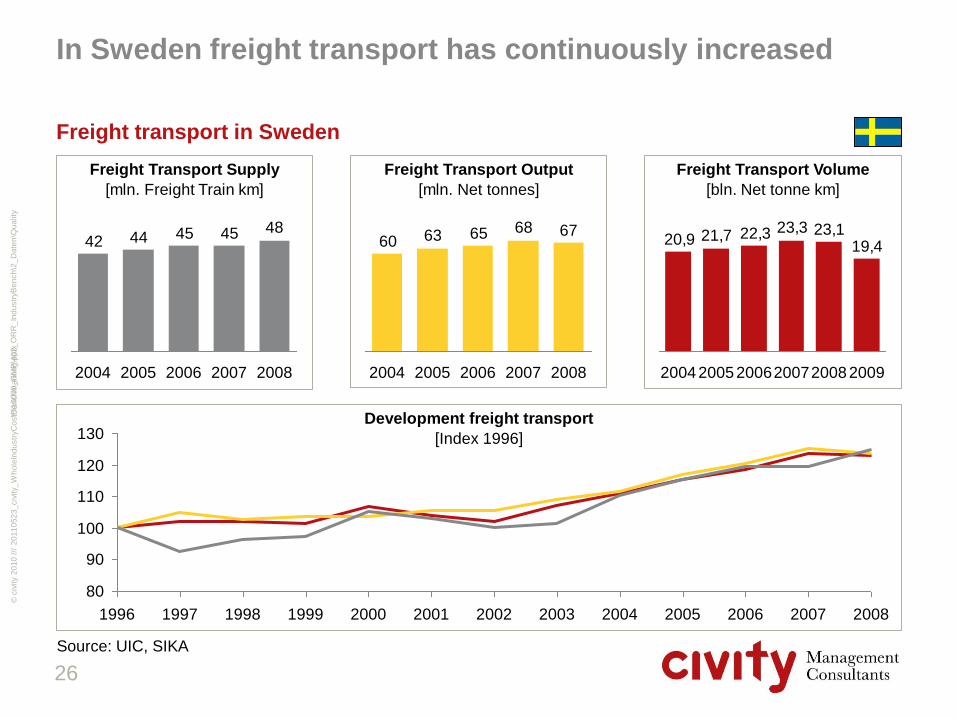
Development freight transport
[Index 1996]
Freight Transport Supply
[mln. Freight Train km]
Freight Transport Volume
[bln. Net tonne km]
Freight Transport Output
[mln. Net tonnes]
In Sweden freight transport has continuously increased
Freight transport in Sweden
19,423,123,322,321,720,9
2009 2008 2007 2006 2005 2004
6768656360
2008 2007 2006 2005 2004
4845454442
2008 2007 2006 2005 2004
80
90
100
110
120
130
1996 1997 1998 1999 2000 2001 2002 2003 2004 2005 2006 2007 2008
Y:\
10
00
0_
GM
P\4
02
_O
RR
_In
du
str
yB
en
ch
\2_
Da
ten
\Qu
ality
26
Source: UIC, SIKA

20
11
05
23
_civ
ity_
Wh
ole
Ind
ustr
yC
ostB
en
ch
ma
rkin
g.p
ptx
©
civ
ity 2
01
0 /
//
Development passenger transport
[Index 1996]
Passenger Transport Supply
[mln. Passenger Train km]
Passenger Transport Volume
[bln. Passenger km]
Passenger Transport Output
[mln. Journeys]
In GB substantial gains in train utilisation were realised
Passenger transport in GB
50,749,046,243,241,8
2008 2007 2006 2005 2004 2008
1.255
2007
1.232
2006
1.151
2005
1.082
2004
1.045 455474470468459
2008 2007 2006 2005 2004
80
100
120
140
160
1996 1997 1998 1999 2000 2001 2002 2003 2004 2005 2006 2007 2008
Y:\
10
00
0_
GM
P\4
02
_O
RR
_In
du
str
yB
en
ch
\2_
Da
ten
\Qu
ality
27
Source: UIC
20
11
05
23
_civ
ity_
Wh
ole
Ind
ustr
yC
ostB
en
ch
ma
rkin
g.p
ptx
©
civ
ity 2
01
0 /
//
Development freight transport
[Index 1996]
Freight Transport Supply
[mln. Freight Train km]
Freight Transport Volume
[bln. Net tonne km]
Freight Transport Output
[mln. Net tonnes]
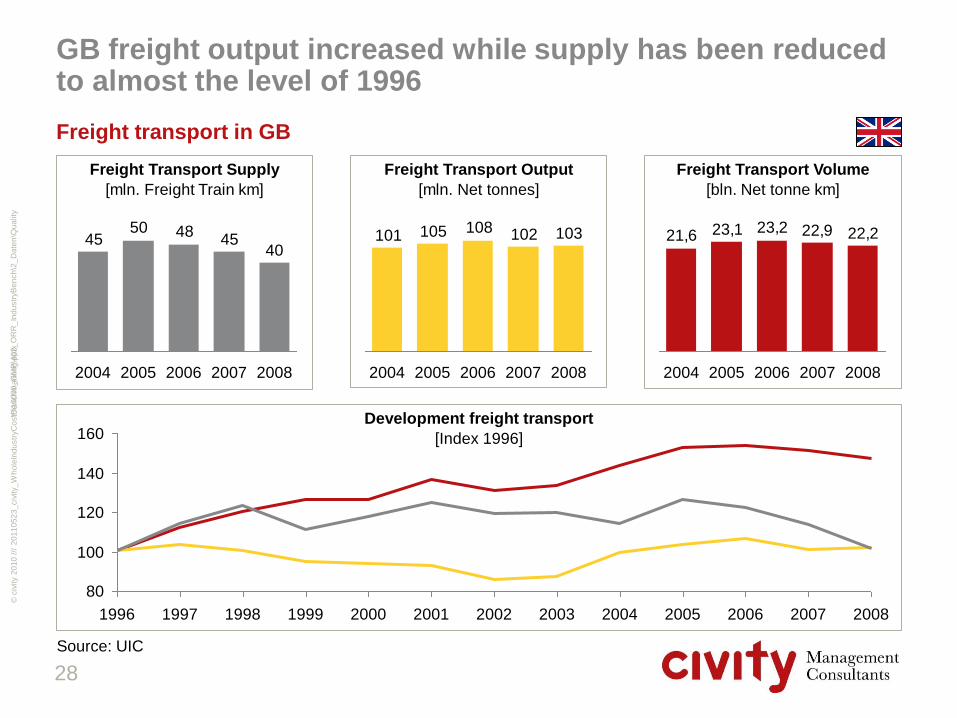
GB freight output increased while supply has been reduced to almost the level of 1996
Freight transport in GB
22,222,923,223,121,6
2008 2007 2006 2005 2004
103102108105101
2006 2005 2004 2008 2007
4045
485045
2008 2007 2006 2005 2004
80
100
120
140
160
1996 1997 1998 1999 2000 2001 2002 2003 2004 2005 2006 2007 2008
Y:\
10
00
0_
GM
P\4
02
_O
RR
_In
du
str
yB
en
ch
\2_
Da
ten
\Qu
ality
28
Source: UIC

20
11
05
23
_civ
ity_
Wh
ole
Ind
ustr
yC
ostB
en
ch
ma
rkin
g.p
ptx
©
civ
ity 2
01
0 /
//
2. Market development and structures
2.1. Long term development (comparison)
2.2. Long term development (by country)
2.3. Market structures
2.4. Market players
2.5. Conclusions
29
20
11
05
23
_civ
ity_
Wh
ole
Ind
ustr
yC
ostB
en
ch
ma
rkin
g.p
ptx
©
civ
ity 2
01
0 /
//
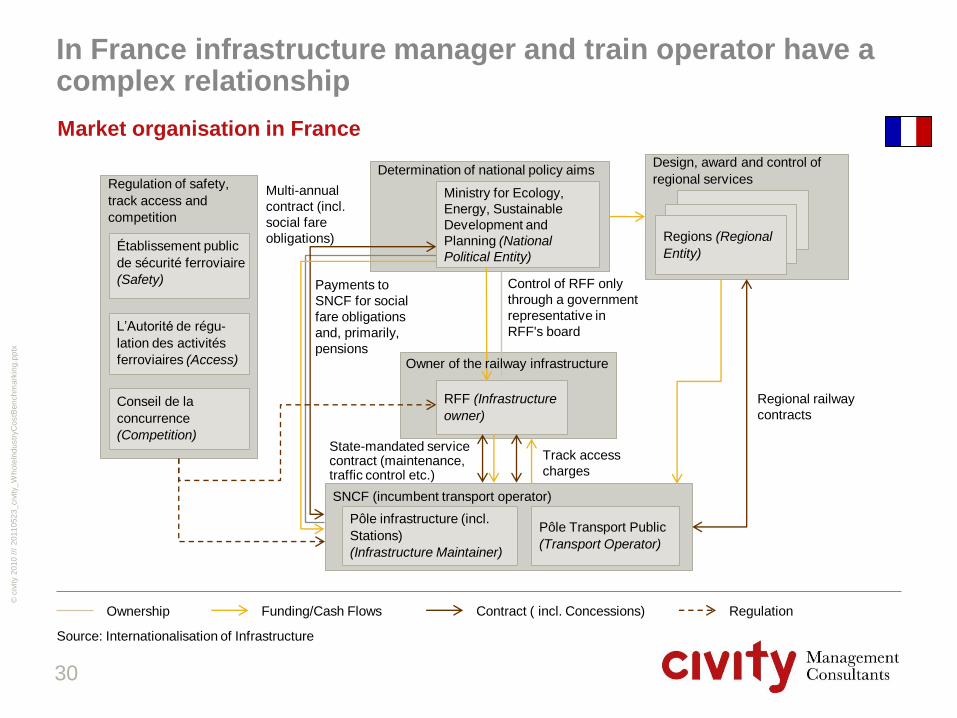
In France infrastructure manager and train operator have a complex relationship
Market organisation in France
Ownership Contract ( incl. Concessions) Funding/Cash Flows Regulation
Source: Internationalisation of Infrastructure
Regional railway
contracts
30
Design, award and control of
regional services Determination of national policy aims
Regulation of safety,
track access and
competition
SNCF (incumbent transport operator)
Établissement public
de sécurité ferroviaire
(Safety)
Pôle infrastructure (incl.
Stations)
(Infrastructure Maintainer)
RFF (Infrastructure
owner)
Pôle Transport Public
(Transport Operator)
Conseil de la
concurrence
(Competition)
Regions (Regional
Entity)
L’Autorité de régu-
lation des activités
ferroviaires (Access)
Ministry for Ecology,
Energy, Sustainable
Development and
Planning (National
Political Entity)
Track access
charges
State-mandated service contract (maintenance, traffic control etc.)
Multi-annual
contract (incl.
social fare
obligations)
Control of RFF only
through a government
representative in
RFF's board
Owner of the railway infrastructure
Payments to
SNCF for social
fare obligations
and, primarily,
pensions

20
11
05
23
_civ
ity_
Wh
ole
Ind
ustr
yC
ostB
en
ch
ma
rkin
g.p
ptx
©
civ
ity 2
01
0 /
//
The French government enforces its aims in the rail transport primarily via ownership control
Determination and enforcement of policy aims in France (overview)
• Réseau Ferré de France (RFF) is charged with formulating policy pertaining to the
maintenance and development of rail infrastructure, but control of RFF takes place only
through a Government representative in RFF's board
• A Contract (contrat de plan) between the State and Société nationale des chemins de
fer français (SNCF) establishes multi-annual budgetary agreements, but this contract
does not seem to be enforced as in other European member states according to
experts
• In General the aim for SNCF is that high-speed and long-distance services must be
profitable (with free market access and without any contract)
• A list of further requirements for SNCF contains a number of social fare obligations
• Few financial incentives and penalties are included in the contract between RFF and
SNCF to enforce the obligations of the contracting parties (e.g. maintenance of network
by SNCF and providing track access by RFF)
• Steering of RFF and SNCF by the national government primarily takes place via
ownership control within the boards, not via contracts
• The regions determine their transport policy aims in terms of quality (e.g. punctuality)
on their own and they are fixed in service contracts with SNCF
31
Source: Internationalisation of Infrastructure 2009
20
11
05
23
_civ
ity_
Wh
ole
Ind
ustr
yC
ostB
en
ch
ma
rkin
g.p
ptx
©
civ
ity 2
01
0 /
//
Operating transport
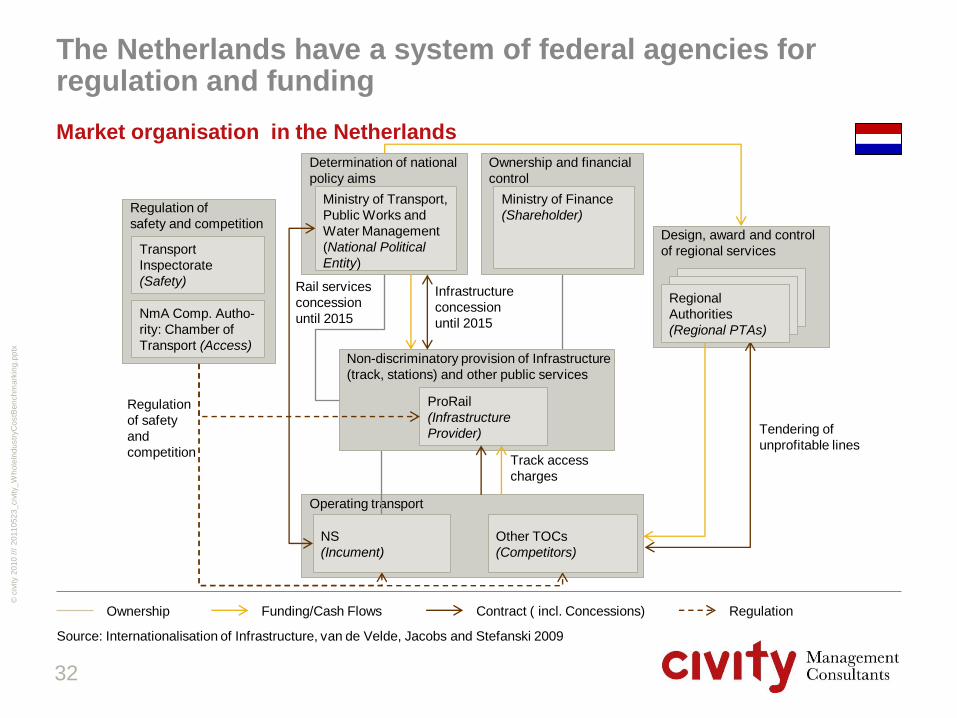
The Netherlands have a system of federal agencies for regulation and funding
Market organisation in the Netherlands
32
Ownership Contract ( incl. Concessions) Funding/Cash Flows Regulation
Source: Internationalisation of Infrastructure, van de Velde, Jacobs and Stefanski 2009
Design, award and control
of regional services
Determination of national
policy aims
Non-discriminatory provision of Infrastructure
(track, stations) and other public services
Regulation of
safety and competition
Transport
Inspectorate
(Safety)
ProRail
(Infrastructure
Provider)
NmA Comp. Autho-
rity: Chamber of
Transport (Access)
Ministry of Transport,
Public Works and
Water Management
(National Political
Entity)
NS
(Incument)
Other TOCs
(Competitors)
Track access
charges
Tendering of
unprofitable lines
Infrastructure
concession
until 2015
Rail services
concession
until 2015
Regional
Authorities
(Regional PTAs)
Regulation
of safety
and
competition
Ownership and financial
control
Ministry of Finance
(Shareholder)

20
11
05
23
_civ
ity_
Wh
ole
Ind
ustr
yC
ostB
en
ch
ma
rkin
g.p
ptx
©
civ
ity 2
01
0 /
//
Operating transport
The Netherlands have a system of federal agencies for regulation and funding
Determination of policy aims in the Netherlands
33
Ownership Contract ( incl. Concessions) Funding/Cash Flows Regulation
Source: Internationalisation of Infrastructure, van de Velde, Jacobs and Stefanski 2009
Design, award and control
of regional services
Determination of national
policy aims
Non-discriminatory provision of Infrastructure
(track, stations) and other public services
Regulation of
safety and competition
Transport
Inspectorate
(Safety)
ProRail
(Infrastructure
Provider)
NmA Comp. Autho-
rity: Chamber of
Transport (Access)
Ministry of Transport,
Public Works and
Water Management
(National Political
Entity)
NS
(Incumbent)
Other TOCs
(Competitors)
Regional
Authorities
(Regional PTAs) Regulation
of safety
and
competition
Ownership and financial
control
Ministry of Finance
(Shareholder)
Regulatory
aims (e.g.
non-discrimi--
natory actions
of incumbent)
Framework for ProRail
concerning general policy
on track usage and
network development.
Transport
policy aims
for NS laid
down in
concession
Transport policy aims
(according to long-term
regional transport policy) Financial
aims
Transport
policy aims
laid down in
public service
contracts
Determination of regional transport
policy aims
Regions (Regional Political Entity)

20
11
05
23
_civ
ity_
Wh
ole
Ind
ustr
yC
ostB
en
ch
ma
rkin
g.p
ptx
©
civ
ity 2
01
0 /
//
The national government in the Netherlands has some ambitious aims for the rail sector
Policy aims in the Netherlands as determined by national government (overview)
• The national government has identified four aims for improving the quality and capacity
of both passenger and freight transport. They are:
– frequent services on the busiest lines in and around the Randstad region in the west
of the country;
– cohesive regional public transport systems revolving around rail transport;
– a sufficient quality of travel times to the various parts of the country;
– a future-proof strategy for freight transport routes.
• In its 2007 coalition agreement, the government aimed for 5% annual growth in
passenger transport during its term in office.
• The public incumbent operator NS and ProRail, the provider of the infrastructure,
received 10 years concession contracts in 2005 that include financial incentives based
on performance indicators (e.g. NS has performance indicators on passenger growth
and punctuality). NS and ProRail have to propose yearly improved values for these
performance indicators in so called transport and infrastructure plans which have then
to be judged and agreed upon by the Ministry.
34
Source: van de Velde, Jacobs and Stefanski 2009
20
11
05
23
_civ
ity_
Wh
ole
Ind
ustr
yC
ostB
en
ch
ma
rkin
g.p
ptx
©
civ
ity 2
01
0 /
//
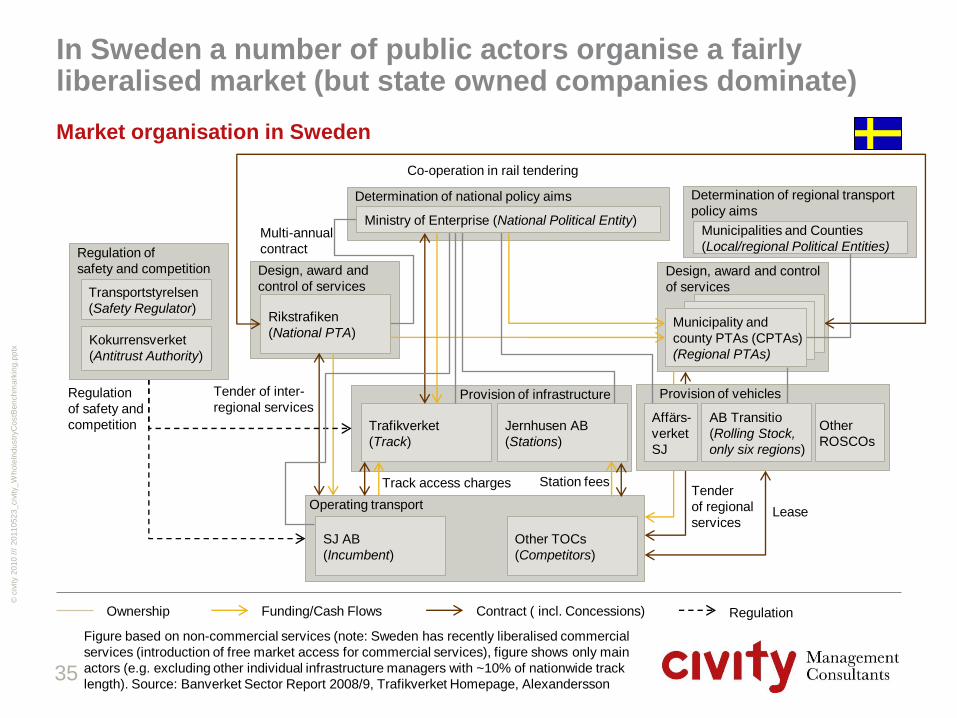
In Sweden a number of public actors organise a fairly liberalised market (but state owned companies dominate)
Market organisation in Sweden
35
Ownership Contract ( incl. Concessions) Funding/Cash Flows Regulation
Figure based on non-commercial services (note: Sweden has recently liberalised commercial
services (introduction of free market access for commercial services), figure shows only main
actors (e.g. excluding other individual infrastructure managers with ~10% of nationwide track
length). Source: Banverket Sector Report 2008/9, Trafikverket Homepage, Alexandersson
Provision of vehicles
Design, award and control
of services
Design, award and
control of services
Determination of national policy aims
Provision of infrastructure
Operating transport
Multi-annual
contract
Rikstrafiken
(National PTA)
Trafikverket
(Track)
Jernhusen AB
(Stations)
Co-operation in rail tendering
Tender
of regional
services
Tender of inter-
regional services
Other TOCs
(Competitors)
Municipality and
county PTAs (CPTAs)
(Regional PTAs)
Station fees Track access charges
SJ AB
(Incumbent)
AB Transitio
(Rolling Stock,
only six regions)
Lease
Regulation of
safety and competition
Kokurrensverket
(Antitrust Authority)
Transportstyrelsen
(Safety Regulator)
Regulation
of safety and
competition Other
ROSCOs
Affärs-
verket
SJ
Determination of regional transport
policy aims Ministry of Enterprise (National Political Entity)
Municipalities and Counties
(Local/regional Political Entities)

20
11
05
23
_civ
ity_
Wh
ole
Ind
ustr
yC
ostB
en
ch
ma
rkin
g.p
ptx
©
civ
ity 2
01
0 /
//
In Sweden the policy objectives are set by the national and the regional and local levels
Determination of policy aims in Sweden
36
Policy aims Regulation
Design, award and
control of services
Determination of national
policy aims
Rikstrafiken
(National PTA)
Ministry of Enterprise
(National Political Entity) Regulation of
Safety and Competition
Kokurrensverket
(Antitrust Authority)
Transportstyrelsen
(Safety Regulator)
Provision of vehicles Provision of infrastructure
Operating transport
Design, award and control of
regional services
Municipality and
county PTAs (CPTAs)
(Regional PTAs) Regulation
of safety and
competition
according to
political aims
Regulatory aims (e.g. non-discriminatory actions
of incumbent), steering "at arms length" by
government
Transport policy aims
(according to long-term
national transport policy),
steering "at arms length"
by government
Transport policy aims (according to
long-term regional transport policy)
Trafikverket
(Track)
Jernhusen AB
(Stations)
Other TOCs
(Competitors)
SJ AB
(Incumbent)
AB Transitio
(Rolling Stock,
only six regions)
Other
ROSCOs
Affärs-
verket
SJ
Source: Banverket Sector Report 2008/9, Trafikverket Homepage, Alexandersson and Hultén 2009
Determination of regional transport
policy aims
Municipalities and Counties
(Local/Regional Political Entities)
Transport policy aims laid down in
public service contracts
Transport policy aims
laid down in public
service contracts

20
11
05
23
_civ
ity_
Wh
ole
Ind
ustr
yC
ostB
en
ch
ma
rkin
g.p
ptx
©
civ
ity 2
01
0 /
//
The overall objective in Sweden is to provide a socio-economically viable, efficient and sustainable transportation
Policy aims in Sweden as determined by Trafikverket (overview)
• Overall vision: Everybody arrives smoothly, the green and safe way
• The aim is to meet transport policy targets
– The overall objective of the transport policy in Sweden is to ensure socio-
economically viable, efficient and sustainable transportation for citizens as well as for
trade and industry
– The functional objective of transport policy: Availability
– The considerate objectives of transport policy: Health, safety and the environment
37
Source: Trafikverket November 2010
20
11
05
23
_civ
ity_
Wh
ole
Ind
ustr
yC
ostB
en
ch
ma
rkin
g.p
ptx
©
civ
ity 2
01
0 /
//
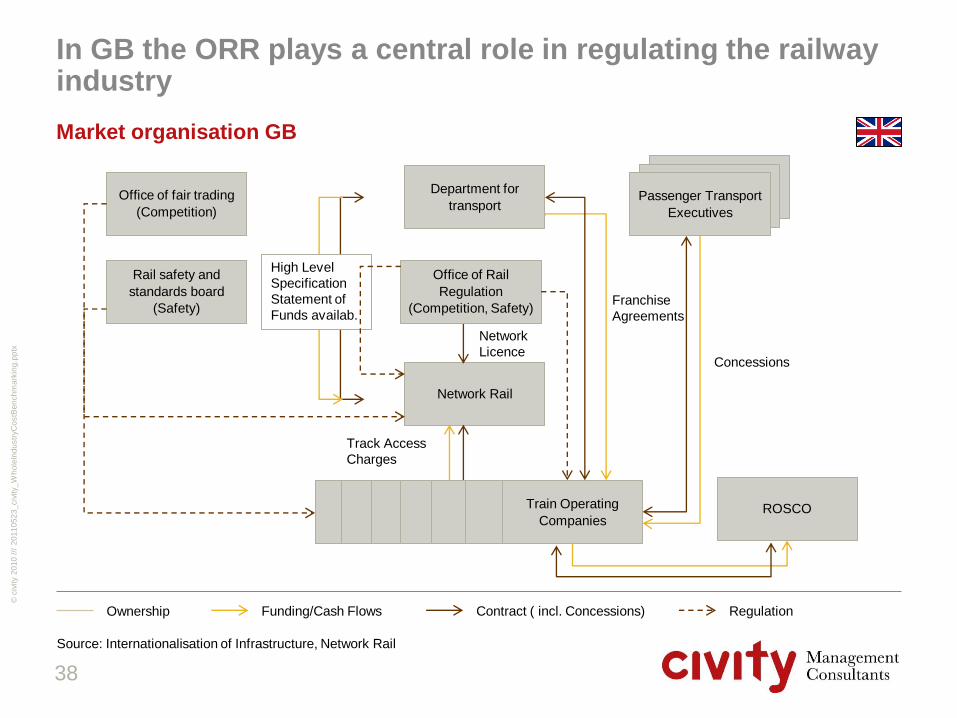
In GB the ORR plays a central role in regulating the railway industry
Market organisation GB
Concessions
Office of fair trading
(Competition)
Network Rail
Rail safety and
standards board
(Safety)
Department for
transport
Track Access
Charges
Franchise
Agreements
Network
Licence
Passenger Transport
Executives
Train Operating
Companies ROSCO
Office of Rail
Regulation
(Competition, Safety)
High Level
Specification
Statement of
Funds availab.
38
Ownership Contract ( incl. Concessions) Funding/Cash Flows Regulation
Source: Internationalisation of Infrastructure, Network Rail

20
11
05
23
_civ
ity_
Wh
ole
Ind
ustr
yC
ostB
en
ch
ma
rkin
g.p
ptx
©
civ
ity 2
01
0 /
//
2. Market development and structures
2.1. Long term development (comparison)
2.2. Long term development (by country)
2.3. Market structures
2.4. Market players
2.5. Conclusions
39

20
11
05
23
_civ
ity_
Wh
ole
Ind
ustr
yC
ostB
en
ch
ma
rkin
g.p
ptx
©
civ
ity 2
01
0 /
//
By number of companies GB and Sweden have the most developed market for passenger traffic
Overview market participants (1 of 2)
40
Countries
Category France Netherlands Sweden GB
Government Agencies • Ministry for Ecology, Energy, Sustainable Dev. and Planning
• L’Autorité de régulation des activités ferroviaires
• Établissement public de sécurité ferroviaire
• Conseil de la concurrence
• Ministry of Public Works and Water Management
• Chamber of Transport
• Transport Inspectorate
• Ministry of Enterprise, Energy and Communications
• Rikstrafik
• Transport Styrelsen
• DfT
• ORR
Infrastructure Managers • RFF (network) (Public)
• SNCF Gares & Connexions (Stations) (Public)
• ProRail Ltd. (Public)
• NL Railinfratrust Company (Public)
• Trafikverket (Public)
• Others: Inlandsbanan AB (Public), A-Train AB (PPP), Jernhusen AB (stations) (Public)
• Network Rail (Private )
• Northern Ireland Railways (Public)
Train Operating Companies • SNCF Voyages (Public)
• SNCF Proximités (Public)
• Nederlandse Spoorwegen (Public)
• Others: Arriva (Public DB), Veolia (Private), DB Regio NRW (Public), Connexxion
• SJ AB (Public)
• Stockholmståg KB (Public SJ)
• A-Train AB
• Others: Veolia Transport Sverige AB (Private), Svenska Tågkompaniet AB (Public), Arriva Tåg AB (Public DB), Roslagståg AB (Public), Inlandsbanan AB (Public), DSBFirst Sverige AB (PP), Merresor AB (PP), SJ Norrlandståg AB (Public)
• First (Private)
• Stagecoach (Private)
• Govia (Public Private Keolis)/Go-ahead)
• Arriva (Public DB)
• Abellio (Public NS)
• National Express (Private)
• Others incl. DB

20
11
05
23
_civ
ity_
Wh
ole
Ind
ustr
yC
ostB
en
ch
ma
rkin
g.p
ptx
©
civ
ity 2
01
0 /
//
Also in freight and rolling stock the level of diversity of players in the markets differs significantly
Overview market participants (2 of 2)
41
Countries
Category France Netherlands Sweden GB
Freight Operating Companies • SNCF Geodis (Public)
• Euro Cargo Rail (Public DB)
• DB Schenker Rail Nederland (Public)
• Cross-border:, Rail4chem (Public SNCF), SNCF Fret (incl. ITL, Public), Dillen & Lejeune Cargo (Private), HGK AG (Public), B-Cargo (Public SNCB), TX Logistics AG (PP Trenitalia)
• Domestic: ACTS (Private), ERS Railways BV (Private), Rotterdam Railfeeding (Private), Veolia Cargo Nederland BV (Public SNCF)
• Green Cargo AB (Public)
• Cargo Net AB (Public)
• Malmtrafik i Kiruna AB (Private)
• Hector Rail AB (Private)
• Others: TGOJ Trafik AB (Public), Tågåkeriet i Bergslagen AB, TX Logistik AB (Public Private Trenitalia), RailCare Tåg AB (Private), Peterson Rail AB (Private), Tågfrakt Produktion i Sverige AB, DB Schenker Rail Scandinavia A/S (Public), MidCargo AB (Private), Stena Recycling AB (Private)
• DB Schenker (Public)
• Freightliner Intermodal (Private)
• Freightliner Heavy Haul (Private)
• DRS (Public)
• G.B. Railfreight (Private)
• Fastline (Private)
• Advenza (Private)
Rolling Stock Leasing Company
- • Railpool (Public banks)
• Ox-Traction (Private)
• CB-Rail (Private)
• Alpha-Trains (Private)
• Mitsui Rail Capital Europe (Private)
• Siemens Dispolok (Private)
• AB Transitio (Public)
• Transwaggon AB (Private)
• Tågåkeriet i Bergslagen AB (Private)
• Angel Trains (Private)
• HSBC Rail (Private)
• Porterbrook (Private)
• Sovereign trains (Private)
• QW Rail Leasing (Private)
• Diesl Trains Ltd. (Public)
• Lyods TSB General Leasing (Private)
• Other Spot-hire companies

20
11
05
23
_civ
ity_
Wh
ole
Ind
ustr
yC
ostB
en
ch
ma
rkin
g.p
ptx
©
civ
ity 2
01
0 /
//
Market shares rail services in France
[% of train-path km]
SNCF absolutely dominates the rail market in France
Market shares rail services
Freight
17%
Greater
Paris 11%
TER
32%
TRN
+ TIR
9%
High Speed
25%
2%
New Railway enterprises
3%
Other
Source: RFF
Market shares freight operators in France
[% of train-km]
7%
8%
DB Schenker
Other
85%
Source: SNCF Annual Report 2009, RFF
SNCF SNCF
Source: Annual Reports, UIC
42
20
11
05
23
_civ
ity_
Wh
ole
Ind
ustr
yC
ostB
en
ch
ma
rkin
g.p
ptx
©
civ
ity 2
01
0 /
//
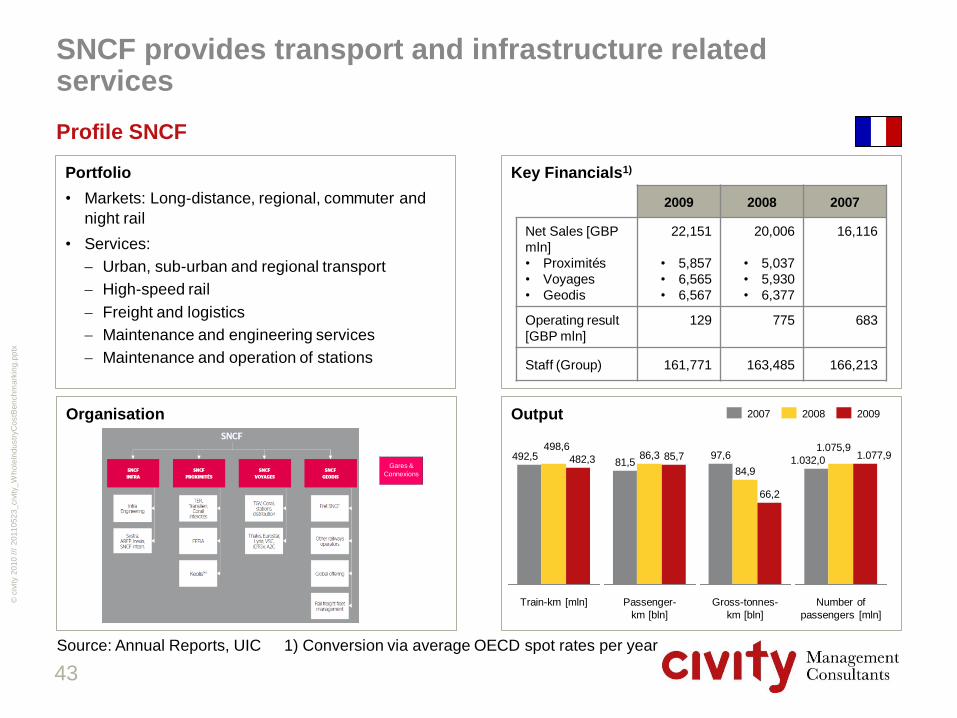
SNCF provides transport and infrastructure related services
Profile SNCF
Portfolio
• Markets: Long-distance, regional, commuter and
night rail
• Services:
Urban, sub-urban and regional transport
High-speed rail
Freight and logistics
Maintenance and engineering services
Maintenance and operation of stations
Key Financials1)
Output Organisation
Passenger-
km [bln]
85,7 86,3 81,5
2009 2008 2007
66,2
Gross-tonnes-
km [bln]
84,9
97,6
Number of
passengers [mln]
1.077,9 1.075,9
1.032,0
Train-km [mln]
492,5 498,6
482,3
2009 2008 2007
Net Sales [GBP
mln]
• Proximités
• Voyages
• Geodis
22,151
• 5,857
• 6,565
• 6,567
20,006
• 5,037
• 5,930
• 6,377
16,116
Operating result
[GBP mln]
129 775 683
Staff (Group) 161,771 163,485 166,213
Gares &
Connexions
43
Source: Annual Reports, UIC 1) Conversion via average OECD spot rates per year

20
11
05
23
_civ
ity_
Wh
ole
Ind
ustr
yC
ostB
en
ch
ma
rkin
g.p
ptx
©
civ
ity 2
01
0 /
//
Portfolio
• Responsibilities: RFF ensures funding, development
and promotion of the network, manages and pays
for work performed by the main contractor, and
decides on the procedures relating to traffic
management and the running of the network
• Infrastructure management and maintenance work
is outsourced to SNCF as well as traffic control
(state-mandated)
Key Financials1)
Output Organisation
RFF is the French infrastructure manager
Profile RFF
955,0
624,0 553,0
Track renewal [km]
2009 2008 2007
Net Sales [GBP
mln] 2,921 2,462 1948
Operating result
[GBP mln] 1,412 -315 -5
Investment new
projects [GBP mln] 1,399 1,195 0
Staff (end of year) 1,166 939 843
2009
2008
2007
Development
and
Investment
Sales Infrastructure Finance and
Purchasing
Governance,
Legal Affairs
& IT
Other
Strategy/
Sustainable
Develop.
Assets
Audit
External
Relations/
Com.
Human
Resource
The organisational structure is completed by 12 regional
divisions
29.918
2009
30.041
2008
29.901
2007 Stations
Operated
by SNCF
Switches
32.490
Electrified
44
Source: Annual Reports, UIC 1) Conversion via average OECD spot rates per year
Length of lines - end
of year (Kilometres)

20
11
05
23
_civ
ity_
Wh
ole
Ind
ustr
yC
ostB
en
ch
ma
rkin
g.p
ptx
©
civ
ity 2
01
0 /
//
Market shares freight operators in Netherlands
based on track access charges 2008
[%]
There is significant competition on the Dutch freight rail market – DB Schenker largest operator
Market shares freight Netherlands
8%
9%
66%
1%
3% 2%
2% 3%
6%
DB Schenker (Railion)
Ruhrtalbahn
Others
Rotterdam Rail Feeding
Hafen und Güterverkehr Köln
SNCF (incl. ITL)
Veolia (incl. Rail4Chem)
ERS
ACTS
Source: Pro Rail
45

20
11
05
23
_civ
ity_
Wh
ole
Ind
ustr
yC
ostB
en
ch
ma
rkin
g.p
ptx
©
civ
ity 2
01
0 /
//
Market shares passenger services in
Netherlands based on train-km 2008
[%]
Passenger services are dominated by NS Reizigers
Market shares passenger services Netherlands
86%
14%
Regional operators
NS Reizigers
46
Source: Pro Rail
20
11
05
23
_civ
ity_
Wh
ole
Ind
ustr
yC
ostB
en
ch
ma
rkin
g.p
ptx
©
civ
ity 2
01
0 /
//
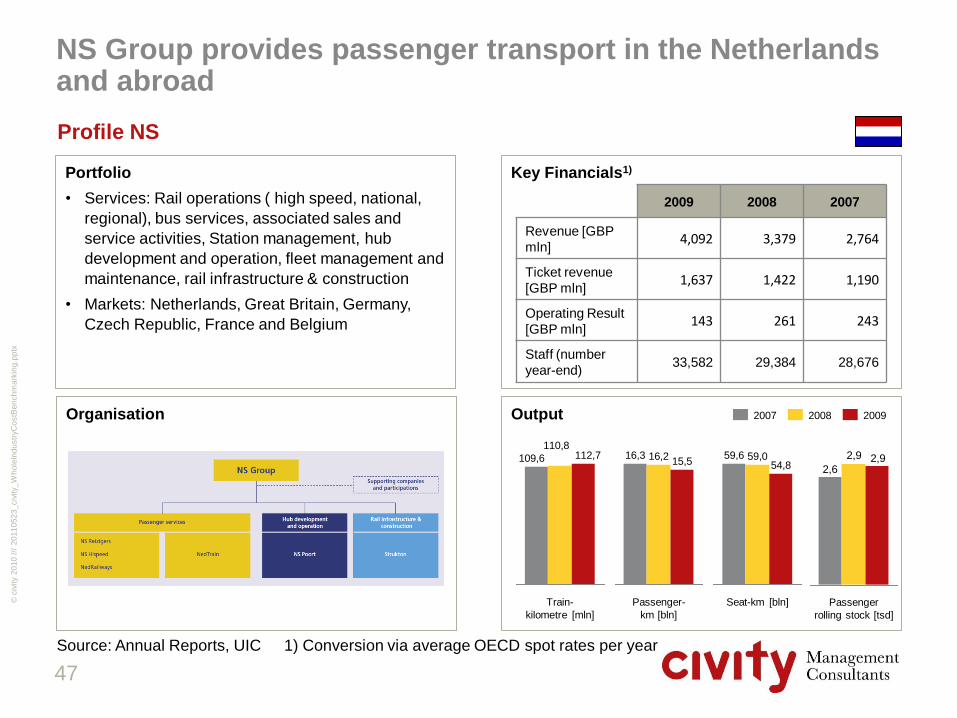
Portfolio
• Services: Rail operations ( high speed, national,
regional), bus services, associated sales and
service activities, Station management, hub
development and operation, fleet management and
maintenance, rail infrastructure & construction
• Markets: Netherlands, Great Britain, Germany,
Czech Republic, France and Belgium
Key Financials1)
Output Organisation
NS Group provides passenger transport in the Netherlands and abroad
Profile NS
Passenger-
km [bln]
15,5 16,2 16,3
2009 2008 2007
Seat-km [bln]
54,8 59,0 59,6
Train-
kilometre [mln]
112,7 110,8
109,6
2009 2008 2007
Revenue [GBP
mln] 4,092 3,379 2,764
Ticket revenue
[GBP mln] 1,637 1,422 1,190
Operating Result
[GBP mln] 143 261 243
Staff (number
year-end) 33,582 29,384 28,676
Source: Annual Reports, UIC
2,6
2,9 2,9
Passenger
rolling stock [tsd]
47
1) Conversion via average OECD spot rates per year

20
11
05
23
_civ
ity_
Wh
ole
Ind
ustr
yC
ostB
en
ch
ma
rkin
g.p
ptx
©
civ
ity 2
01
0 /
//
Portfolio
• Responsibility:
maintenance and extensions of the national
railway network infrastructure
allocating rail capacity
traffic control
Key Financials1)
Output Organisation
ProRail is the Dutch infrastructure manager – all maintenance outsourced
Profile ProRail
2009 2008 2007
Revenue [GBP
mln] 1,314 1,144 910
Gross investments
[GBP mln] 959 813 587
Operating Result
[GBP mln] 15 1 21
Staff (number
year-end) 3,679 3,220 2,903
13
76
2009
389
Movable bridges
Tunnels
Stations
Length of lines - end
of year (Kilometres)
2009
2.896
2.195
701
2008
2.896
2.195
701
2007
2.886
2.195
691
Electrified
48
Source: Annual Reports, UIC 1) Conversion via average OECD spot rates per year
20
11
05
23
_civ
ity_
Wh
ole
Ind
ustr
yC
ostB
en
ch
ma
rkin
g.p
ptx
©
civ
ity 2
01
0 /
//
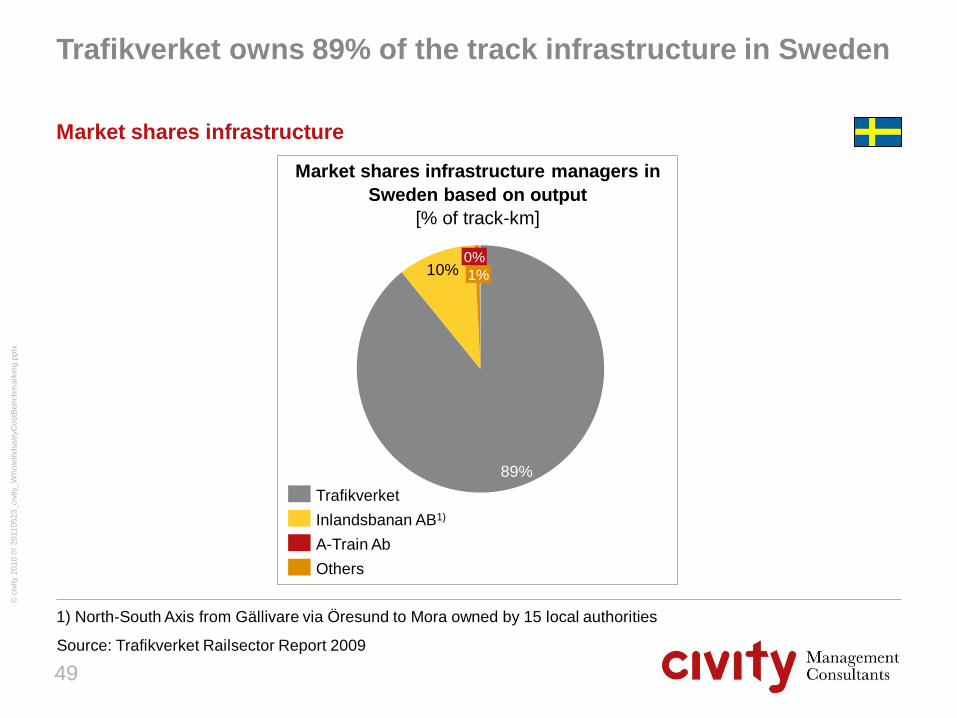
Market shares infrastructure managers in
Sweden based on output
[% of track-km]
Trafikverket owns 89% of the track infrastructure in Sweden
Market shares infrastructure
10% 1%
0%
89%
Others
A-Train Ab
Inlandsbanan AB1)
Trafikverket
49
Source: Trafikverket Railsector Report 2009
1) North-South Axis from Gällivare via Öresund to Mora owned by 15 local authorities
20
11
05
23
_civ
ity_
Wh
ole
Ind
ustr
yC
ostB
en
ch
ma
rkin
g.p
ptx
©
civ
ity 2
01
0 /
//
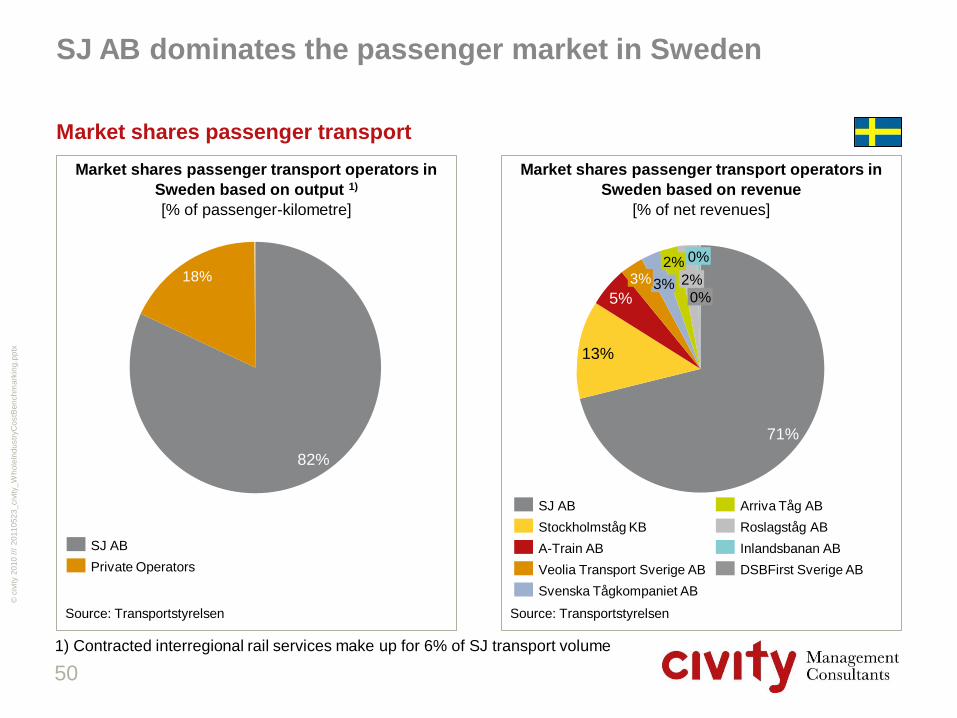
Market shares passenger transport operators in
Sweden based on revenue
[% of net revenues]
Market shares passenger transport operators in
Sweden based on output 1)
[% of passenger-kilometre]
SJ AB dominates the passenger market in Sweden
Market shares passenger transport
13%
71%
0%
0%
2%
2%
3% 3%
5%
Stockholmståg KB
SJ AB
DSBFirst Sverige AB
Inlandsbanan AB
Roslagståg AB
Arriva Tåg AB
Svenska Tågkompaniet AB
Veolia Transport Sverige AB
A-Train AB
18%
82%
Private Operators
SJ AB
Source: Transportstyrelsen Source: Transportstyrelsen
50
1) Contracted interregional rail services make up for 6% of SJ transport volume
20
11
05
23
_civ
ity_
Wh
ole
Ind
ustr
yC
ostB
en
ch
ma
rkin
g.p
ptx
©
civ
ity 2
01
0 /
//
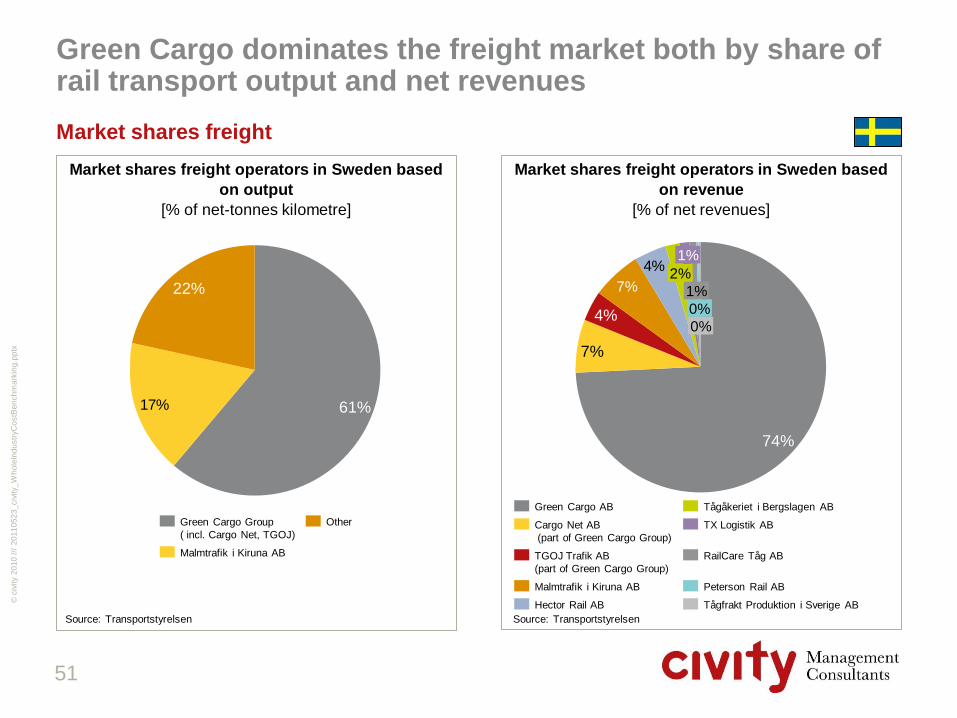
Market shares freight operators in Sweden based
on revenue
[% of net revenues]
Market shares freight operators in Sweden based
on output
[% of net-tonnes kilometre]
Green Cargo dominates the freight market both by share of rail transport output and net revenues
Market shares freight
4%
7%
0%
0%
1%
1%
2% 7%
4%
74%
Tågfrakt Produktion i Sverige AB
Peterson Rail AB
RailCare Tåg AB
TX Logistik AB
Tågåkeriet i Bergslagen AB
Hector Rail AB
Malmtrafik i Kiruna AB
TGOJ Trafik AB
(part of Green Cargo Group)
Cargo Net AB
(part of Green Cargo Group)
Green Cargo AB
17%
22%
61%
Other
Malmtrafik i Kiruna AB
Green Cargo Group
( incl. Cargo Net, TGOJ)
Source: Transportstyrelsen Source: Transportstyrelsen
51

20
11
05
23
_civ
ity_
Wh
ole
Ind
ustr
yC
ostB
en
ch
ma
rkin
g.p
ptx
©
civ
ity 2
01
0 /
//
Portfolio
• Markets: Long-distance, regional, commuter and
night rail
• Services:
Rail Services
Fleet ownership and maintenance
Customer services in train stations, call centers
and with travel agencies
• Subsidiaries: Norrlandståg, Stockholmståg, SJ
Event, SJ Service Academy and Linkon
Key Financials1)
Output Organisation
SJ provides passenger services including rolling stock maintenance
Profile SJ AB
6,57,0 7,2
Passenger-
km [bln]
2009 2008 2007
Seat-km [bln]
12,9 13,3
12,5
Number of
journeys [mln]
36,3
40,1 38,4
2009 2008 2007
Net Sales [GBP
mln] 737 744 609
Operating profit
[GBP mln] 53 66 60
EBIT Margin 7,1 % 8,1 % 8,4 %
Staff (Group) 4.439 4.539 4,053
Railway Traffic Sales and
Distribution
Fleet
Management
SJ AB
Law
Traffic Safety
Strategic Communications
Finance
Business Development
Human Resources
Train-km [mln]
50,6 44,1
43,3
52
Source: Annual Reports, UIC 1) Conversion via average OECD spot rates per year

20
11
05
23
_civ
ity_
Wh
ole
Ind
ustr
yC
ostB
en
ch
ma
rkin
g.p
ptx
©
civ
ity 2
01
0 /
//
Portfolio
• Responsibilities:
Long-term planning of the transport system for all
types of traffic ( incl. rail, road, maritime, air)
Building, operating and maintaining public roads
and railways
Administering the theoretical and driving tests
licence and certificate of professional
competence.
• Subsidiaries: Norrlandståg, Stockholmståg, SJ
Event, SJ Service Academy and Linkon
Key Financials1)
Output Organisation
Trafikverket is the Swedish infrastructure manager – responsible for rail and road
Overview Trafikverket
2009 2008 2007
Income from
appropriations and
grants [GBP mln]
576 1573 410
Income fees
[GBP mln] 436 368 286
Investments
[GBP mln] 1,061 872 685
Staff (average
number) 6.588 6.534 6.518
9.840
2009
7.766
2.074
9.946
7.862
2007
9.821
2.084
2008
7.747
2.074
Electrified
Length of lines - end
of year (Kilometres)
147
3.781
459
4.589
Tunnels Railway
bridges
Stations Switches
53
Civil Engineering [no]
Source: Annual Reports, UIC 1) Conversion via average OECD spot rates per year
20
11
05
23
_civ
ity_
Wh
ole
Ind
ustr
yC
ostB
en
ch
ma
rkin
g.p
ptx
©
civ
ity 2
01
0 /
//
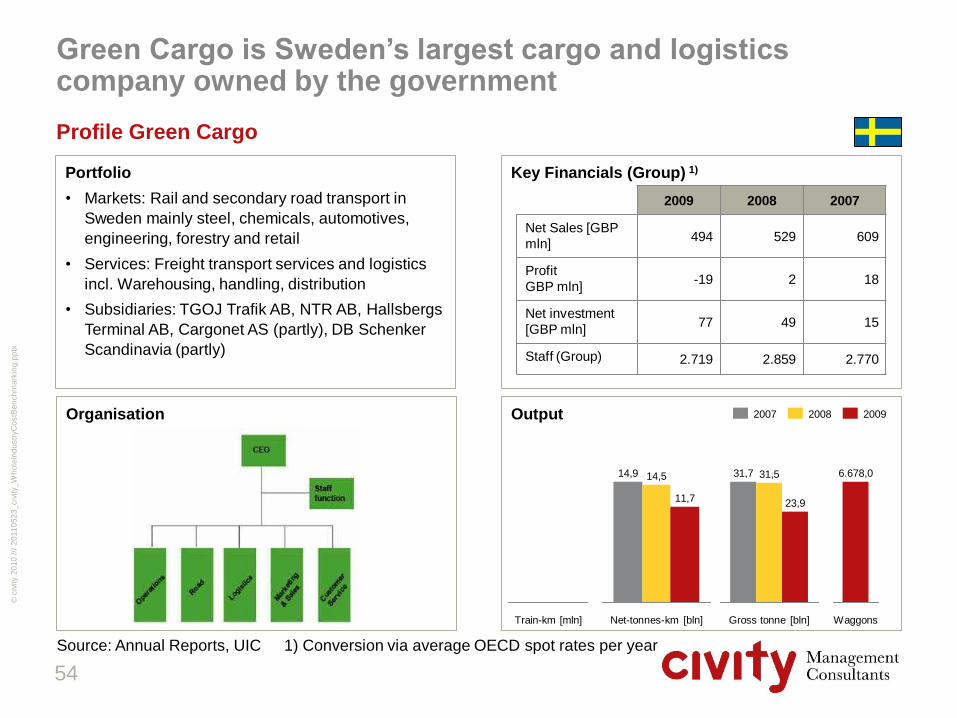
Portfolio
• Markets: Rail and secondary road transport in
Sweden mainly steel, chemicals, automotives,
engineering, forestry and retail
• Services: Freight transport services and logistics
incl. Warehousing, handling, distribution
• Subsidiaries: TGOJ Trafik AB, NTR AB, Hallsbergs
Terminal AB, Cargonet AS (partly), DB Schenker
Scandinavia (partly)
Key Financials (Group) 1)
Output Organisation
Green Cargo is Sweden‟s largest cargo and logistics company owned by the government
Profile Green Cargo
Net-tonnes-km [bln]
11,7
14,5 14,9
2009 2008 2007
Gross tonne [bln]
23,9
31,5 31,7
2009 2008 2007
Net Sales [GBP
mln] 494 529 609
Profit
GBP mln] -19 2 18
Net investment
[GBP mln] 77 49 15
Staff (Group) 2.719 2.859 2.770
Waggons
6.678,0
Train-km [mln]
54
Source: Annual Reports, UIC 1) Conversion via average OECD spot rates per year

20
11
05
23
_civ
ity_
Wh
ole
Ind
ustr
yC
ostB
en
ch
ma
rkin
g.p
ptx
©
civ
ity 2
01
0 /
//
Market shares passenger service operators in GB
[% of train-km]
In GB there is a number of competitors both in passenger services and freight rail services
Market Shares rail services GB
7%
8%
10%
18%
DB
3% other / unknown
Nat. Exp.
Abellio
Arriva 11%
Govia
17%
Stagecoach
First
26%
Source: ORR
Market shares freight operators in GB
[% of train-km]
Source: ORR
5%
21%
Advenza
0%
Fastline
1%
G.B. Railfreight
DRS
5%
Freightliner
Heavy Haul 16%
Freightliner
Intermodal
DBS 51%
55
20
11
05
23
_civ
ity_
Wh
ole
Ind
ustr
yC
ostB
en
ch
ma
rkin
g.p
ptx
©
civ
ity 2
01
0 /
//
2. Market development and structures
2.1. Long term development (comparison)
2.2. Long term development (by country)
2.3. Market structures
2.4. Market players
2.5. Conclusions
56
20
11
05
23
_civ
ity_
Wh
ole
Ind
ustr
yC
ostB
en
ch
ma
rkin
g.p
ptx
©
civ
ity 2
01
0 /
//
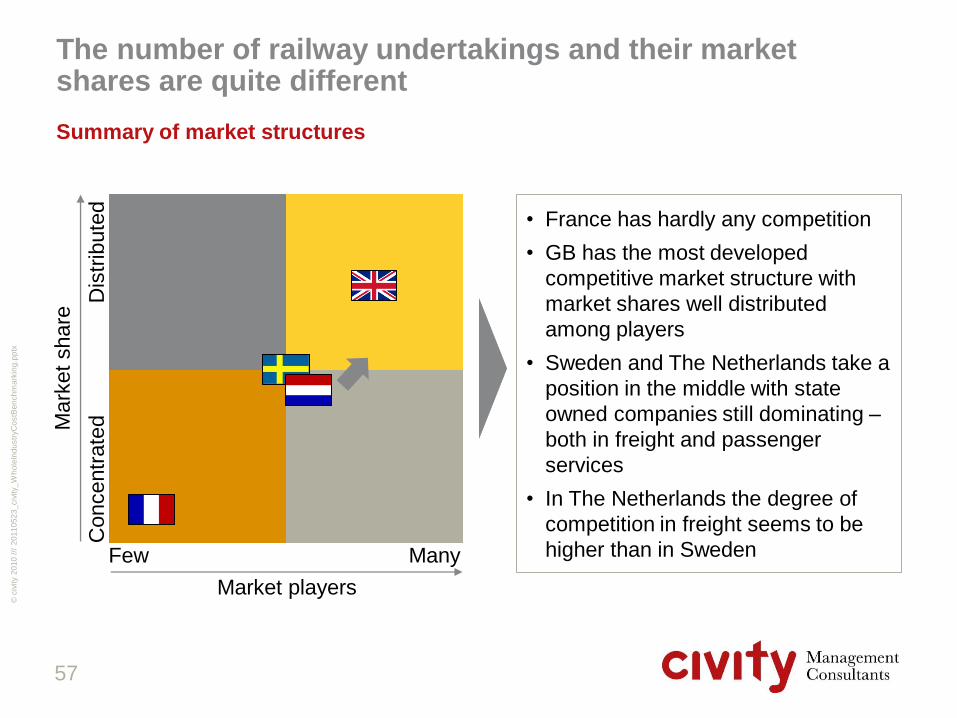
The number of railway undertakings and their market shares are quite different
Summary of market structures
57
• France has hardly any competition
• GB has the most developed
competitive market structure with
market shares well distributed
among players
• Sweden and The Netherlands take a
position in the middle with state
owned companies still dominating –
both in freight and passenger
services
• In The Netherlands the degree of
competition in freight seems to be
higher than in Sweden
Mark
et
share
Dis
trib
ute
d
Concentr
ate
d
Many Few
Market players
20
11
05
23
_civ
ity_
Wh
ole
Ind
ustr
yC
ostB
en
ch
ma
rkin
g.p
ptx
©
civ
ity 2
01
0 /
//
In all countries demand for passenger services has grown since 1996
• Between 2000 and 2008 Sweden had the highest growth rates in traffic supply per
capita which was driven by both passenger services and freight
• On the demand side Sweden, UK and France have seen a growth in passenger-
kilometres of up to 50% (1996 until 2008)
• Demand in The Netherlands grew less as the Dutch network has been quite utilised
before and now faces saturation problems
• The development in rail freight is quite different:
– The Netherlands have more than doubled net-tonne-kilometres between 1996 and
2008
– Growth was modest in the UK and Sweden
– In France rail freight transport has declined steadily since the end of the 90ies
• In The Netherlands net tonne kilometres grew stronger than freight train kilometres
supplied indicating an increase in efficiency
• British freight companies have also managed to realise some substantial gains in train
utilisation
Conclusions
58
20
11
05
23
_civ
ity_
Wh
ole
Ind
ustr
yC
ostB
en
ch
ma
rkin
g.p
ptx
©
civ
ity 2
01
0 /
//
The way markets are organised varies between the four countries
• In France RFF is directly subordinated to the Ministry and responsible for managing
the railway infrastructure; maintenance is contracted out to SNCF
• SNCF plays a dominating role in the French market providing services to passengers
as well as to the freight sector; there are only a few small private entreprises
• In The Netherlands ProRail acts as infrastructure manager having fully outsourced all
maintenance and renewals which is comparable to Sweden
• Passenger services are mainly provided by NS with a small percentage of regional
operators; freight is mainly provided by state-owned DB-Schenker and a growing
number of private operators
• The former Swedish railway administration Banverket became Trafikverket in April
2010, combining the responsibilities of managing infrastructure for road and rail now
• In contrast to other countries, there is a separate entity in Sweden managing the
railway stations (Jernhusen)
Conclusions
59

20
11
05
23
_civ
ity_
Wh
ole
Ind
ustr
yC
ostB
en
ch
ma
rkin
g.p
ptx
©
civ
ity 2
01
0 /
//
The way markets are organised varies between the four countries
• In Sweden passenger and freight services are still dominated by state-owned SJ with
some smaller public and private operators in both segments
• Apart from GB Sweden is the only country in the sample where rolling stock is
provided by a rolling stock company to operators (but limited to regional traffic)
• GB is the only country in the sample with a nearly complete franchise system, a fully
separated provision of rolling stock and a regulator performing extensive economic
regulation
Conclusions
60

20
11
05
23
_civ
ity_
Wh
ole
Ind
ustr
yC
ostB
en
ch
ma
rkin
g.p
ptx
©
civ
ity 2
01
0 /
//
Content page
1. Introduction 3
2. Market development and structures 12
3. Performance 61
4. Infrastructure 71
5. Train operations (incl. Rolling stock) 116
6. Freight train operations 150
7. Funding and revenues 152
8. Market analysis Germany 162
9. Methodology 185
10. Conclusions 195
61

20
11
05
23
_civ
ity_
Wh
ole
Ind
ustr
yC
ostB
en
ch
ma
rkin
g.p
ptx
©
civ
ity 2
01
0 /
//
1) Corresponding to the 19 franchised TOCs; GBR 19 is an accumulation of GBR LSE, Regio and IC
GB‟s supply and demand are second highest in sample
Traffic demand and supply (2009)
62
[bn passenger-km] [m passenger train-km]
IC
500 400 300 200 100 0 10 20 30 40 50 60 70 80 90
SJ
Group
NSR/
NT
SBB
LSE
SNCF
GBR 19
Regio

20
11
05
23
_civ
ity_
Wh
ole
Ind
ustr
yC
ostB
en
ch
ma
rkin
g.p
ptx
©
civ
ity 2
01
0 /
//
The GB's train utilisation is at the lower end of the sample
Average train utilisation (2009)
63
[passenger-km / train-km]
122140137
196
294
107
138
62
119
SJ
Group
LSE NSR/
NT
SNCF SNCF
Voyages
GBR
19
IC Regio SBB
• Average utilisation of trains
is particularly high in France
• This is very much driven by
SNCF's high speed system
which is accounting for a
large share of the passenger
transport supply
• These trains have a large
seat capacity (~ 500 seats),
fairly long train sets (~
240m), partly use double
stack coaches (TGV Duplex)
paired with a high demand
• Utilisation of TGVs was 78%
in 2007
20
11
05
23
_civ
ity_
Wh
ole
Ind
ustr
yC
ostB
en
ch
ma
rkin
g.p
ptx
©
civ
ity 2
01
0 /
//
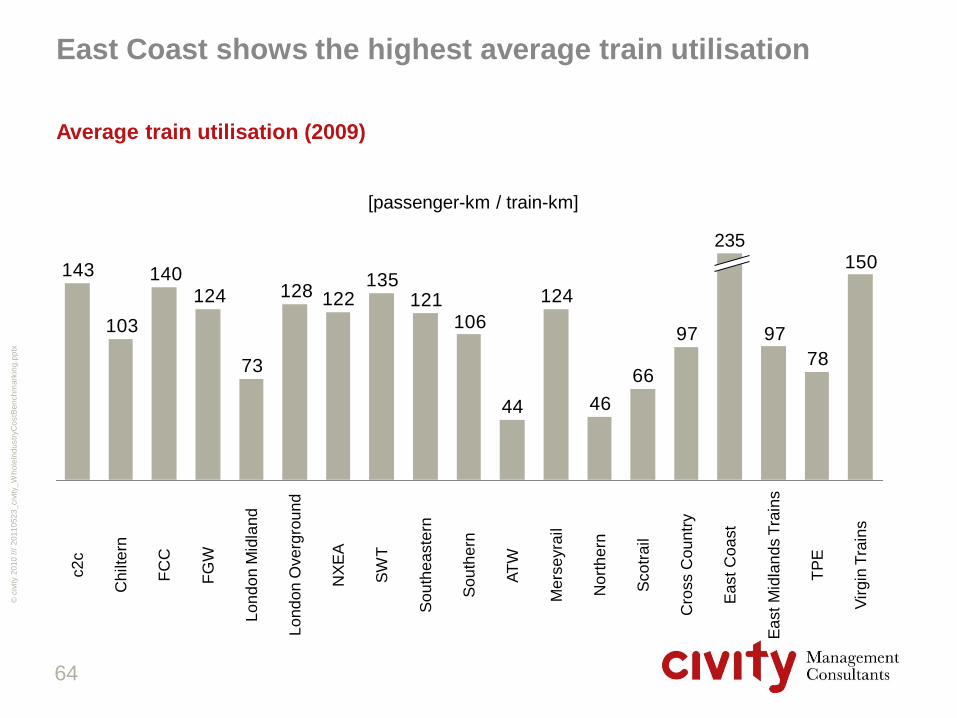
East Coast shows the highest average train utilisation
Average train utilisation (2009)
64
[passenger-km / train-km]
150
78
9797
66
4644
106121
135122128
73
124140
103
143
124
No
rth
ern
Me
rse
yra
il
AT
W
So
uth
ern
So
uth
ea
ste
rn
SW
T
NX
EA
Vir
gin
Tra
ins
TP
E
235
Ea
st
Mid
lan
ds T
rain
s
Ea
st
Co
ast
Cro
ss C
ou
ntr
y
Sco
tra
il
Lo
nd
on
Ove
rgro
un
d
Lo
nd
on
Mid
lan
d
FG
W
FC
C
Chilte
rn
c2
c

20
11
05
23
_civ
ity_
Wh
ole
Ind
ustr
yC
ostB
en
ch
ma
rkin
g.p
ptx
©
civ
ity 2
01
0 /
//
Switzerland and the Netherlands use their infrastructure more intensively than UK System performance (2009) (1/2)
65
Train frequency
[k train-km / route-km]
28
7
26
8
16
SBB TRV ProRail RFF NR
Utilisation Infrastructure
[k passenger train-km / main track-km]
1) Route-km calculated as sum of route lengths of the individual TOCs, normalised
to the real total route-km. Approximate values only, therefore
2) Train km of all operators would lead to a value of 9 k train-km/route-km
44
5
39
14
30
2221
53
NSR/
NT
SBB SJ
Group2)
SNCF GBR
19
IC1) Regio1) LSE1)

20
11
05
23
_civ
ity_
Wh
ole
Ind
ustr
yC
ostB
en
ch
ma
rkin
g.p
ptx
©
civ
ity 2
01
0 /
//
The Swiss railways have consequently promoted their railways network
System performance (2/2)
• The Swiss have the most densely used network in Europe; on the one hand this is
due to international traffic being a centrally located transit network
• On the other hand the Swiss railways have undertaken strong efforts to increase the
attractivity and utilisation within the country
• Some reasons for this development are:
– A high degree of quality (punctuality, cleanliness etc.) and a focus on customers
– Large investments in rolling stock and infrastructure
– The integrated synchronised timetable for optimised connections and reduced
travel-times
– A regionally dense and well balanced transport service offer
– An attractive pricing model (Switzerland has the highest share of full-fare
travelcards; it's also valid for many buses, trams and boats)
– A high degree of intermodal integration
• The Swiss government backs the railway system by its favaourable environmental
legislation
66
20
11
05
23
_civ
ity_
Wh
ole
Ind
ustr
yC
ostB
en
ch
ma
rkin
g.p
ptx
©
civ
ity 2
01
0 /
//
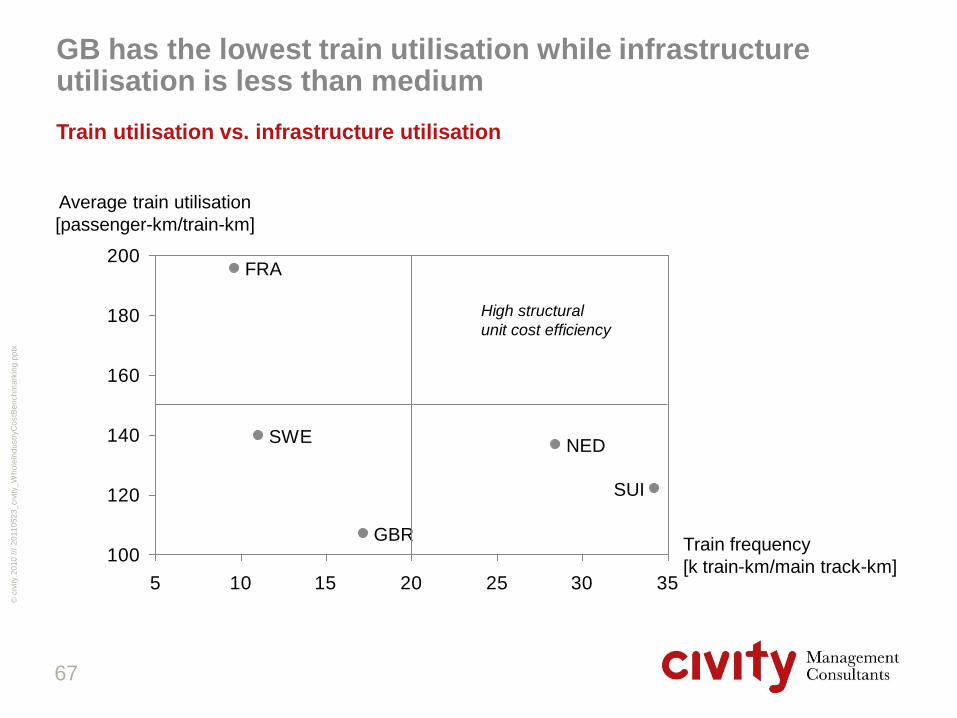
GB has the lowest train utilisation while infrastructure utilisation is less than medium
Train utilisation vs. infrastructure utilisation
67
100
120
140
160
180
200
5 10 15 20 25 30 35
Average train utilisation
[passenger-km/train-km]
Train frequency
[k train-km/main track-km]
SUI
SWE NED
FRA
GBR
High structural
unit cost efficiency

20
11
05
23
_civ
ity_
Wh
ole
Ind
ustr
yC
ostB
en
ch
ma
rkin
g.p
ptx
©
civ
ity 2
01
0 /
//
Related to inhabitants GB's supply is comparable to most others, demand is fairly low
System performance (2009)
68
18
577
8
14
SBB SJ
Group 2)
NSR/
NT
SNCF GBR 19 LSE1)
Supply
[train-km / inhabitant]
763936
850
2,181
SBB SJ
Group3)
NSR/
NT
SNCF
1,336
GBR 19 LSE1)
1,612
Demand
[passenger-km / inhabitant]
1) Inhabitants LSE-Region (London and Southeast): 16,04 m
2) Train km of all operators would lead to a value of 9 k train-km/inhabitant
3) Train km of all operators would lead to a value of 954 passenger-km/inhabitant

20
11
05
23
_civ
ity_
Wh
ole
Ind
ustr
yC
ostB
en
ch
ma
rkin
g.p
ptx
©
civ
ity 2
01
0 /
//
Punctuality is lower in GB than in other countries of the sample
System performance (2009)
69
9789
9391
8188
819091
SBB SJ
Group
NSR/
NT
SNCF GBR
19
IC Regio LSE SNCF
Voyages
Punctuality
[%]
Source: Annual reports, peer group
• Punctuality is difficult to
compare due to different
measuring concepts,
definitions, thresholds,
timetable reserves etc.
• In this sample all countries
use time-to-5 as threshold

20
11
05
23
_civ
ity_
Wh
ole
Ind
ustr
yC
ostB
en
ch
ma
rkin
g.p
ptx
©
civ
ity 2
01
0 /
//
Based on a recently conducted international study GB's punctuality is slightly above average
System performance (2009)
70
Source: NR/ATOC/ORR Performance Benchmarking 20010
5.57%
4.77%
4.06%
0.44%
-0.56%
-0.60%
-1.45%
-5.80%
-0.20%
3.80%
-2.78%
3.83%
17.79%
3.40%
-7.44%
3.30%
2.50%
-10% -5% 0% 5% 10% 15% 20%
Country *A*
Country *B*
Country *C*
Country *D*
Country *E*
Country *F*
Country *G* (All)
Country *H*
Country *I*
Contry *J* (All)
Contry *G* (LD)
Country *K* (LD)
Country *J* (LD)
Country *L* (LD)
Country *G* (Short)
Country *H* (Short)
Country *J* (Short)
• The sample includes Western European countries and UK performance (punctuality) has been
rebased to each comparator's metric
• Performance refers to all trains
• The figures shown are 2009/2010 UK performance less 2009 reported comparator performance,
for example: GB's punctuality is 5.57% higher than country A's
Average: 1,0%
20
11
05
23
_civ
ity_
Wh
ole
Ind
ustr
yC
ostB
en
ch
ma
rkin
g.p
ptx
©
civ
ity 2
01
0 /
//
Content page
1. Introduction 3
2. Market development and structures 12
3. Performance 61
4. Infrastructure 71
5. Train operations (incl. Rolling stock) 116
6. Freight train operations 150
7. Funding and revenues 152
8. Market analysis Germany 162
9. Methodology 185
10. Conclusions 195
71

20
11
05
23
_civ
ity_
Wh
ole
Ind
ustr
yC
ostB
en
ch
ma
rkin
g.p
ptx
©
civ
ity 2
01
0 /
//
4. Infrastructure
4.1. Introduction
4.2. Total cost and network characteristics
4.3. Maintenance and renewal costs
4.4. Network operations costs
4.5. Infrastructure operating costs (overhead)
4.6. Conclusions
72

20
11
05
23
_civ
ity_
Wh
ole
Ind
ustr
yC
ostB
en
ch
ma
rkin
g.p
ptx
©
civ
ity 2
01
0 /
//
INFRA
T
O
T
A
L
Maintenance
Renewal
Traffic M. Station M. Traction Power
Track Sign. Telcom. … Overhead
Operations Overhead
Track Sign Telcom … Overhead
Infrastructure costs are analysed by activities and asset
Infrastructure Costs
73
Maintenance costs will be split into the most important asset categories
Renewal costs for the existing network will be split into the most important asset categories and
cover a five and ten year horizon
Operating costs result from running the network and consist of two main cost elements:
• Operations: The costs to manage traffic, stations and customers; traction power is looked at
separately
• Overhead: Administrative activities which cannot be attributed to any specific business activity but
are necessary for the business to function
Operating

20
11
05
23
_civ
ity_
Wh
ole
Ind
ustr
yC
ostB
en
ch
ma
rkin
g.p
ptx
©
civ
ity 2
01
0 /
//
4. Infrastructure
4.1. Introduction
4.2. Total cost and network characteristics
4.3. Maintenance and renewal costs
4.4. Network operations costs
4.5. Infrastructure operating costs (overhead)
4.6. Conclusions
74

20
11
05
23
_civ
ity_
Wh
ole
Ind
ustr
yC
ostB
en
ch
ma
rkin
g.p
ptx
©
civ
ity 2
01
0 /
//
Accumulated infrastructure cost are highest in UK
Total infrastructure costs (2009, fully normalised)
75
41
119
90
166
D2) C B A NR
125
[k GBP / track-km]
Operating1)
Operations
Renewals
Maintenance
1) Cost elements included in operating vary strongly between countries
2) Cost for operating are included in operations

20
11
05
23
_civ
ity_
Wh
ole
Ind
ustr
yC
ostB
en
ch
ma
rkin
g.p
ptx
©
civ
ity 2
01
0 /
//
Network characteristics strongly vary among peers, especially main track-km and station density
Network characteristics (2009)
76
91024
61
100
Country
Main track-km
[Index in %]
29
4950
89100
Country
Switch density in main track
[Index in %]
40
61
79
100100
Country
Degree of electrification
[Index in %]
22
4548
79
100
Country
Station density1)
[Index in %]
1) Stations and flag stops

20
11
05
23
_civ
ity_
Wh
ole
Ind
ustr
yC
ostB
en
ch
ma
rkin
g.p
ptx
©
civ
ity 2
01
0 /
//
Network utilisation also strongly varies among peers, especially passenger and freight train mileages
Network performance (2009)
77
182727
86100
Country
Total passenger train mileage
[Index in %]
18
42
6066
100
Country
Total freight train mileage
[Index in %]
2932
50
82
100
Country
Total train frequency (passenger and freight)
[Index in %]
323637
63
100
Country
Total gross tonnage (passenger and freight)
[Index in %]
20
11
05
23
_civ
ity_
Wh
ole
Ind
ustr
yC
ostB
en
ch
ma
rkin
g.p
ptx
©
civ
ity 2
01
0 /
//
4. Infrastructure
4.1. Introduction
4.2. Total cost and network characteristics
4.3. Maintenance and renewal costs
4.4. Network operations costs
4.5. Infrastructure operating costs (overhead)
4.6. Conclusions
78

20
11
05
23
_civ
ity_
Wh
ole
Ind
ustr
yC
ostB
en
ch
ma
rkin
g.p
ptx
©
civ
ity 2
01
0 /
//
This chapter looks into Network Rail's normalised expenditures on maintenance and renewals
Introduction
• According to the comparison of total infrastructure costs Network Rail has the highest
expenditures per track-km in the sample
• As shown before Network Rail has a lower switch density than other networks, the
lowest degree of electrification and a utilisation (train-kilometres and gross tons)
which is close to average
• These parameters cannot be influenced by an infrastructure manager in short or
medium term, if at all. To avoid a comparison based on fundamentally different
network characteristics and performance levels civity applies a normalisation method
based on the UIC LICB benchmark
• Furthermore face values are normalised by applying currency conversion rates to
equalise different purchasing powers between countries compared
• The next page shows the application of normalisation factors by asset group. Please
refer to chapter 9 for more details on the normalisation process
• This chapter provides a more detailed insight in Network Rail's expenditures on
maintenance and renewals
79

20
11
05
23
_civ
ity_
Wh
ole
Ind
ustr
yC
ostB
en
ch
ma
rkin
g.p
ptx
©
civ
ity 2
01
0 /
//
Normalisation of infrastructure costs is based on the methodology as applied within the UIC LICB benchmark
Infrastructure cost normalisation
80
Cost function Switch density
Degree of
electrification Train frequency Gross tonnage
M R M R M R M R
Civil engineering
Track
Power supply
Signalling
Telecommunications
Stations
Buildings
Other
Operational overhead
For further information on the methodology and normalisation process please refer to chapter 9; the
"x" indicates the application of a normalisation factor to a cost function
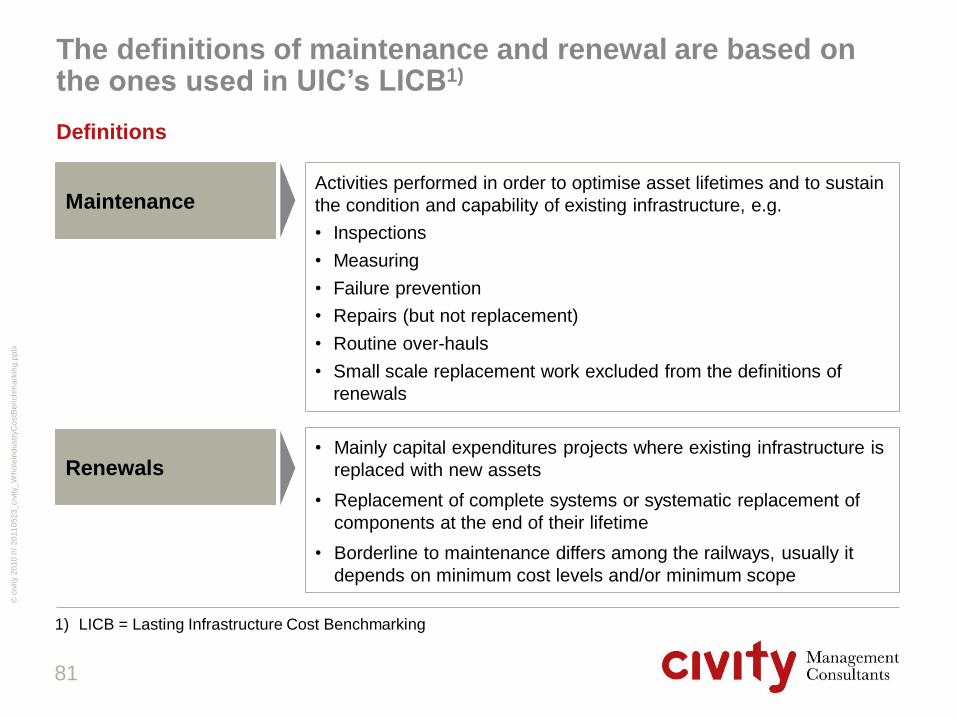
20
11
05
23
_civ
ity_
Wh
ole
Ind
ustr
yC
ostB
en
ch
ma
rkin
g.p
ptx
©
civ
ity 2
01
0 /
//
The definitions of maintenance and renewal are based on the ones used in UIC‟s LICB1)
Definitions
81
1) LICB = Lasting Infrastructure Cost Benchmarking
Renewals
Maintenance Activities performed in order to optimise asset lifetimes and to sustain
the condition and capability of existing infrastructure, e.g.
• Inspections
• Measuring
• Failure prevention
• Repairs (but not replacement)
• Routine over-hauls
• Small scale replacement work excluded from the definitions of
renewals
• Mainly capital expenditures projects where existing infrastructure is
replaced with new assets
• Replacement of complete systems or systematic replacement of
components at the end of their lifetime
• Borderline to maintenance differs among the railways, usually it
depends on minimum cost levels and/or minimum scope

20
11
05
23
_civ
ity_
Wh
ole
Ind
ustr
yC
ostB
en
ch
ma
rkin
g.p
ptx
©
civ
ity 2
01
0 /
//
Non normalised maintenance costs are the second highest in GB
Maintenance costs (2009, PPP-normalised)
82
35
6
30
NR1) A2)
19
31
C D2)
7
70
B2)
7
[k GBP / track-km]
Operational overhead
Other
Power supply
Signalling
Civil engineering
Track
Telecommunications
Buildings
Stations3)
1) Station maintenance costs including TOCs (NR: 24 m GBP; TOCs: 141 m GBP)
2) Operational overhead included in asset cost positions (no separate position)
3) Stations are indicated below the line as not all infrastructure managers are responsible for station
management
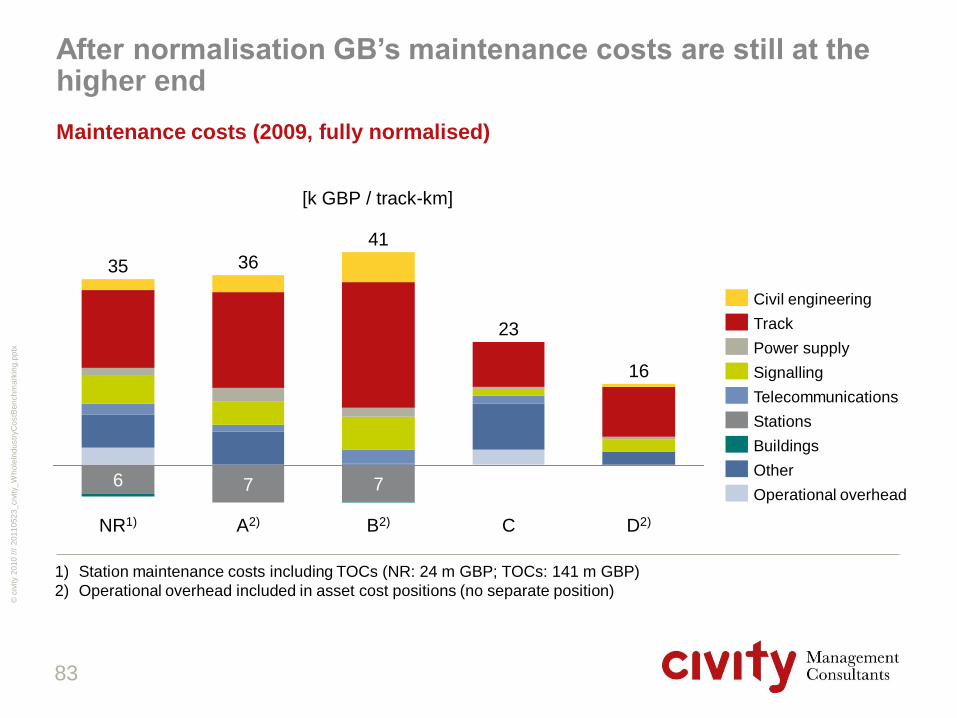
20
11
05
23
_civ
ity_
Wh
ole
Ind
ustr
yC
ostB
en
ch
ma
rkin
g.p
ptx
©
civ
ity 2
01
0 /
//
Maintenance costs (2009, fully normalised)
83
1) Station maintenance costs including TOCs (NR: 24 m GBP; TOCs: 141 m GBP)
2) Operational overhead included in asset cost positions (no separate position)
After normalisation GB‟s maintenance costs are still at the higher end
36
6
35
NR1) D2)
16
41
7
A2)
23
B2) C
7
Stations
Signalling
Civil engineering
Telecommunications
Power supply
Track
Buildings
Operational overhead
Other
[k GBP / track-km]
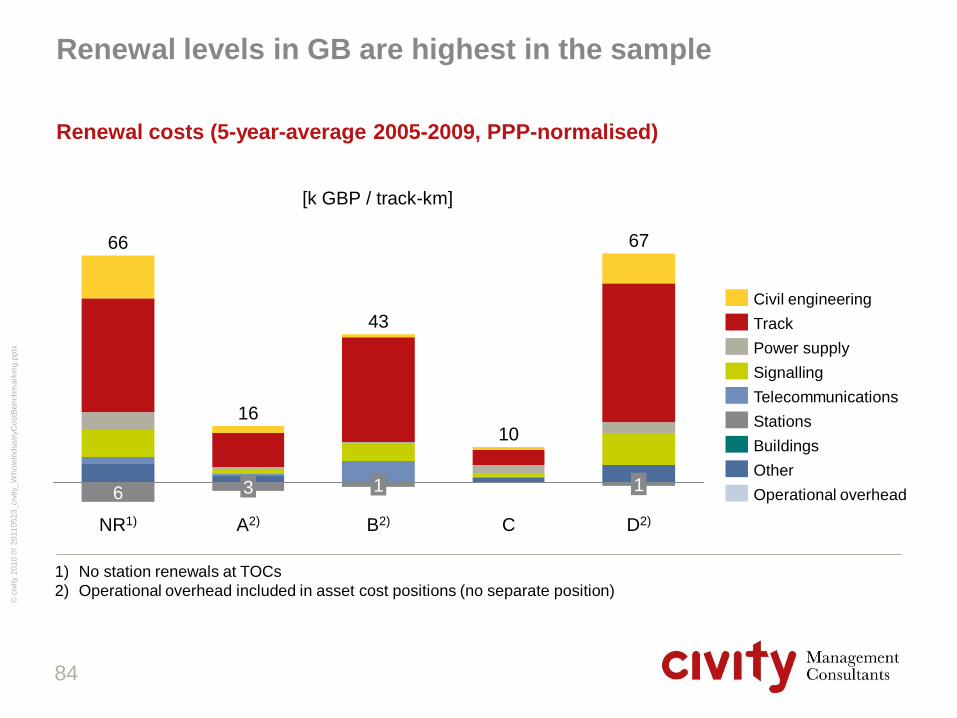
20
11
05
23
_civ
ity_
Wh
ole
Ind
ustr
yC
ostB
en
ch
ma
rkin
g.p
ptx
©
civ
ity 2
01
0 /
//
Renewal levels in GB are highest in the sample
Renewal costs (5-year-average 2005-2009, PPP-normalised)
84
NR1)
67
D2)
6
66
1
16
1
A2) C
43
10
B2)
3
1) No station renewals at TOCs
2) Operational overhead included in asset cost positions (no separate position)
Civil engineering
Operational overhead
Track
Signalling
Power supply
Other
Telecommunications
Buildings
Stations
[k GBP / track-km]

20
11
05
23
_civ
ity_
Wh
ole
Ind
ustr
yC
ostB
en
ch
ma
rkin
g.p
ptx
©
civ
ity 2
01
0 /
//
Renewal costs (5-year-average 2005-2009, fully normalised)
85
66
1
29
D2) NR1)
17
A2)
1
26
10
B2) C
6 3
1) No station renewals at TOCs
2) Operational overhead included in asset cost positions (no separate position)
Civil engineering
Operational overhead
Track
Signalling
Power supply
Other
Telecommunications
Buildings
Stations
After normalisation GB's renewal cost levels are still highest in sample
[k GBP / track-km]
20
11
05
23
_civ
ity_
Wh
ole
Ind
ustr
yC
ostB
en
ch
ma
rkin
g.p
ptx
©
civ
ity 2
01
0 /
//
The condition of the British Network leads to higher activity levels
Maintenance and renewal costs
• Former analyses1) has shown that based on the age structure Network Rail had built
up an investment backlog
• As a consequence Network Rails has increased renewals levels in order to catch-up
on the investment backlog which is partly explaining the high expenses in the sample
• Furthermore, current track quality and system reliability require enhanced
maintenance activity levels
• In addition to activity levels determining the volume of activities efficiency plays an
important role, both in maintenance and renewals
• For maintenance a number of cost driving factors had been identified:
– Annual labour cost levels are higher than European average
– Different unit cost levels across Network Rail's maintenance delivery units
– The under-utilisation of plant and machinery in combination with mark-ups for plant
in the UK
86
1) Gap Analyses by BSL in 2008

20
11
05
23
_civ
ity_
Wh
ole
Ind
ustr
yC
ostB
en
ch
ma
rkin
g.p
ptx
©
civ
ity 2
01
0 /
//
There is are various underlying factors with a negative impact on efficiency in maintenance and renewals
Maintenance and renewal costs
• Similarly, a number of underlying reasons had been identified for renewal activities:
– Comparatively high labour cost levels per full time employee
– Higher procurement costs for plant and machinery
– UK uses mainly conventional plant whereas other European countries more
commonly use high output equipment
– Productive times in possessions are shorter than in other countries
– Non realised economies of scale due to longer work-sites
– High transaction costs in projects and insufficient stability in planning
• The issue of higher staff costs had been addressed in a recent study on "People in the
GB Rai lndustry; a PPP-adjusted comparison of NR's annual salary with DB, ProRail
and Banverket (Trafikverket) shows significant disadvantages of Network Rail
compared to Germany and Sweden (25% less cost in Sweden than in GB)
87

20
11
05
23
_civ
ity_
Wh
ole
Ind
ustr
yC
ostB
en
ch
ma
rkin
g.p
ptx
©
civ
ity 2
01
0 /
//
For a more realistic picture of renewals comparisons would need to be based on a steady state
Steady state
Steady state
LICB
• Currently cost comparisons show annual maintenance and (mid-term) renewal expenditures
• Expenditures are determined by work activity volumes and corresponding unit cost
• Therefore, a period of increased renewal expenditures (e.g. to catch up an investment backlog) does not necessarily reflect inefficiency in unit costs
• Vice versa an infrastructure manager with low expenditure levels in the comparison might just invest less in its network and consequently build up an investment backlog
• To get a realistic picture of the individual position, comparisons need to be based on steady-state activity levels
• An age- and condition-based renewal forecast covering at least one life cycle shows typical ups and downs (see upper illustration)
• The derivation of long-term annual averages would mean an important step from comparing expenditure levels to comparing different cost levels needed for balanced infrastructure maintenance and renewals
• The lower graph – based on real data – shows the order of magnitude by which current expenditures deviate from steady-state regeneration levels
Steady state LICB
Annual renewal expenditures per km
Long-term average
Age
Backlog
Typical renewal forecast
Steady state reinvestment needs Remarks
88

20
11
05
23
_civ
ity_
Wh
ole
Ind
ustr
yC
ostB
en
ch
ma
rkin
g.p
ptx
©
civ
ity 2
01
0 /
//
On average, all infrastructure managers renewed more during the last five years compared to the last decade
10 year average of renewals (1)
89
0
20
40
60
80
100
120
140
2000 2001 2002 2003 2004 2005 2006 2007 2008 2009
+7% avg. 00-09
avg. 05-09
Renewals +14%
+26%+26%
+7%
+17%
A NR D B C
Cost index
[avg. 00-09 = 100%]

20
11
05
23
_civ
ity_
Wh
ole
Ind
ustr
yC
ostB
en
ch
ma
rkin
g.p
ptx
©
civ
ity 2
01
0 /
//
The comparators' renewal volumes were on avarage more than 15% higher in the last five year period
10 year average of renewals (2)
• The graph depicts Network Rail's renewal expenditures indexed over a period of ten
years (red line)
• In a ten year perspective (brown line) these expenditures have been 7% lower than in
a five year perspective (black line) or: between 2005 and 2009 Network Rail has
uplifted the level of renewals
• This difference has been analysed for other countries in the peer group, too; the result
is that all countries show the same trend: average renewal volumes in a five year
period are 12% to 21% higher than in a ten year period
90
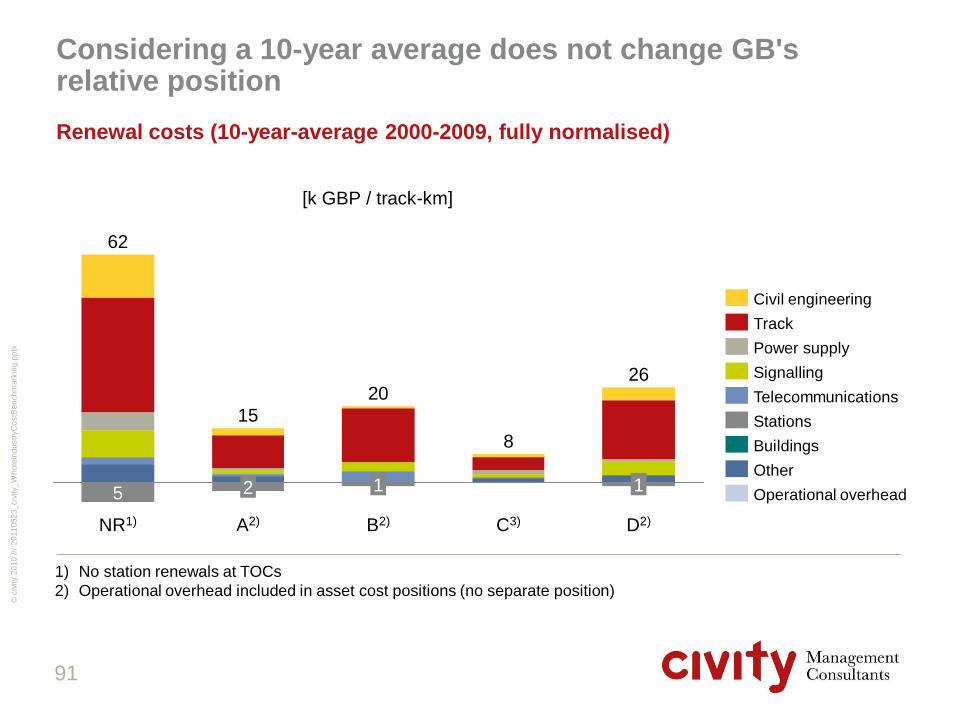
20
11
05
23
_civ
ity_
Wh
ole
Ind
ustr
yC
ostB
en
ch
ma
rkin
g.p
ptx
©
civ
ity 2
01
0 /
//
Renewal costs (10-year-average 2000-2009, fully normalised)
91
D2)
26
1
C3)
8
B2)
20
1
A2)
15
NR1)
62
5 2
1) No station renewals at TOCs
2) Operational overhead included in asset cost positions (no separate position)
Operational overhead
Stations
Buildings
Other
Track
Signalling
Telecommunications
Power supply
Civil engineering
Considering a 10-year average does not change GB's relative position
[k GBP / track-km]
20
11
05
23
_civ
ity_
Wh
ole
Ind
ustr
yC
ostB
en
ch
ma
rkin
g.p
ptx
©
civ
ity 2
01
0 /
//
Due to different sourcing strategies Network Rail's staff num-bers can hardly be compared to other infrastructure managers
Staff infrastructure maintenance and renewals
• Network Rail employs 564 staff for maintenance per main track km and 220 for
renewal activities per main track km; concerning maintenance Network Rail's strategy
is to fully insource these activities
• The degree of outsourcing maintenance and renewals varies broadly throughout
Europe, two countries in the sample have chosen to fully outsource maintenance and
renewals
• Over more than a decade they have developed the market for infrastructure
maintenance and construction companies, nowadays employing staff to manage the
network and contractors only
• One country with a similar sourcing philosophy as GB has a total headcount for
maintenance and renewal staff which is about 12% less than in GB
92

20
11
05
23
_civ
ity_
Wh
ole
Ind
ustr
yC
ostB
en
ch
ma
rkin
g.p
ptx
©
civ
ity 2
01
0 /
//
4. Infrastructure
4.1. Introduction
4.2. Total cost and network characteristics
4.3. Maintenance and renewal costs
4.4. Network operations costs
4.5. Infrastructure operating costs (overhead)
4.6. Conclusions
93

20
11
05
23
_civ
ity_
Wh
ole
Ind
ustr
yC
ostB
en
ch
ma
rkin
g.p
ptx
©
civ
ity 2
01
0 /
//
Network operations cost consist of four cost categories
Definitions
94
Station management
Customer service and
security
Traffic management Staff responsible for strategic / operational planning, signalling,
traffic control, supervisory tasks, train paths
Staff responsible for the management of passenger stations,
dispatching of trains etc.
Staff responsible for passenger information in call and customer
centers, assistance on platforms and in stations, ticket sales,
security personnel in stations
These costs could not be separated and are included in the
other positions
Traction power supply Acquisition and provision of the traction power or production and
provision (if infrastructure operator produces the energy himself)
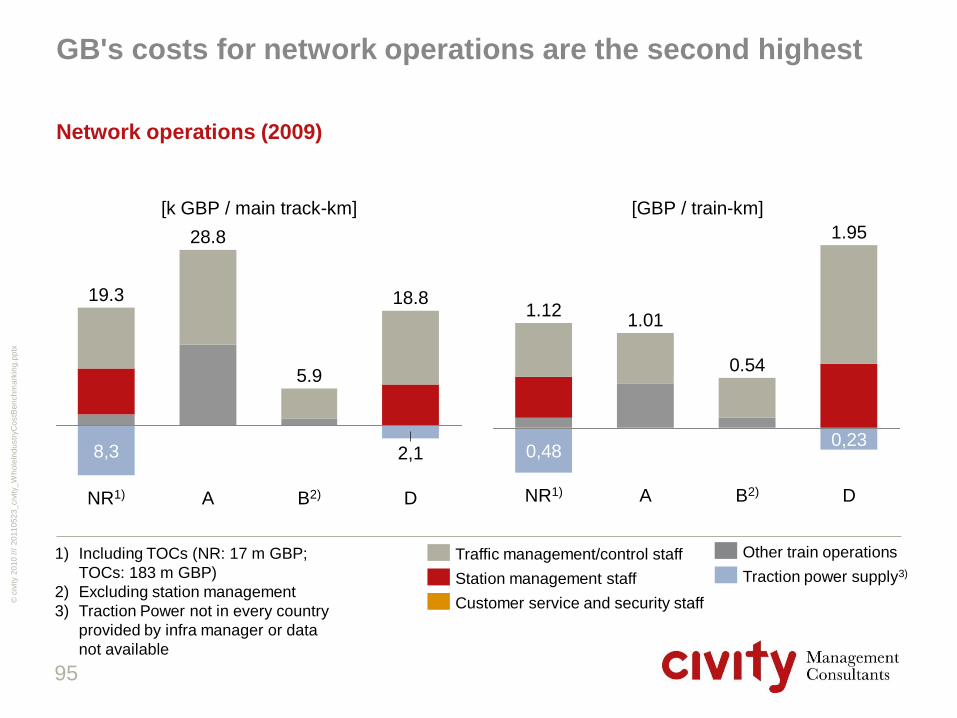
20
11
05
23
_civ
ity_
Wh
ole
Ind
ustr
yC
ostB
en
ch
ma
rkin
g.p
ptx
©
civ
ity 2
01
0 /
//
1) Including TOCs (NR: 17 m GBP;
TOCs: 183 m GBP)
2) Excluding station management
3) Traction Power not in every country
provided by infra manager or data
not available
GB's costs for network operations are the second highest
Network operations (2009)
95
[k GBP / main track-km]
D
18.8
2,1
B2)
5.9
A
28.8
NR1)
19.3
8,3
[GBP / train-km]
1.01
B2) A
0.54
D
0,23
1.95
NR1)
1.12
0,48
Traffic management/control staff Other train operations
Station management staff
Customer service and security staff
Traction power supply3)

20
11
05
23
_civ
ity_
Wh
ole
Ind
ustr
yC
ostB
en
ch
ma
rkin
g.p
ptx
©
civ
ity 2
01
0 /
//
The cost of traffic management is usually driven by traffic control, Network Rail is on a similar level as others
Network operations
The cost for network operations are difficult to grasp as peers had difficulties to separate
the cost by different cost categories
Traffic management
• All peers were able to provide figures on traffic management cost in total
• These cost comprise different functions such as strategic / operational planning,
signalling, traffic control, supervisory tasks, production of train paths
• From our experience we expect most staff to be allocated to signalling, traffic control
and production of train paths
• GB's spending per train-km, as the significant cost driving factor, is rather similar for
Network Rail and the two peers A and B, possibly revealing some potential for
Network Rail compared to peer B
• Peer C's cost are comparably high due to a high number of interlockings that have
not been centralised so far
96
20
11
05
23
_civ
ity_
Wh
ole
Ind
ustr
yC
ostB
en
ch
ma
rkin
g.p
ptx
©
civ
ity 2
01
0 /
//
Network Rail's cost of station management per train kilometre are lower than in country C
Network operations
Station management
• Station management cost as another significant position was provided separately
only Network Rail/TOCs and by one other peer
• As British TOC's are partly responsible for station management their cost position
"Staff cost commercial" had to be split into "Stations" as part of infrastructure and
TOCs' operations cost
• Network Rail displays a slight cost disadvantage against peer C based on main
track-km, but a cost advantage based on train-km which is the most driving factor for
expenses in this area (more trains reveal an impact on passenger information,
assistance on platforms/in stations, ticket sales etc.)
• Peer B is not in charge of station management, thus no cost is emerging
• For peer A it was not possible to separate station management cost from "other train
operations" cost, thus not being comparable without further analysis
• The study "People in the GB Rail Industry" points out that there may be too many
stations employing one staff only which could be questioned
97
20
11
05
23
_civ
ity_
Wh
ole
Ind
ustr
yC
ostB
en
ch
ma
rkin
g.p
ptx
©
civ
ity 2
01
0 /
//
In particular "other train operations cost" include a number of different cost elements
Network operations
Other train operations
• These costs include utilities, plant/machinery, IT and telephone, but also
"Miscellaneous" which cannot be allocated to the cost positions in the questionnaires
(e.g. general surveillance of the network, calamity management)
• Thus no one-to-one comparison of "other train operations cost" is fruitful without
further analysing the activities
Traction power supply
• The cost for traction power supply were provided by one external peer only and are
than at Network Rail (per train-km)
• To better understand better the cost differences the purchasing philosophies as well
as the market prices of electric power require more in depth analysis (for reasons of
anonymity no further explanations are provided here)
98
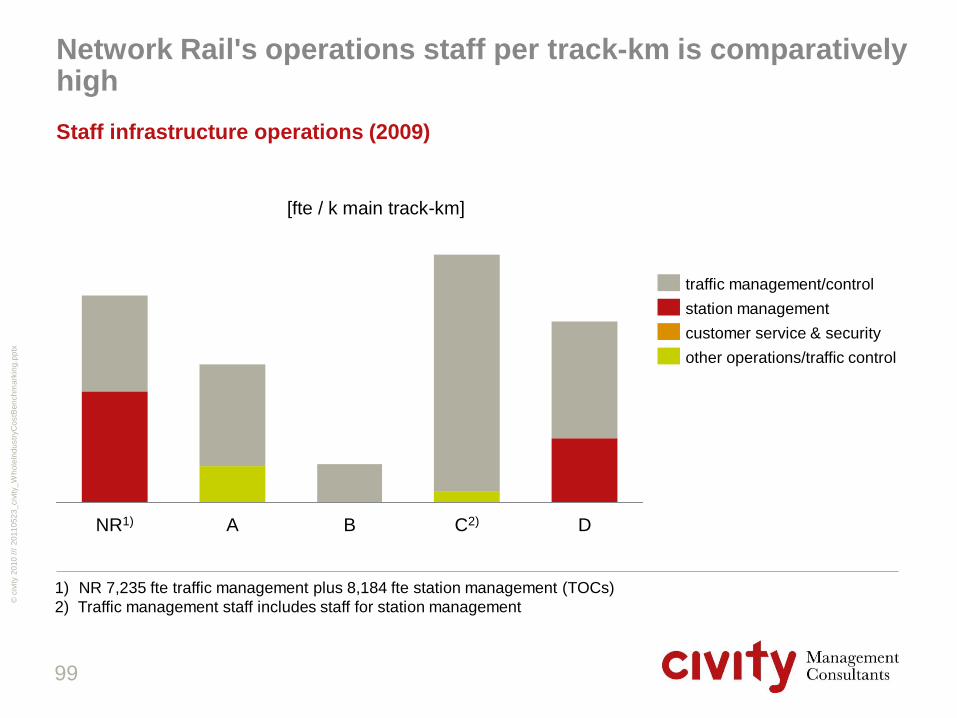
20
11
05
23
_civ
ity_
Wh
ole
Ind
ustr
yC
ostB
en
ch
ma
rkin
g.p
ptx
©
civ
ity 2
01
0 /
//
Network Rail's operations staff per track-km is comparatively high
Staff infrastructure operations (2009)
99
[fte / k main track-km]
1) NR 7,235 fte traffic management plus 8,184 fte station management (TOCs)
2) Traffic management staff includes staff for station management
D C2) B A NR1)
station management
customer service & security
other operations/traffic control
traffic management/control

20
11
05
23
_civ
ity_
Wh
ole
Ind
ustr
yC
ostB
en
ch
ma
rkin
g.p
ptx
©
civ
ity 2
01
0 /
//
[route-km / control point]
Countries A and B have completely eliminated manned signal boxes and established centralised control centres
Average route length covered by manned control points (2009)
100
13
222
15n/a
B
1,289
A NR D C
• Some countries have been
establishing centralised
control centers by reducing
the number of manned
interlockings
• This leads to less staff and a
higher productivity in terms
of route kilometers managed
per control center and full
time employee
• If staff is effectively reduced
operating costs can be
decreased
• Countries A and B have
managed to increase the
number of route km
managed per control point

20
11
05
23
_civ
ity_
Wh
ole
Ind
ustr
yC
ostB
en
ch
ma
rkin
g.p
ptx
©
civ
ity 2
01
0 /
//
Average route length and traffic volume per fte traffic management (2009)
101
[route-km / fte] [k train-km / fte]
A
B
C
D
120 100 80 60 40 20 0 2 4 6 8 10
NR
Country B has benefitted rigorously from centralisation and automation
• Countries A and B manage a
larger number of train-km per
full time equivalent than
other countries
• Whereas country B has
signigicantly reduced the
number of operating staff,
country A has not gone that
far yet

20
11
05
23
_civ
ity_
Wh
ole
Ind
ustr
yC
ostB
en
ch
ma
rkin
g.p
ptx
©
civ
ity 2
01
0 /
//
The combination of centralisation and efficiency improvements can unlock substantial cost reductions
Traffic management/control
• Several European infrastructure managers have started programmes to centralise
control centers and reduce the number of interlockings
• This is an opportunity to reduce the number of staff and increase the productivity of
manned control centers (90% of the total cost of network operations is driven by staff)
• The full potential can only be unlocked by a number of additional measures aiming at
an improvement of efficiency such as
– IT-based traffic planning and decision support to dispatchers
– A reduction of traffic perturbations which create additional workload
– The application of sophisticated staffing rules by calculation methods, parameters
and time values
– An increase of productive working time by shift flexibility, multitasking, part-time
work, management of take-over times and the optimisation of working hours
– A reduction of hourly cost of labour by increasing net working hours
102
20
11
05
23
_civ
ity_
Wh
ole
Ind
ustr
yC
ostB
en
ch
ma
rkin
g.p
ptx
©
civ
ity 2
01
0 /
//
4. Infrastructure
4.1. Introduction
4.2. Total cost and network characteristics
4.3. Maintenance and renewal costs
4.4. Network operations costs
4.5. Infrastructure operating costs (overhead)
4.6. Conclusions
103
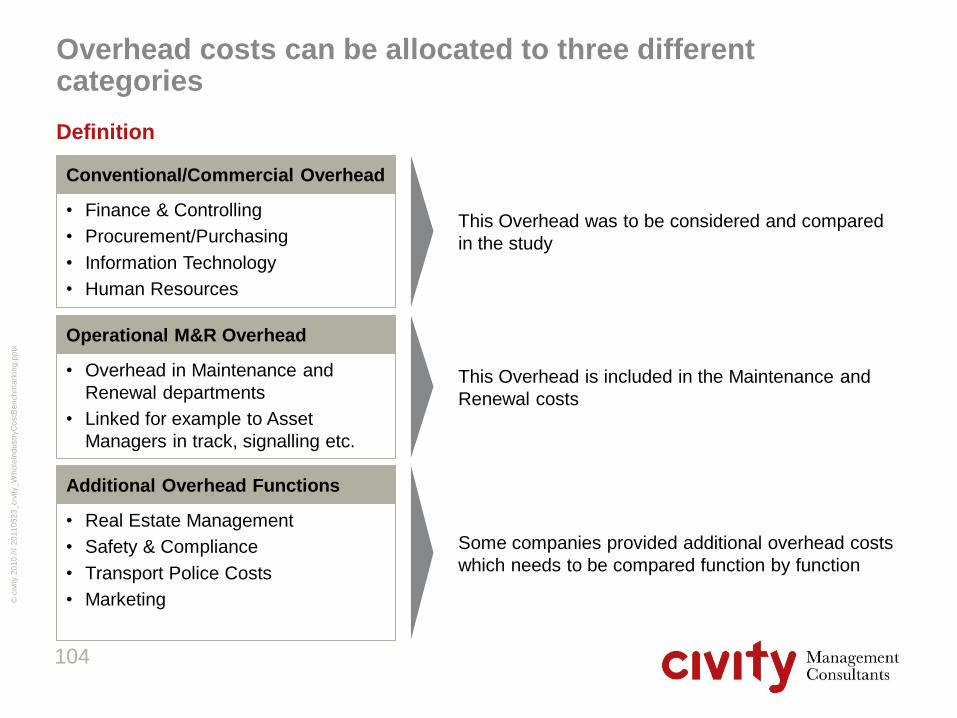
20
11
05
23
_civ
ity_
Wh
ole
Ind
ustr
yC
ostB
en
ch
ma
rkin
g.p
ptx
©
civ
ity 2
01
0 /
//
Overhead costs can be allocated to three different categories
Definition
104
• Finance & Controlling
• Procurement/Purchasing
• Information Technology
• Human Resources
Conventional/Commercial Overhead
This Overhead was to be considered and compared
in the study
• Overhead in Maintenance and
Renewal departments
• Linked for example to Asset
Managers in track, signalling etc.
Operational M&R Overhead
This Overhead is included in the Maintenance and
Renewal costs
• Real Estate Management
• Safety & Compliance
• Transport Police Costs
• Marketing
Additional Overhead Functions
Some companies provided additional overhead costs
which needs to be compared function by function

20
11
05
23
_civ
ity_
Wh
ole
Ind
ustr
yC
ostB
en
ch
ma
rkin
g.p
ptx
©
civ
ity 2
01
0 /
//
A Country A provided total cost and a limited cost separation only
The degree of detail of overhead cost and staff data varies
Overhead
105
Network Rail
C
B
Network Rail provided a cost breakdown for
conventional/commercial overhead and additional functions; staff
is one total number
For country C overhead numbers are not completely available
Country C provided a cost breakdown for conventional/commercial
overhead and additional functions; staff is broken down, too
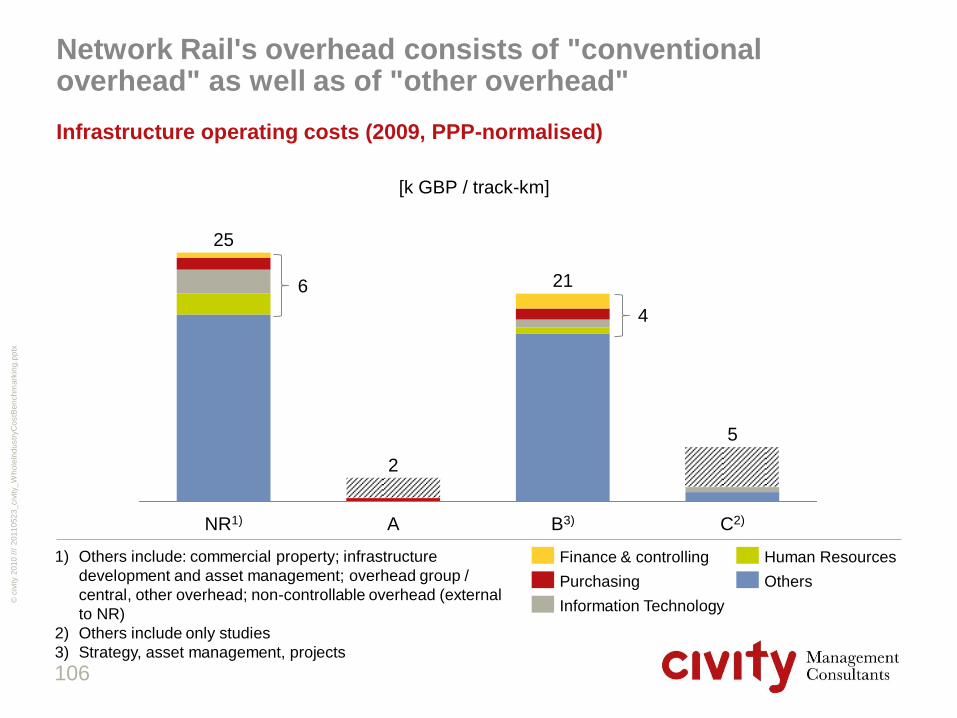
20
11
05
23
_civ
ity_
Wh
ole
Ind
ustr
yC
ostB
en
ch
ma
rkin
g.p
ptx
©
civ
ity 2
01
0 /
//
Infrastructure operating costs (2009, PPP-normalised)
106
21
B3) A
25
2
NR1) C2)
5
[k GBP / track-km]
Others
Human Resources
Information Technology
Purchasing
Finance & controlling
Network Rail's overhead consists of "conventional overhead" as well as of "other overhead"
1) Others include: commercial property; infrastructure
development and asset management; overhead group /
central, other overhead; non-controllable overhead (external
to NR)
2) Others include only studies
3) Strategy, asset management, projects
6
4
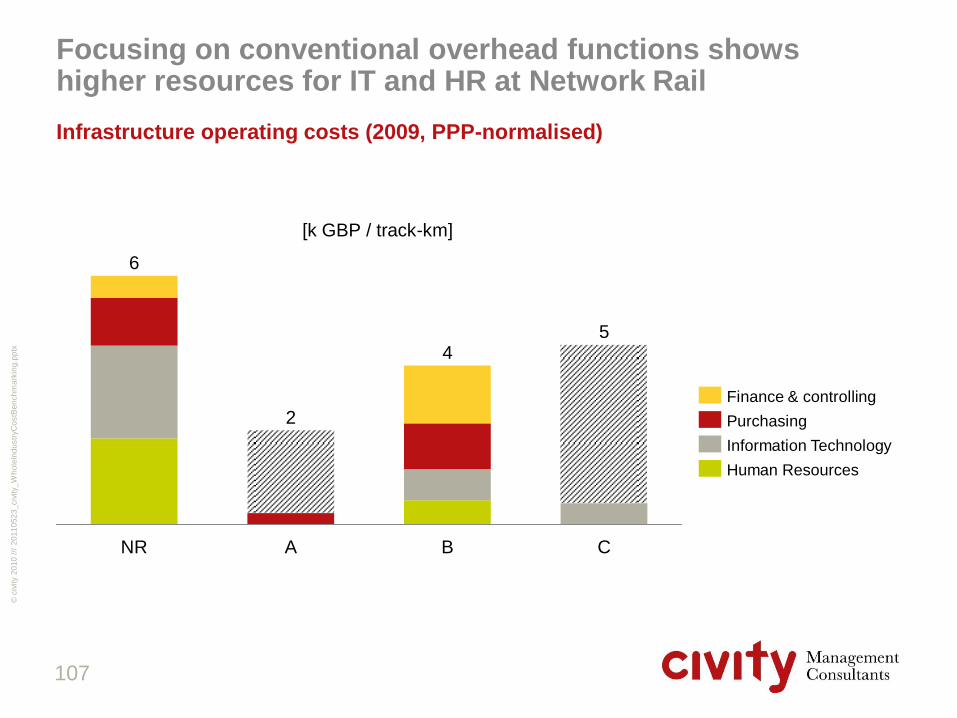
20
11
05
23
_civ
ity_
Wh
ole
Ind
ustr
yC
ostB
en
ch
ma
rkin
g.p
ptx
©
civ
ity 2
01
0 /
//
Infrastructure operating costs (2009, PPP-normalised)
107
5
B
6
4
A
2
NR C
[k GBP / track-km]
Purchasing
Human Resources
Information Technology
Finance & controlling
Focusing on conventional overhead functions shows higher resources for IT and HR at Network Rail

20
11
05
23
_civ
ity_
Wh
ole
Ind
ustr
yC
ostB
en
ch
ma
rkin
g.p
ptx
©
civ
ity 2
01
0 /
//
Infrastructure operating costs (2009, PPP-normalised)
108
[% of total infrastructure costs]
B
17
3
A
6
1
NR
15
4 Commercial
overhead
C
6
1
The share of comparable commercial overhead is between 3% in country B and 4 % in GB
• Only country B is comparable
to Network Rail
• Country A only separated the
cost for procurement
• Country C did not provide a
complete separation either
• According to country A's
annual report administration
costs are at 3,3% in relation
to total operational costs
• In other publicly owned
railway organisations
commercial overhead –
including properties – makes
for 4-5% of total cost
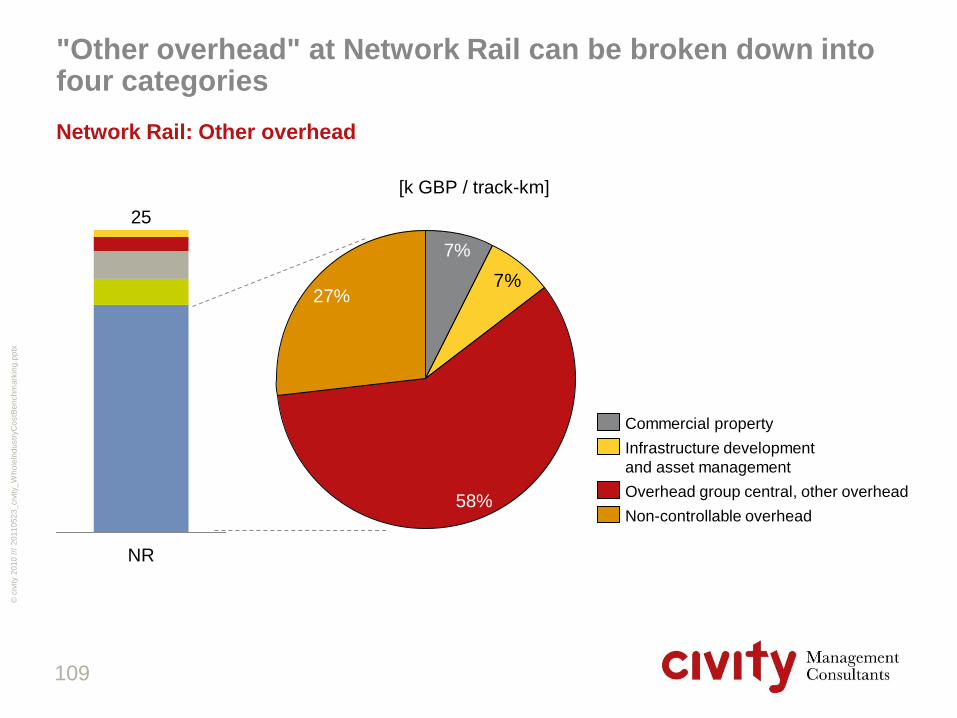
20
11
05
23
_civ
ity_
Wh
ole
Ind
ustr
yC
ostB
en
ch
ma
rkin
g.p
ptx
©
civ
ity 2
01
0 /
//
"Other overhead" at Network Rail can be broken down into four categories
Network Rail: Other overhead
109
7%27%
58%
7%
Non-controllable overhead
Overhead group central, other overhead
Infrastructure development
and asset management
Commercial property
NR
25
[k GBP / track-km]

20
11
05
23
_civ
ity_
Wh
ole
Ind
ustr
yC
ostB
en
ch
ma
rkin
g.p
ptx
©
civ
ity 2
01
0 /
//
Pensions, group insurance, bonus payments, BT Transport Police, RSSB accumulate 73% of other overhead
Network Rail: Other overhead
110
Commercial Property (44 mio. GBP) Infrastructure Development and Asset
Management (43 mio. GBP)
• Commercial lettings
• Developments
• Retail space at Network Rail's stations
• Planning and development (8 mio. GBP)
• Infrastructure investments/projects (-2 mio.
GBP)
• Asset management and engineering/
Asset heads (37 mio. GBP)
Overhead Group/Central, other overhead
(344 mio. GBP)
Non-controllable overhead (external to NR)
(158 mio. GBP)
• Other corporate services (335 mio. GBP for
pensions, staff annual performance bonus,
group insurance etc.)
• Safety and compliance (2 mio. GBP)
• National Delivery Service (7 mio. GBP)
• Cumolo rates
• BT Transport Police costs (74 mio. GBP)
• Rail Safety & Standards Board (RSSB, 76
mio. GBP)
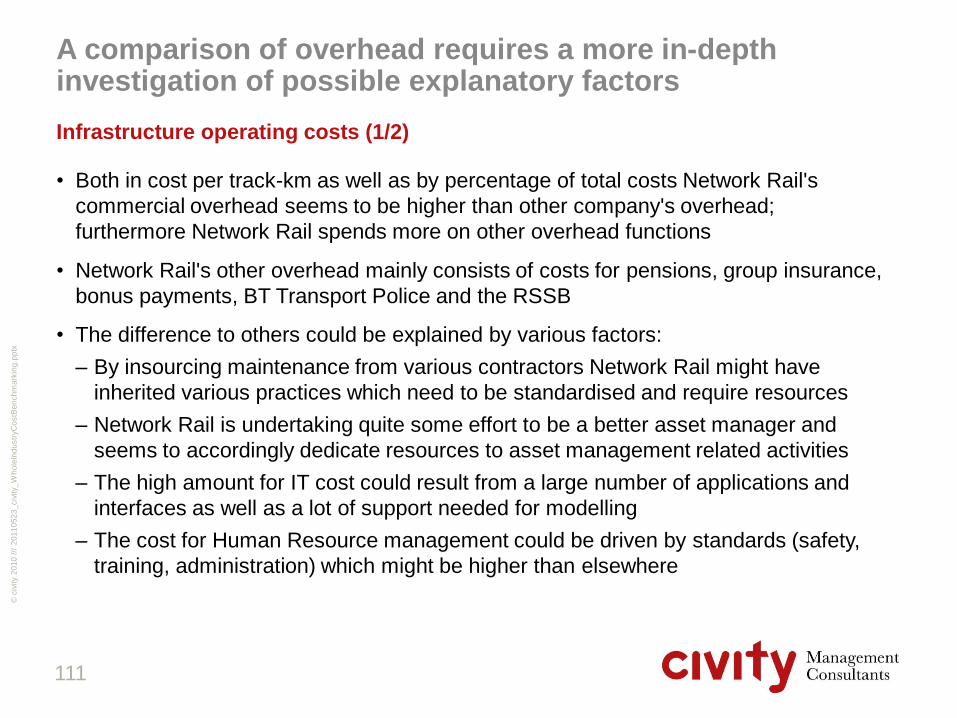
20
11
05
23
_civ
ity_
Wh
ole
Ind
ustr
yC
ostB
en
ch
ma
rkin
g.p
ptx
©
civ
ity 2
01
0 /
//
A comparison of overhead requires a more in-depth investigation of possible explanatory factors
Infrastructure operating costs (1/2)
• Both in cost per track-km as well as by percentage of total costs Network Rail's
commercial overhead seems to be higher than other company's overhead;
furthermore Network Rail spends more on other overhead functions
• Network Rail's other overhead mainly consists of costs for pensions, group insurance,
bonus payments, BT Transport Police and the RSSB
• The difference to others could be explained by various factors:
– By insourcing maintenance from various contractors Network Rail might have
inherited various practices which need to be standardised and require resources
– Network Rail is undertaking quite some effort to be a better asset manager and
seems to accordingly dedicate resources to asset management related activities
– The high amount for IT cost could result from a large number of applications and
interfaces as well as a lot of support needed for modelling
– The cost for Human Resource management could be driven by standards (safety,
training, administration) which might be higher than elsewhere
111

20
11
05
23
_civ
ity_
Wh
ole
Ind
ustr
yC
ostB
en
ch
ma
rkin
g.p
ptx
©
civ
ity 2
01
0 /
//
A more in-depth analysis is needed to explore the underlying reasons for the gap
Infrastructure operating costs (2/2)
• Explanatory factors (continued):
– Planning & Regulation as well as Government & Corporate Affairs seem to bind a
substantial number of staff
– Other overhead seems to be driven by cost elements which do not occur at other
infrastructure managers: transport police, Rail Safety & Standards Board
– Network Rail is spending 44 mio. GBP which covers the development and
management of real estate such as complex stations. One of the countries
considered is not in charge of this function
– There is a degree of uncertainty to what extent overhead is actually included in
these figures and what part is "hidden" in functions on a decentral level (for example
HR or controlling support in the maintenance department)
• To remove uncertainty about the underlying reasons a more in-depth analyses
including precise cost allocation and headcounts based on a detailed breakdown of
overhead functions would be needed
112
20
11
05
23
_civ
ity_
Wh
ole
Ind
ustr
yC
ostB
en
ch
ma
rkin
g.p
ptx
©
civ
ity 2
01
0 /
//
4. Infrastructure
4.1. Introduction
4.2. Total cost and network characteristics
4.3. Maintenance and renewal costs
4.4. Network operations costs
4.5. Infrastructure operating costs (overhead)
4.6. Conclusions
113

20
11
05
23
_civ
ity_
Wh
ole
Ind
ustr
yC
ostB
en
ch
ma
rkin
g.p
ptx
©
civ
ity 2
01
0 /
//
Driven by renewal expenditures GB's infrastructure costs are highest in sample
Key findings
• GB's network is the second largest in sample, utilisation being about average. Other
comparators like The Netherlands and Switzerland have denser traffic with higher train
frequencies and tonnage
• Cost differences due to utilisation and network complexity need to be adjusted as they
can only be influenced in the long run. The necessary adjustments are made in the
normalisation process
• Fully normalised GB's maintenance expenditures are 10 to 20% below cost levels of
countries A and B but more than twice as high as in country D
• GB's total normalised renewal expenditures are significantly higher than the
comparators' expenditures; an analyses of five and ten year average renewal
expenditures shows that all peers including Network Rail have lifted up their renewals
in the more recent five year period
• As former gap analyses has shown NetworkRail's high expenditure level is not only
due to catching-up on backlogs but also caused by high unit costs
114
20
11
05
23
_civ
ity_
Wh
ole
Ind
ustr
yC
ostB
en
ch
ma
rkin
g.p
ptx
©
civ
ity 2
01
0 /
//
Infrastructure costs and performance (2)
Key findings
• Operation costs are strongly influenced by the number of manned interlockings and
staff-related costs
• Concentration has led to a small number of centralised control centres in two
countries – all manned signal boxes were abandoned; one country has unlocked
significant savings potentials by effectively reducing staff numbers
• Related to traffic output GB's operations cost are at about average; centralisation and
automation of network operations in GB seemt to bear a potential for efficiency
increases
• Network Rail's "classical" overhead seems higher than in other countries but
comparability is very limited
• Network Rail has also provided cost data on other overhead functions which cannot
be directly compared but drive Network Rail's infrastructure cost
• Due to different sourcing strategies staff sizes for maintenance and renewals varies
broadly
115

20
11
05
23
_civ
ity_
Wh
ole
Ind
ustr
yC
ostB
en
ch
ma
rkin
g.p
ptx
©
civ
ity 2
01
0 /
//
Content page
1. Introduction 3
2. Market development and structures 12
3. Performance 61
4. Infrastructure 71
5. Train operations (incl. Rolling stock) 116
6. Freight train operations 150
7. Funding and revenues 152
8. Market analysis Germany 162
9. Methodology 185
10. Conclusions 195
116

20
11
05
23
_civ
ity_
Wh
ole
Ind
ustr
yC
ostB
en
ch
ma
rkin
g.p
ptx
©
civ
ity 2
01
0 /
//
5. Train operations (incl. Rolling stock)
5.1. Introduction
5.2. Total cost and structural characteristics
5.3. Train staff
5.4. Customer and operation management
5.5. Overhead
5.6. Track access charges and energy
5.7. Rolling stock
5.8. Conclusions
117

20
11
05
23
_civ
ity_
Wh
ole
Ind
ustr
yC
ostB
en
ch
ma
rkin
g.p
ptx
©
civ
ity 2
01
0 /
//
Data for passenger train operations have been evaluated using a proven functional cost structure
Cost structure
118
Rolling
stock
Track access & energy
Overhead
Operation &
customer management
Train staff
Infra-
structure
Train
operation
(Drivers, crew)
(CAPEX,
OPEX)

20
11
05
23
_civ
ity_
Wh
ole
Ind
ustr
yC
ostB
en
ch
ma
rkin
g.p
ptx
©
civ
ity 2
01
0 /
//
Train operations costs mainly consist of train operators and rolling stock
Train operation costs
119
• Train operation costs will be split into three categories
• Train operations includes
• Staff necessary to operate trains such as drivers, conductors and other crew
• Staff to manage staff
• Staff for customer management
• Non staff related cost to access track and run trains such as track access charges and
power supply and other costs
• The overhead necessary to operate staff and trains is separated and mainly staff driven
• Rolling stock costs are split into maintenance and capital costs
TOC
T
O
T
A
L
Train operator
Rolling stock
Overhead
Maintenance
Capital costs
Train staff Ops & cust. mgmt
TAC Charges & Fees
Maintenance Transport Overhead
Leasing charges Capital exp. …
TAC Power supply Fees
Driver Conductor Crew
20
11
05
23
_civ
ity_
Wh
ole
Ind
ustr
yC
ostB
en
ch
ma
rkin
g.p
ptx
©
civ
ity 2
01
0 /
//
5. Train operations (incl. Rolling stock)
5.1. Introduction
5.2. Total cost and structural characteristics
5.3. Train staff
5.4. Customer and operation management
5.5. Overhead
5.6. Track access charges and energy
5.7. Rolling stock
5.8. Conclusions
120

20
11
05
23
_civ
ity_
Wh
ole
Ind
ustr
yC
ostB
en
ch
ma
rkin
g.p
ptx
©
civ
ity 2
01
0 /
//
Compared to state owned operators GB's non-normalised total train operation costs are the second lowest in sample
Total train operation costs (2009, excluding track access, non normalised)
121
[GBP / train-km]
D1)
9.55
C1)
10.89
B
11.31
A
14.08
GBR 192)
10.69
13.86
Regio2)
9.77
LSE2)
9.56
IC2)
Rolling stock
Energy and user fees
Overhead
Operation and customer management
Train staff 1) Cost distribution of shaded block not known
2) Operation management costs here contains a
portion of rolling stock maintenance staff costs

20
11
05
23
_civ
ity_
Wh
ole
Ind
ustr
yC
ostB
en
ch
ma
rkin
g.p
ptx
©
civ
ity 2
01
0 /
//
Structural parameters differ and require normalisation
Structural characteristics (2009)
122
73
0
69
0
67
99
5657
Regio LSE D C B A GBR
19
IC
Travel speed
[km / h]
00
216260
190
330
180166
D C B A GBR
19
IC Regio LSE
Average annual running performance per unit
[k train-km]
00
109
0
156
41
185199
D C B A GBR
19
IC Regio LSE
Total number of stopping actions
[1/k km]
n/a n/a
n/a n/a n/a n/a
00
919090909090
D C B A GBR
19
IC Regio LSE
Fleet utilisation peak time
[%]
n/a n/a
For further information on the methodology and normalisation process please refer to chapter 9
n/a

20
11
05
23
_civ
ity_
Wh
ole
Ind
ustr
yC
ostB
en
ch
ma
rkin
g.p
ptx
©
civ
ity 2
01
0 /
//
Compared to other state-owned train operators normalised costs per train-km are second lowest in GB
Total train operation costs (2009, excluding track access, partly normalised1))
123
[GBP / train-km]
D1)
9.55
C1)
10.89
B
10.98
A
13.30
GBR 192)
10.69
IC2)
13.86
Regio2)
9.77
LSE2)
9.56
Rolling stock
Overhead
Operation and customer management
Train staff
Energy and user fees
Track access 6.44 4.57 10.22 6.83 5.11 1.05 0.44 1.69
1) Train operation and rolling stock has been normalised for
the countries where normalisation factors were known
2) Cost allocation of shaded block not known
3) Operation management costs here contains a portion of
rolling stock maintenance staff costs
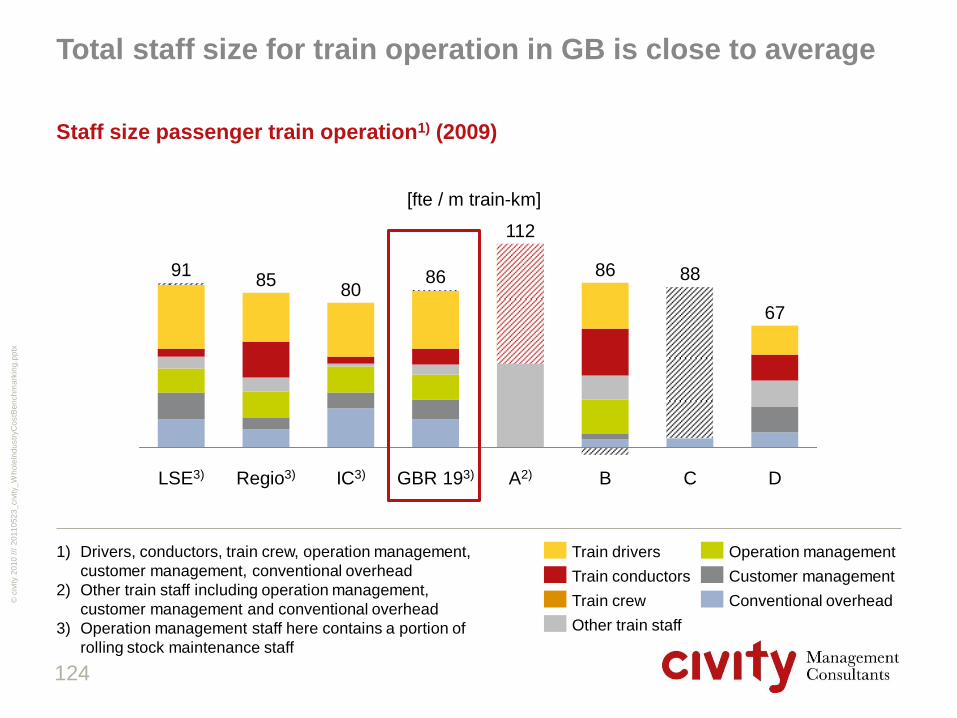
20
11
05
23
_civ
ity_
Wh
ole
Ind
ustr
yC
ostB
en
ch
ma
rkin
g.p
ptx
©
civ
ity 2
01
0 /
//
Total staff size for train operation in GB is close to average
Staff size passenger train operation1) (2009)
124
[fte / m train-km]
1) Drivers, conductors, train crew, operation management,
customer management, conventional overhead
2) Other train staff including operation management,
customer management and conventional overhead
3) Operation management staff here contains a portion of
rolling stock maintenance staff
85
Regio3)
91
LSE3) D
67
C
88
B
86
A2)
112
GBR 193)
86
IC3)
80
Operation management
Other train staff
Train conductors
Train crew
Train drivers
Conventional overhead
Customer management

20
11
05
23
_civ
ity_
Wh
ole
Ind
ustr
yC
ostB
en
ch
ma
rkin
g.p
ptx
©
civ
ity 2
01
0 /
//
Comparison of train operation costs is against state-owned operators
Total train operation costs
• Normalised data show that GBR19's train operating costs are at the lower level of the
sample
• Track access charges have been excluded as they are externally set by the
infrastructure manager and not (fully) controllable by the train operating company
• In contrast to GB the other countries have not franchised all rail passenger services
and state-owned operators such as SNCF, NS Reizigers and SJ still dominate the
national markets
• Whereas British Rail ceased to exist these companies are still operating
• This is clearly reflected in market structures shown in chapter 2.4; the state-operators
still have significant market shares and contribute to most of the national system cost
related to train operations
• In order to maximise coverage of total system cost the comparison of British TOCs is
against these large and dominating state-operators and not against smaller private
operators
• Nevertheless it needs to be mentioned that former studies have identified cost
savings in a range of 20 to 40% from franchising (see EMCT 2007)
125

20
11
05
23
_civ
ity_
Wh
ole
Ind
ustr
yC
ostB
en
ch
ma
rkin
g.p
ptx
©
civ
ity 2
01
0 /
//
Comparison of train operation costs is against state-owned operators
Total train operation costs
• The analysis on the German market for regional passenger rail services underpins
these trends: German public transport authorities have realised savings between 15
and 47%, depending on the type of service
• Hence there could be a potential for the other countries to further reduce their costs
by tendering more rail services what would challenge GBR19's actual cost position
126

20
11
05
23
_civ
ity_
Wh
ole
Ind
ustr
yC
ostB
en
ch
ma
rkin
g.p
ptx
©
civ
ity 2
01
0 /
//
5. Train operations (incl. Rolling stock)
5.1. Introduction
5.2. Total cost and structural characteristics
5.3. Train staff
5.4. Customer and operation management
5.5. Overhead
5.6. Track access charges and energy
5.7. Rolling stock
5.8. Conclusions
127

20
11
05
23
_civ
ity_
Wh
ole
Ind
ustr
yC
ostB
en
ch
ma
rkin
g.p
ptx
©
civ
ity 2
01
0 /
//
[GBP / train-km]
British train operating companies have lowest train staff costs in this sample
Train staff costs (2009, non normalised)
128
1.88
LSE
2.27
IC
1.78
Regio
2.95
GBR 19
2.04
A
2.27
n/a
C D
n/a
B
Train conductors
Train drivers
Other train staff
Train crew
Including train conductors

20
11
05
23
_civ
ity_
Wh
ole
Ind
ustr
yC
ostB
en
ch
ma
rkin
g.p
ptx
©
civ
ity 2
01
0 /
//
[GBP / train-km]
Train staff costs, normalised by travel speed (2009)
129
1.88
LSE
2.27
IC
1.78
Regio
2.95
GBR 191)
2.04
A2)
2.34
n/a
C D
n/a
B
Train conductors
Train drivers
Other train staff
Train crew
Train staff costs normalised by travel speed lead to higher costs in country B
1) Normalisation only related to GBR19
2) Non normalised as travel speed not available

20
11
05
23
_civ
ity_
Wh
ole
Ind
ustr
yC
ostB
en
ch
ma
rkin
g.p
ptx
©
civ
ity 2
01
0 /
//
[k GBP / fte]
Train staff costs (2009)
130
Compared to countries A and B British train staff costs are much lower
51
71
53
4546
4141
52
4448
39
48
56
45 45
57
302932
263029
TOC 6 TOC 2 TOC 3 TOC 1 TOC 5 TOC 4 TOC 7
n/a n/a
621)
n/a
TOC 10
n/a
TOC 11 TOC 12
n/a
TOC 13
n/a
A
521)
B TOC 8 TOC 9
Train conductors and other Train crew
Train drivers 1) Unlikely high values, possibly staff group allocation mistake in
source data
20
11
05
23
_civ
ity_
Wh
ole
Ind
ustr
yC
ostB
en
ch
ma
rkin
g.p
ptx
©
civ
ity 2
01
0 /
//
Train staff costs can be lower at private competitors
Train staff costs
• The comparison of train staff costs per full time employee is based on privately
operated British companies and two state-operated companies in countries A and B
• Experience from other countries proves that privately operated companies (for
example Connex, TransRegio and metronom versus DB AG in Germany) employ
their train drivers at substantially lower cost
• The difference in hourly wage rates between these companies and DB AG can be as
much as 50% of what private companies pay
• One of the reasons is that private companies often do not pay tariff salaries while DB
pays salaries based on official framework tariffs; furthermore they do not necessarly
take over staff from the previous franchise
• As DIW econ reports (Wochenbericht des DIW Berlin Nr. 43/2007) a DB train driver's
monthly gross salary is up to 2.750 Euros whereas his British collegue has a monthly
income of 2.960 Euros
• If GBR19 salaries were compared to private international operators annual staff costs
would porbably look higher and less favourable than what the analysis has shown
131

20
11
05
23
_civ
ity_
Wh
ole
Ind
ustr
yC
ostB
en
ch
ma
rkin
g.p
ptx
©
civ
ity 2
01
0 /
//
According to another study British TOC staff cost are at about the same level as TOCs abroad
Train staff costs
• A recent study on "People in the GB Rail Industry" analyses average salaries per
employee by type and company in Britain, Sweden, Germany and The Netherlands
• British TOCs' "All FTEs' costs" are at about the same level as companies in Germany
and Sweden; only Dutch staff is significantly more expensive
• This is true for management/administration staff as well as for non-
management/administration staff
132

20
11
05
23
_civ
ity_
Wh
ole
Ind
ustr
yC
ostB
en
ch
ma
rkin
g.p
ptx
©
civ
ity 2
01
0 /
//
5. Train operations (incl. Rolling stock)
5.1. Introduction
5.2. Total cost and structural characteristics
5.3. Train staff
5.4. Customer and operation management
5.5. Overhead
5.6. Track access charges and energy
5.7. Rolling stock
5.8. Conclusions
133

20
11
05
23
_civ
ity_
Wh
ole
Ind
ustr
yC
ostB
en
ch
ma
rkin
g.p
ptx
©
civ
ity 2
01
0 /
//
Customer management and operations management are two important support functions
Definitions
134
Operations
management
Customer management
• Planning of traffic supply and product development
• Marketing, sales (B2B, B2C)
• Customer information and support services
• Key account management
• Duty Rostering
• Train disposition/rolling stock planning
• Timetabling and staff disposition
• Exception handling
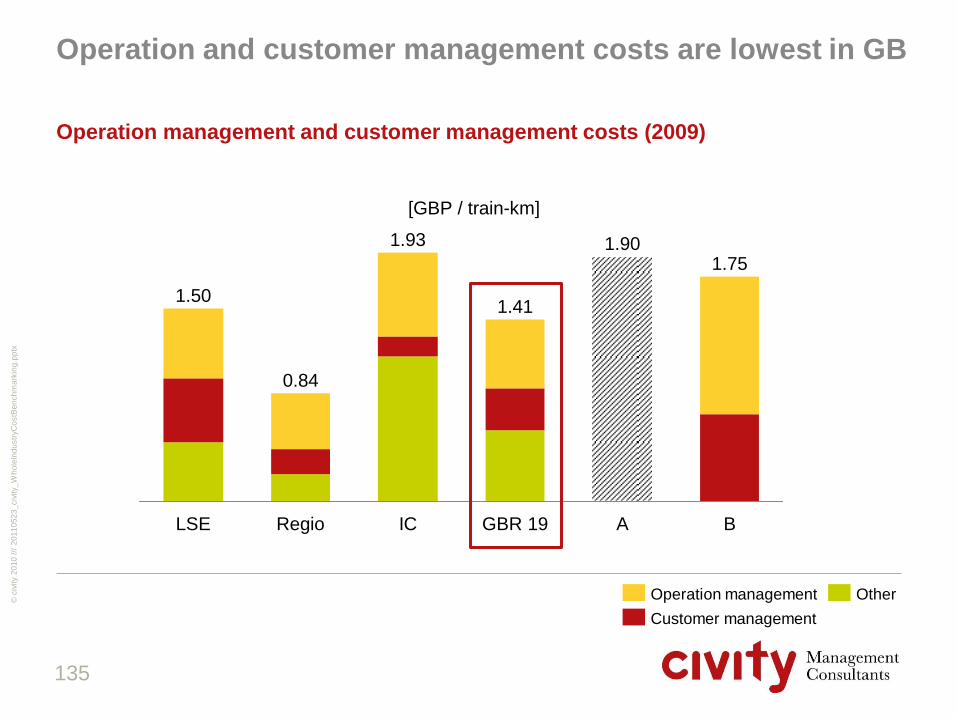
20
11
05
23
_civ
ity_
Wh
ole
Ind
ustr
yC
ostB
en
ch
ma
rkin
g.p
ptx
©
civ
ity 2
01
0 /
//
Operation and customer management costs are lowest in GB
Operation management and customer management costs (2009)
135
[GBP / train-km]
1.90
IC
1.41
LSE
1.93
B
0.84
GBR 19
1.50
A
1.75
Regio
Other
Customer management
Operation management

20
11
05
23
_civ
ity_
Wh
ole
Ind
ustr
yC
ostB
en
ch
ma
rkin
g.p
ptx
©
civ
ity 2
01
0 /
//
Compared to country B staff numbers per train-km are higher in GB
Operation management and customer management staff (2009)
136
[fte / m train-km]
LSE
23.07
Regio
20.96
B
27.87
IC
21.83
GBR 19
24.66
Customer management
Operation management
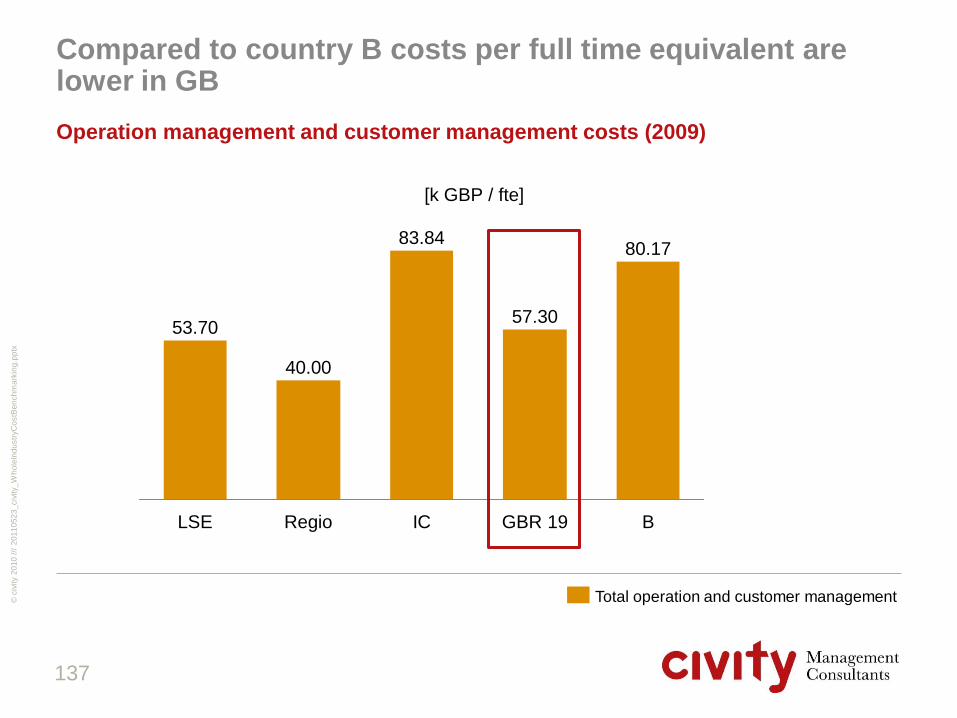
20
11
05
23
_civ
ity_
Wh
ole
Ind
ustr
yC
ostB
en
ch
ma
rkin
g.p
ptx
©
civ
ity 2
01
0 /
//
Compared to country B costs per full time equivalent are lower in GB
Operation management and customer management costs (2009)
137
[k GBP / fte]
40.00
LSE
53.70
B
80.17
Regio
57.30
GBR 19
83.84
IC
Total operation and customer management
20
11
05
23
_civ
ity_
Wh
ole
Ind
ustr
yC
ostB
en
ch
ma
rkin
g.p
ptx
©
civ
ity 2
01
0 /
//
5. Train operations (incl. Rolling stock)
5.1. Introduction
5.2. Total cost and structural characteristics
5.3. Train staff
5.4. Customer and operation management
5.5. Overhead
5.6. Track access charges and energy
5.7. Rolling stock
5.8. Conclusions
138

20
11
05
23
_civ
ity_
Wh
ole
Ind
ustr
yC
ostB
en
ch
ma
rkin
g.p
ptx
©
civ
ity 2
01
0 /
//
Overhead costs per train-kilometre seem to be very low in GB
Overhead costs (2009)
139
[GBP / train-km]
IC
1.46
LSE
0.66
Regio
0.94
GBR 19 A
0.97
0.45
B1)
0.62
Human Resources
Other
Information Technology
Finance and controlling
Purchasing
1) Other: travel information, safety

20
11
05
23
_civ
ity_
Wh
ole
Ind
ustr
yC
ostB
en
ch
ma
rkin
g.p
ptx
©
civ
ity 2
01
0 /
//
Other studies partially support this picture
Overhead costs
• The study on "People in the GB Rail Industry" comes to similar results for one of the
countries in our sample
• For Sweden productivity in train-km per management/administration employee is
slightly higher than in GB and Germany produces more than four times as many
train-km per employee than British TOCs
• The German figure includes six TOCs and will probably be lower if resources from
the holding are factored in and definitions of management staff are revised; despite
these uncertainties the study comes to the conclusion that these factors are unlikely
to fully explain this large difference
• This is also supported by the analysis on Germany included in this report which
shows comparatively lean overhead structures for tendered services
140

20
11
05
23
_civ
ity_
Wh
ole
Ind
ustr
yC
ostB
en
ch
ma
rkin
g.p
ptx
©
civ
ity 2
01
0 /
//
5. Train operations (incl. Rolling stock)
5.1. Introduction
5.2. Total cost and structural characteristics
5.3. Train staff
5.4. Customer and operation management
5.5. Overhead
5.6. Track access charges and energy
5.7. Rolling stock
5.8. Conclusions
141
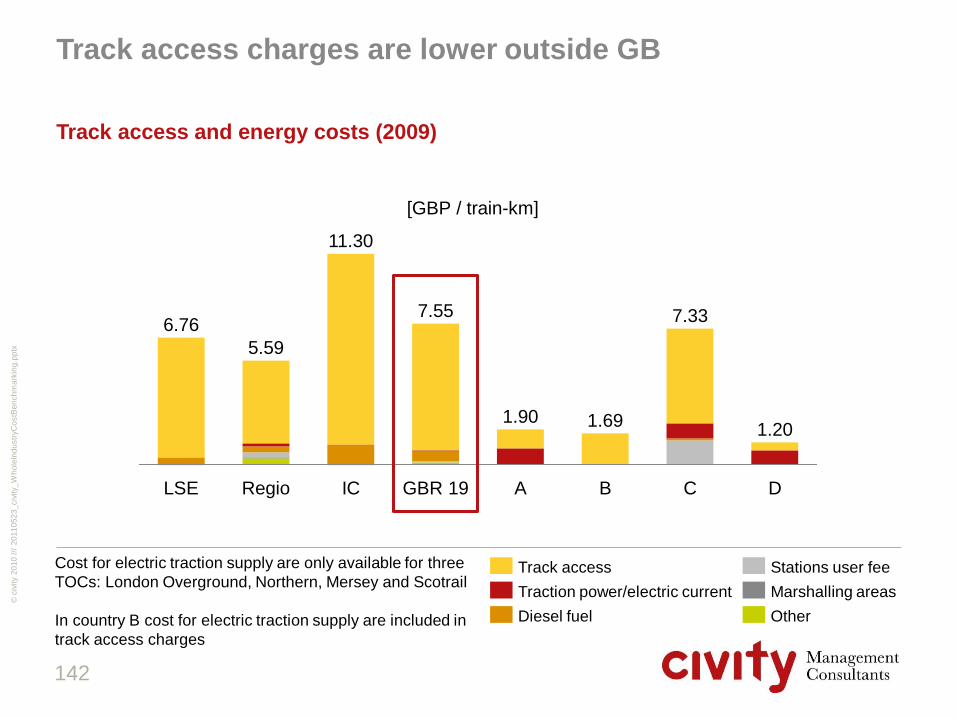
20
11
05
23
_civ
ity_
Wh
ole
Ind
ustr
yC
ostB
en
ch
ma
rkin
g.p
ptx
©
civ
ity 2
01
0 /
//
Track access charges are lower outside GB
Track access and energy costs (2009)
142
[GBP / train-km]
C B
1.69
A
1.20 1.90
D
7.33
GBR 19
7.55
IC
11.30
Regio
5.59
LSE
6.76
Other
Marshalling areas
Stations user fee
Diesel fuel
Traction power/electric current
Track access Cost for electric traction supply are only available for three
TOCs: London Overground, Northern, Mersey and Scotrail
In country B cost for electric traction supply are included in
track access charges

20
11
05
23
_civ
ity_
Wh
ole
Ind
ustr
yC
ostB
en
ch
ma
rkin
g.p
ptx
©
civ
ity 2
01
0 /
//
The charges for track access do not reflect the actual cost levels of infrastructure
Track access and energy costs
• The cost for track access per train-km is varying broadly between the five countries
with Network Rail charging the highest amount per train-kilometre
• Countries A, B and D have chosen to rather charge low track access charges which
does not imply that infrastructure costs are at a lower level
• As shown later in chapter 7 "Funding and Revenues" the countries charging low track
access charges opt for a higher share of direct funding to the train operating
company and vice versa
143

20
11
05
23
_civ
ity_
Wh
ole
Ind
ustr
yC
ostB
en
ch
ma
rkin
g.p
ptx
©
civ
ity 2
01
0 /
//
5. Train operations (incl. Rolling stock)
5.1. Introduction
5.2. Total cost and structural characteristics
5.3. Train staff
5.4. Customer and operation management
5.5. Overhead
5.6. Track access charges and energy
5.7. Rolling stock
5.8. Conclusions
144

20
11
05
23
_civ
ity_
Wh
ole
Ind
ustr
yC
ostB
en
ch
ma
rkin
g.p
ptx
©
civ
ity 2
01
0 /
//
5.29
2.93
C
4.58
B A GBR 192)
5.83
IC2)
8.09
Regio2)
5.44
LSE2)
4.85
Operational and capital costs for rolling stock are highest in GB
Rolling stock costs normalised by running performance and fleet
utilisation (2009)1)
145
[GBP / train-km]
1) For details on normalisation see chapter 9
2) A portion of rolling stock maintenance staff costs included in
train operation – operation management
3) Costs for rolling stock purchase and refurbishment
OPEX
Capital costs3)

20
11
05
23
_civ
ity_
Wh
ole
Ind
ustr
yC
ostB
en
ch
ma
rkin
g.p
ptx
©
civ
ity 2
01
0 /
//
ROSCOs (2008)
146
[m GBP]
384
324 300
260
367
268
A part of GB's high rolling stock costs could be explained by substantial profit margins generated by the ROSCOs
1) Year 2007 Expenditures Revenues
Other gains/losses
Investment income
Revenues
Operating lease rentals
Finance costs
Other gains/losses
Administrative expenses
Cost of sales Source: Income Statements
X Y Z

20
11
05
23
_civ
ity_
Wh
ole
Ind
ustr
yC
ostB
en
ch
ma
rkin
g.p
ptx
©
civ
ity 2
01
0 /
//
The competition commission stated a variety of reasons for a not well functioning rolling stock market
ROSCOs
• The Competition Commission has invested the market for leasing of rolling stock for
franchised passenger services and the supply of maintenance services
• Whilst the latter market segment seems to be functioning and the Commission did
not find any evidence for shortages of competition, the leasing market is not fully
competitive
• Some of the major reasons identified were
• Substitutability between different fleets is limited, particularly due to technical and
operational restrictions
• The overall lack of spare capacity which weakens the ROSCOs' incentives to
compete on lease rentals
• TOCs have limited ability to refuse to do business with the ROSCOs which reduces
their countervailing buying power
• As there is no market for used rolling stock new entry into the rollings stock market
is difficult
• The mismatch of length of the franchises and asset lifetimes does not encourage
TOCs to invest into own rolling stock
147

20
11
05
23
_civ
ity_
Wh
ole
Ind
ustr
yC
ostB
en
ch
ma
rkin
g.p
ptx
©
civ
ity 2
01
0 /
//
5. Train operations (incl. Rolling stock)
5.1. Introduction
5.2. Total cost and structural characteristics
5.3. Train staff
5.4. Customer and operation management
5.5. Overhead
5.6. Track access charges and energy
5.7. Rolling stock
5.8. Conclusions
148

20
11
05
23
_civ
ity_
Wh
ole
Ind
ustr
yC
ostB
en
ch
ma
rkin
g.p
ptx
©
civ
ity 2
01
0 /
//
Total cost for British train operating companies are relatively low, rolling stock cost are higher
Key findings
• Excluding track access charges GB's total train operation cost per train-kilometre are
almost the lowest in sample; however it needs to be considered that cost are compared
to state railway companies
• Different structural characteristics such as travel speed and annual running
performance require normalisation which has been applied where possible
• Train staff cost of GB's train operating companies are the lowest when normalised;
whilst staff size for train operation in total is similar to other countries cost per full time
employee are lower both for drivers and conductors
• Cost for operation and customer management are also lower in the GB, this is also true
for overhead
• Track access charges per train-kilometre are highest in GB; only one comparator is on
a similar level, the others charge significantly less
• GB's largest problem in competiveness results from rolling stock costs being 20-50%
higher than abroad; a brief analysis of three ROSCOs' annual economic performance
shows significant margins
149

20
11
05
23
_civ
ity_
Wh
ole
Ind
ustr
yC
ostB
en
ch
ma
rkin
g.p
ptx
©
civ
ity 2
01
0 /
//
Content page
1. Introduction 3
2. Market development and structures 12
3. Performance 61
4. Infrastructure 71
5. Train operations (incl. Rolling stock) 116
6. Freight train operations 150
7. Funding and revenues 152
8. Market analysis Germany 162
9. Methodology 185
10. Conclusions 195
150

20
11
05
23
_civ
ity_
Wh
ole
Ind
ustr
yC
ostB
en
ch
ma
rkin
g.p
ptx
©
civ
ity 2
01
0 /
//
FOCs (2008)
151
[GBP / train-km]
B
12.4 14.0
0.0
30.8
A
16.4
Freightliner
Heavy
Haul
26.9
31.3
Freightliner
Ltd.1)
30.8
35.3
DB
Schenker
(former
EWS)
34.9
Turnover
Costs
Track access charges
Freight train operations in GB appear to be high but data from other operators is hardly available
n/a
1) Year 2009
A B

20
11
05
23
_civ
ity_
Wh
ole
Ind
ustr
yC
ostB
en
ch
ma
rkin
g.p
ptx
©
civ
ity 2
01
0 /
//
Content page
1. Introduction 3
2. Market development and structures 12
3. Performance 61
4. Infrastructure 71
5. Train operations (incl. Rolling stock) 116
6. Freight train operations 150
7. Funding and revenues 152
8. Market analysis Germany 162
9. Methodology 185
10. Conclusions 195
152

20
11
05
23
_civ
ity_
Wh
ole
Ind
ustr
yC
ostB
en
ch
ma
rkin
g.p
ptx
©
civ
ity 2
01
0 /
//
Total income streams for the railway system originate from generic revenues and state provisions
153
State funding
Train operating companies
Infrastructure manager
Revenues
State funding
Revenues (fare box)
Funding for rolling stock
Total
income
streams
Overview
• Track access charges
• Traction power charges
• Stations user fees
• Provision of marshalling yards

20
11
05
23
_civ
ity_
Wh
ole
Ind
ustr
yC
ostB
en
ch
ma
rkin
g.p
ptx
©
civ
ity 2
01
0 /
//
Total income for infrastructure and train operations is highest per train kilometre in GB
Total income1) streams (2009)
154
D
13.4
C
15.4
B
16.4
A
18.2
GBR
23.6 [GBP / train-km]
Rolling stock funding
Train operations revenues
Train operations state funding
Infrastructure revenues
Infrastructure state funding 1) State and public funding (CAPEX excluded),
farebox revenues and ancillary business excl.
financial flows between TOCs and IMs
Infra-
structure
Train
operation

20
11
05
23
_civ
ity_
Wh
ole
Ind
ustr
yC
ostB
en
ch
ma
rkin
g.p
ptx
©
civ
ity 2
01
0 /
//
Total system funding per passenger kilometre is highest in GB
Total income1) streams (2009)
155
C
126.7
B
127.4
A
95.5
GBR D
230.3
115.6
[GBP / k passenger-km]
Rolling stock funding
Train operations revenues
Train operations state funding
Infrastructure revenues
Infrastructure state funding 1) State and public funding (CAPEX excluded),
farebox revenues and ancillary business excl.
financial flows between TOCs and IMs
Infra-
structure
Train
operation

20
11
05
23
_civ
ity_
Wh
ole
Ind
ustr
yC
ostB
en
ch
ma
rkin
g.p
ptx
©
civ
ity 2
01
0 /
//
In most countries infrastructure is dominantly financed through state funding
Share of total revenues incl. state and public funding (2009)
[%]
64
38
7989
67
D
23 21
A
47
NR
8
B
33
C
Other revenues
State funding Traction power
Track access charges
Fees for providing marshalling areas
INFRASTRUCTURE
156
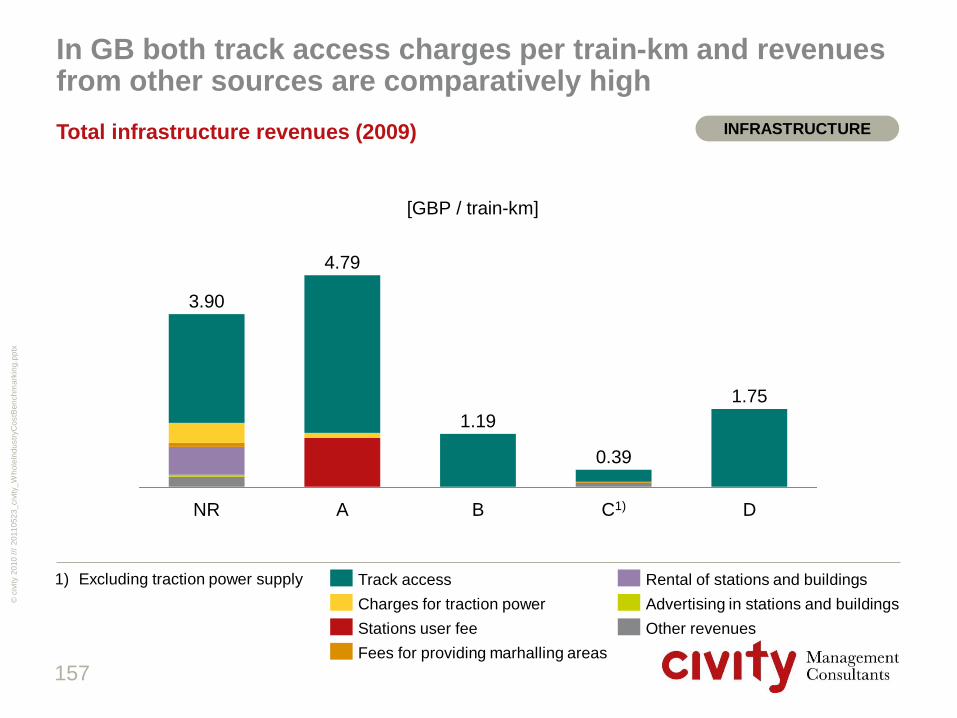
20
11
05
23
_civ
ity_
Wh
ole
Ind
ustr
yC
ostB
en
ch
ma
rkin
g.p
ptx
©
civ
ity 2
01
0 /
//
Total infrastructure revenues (2009)
157
[GBP / train-km]
B D A C1)
1.75
1.19
3.90
NR
0.39
4.79
In GB both track access charges per train-km and revenues from other sources are comparatively high
Charges for traction power
Stations user fee Other revenues
Track access
Fees for providing marhalling areas
Advertising in stations and buildings
Rental of stations and buildings 1) Excluding traction power supply
INFRASTRUCTURE
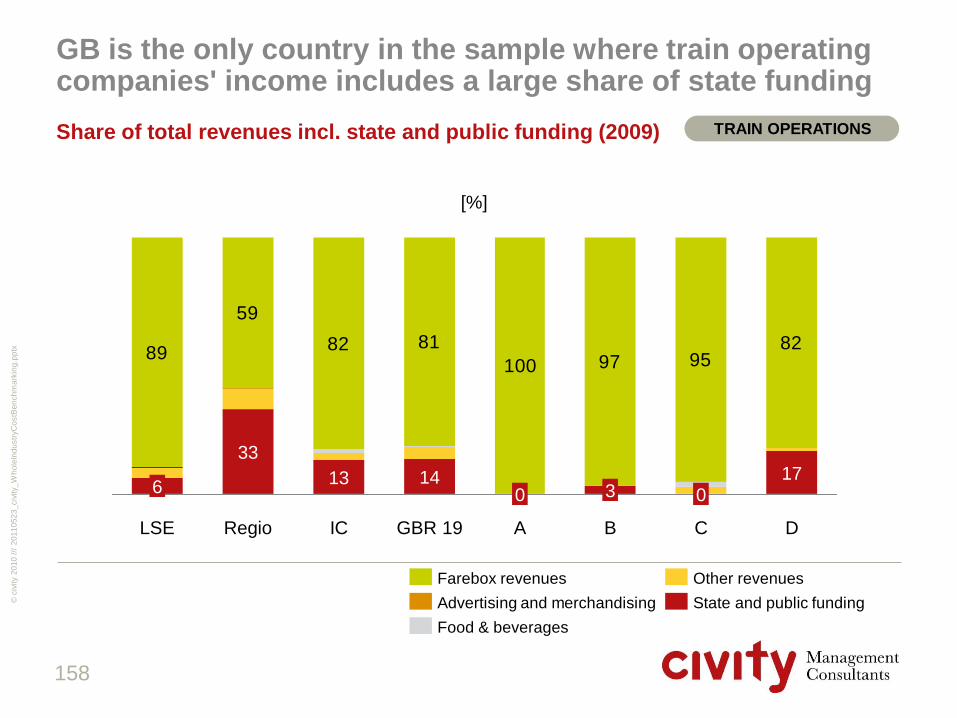
20
11
05
23
_civ
ity_
Wh
ole
Ind
ustr
yC
ostB
en
ch
ma
rkin
g.p
ptx
©
civ
ity 2
01
0 /
//
Share of total revenues incl. state and public funding (2009)
158
[%]
89
59
82 81
100 97 9582
B
3
A
0
GBR 19
14
IC
13
Regio
33
LSE
6
D
17
C
0
State and public funding Advertising and merchandising
Food & beverages
Other revenues Farebox revenues
GB is the only country in the sample where train operating companies' income includes a large share of state funding
TRAIN OPERATIONS

20
11
05
23
_civ
ity_
Wh
ole
Ind
ustr
yC
ostB
en
ch
ma
rkin
g.p
ptx
©
civ
ity 2
01
0 /
//
Regular passenger revenues per train kilometre are highest in the UK
Regular passenger revenues (2009)
159
D
8.18
C
12.23
B
11.68
A
13.13
GBR 19
13.58
IC
18.09
Regio
6.93
LSE
15.37
Farebox revenues
Food & beverages
Other revenues1)
[GBP / train-km]
TRAIN OPERATIONS
1) Other revenues in GB include revenue commissions
which are payed by other TOCs for selling their
tickets

20
11
05
23
_civ
ity_
Wh
ole
Ind
ustr
yC
ostB
en
ch
ma
rkin
g.p
ptx
©
civ
ity 2
01
0 /
//
The fare levels per passenger-kilometre stand out in GB
Regular passenger revenues (2009)
160
[GBP / k passenger-km]
D
67.13
C
87.56
B
85.50
A
67.14
GBR 19
127.03
IC
131.53
Regio
111.53
LSE
129.38
Farebox revenues
Food & beverages
Other revenues1)
TRAIN OPERATIONS
1) Other revenues in GB include revenue commissions
which are payed by other TOCs for selling their
tickets

20
11
05
23
_civ
ity_
Wh
ole
Ind
ustr
yC
ostB
en
ch
ma
rkin
g.p
ptx
©
civ
ity 2
01
0 /
//
GB's railway system receives higher income streams per passenger and train kilometre than other comparators
Conclusions
• In GB funding and revenue per train-kilometre including infrastructure, train operations
and rolling stock is highest in sample
• Due to GB's comparatively lower utilisation of trains the funding level per passenger-
kilometre is even much higher compared to other countries
• Regarding infrastructure most countries including GB finance the majority of their
expenditures through state and public funding; one country generates an exceptionally
high share of track access charges
• GB also generates higher infrastructure revenues per train-kilometre than other
countries; they are mainly driven by rental of stations and buildings
• In contrast to other countries GB finances train operators more extensively through
state and public funding
• This practice corresponds to the fact that operators pay higher track access charges
per train-kilometre than elsewhere
• Regular passenger revenues per train-kilometre (fare box) are higher than in other
countries; lower train utilisation leads to more significant disadvantages when relating
these revenues to passenger-kilometres
161

20
11
05
23
_civ
ity_
Wh
ole
Ind
ustr
yC
ostB
en
ch
ma
rkin
g.p
ptx
©
civ
ity 2
01
0 /
//
Content page
1. Introduction 3
2. Market development and structures 12
3. Performance 61
4. Infrastructure 71
5. Train operations (incl. Rolling stock) 116
6. Freight train operations 150
7. Funding and revenues 152
8. Market analysis Germany 162
9. Methodology 185
10. Conclusions 195
162

20
11
05
23
_civ
ity_
Wh
ole
Ind
ustr
yC
ostB
en
ch
ma
rkin
g.p
ptx
©
civ
ity 2
01
0 /
//
8. Market analysis Germany
8.1. Market structure, supply and demand
8.2. Development of costs
8.3. Development of quality
8.4. Case studies
8.5. Conclusions
163
Exchange rate applied in this chapter: ECB 3rd of December 1 EUR= 0.848 GBP
http://www.ecb.int/stats/exchange/eurofxref/html/eurofxref-graph-gbp.en.html

20
11
05
23
_civ
ity_
Wh
ole
Ind
ustr
yC
ostB
en
ch
ma
rkin
g.p
ptx
©
civ
ity 2
01
0 /
//
The German regional rail services market is still charac-terised by a co-existence of direct awarding and tendering
Market characteristics regional services Germany1)
• From the view of the operators the passenger rail services market in Germany is
characterised by a parallelism of
– non-subsidized long-distance services, with, despite free market access, still a 99%
market share at national rail operator Deutsche Bahn AG - DB) and
– regional and short-distance subsidized services (so called regional services), with
co-existence of direct awarding and competitive tendering
– Until the end of 2009, approximately 32% of the annual volume of 630 million train
kilometres p.a. (m tkm) was put out to public tender
• Subsidies were thereby reduced by an average of 26% per train kilometre (tkm),
enabling authorities a.o. to increase train kilometres offered to passengers by 31%
since the market-reform in the mid-1990s
• DBs‘ market share decreased to 80%, but their volume in train kilometres increased
164
1) Source: Beck, A. (2010), DB (2010), KCW (2009, p. 34) and own research.

20
11
05
23
_civ
ity_
Wh
ole
Ind
ustr
yC
ostB
en
ch
ma
rkin
g.p
ptx
©
civ
ity 2
01
0 /
//
165
2002 2003 2004 2005 2006 2007 2008
7.0
7.2
7.4
0.0
7.6
7.8
Share in % 7.8
7.5 7.5
7.4
6.9 6.9
6.8
1 Source: Allianz pro Schiene (2009, p. 13). In 2009 a slight decrease occurred due to
financial crisis (see DB (2010, p. 19)
2 Discussed e.g. by BAG SPNV (2010, p. 27) and Lalive and Schmutzler (2008)
3 More details on the development of quality well be described in the next subchapter)
• Rail services (long-distance and regional
services) increased their market share
• Reasons discussed2)
– Increased level of regional services, e.g.
frequency, quality … (main reason)
– New high-speed lines
– Gasoline price increases
• Allianz pro Schiene (2010) confirms in a study
of 15 cases increases in passenger figures of
48% to 3790% due to increased service levels
• Note: a significant share of enhancement of
supply was re-funded by reduced subsidies
due to tendering
Explanation
Until the financial crisis in 2009 rail services increased their market share, a.o. due to a higher quality of regional services
Market share of rail in passenger transport sector
Rail market share based on passenger km p.a.1)
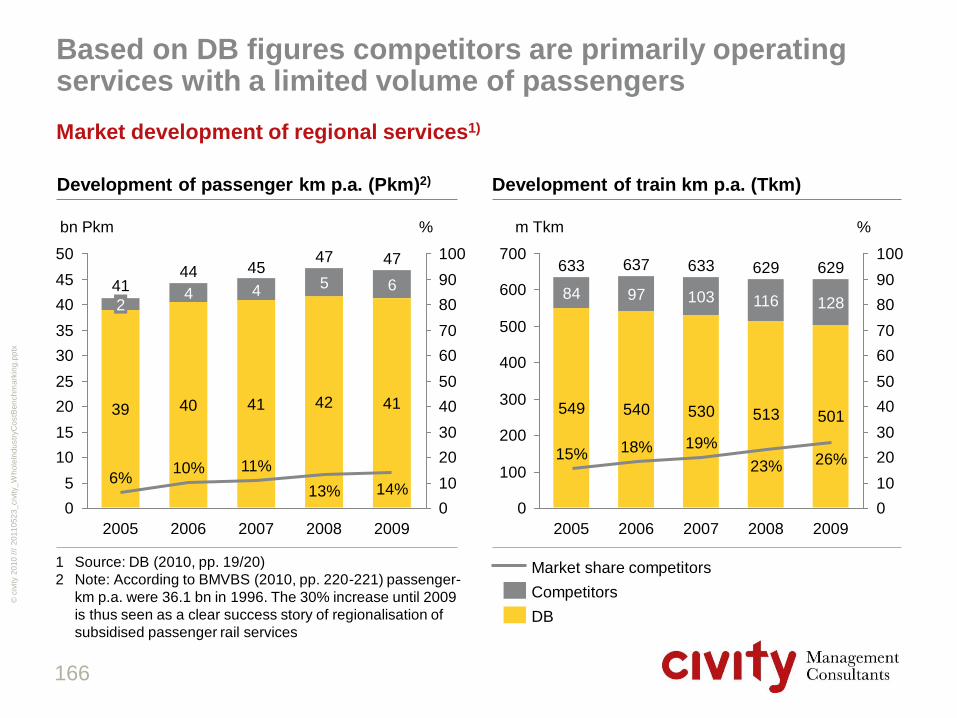
20
11
05
23
_civ
ity_
Wh
ole
Ind
ustr
yC
ostB
en
ch
ma
rkin
g.p
ptx
©
civ
ity 2
01
0 /
//
Based on DB figures competitors are primarily operating services with a limited volume of passengers
Market development of regional services1)
166
Development of train km p.a. (Tkm) Development of passenger km p.a. (Pkm)2)
1 Source: DB (2010, pp. 19/20)
2 Note: According to BMVBS (2010, pp. 220-221) passenger-
km p.a. were 36.1 bn in 1996. The 30% increase until 2009
is thus seen as a clear success story of regionalisation of
subsidised passenger rail services
549 540 530 513 501
0
100
200
300
400
500
600
700
0
10
20
30
40
50
60
70
80
90
100
% m Tkm
2009
629
128
26%
2008
629
116
23%
2007
633
103
19%
2006
637
97
18%
2005
633
84
15%
39 40 41 42 41
0
5
10
15
20
25
30
35
40
45
50
0
10
20
30
40
50
60
70
80
90
100
% bn Pkm
2009
47
6
14%
2008
47
5
13%
2007
45
4
11%
2006
44
4
10%
2005
41
2
6%
DB
Competitors
Market share competitors

20
11
05
23
_civ
ity_
Wh
ole
Ind
ustr
yC
ostB
en
ch
ma
rkin
g.p
ptx
©
civ
ity 2
01
0 /
//
Despite a 14 year history of tendering a strong impact of national, state owned and municipal operators still remains
Distribution of market shares in 20091)
167
Market share of DB and competitors Distribution of competitors
Local incumbents
2.7%
(17 m Tkm)
DB 79.9%
(503 Tkm) Competitors
17.4%
(110 m Tkm)
1) Source: KCW (2009, pp. 28/29), based on ~630 m tkm. Expected market share of competitors in 2011: 22.3%
Note: Market share of DB includes contracts directly awarded and contracts won in tender. Local incumbents are
operators where awarding is due to historical relationship (no tendering to be expected)
0.1% Other
Rhenus
0.4%
Ruhrtalbahn
0.9%
AKN
1.2%
SBB
1.9%
Transdev
2.6% SWEG/HzL
3.3%
EIB 3.8%
NedRailways 4.6%
HLB 6.2%
Keolis 6.7%
AVG
6.7%
BeNex
7.0%
Other municipal TOCs
8.1% Arriva
19.6%
Veolia
26.8%

20
11
05
23
_civ
ity_
Wh
ole
Ind
ustr
yC
ostB
en
ch
ma
rkin
g.p
ptx
©
civ
ity 2
01
0 /
//
8. Market analysis Germany
8.1. Market structure, supply and demand
8.2. Development of costs
8.3. Development of quality
8.4. Case studies
8.5. Conclusions
168
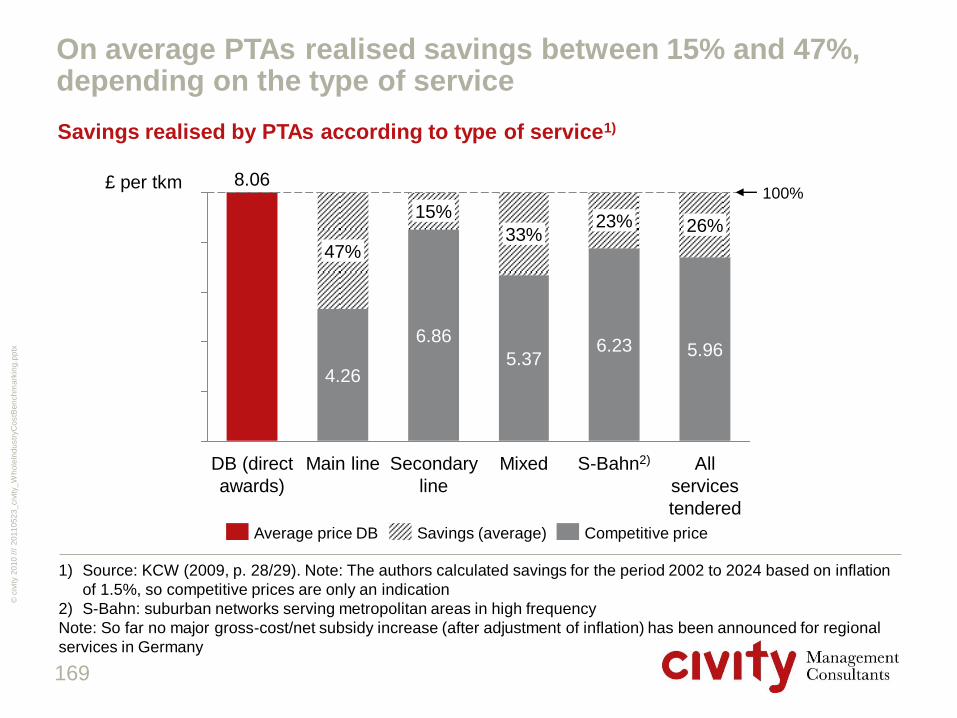
20
11
05
23
_civ
ity_
Wh
ole
Ind
ustr
yC
ostB
en
ch
ma
rkin
g.p
ptx
©
civ
ity 2
01
0 /
//
169
On average PTAs realised savings between 15% and 47%, depending on the type of service
Savings realised by PTAs according to type of service1)
£ per tkm
100%
All
services
tendered
5.96
26%
S-Bahn2)
6.23
23%
Mixed
5.37
33%
Secondary
line
6.86
15%
Main line
4.26
47%
DB (direct
awards)
8.06
Competitive price Savings (average) Average price DB
1) Source: KCW (2009, p. 28/29). Note: The authors calculated savings for the period 2002 to 2024 based on inflation
of 1.5%, so competitive prices are only an indication
2) S-Bahn: suburban networks serving metropolitan areas in high frequency
Note: So far no major gross-cost/net subsidy increase (after adjustment of inflation) has been announced for regional
services in Germany
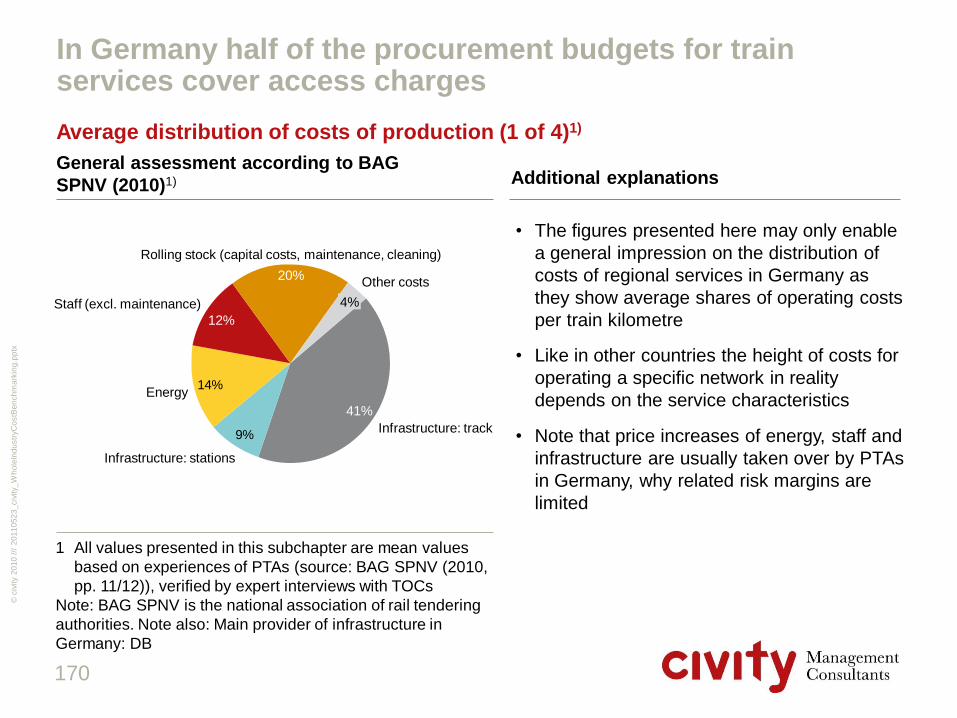
20
11
05
23
_civ
ity_
Wh
ole
Ind
ustr
yC
ostB
en
ch
ma
rkin
g.p
ptx
©
civ
ity 2
01
0 /
//
Average distribution of costs of production (1 of 4)1)
• The figures presented here may only enable
a general impression on the distribution of
costs of regional services in Germany as
they show average shares of operating costs
per train kilometre
• Like in other countries the height of costs for
operating a specific network in reality
depends on the service characteristics
• Note that price increases of energy, staff and
infrastructure are usually taken over by PTAs
in Germany, why related risk margins are
limited
Additional explanations
170
General assessment according to BAG
SPNV (2010)1)
1 All values presented in this subchapter are mean values
based on experiences of PTAs (source: BAG SPNV (2010,
pp. 11/12)), verified by expert interviews with TOCs
Note: BAG SPNV is the national association of rail tendering
authorities. Note also: Main provider of infrastructure in
Germany: DB
14%
9%
4%
Other costs 20%
Rolling stock (capital costs, maintenance, cleaning)
12%
Staff (excl. maintenance)
Energy
Infrastructure: stations
41%
Infrastructure: track
In Germany half of the procurement budgets for train services cover access charges

20
11
05
23
_civ
ity_
Wh
ole
Ind
ustr
yC
ostB
en
ch
ma
rkin
g.p
ptx
©
civ
ity 2
01
0 /
//
There is a strong variation in costs per function
171
Spread of operating costs in £ per tkm
0.42
Infr
astr
uctu
re: sta
tions
1.53
Oth
er
costs
0.42
0.17
Sta
ff
0.22 0.42
Energ
y
1.78
there
of:
main
tenance c
osts
0.76
Infr
astu
ctu
re: tr
ack
3.56
3.05
1.70
0.42
there
of:
capital costs
2)
2.12
0.00
Rolli
ng s
tock
2.97
1.27
Maximum
Minimum
1 Source: BAG SPNV (2010, pp. 11-19) and
assessments by experts (operators) interviewed.
Note: Costs for Infrastructure and Energy are solely
based on assessments by experts
2 On some lines operators are allowed to use
depreciated vehicles
• Track access charges and user fees for
stations show high variation depending on
the classification of track (e.g. electrified
main line vs. non-electrified secondary line)
and stations (e.g. central station vs. flag
stop)
• Note: DBs price system for stations will have
to be changed due to a notification of the
German network authority as of December
10, 2009 who claimed this system to be
discriminatory
• Price increase expected by BAG SPNV for
upcoming years: 2% to 3% p.a.
Note on infrastructure costs
Average distribution of costs of production (2 of 4)1)
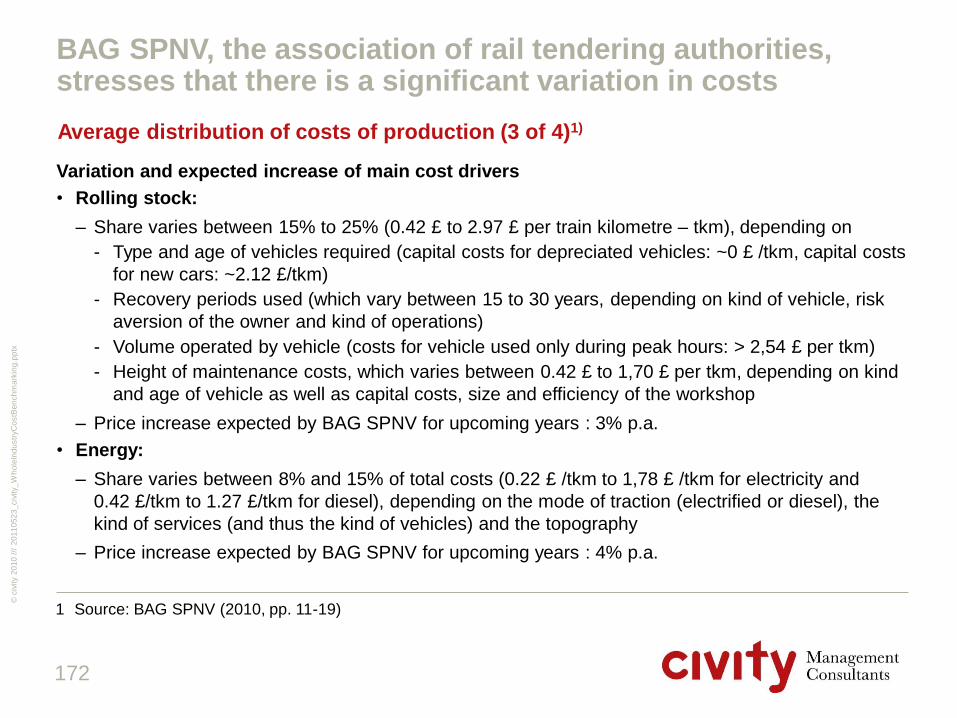
20
11
05
23
_civ
ity_
Wh
ole
Ind
ustr
yC
ostB
en
ch
ma
rkin
g.p
ptx
©
civ
ity 2
01
0 /
//
172
Variation and expected increase of main cost drivers
• Rolling stock:
– Share varies between 15% to 25% (0.42 £ to 2.97 £ per train kilometre – tkm), depending on
- Type and age of vehicles required (capital costs for depreciated vehicles: ~0 £ /tkm, capital costs
for new cars: ~2.12 £/tkm)
- Recovery periods used (which vary between 15 to 30 years, depending on kind of vehicle, risk
aversion of the owner and kind of operations)
- Volume operated by vehicle (costs for vehicle used only during peak hours: > 2,54 £ per tkm)
- Height of maintenance costs, which varies between 0.42 £ to 1,70 £ per tkm, depending on kind
and age of vehicle as well as capital costs, size and efficiency of the workshop
– Price increase expected by BAG SPNV for upcoming years : 3% p.a.
• Energy:
– Share varies between 8% and 15% of total costs (0.22 £ /tkm to 1,78 £ /tkm for electricity and
0.42 £/tkm to 1.27 £/tkm for diesel), depending on the mode of traction (electrified or diesel), the
kind of services (and thus the kind of vehicles) and the topography
– Price increase expected by BAG SPNV for upcoming years : 4% p.a.
Average distribution of costs of production (3 of 4)1)
1 Source: BAG SPNV (2010, pp. 11-19)
BAG SPNV, the association of rail tendering authorities, stresses that there is a significant variation in costs

20
11
05
23
_civ
ity_
Wh
ole
Ind
ustr
yC
ostB
en
ch
ma
rkin
g.p
ptx
©
civ
ity 2
01
0 /
//
Its market power provides DB with several advantages for its own business, what also influences cost variations
• Sales provision for ticket distribution differs
– Provision paid by DB to competitors: 5-8% of fare sales
– Provision to be paid by competitors to DB: 10-18% of fare sales (rationale: DB operates the clearing-house)
• Purchasing power of DB, e.g. double stack wagon
– DB price at Bombardier: ~1.02 m £ per vehicle
– Price for competitors: ~1.19 m £ per vehicle
• Funding conditions: Public operators like DB (and other public TOCs) benefit from low capital costs
Note: even return on sales in 2008 shows a difference
• DB Regio AG: 11.2% (plus overhead costs of a ~8.1% share of turnover)
• Competitors: < 5.0%
Variation of further costs & revenues1) Cost advantages of incumbent operator2)
173
• Staff costs presented by BAG SPNV are only costs for ticket collectors and for engine-drivers
– Costs vary between 0.42 £ and 1.27 £ per tkm, primarily depending on the proportion of train guards required (minimum proportion with respect to fare dodgers discussed in Germany: 10%)
– Price increase expected by BAG SPNV for upcoming years : 2.5% p.a.,
• Other costs – Are primarily costs for sales and distribution
- Share is usually below 5% and varies between 0.17 £ 0.42 £ per tkm, depending on the kind of service, number of vending machines permitted and the fare system applied
- Price increase expected by BAG SPNV for upcoming years : 2% p.a.
– Furthermore other costs also entail administration costs (overhead), insurances, profit, … .
• Fare revenue varies (usually 1.27 £/tkm to 2.54 £/tkm)
1) Source: BAG-SPNV (2010, pp. 19-21)
2) Source: KCW (2009, pp. 44/45, 59 and 62)
Note: A recent agreement between BAG SPNV and DB is that for using DBs generic product
categories (e.g. „S-Bahn“) PTAs will pay 0.004 € per tkm (Source: RoterRenner 2010-107)
Average distribution of costs of production (4 of 4)
Variation of costs is not only depending on the type of service, but also on the market power of the incumbent

20
11
05
23
_civ
ity_
Wh
ole
Ind
ustr
yC
ostB
en
ch
ma
rkin
g.p
ptx
©
civ
ity 2
01
0 /
//
174
Net subsidy payment in £ per train kilometre (in 2010 prices)1)
The results of tendering procedures also show a high variation, why general statements on prices are difficult
Variation of net subsidies per tender
Löhne-Hildesheim (secondary line, diesel) 0.86
S-Bahn Bremen 3.81
Main line (diesel) 3.99 3.80 0.19
Main line (electrified) 4.40 3.82 0.58
Secondary line (diesel) 5.14 3.95 1.19
S-Bahn Stuttgart 5.21
Secondary line (diesel) 6.19 4.15 2.04
Mosel RB (secondary line, electrified) 6.88 4.16 2.72
S-Bahn Rhein-Neckar 7.29
Altmark-Börde-Anhalt (secondary line, diesel 7.80
Sachsen-Anhalt-Süd (secondary line, diesel)
Ø 5.90
Passau-Munich (Main line, electrified) 0.64
8.06
Secondary line (diesel) 8.69 4.05 4.64
Secondary line (diesel) 8.95 4.05 4.90
Secondary line (diesel) 10.63 4.62 6.01
Net subsidy: share of other costs covered by subsidy
Only net subsidy figure available
Net subsidy: infrastructure share
1 Including indicative figures. Price adjustment applied: 1.5% p.a.
Source of data: Geyer (2008), own research, KCW (2009, p.46) and Beck and Kühl (2007, p. 782)
Average cost coverage in Germany1)
• Full costs covered: ~36%
• Operating costs excluding
infrastructure covered by fare
revenues: ~70%
• Cost coverage varies between 20%
(secondary lines in rural areas) and
~full cost coverage

20
11
05
23
_civ
ity_
Wh
ole
Ind
ustr
yC
ostB
en
ch
ma
rkin
g.p
ptx
©
civ
ity 2
01
0 /
//
Germany's tendering partially led to significantly lower prices
Total train operation costs (2009, excluding track access, non normalised)
175
[GBP / train-km]
D1)
9.55
C1)
10.89
B
11.31
A
14.08
GBR 192)
10.69
IC2)
13.86
Regio2)
9.77
LSE2)
9.56
Rolling stock
Energy and user fees
Overhead
Operation and customer management
Train staff 1) Cost distribution of shaded block not known
2) Operation management costs here contains a
portion of rolling stock maintenance staff costs
Germany D in Euro
5.24
[GBP / train-km] for
Germany: Prices out of
tendering procedures,
based on assessments
by experts

20
11
05
23
_civ
ity_
Wh
ole
Ind
ustr
yC
ostB
en
ch
ma
rkin
g.p
ptx
©
civ
ity 2
01
0 /
//
The specific framework conditions need to be considered when comparing German train operation costs
Remarks on Germany's cost position
• In Germany mainly secondary lines have been tendered so far; they require
comparatively lower standards in terms of rolling stock and cause lower infrastructure
costs
• Lower rolling stock cost are also due to fleet that has already been written off
• The 5.24 GBP per train-kilometre is an assessment of average cost; the bandwidth for
regional trains and secondary lines ranges between 17 and 6 GBP (including track
access charges)
• Costs are not normalised considering travel speeds, stops and annual running
performance
176

20
11
05
23
_civ
ity_
Wh
ole
Ind
ustr
yC
ostB
en
ch
ma
rkin
g.p
ptx
©
civ
ity 2
01
0 /
//
8. Market analysis Germany
8.1. Market structure, supply and demand
8.2. Development of costs
8.3. Development of quality
8.4. Case studies
8.5. Conclusions
177

20
11
05
23
_civ
ity_
Wh
ole
Ind
ustr
yC
ostB
en
ch
ma
rkin
g.p
ptx
©
civ
ity 2
01
0 /
//
Tendering hasn„t improved infrastructure quality directly, but it raised quality levels of vehicles and services
Effects of tendering on quality
• Tendering conditions usually foresee new
vehicles and, compared to the incumbent
DB, improved levels of service quality
(punctuality, quote of train guards, air
conditioning, cars accessible for disabled …)
• Since market reform supply, measured in
train kilometres p.a., has increased by
~31%. A major part has been refunded by
efficiency gains from introducing competitive
tendering
• Furthermore, several operators introduced
further quality improvements on their own,
especially in case of net-cost contracts
• Such quality improvements will be described
in more detail in a case study analysis in the
next subchapter
Tracks & stations: No direct influence Vehicles and services: direct influence
178
• No direct influence since infrastructure is
primarily operated by incumbent DB (usually
no tender on operating infrastructure) and
service operators are only able to contract DB
• Several reports claim that (re-) investment and
maintenance activities of DB diminished in
recent years due to increased goals on profit1)
• Although providing infrastructure is a main task
of DB (and the federal level), several regional
PTAs have co-funded investments to
improve quality of infrastructure in recent
years2)
• Some states have even reopened stations
and lines already closed before market reform
(for example Schleswig-Holstein: 23 stations
new or reopened and two lines reopened)
1 Source: BAG-SPNV (2009 and 2006) and Netzwerk Privatbahnen (2006)
2 Source: SCI Verkehr (2006)

20
11
05
23
_civ
ity_
Wh
ole
Ind
ustr
yC
ostB
en
ch
ma
rkin
g.p
ptx
©
civ
ity 2
01
0 /
//
In Berlin-Brandenburg customer satisfaction is higher on net-works tendered out to private operators than on those of DB
An example for customer marks: survey-results from Berlin-Brandenburg
179
2.1
2.0
1.9
1.8
1.7
1.6
1.5
0.0
2009
1.91
1.58 1.54
1.50
1.68
1.48
1.58
2.10
2008
1.89
1.57
1.63
1.44
1.72
1.56
2.07
OLA-MR (Veolia)
Average
NE 26 (Veolia)
NE 27 (Veolia)
PEG (Arriva)
ODEG III (Arriva & BeNex)
ODEG I+II (Arriva & BeNex)
DB Regio (DB)
Customer satisfaction measured by marks
1 Source: VBB (2009, p. 24)
Legend: Network (and affiliated operators)
• Note: DB, the incumbent
operator, still operates 80%
of all 36 m Tkm (main and
secondary-lines) in Berlin-
Brandenburg region
(including a small line
section that has been
tendered out)
• School grades used in
survey:
– Very good = 1 to
– Defective = 6
Explanations

20
11
05
23
_civ
ity_
Wh
ole
Ind
ustr
yC
ostB
en
ch
ma
rkin
g.p
ptx
©
civ
ity 2
01
0 /
//
Services tendered out to private operators in Berlin-Brandenburg show higher quality levels than those of DB
An example for quality of vehicles: evaluation results from Berlin-Brandenburg
180
100.0
99.5
99.0
98.5
98.0
97.5
0.0
2009
98.53%
99.10%
97.89%
98.60%
99.70%
99.99%
99.78%
97.63%
2008
98.45% 98.41%
98.96%
99.15%
99.60% 99.56%
97.37%
Average
OLA-MR (Veolia)
NE 26 (Veolia)
NE 27 (Veolia)
PEG (Arriva)
ODEG III (Arriva & BeNex)
ODEG I+II (Arriva & BeNex, )
DB Regio (DB)
Share of damage-free vehicles Share of clean vehicles
1 Source: VBB (2009, p. 23)
Legend: Network (and affiliated comanies)
99
98
94
95
93
96
97
92
91
0
2009
94.82%
98.16%
96.04%
97.11%
97.81% 96.74%
97.21%
91.82%
2008
95.49%
98.18%
97.18%
98.65%
98.19%
97.26%
90.56%

20
11
05
23
_civ
ity_
Wh
ole
Ind
ustr
yC
ostB
en
ch
ma
rkin
g.p
ptx
©
civ
ity 2
01
0 /
//
8. Market analysis Germany
8.1. Market structure, supply and demand
8.2. Development of costs
8.3. Development of quality
8.4. Case studies
8.5. Conclusions
181

20
11
05
23
_civ
ity_
Wh
ole
Ind
ustr
yC
ostB
en
ch
ma
rkin
g.p
ptx
©
civ
ity 2
01
0 /
//
The case studies will present a detailed description of the Marschbahn and the Odenwaldbahn tender
Case studies – outline of main results1)
“Odenwaldbahn” tender (Frankfurt/Darmstadt – Odenwald-area)
• Secondary line operations (route length: 210 km, 1.84 m tkm, start of operation: December 2005)
• Rolling stock pool owned by tendering authority and gross cost contract
• Strong quality increases, esp. new rolling stock
– Allows for reduction of trip length up to 20 min.
– Low floor and suitable for the disabled
– Air-conditioning and noise-reduction
• Increase of demand by approx. 20% despite initial difficulties with infrastructure and teething troubles
• Effects of tender: Stabilization of price
• The operator Vias has reported a profit : 922 k £ in 2006, 53 k £ in 2007 and 350 k £ in 2008
Schleswig-Holstein: Marschbahn Hesse: Odenwaldbahn
182
„Marschbahn“ tender (Hamburg – Westerland-Sylt)
• Main line operations (route length: 273 km, volume: 4.2 m tkm, start of operation: December 2005)
• Guarantee for reuse of rolling stock & net cost contract
• Strong quality increases e.g.
– New rolling stock equipment (among others low floor access and suitable for the disabled)
– Air-conditioning and audio system
• But: initial difficulties with teething troubles
• Net Savings realised by tendering authority through tender (despite strong quality increases)
– Approx. 11.9 m GBP per year
– Approx. 119 m GBP over the 10-year contract
• Net subsidies down by 42% to 3.71 £ per tkm, but Veolia experienced a winner’s curse due to over-estimated passenger figures (-73,4 m £ in 2006)
1 Source of case studies: Beck and Kühl (2007), Beck, Kühl and Ladewig (2007), KCW (2007), Veolia Environment
(2007), VGF (2008), (2007) and (2006) and own research. Note: Figures are based on 2005

20
11
05
23
_civ
ity_
Wh
ole
Ind
ustr
yC
ostB
en
ch
ma
rkin
g.p
ptx
©
civ
ity 2
01
0 /
//
8. Market analysis Germany
8.1. Market structure, supply and demand
8.2. Development of costs
8.3. Development of quality
8.4. Case studies
8.5. Conclusions
183
20
11
05
23
_civ
ity_
Wh
ole
Ind
ustr
yC
ostB
en
ch
ma
rkin
g.p
ptx
©
civ
ity 2
01
0 /
//
Despite a significant decrease in net subsidies introducing tendering in Germany has improved quality
Main results of competitive tendering in Germany
• German regional passenger rail services experienced numerous cases where competitive tendering
was introduced by PTAs since market reform in the mid-1990s
• Subsidies were thereby reduced by an average of 26% per train kilometre, enabling authorities a.o. to increase train kilometres p.a. offered to passengers by 31% since market-reform in the mid-1990s
• Despite a strong increase in efficiency tendering conditions usually require a significant quality improvement (e.g. new vehicles, increased requirements on punctuality, higher service levels), what has supported an increase in passenger kilometres p.a. by around 14% since the mid-1990s
• DBs„ market share in train kilometres p.a. decreased to 80%, but their volume in real terms increased
• Main competitors of DB are Veolia and Arriva
• Usually half of the share of costs is determined by access charges for tracks and stations, while rolling stock shows a ~20% share, energy a ~14% share and staff a ~12% share
• Case studies analysed show a strong variation of net payments by state authorities to operators, with an average net subsidy level of 5.90 £ per train kilometre, and a spread of 0.64 £ to 10.63 £ per train kilometre
184
1) Source: Beck, A. (2010), DB (2010), KCW (2009, p. 34) and own research

20
11
05
23
_civ
ity_
Wh
ole
Ind
ustr
yC
ostB
en
ch
ma
rkin
g.p
ptx
©
civ
ity 2
01
0 /
//
Content page
1. Introduction 3
2. Market development and structures 12
3. Performance 61
4. Infrastructure 71
5. Train operations (incl. Rolling stock) 116
6. Freight train operations 150
7. Funding and revenues 152
8. Market analysis Germany 162
9. Methodology 185
10. Conclusions 195
185

20
11
05
23
_civ
ity_
Wh
ole
Ind
ustr
yC
ostB
en
ch
ma
rkin
g.p
ptx
©
civ
ity 2
01
0 /
//
To compare costs a well proven normalisation process includ-ing an aggregation to cover whole industry costs will be applied
PPP
Normalisation
topics
Raw data
collected via
questionnaire
and cleaned
e.g. from
extraordinary
effects and
validated in
visits etc.
Infrastructure
Train
operations
Rolling stock
Normalised
costs per km
Infrastructure
Train
operating
Rolling stock
No
rmali
sati
on
p
roc
ess
Ag
gre
ag
ati
on
p
roc
es
s
Normalised
whole
industry
including
train
operation
costs
186
Overview on normalisation process

20
11
05
23
_civ
ity_
Wh
ole
Ind
ustr
yC
ostB
en
ch
ma
rkin
g.p
ptx
©
civ
ity 2
01
0 /
//
Some of the possible key normalisation factors are indicated in the graph
Traffic Control
Infrastructure Renewal
Maintenance
Investment & enhancement
Annual revenues
Annual
costs
Funding
Transport business
Ancillary business
Extraordinary costs
Total costs Freight train operation
Overhead & management functions
Train staff
Passenger train
operation Travel Speed
Capital Cost
Maintenance & cleaning
Energy
Rolling stock
Distance between stops
Running performance
Railway system Currency conversion with PPPs Individual normalisation
Utilisation (train-/track-km)
Switch density
Degree of electrification
Fleet reserve
187
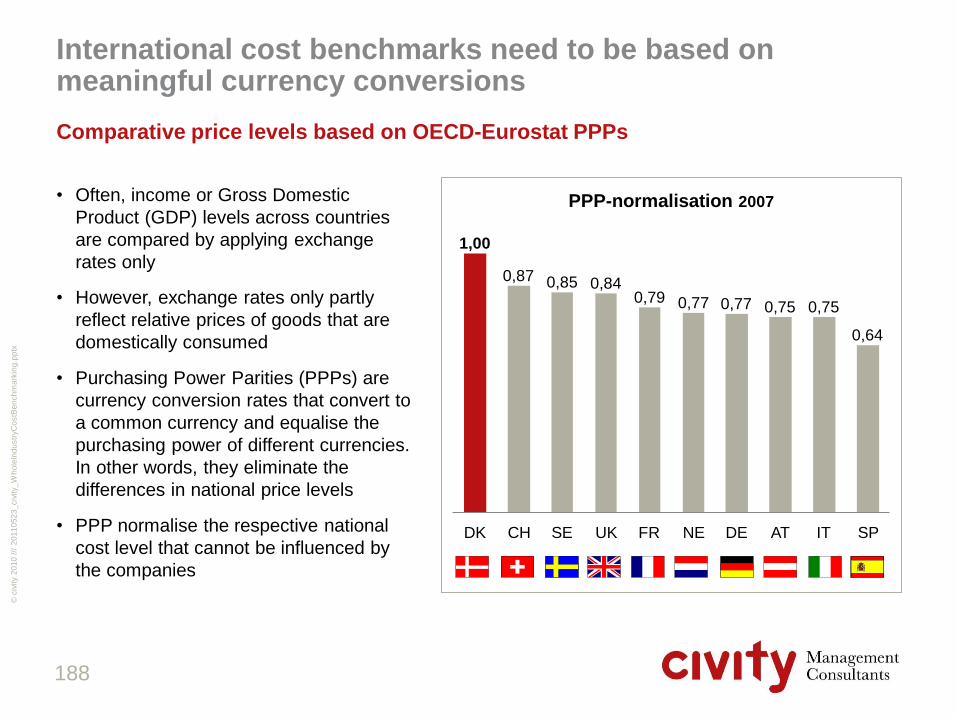
20
11
05
23
_civ
ity_
Wh
ole
Ind
ustr
yC
ostB
en
ch
ma
rkin
g.p
ptx
©
civ
ity 2
01
0 /
//
0,87 0,85 0,84 0,79 0,77 0,77 0,75 0,75
0,64
1,00
DK CH SE UK FR NE DE AT IT SP
International cost benchmarks need to be based on meaningful currency conversions
• Often, income or Gross Domestic
Product (GDP) levels across countries
are compared by applying exchange
rates only
• However, exchange rates only partly
reflect relative prices of goods that are
domestically consumed
• Purchasing Power Parities (PPPs) are
currency conversion rates that convert to
a common currency and equalise the
purchasing power of different currencies.
In other words, they eliminate the
differences in national price levels
• PPP normalise the respective national
cost level that cannot be influenced by
the companies
PPP-normalisation 2007
188
Comparative price levels based on OECD-Eurostat PPPs

20
11
05
23
_civ
ity_
Wh
ole
Ind
ustr
yC
ostB
en
ch
ma
rkin
g.p
ptx
©
civ
ity 2
01
0 /
//
To make infrastructure costs internationally comparable different purchasing power parities could be used PPPs for different expenditure categories
• Purchasing Power Parities (PPPs) are
exchange rates taking into account that
prices and volumes might differ between
countries.
• 60 different PPPs are published by
EUROSTAT and OECD.
• GDP as the main aggregate contains all
expenditures being made in an economy.
• Which PPP should be used usually depends
on the type of expenditure being compared
• Ideally the PPP should well cover the goods
being compared
• We tested the application of the four PPPs
highlighted in the left illustration
189
Structure of PPP aggregation1 Which PPP should be used?
/// G
gf.
Da
tein
am
e D
ate
nq
ue
lle
Exc
el h
ier
ein
tra
ge
n
1Source: EUROSTAT/OECD 2006, Methodological manual on purchasing power parities, Ed. 2005, Luxembourg
GDP
Gross fixed
capital
formation
Actual
collective
consumtion
Actual
individual
consumtion
Machin
ery
+
equip
ment
… …
Con-
str
uction
… …
31
categories
71
groups
152
classes Civ
il
engin
eeri
ng
work
s
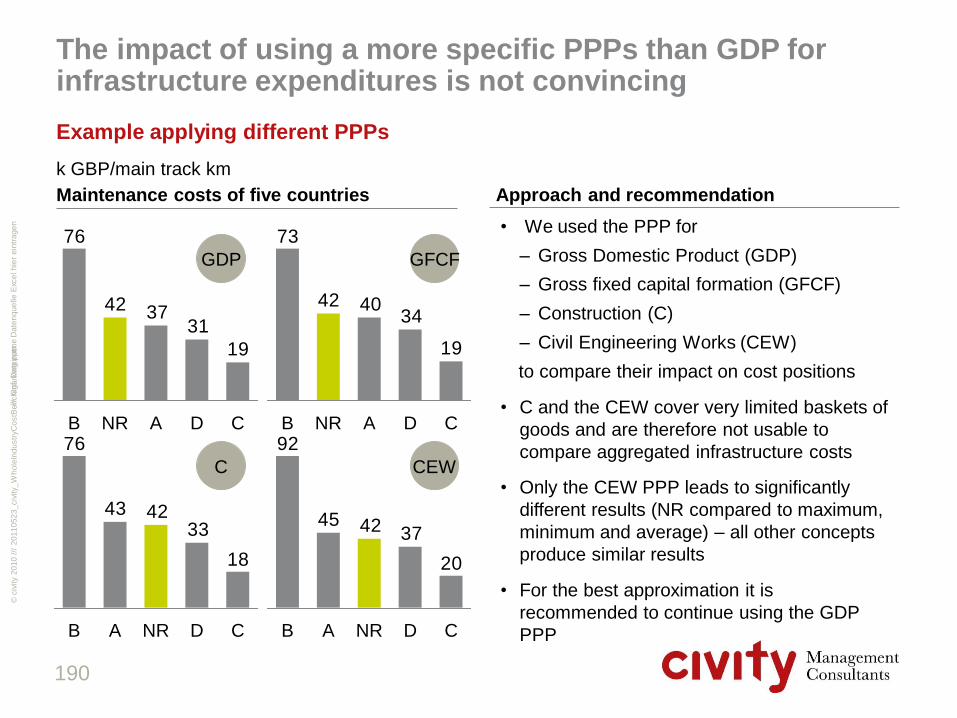
20
11
05
23
_civ
ity_
Wh
ole
Ind
ustr
yC
ostB
en
ch
ma
rkin
g.p
ptx
©
civ
ity 2
01
0 /
//
The impact of using a more specific PPPs than GDP for infrastructure expenditures is not convincing Example applying different PPPs
k GBP/main track km
• We used the PPP for
– Gross Domestic Product (GDP)
– Gross fixed capital formation (GFCF)
– Construction (C)
– Civil Engineering Works (CEW)
to compare their impact on cost positions
• C and the CEW cover very limited baskets of
goods and are therefore not usable to
compare aggregated infrastructure costs
• Only the CEW PPP leads to significantly
different results (NR compared to maximum,
minimum and average) – all other concepts
produce similar results
• For the best approximation it is
recommended to continue using the GDP
PPP
190
Maintenance costs of five countries Approach and recommendation
/// G
gf.
Da
tein
am
e D
ate
nq
ue
lle
Exc
el h
ier
ein
tra
ge
n
19
313742
76
B NR A C D
GDP
19
344042
73
B NR A C D
GFCF
18
334243
76
B A NR C D
C
20
374245
92
B A NR C D
CEW

20
11
05
23
_civ
ity_
Wh
ole
Ind
ustr
yC
ostB
en
ch
ma
rkin
g.p
ptx
©
civ
ity 2
01
0 /
//
Normalisation of infrastructure costs is based on existing UIC practices
Current methodology
Infrastructure details
• Main track
• Electrified main track
• Single and multiple track
• Switches in main track
• Train frequency
• Gross tonnage
Input data Normalisation steps
1 Purchasing Power Parities
3 Single vs. multiple track
4 Switch densities
5 Track utilisation
2 Degree of electrification
• Maintenance cost
• Average renewal expenditures
The following LICB or commonly utilised structural parameters will not be normalised:
• Single versus multiple track (LICB-methodology)
• Built-up areas of stations incl. platforms
• SEU density
• Slab or ballasted track
No data available
Level too detailed
191
LICB methodology MAINTENANCE AND RENEWAL

20
11
05
23
_civ
ity_
Wh
ole
Ind
ustr
yC
ostB
en
ch
ma
rkin
g.p
ptx
©
civ
ity 2
01
0 /
//
To generate a solid comparison, the costs of each analysed company will be allocated to the cost structure
192
Rolling
stock
Operation &
customer management
Track access & energy
Overhead
Train staff
Infra-
structure
Train
operation
(Drivers, crew)
(CAPEX,
OPEX)
Scheme of the cost structure
• The basis for qualified benchmarking is the classification of costs into a proven cost structure
• This guarantees a comparability of data from different transportation companies regardless of their
organisational structure and their cost accounting system

20
11
05
23
_civ
ity_
Wh
ole
Ind
ustr
yC
ostB
en
ch
ma
rkin
g.p
ptx
©
civ
ity 2
01
0 /
//
For the train operating cost benchmarking a proven normalisation approach will be applied
Example on normalising driver service costs Methodology
Structural details
• Train km
• Car-km
• Passenger-km
• Number of cars, locos,
• EMU, DIMU
• Number of workshops
• Number of ticket vending machines
Input data Normalisation steps
1 Purchasing
Power Parities
3 Running
performance
4 Average distance
between stops
5 Fleet reserve
2 Travel speed
• Staff costs train opera- ting and management
• Maintenance vehicles
• CAPEX vehicles
Costs
per train-km
TOC A
TOC X
Reference level
TOC B
TOC A normalised
TOC B normalised
TOC A
Travel
speed TOC X TOC B
193
Overview methodology

20
11
05
23
_civ
ity_
Wh
ole
Ind
ustr
yC
ostB
en
ch
ma
rkin
g.p
ptx
©
civ
ity 2
01
0 /
//
Stopping actions and annual running performance are dominant cost-drivers that need to be normalised
Example
194
150 200 Average annual
running performance
[k vkm/year]
50
Average distance
between stops
[routekm]
5
10
15
unit cost per km in favourable
operating conditions
unit cost per km
increase with more
frequent stops
unit cost per km in
unfavourable
operating
conditions
degressive unit cost
per km due to base-
level of fixed cost per
vehicle and year
reference case
("norm")
SCHEME

20
11
05
23
_civ
ity_
Wh
ole
Ind
ustr
yC
ostB
en
ch
ma
rkin
g.p
ptx
©
civ
ity 2
01
0 /
//
Content page
1. Introduction 3
2. Market development and structures 12
3. Performance 61
4. Infrastructure 71
5. Train operations (incl. Rolling stock) 116
6. Freight train operations 150
7. Funding and revenues 152
8. Market analysis Germany 162
9. Methodology 185
10. Conclusions 195
195
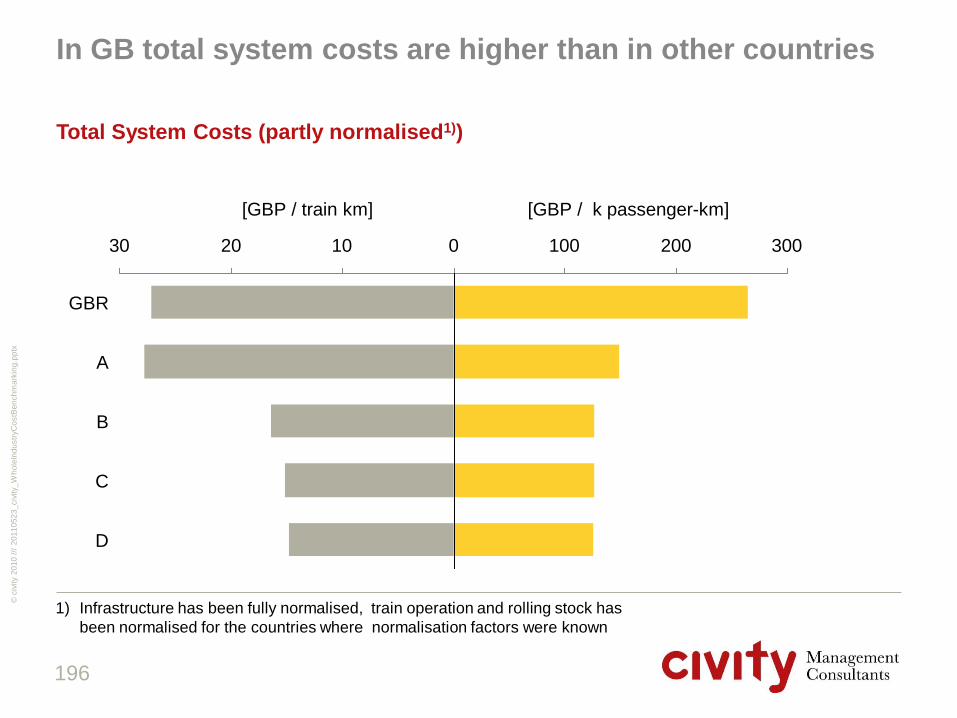
20
11
05
23
_civ
ity_
Wh
ole
Ind
ustr
yC
ostB
en
ch
ma
rkin
g.p
ptx
©
civ
ity 2
01
0 /
//
In GB total system costs are higher than in other countries
Total System Costs (partly normalised1))
196
[GBP / train km] [GBP / k passenger-km]
B
300 200 100 0 10 20 30
D
C
A
GBR
1) Infrastructure has been fully normalised, train operation and rolling stock has
been normalised for the countries where normalisation factors were known

20
11
05
23
_civ
ity_
Wh
ole
Ind
ustr
yC
ostB
en
ch
ma
rkin
g.p
ptx
©
civ
ity 2
01
0 /
//
Especially in infrastructure and rolling stock cost per train-km are higher
Total System Costs (partly normalised1))
197
D C B A GBR
[GBP / train-km]
Track access charges
Passenger train operation
Rolling Stock
Infrastructure
15.36 13.03
1) Infrastructure has been fully normalised, train operation and rolling stock has
been normalised for the countries where normalisation factors were known
Numbers do not include track access charges
20.35 22.60
14.63

20
11
05
23
_civ
ity_
Wh
ole
Ind
ustr
yC
ostB
en
ch
ma
rkin
g.p
ptx
©
civ
ity 2
01
0 /
//
Strong differences in ridership increase the gap between GB and comparators
Total System Costs (partly normalised1))
198
D C B A GBR
[GBP / k passenger-km]
Passenger train operation
Track access charges
Rolling Stock
Infrastructure
120 112
1) Infrastructure has been fully normalised, train operation and rolling stock has
been normalised for the countries where normalisation factors were known
Numbers do not include track access charges
202
123 124
20
11
05
23
_civ
ity_
Wh
ole
Ind
ustr
yC
ostB
en
ch
ma
rkin
g.p
ptx
©
civ
ity 2
01
0 /
//
System cost
Key findings (1/3)
• Among a sample (!) of European peer markets with modest (or none) progress in
market opening, the UK has arguably achieved the highest degree of on-rail
competition
• The overall cost-efficiency of passenger train operations in the UK shows a good
competitive position in comparison with the European peers, however with the
exception of rolling-stock lease expenditures
• Passenger train farebox revenues are "at the upper end" of peer group comparisons,
this however is the somewhat "unhealthy" reason for low train utilisations on one
hand, over-compensated by exceedingly above average tariff levels in the UK
passenger market on the other ("high-end" positioning in a niche-market segment) –
a repositioning of the UK passenger rail system, as successfully demonstrated by
countries like Switzerland, looks appealing in a thrust to add more value to the system
in the future
• The rail network utilisation in the UK ranges close to peer group average, which is
equivalent to low infrastructure asset turnover, yet this may be partly attribuable to the
different travel and freight traffic geographies of the respective countries
199

20
11
05
23
_civ
ity_
Wh
ole
Ind
ustr
yC
ostB
en
ch
ma
rkin
g.p
ptx
©
civ
ity 2
01
0 /
//
System cost
Key findings (2/3)
• The industry set-up at the interface between infrastructure and train operations in the
UK is geared towards very high levels of track access charging, which however does
not appear to have any immediate, beneficial steering effects
• Network infrastructure costs in the UK are substantially above peer levels, which is a
result of both, below standard cost-efficiency, but also a due recovery from historically
accumulated investment backlogs
• As a grand total the overall "cash-intake" (or "resource consumption") of the UK
railway system is clearly above European comparators in relative terms (compared by
system size), an added benefit to the system from this extraordinary level of resources
deployed cannot be detected
• In particular the total amount of tax-payer generated funding into the system, which is
deployed for both, infrastructure and train operations, is by far the highest (again in
relative terms) among the peers
200

20
11
05
23
_civ
ity_
Wh
ole
Ind
ustr
yC
ostB
en
ch
ma
rkin
g.p
ptx
©
civ
ity 2
01
0 /
//
System cost
Key findings (3/3)
• All in all, and given the relative proportions of costs for infrastructure ("high share")
and train operations ("low share"), it can be concluded that the benefits of "on-rail"
competition may well be playing out, they are however far less significant in absolute
terms than the disadvantages that the UK system is burdened with regarding sub-
standard value-for-money of network infrastructure provision
201
20
11
05
23
_civ
ity_
Wh
ole
Ind
ustr
yC
ostB
en
ch
ma
rkin
g.p
ptx
©
civ
ity 2
01
0 /
//
Abbreviations
FOC: Freight Operating Company
FTE: Full Time Equivalent
IC: Intercity
LCR: London and Continental Railways
LSE: London South East
PPP: Purchasing Power Parities
ROSCO: Rolling Stock Company
TAC: Track Access Charges
TIR: Inter-Regional Express Trains (France)
TOC: Train Operating Company
TRE: Regional Express Trains (France)
TRN: National Express Trains (France)
202

20
11
05
23
_civ
ity_
Wh
ole
Ind
ustr
yC
ostB
en
ch
ma
rkin
g.p
ptx
©
civ
ity 2
01
0 /
//
203
The team
civity Management Consultants GmbH & Co. KG
Tesdorpfstr. 11
20148 Hamburg
Germany
www.civity.de
Katja Gieseke
Partner
Frank Zschoche
Partner
Dr. Heiner Bente
Senior Advisor
Klaus Wittmeier
Project Manager
Anna Lutterbach
Senior Consultant
Matthias Schulz
Consultant
phone: +49.40.181 22 36-61
mobile: +49.163.30 96 116
email: [email protected]
phone: +49.40.181 22 36-66
mobile: +49.171.11 790
email: [email protected]
phone: +49.40.181 22 36-50
mobile: +49.163.30 96 121
email: [email protected]
phone: +49.40.181 22 36-67
mobile: +49.160.70 63 225
email: [email protected]
phone: +49.30.688 135 22-23
mobile: +49.160.70 46 361
email: [email protected]
phone: +49.40.181 22 36-64
mobile: +49.160.58 83 762
email: [email protected]
Arne Beck
Project Manager
phone: +49.30.688 135 22-22
mobile: +49.178.20 62 746
email: [email protected]