
International Tourism – A General Overview World Tourism Organization .
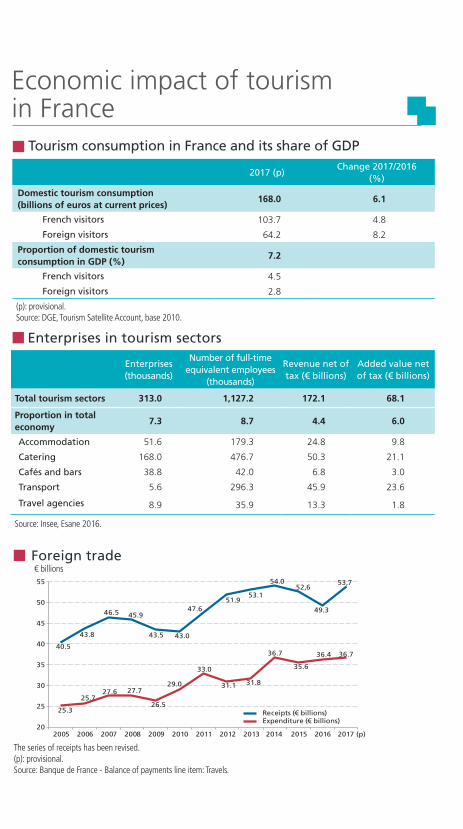
Tourism consumption in France and its share of GDP
Foreign trade
2017 (p)Change 2017/2016
(%)
Domestic tourism consumption (billions of euros at current prices)
168.0 6.1
French visitors 103.7 4.8
Foreign visitors 64.2 8.2
Proportion of domestic tourism consumption in GDP (%)
7.2
French visitors 4.5
Foreign visitors 2.8
(p): provisional. Source: DGE, Tourism Satellite Account, base 2010.
Enterprises in tourism sectors
Enterprises (thousands)
Number of full-time equivalent employees
(thousands)
Revenue net of tax (€ billions)
Added value net of tax (€ billions)
Total tourism sectors 313.0 1,127.2 172.1 68.1
Proportion of total economy
7.3 8.7 4.4 6.0
Accommodation 51.6 179.3 24.8 9.8
Catering 168.0 476.7 50.3 21.1
Cafés and bars 38.8 42.0 6.8 3.0
Transport 5.6 296.3 45.9 23.6
Travel agencies 8.9 35.9 13.3 1.8
Source: Insee, Esane 2016.
Find out more: www.entreprises.gouv.fr
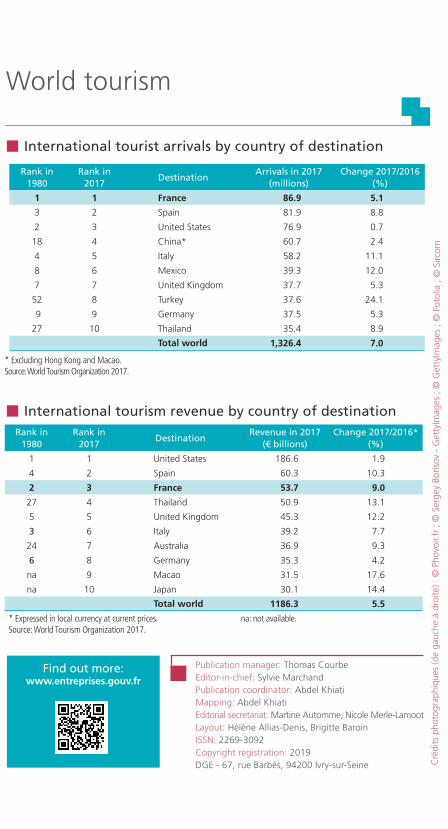
World tourism
International tourist arrivals by country of destination
International tourism revenue by country of destination
Cré
dits
pho
togr
aphi
ques
(de
gauc
he à
dro
ite) :
© P
hovo
ir.fr
; ©
Ser
gey
Boris
ov -
Get
tyIm
ages
; ©
Get
tyIm
ages
; ©
Fot
olia
; ©
Sirc
om
Rank in 1980
Rank in 2017
DestinationArrivals in 2017
(millions)Change
2017/2016** (%)
1 1 France 86.9 5.1
3 2 Spain 81.9 8.8
2 3 United States 76.9 0.7
18 4 China* 60.7 2.4
4 5 Italy 58.2 11.1
8 6 Mexico 39.3 12.0
7 7 United Kingdom 37.7 5.3
52 8 Turkey 37.6 24.1
9 9 Germany 37.5 5.3
27 10 Thailand 35.4 8.9
Total world 1,326.4 7.0
Rank in 1980
Rank in 2017
DestinationRevenue in 2017
(€ billions)Change 2017/2016*
(%)
1 1 United States 186.6 1.9
4 2 Spain 60.3 10.3
2 3 France 53.7 9.0
27 4 Thailand 50.9 13.1
5 5 United Kingdom 45.3 12.2
3 6 Italy 39.2 7.7
24 7 Australia 36.9 9.3
6 8 Germany 35.3 4.2
na 9 Macao 31.5 17.6
na 10 Japan 30.1 14.4
Total world 1186.3 5.5
* Expressed in local currency at current prices. Source: World Tourism Organization 2017.
na: not available.
International tourism in France
Arrivals, overnight stays and revenue, by continent
Arrivals, overnight stays and revenue, by main countries
Continent of residence
Tourist arrivals (millions)
Tourist overnight stays
(millions)
Same-day visitors (millions)
Receipts* (€ billions)
Europe 68.3 428.2 114.8 35.9
EU (28) 59.6 56.9 59.6 29.2
Euro area (19) 44.5 42.2 44.1 21.9
Americas 8.7 68.9 3.0 7.1
Asia, Oceania 5.9 40.5 1.9 8.4
Africa 2.8 36.7 0.8 2.3
Total international visitors 86.9 583.0 120.5 53.7
* Tourists and same-day visitors. Scope: International tourism in Metropolitan France. Source: DGE, Banque de France, EVE survey 2017.
Country of residence
Tourist arrivals (millions)
Tourist overnight stays
(millions)
Same-day visitors (millions)
Receipts* (€ billions)
United Kingdom 12.7 82.8 3.5 5.8
Germany 11.8 77.9 20.1 5.1
Belgium, Luxembourg 11.3 68.2 38.6 7.0
Italy 6.7 39.0 9.5 3.3
Switzerland 7.0 37.1 27.3 5.5
Spain 6.8 34.1 10.0 3.2
Netherlands 4.4 30.7 3.3 1.9
United States 4.4 35.2 1.6 3.6
China** 2.1 11.4 0.7 4.0Australia 0.9 6.9 0.1 1.1
Total Top 10 68.1 423.5 114.7 40.4
*Receipts (tourists and same-day visitors). ** Excluding Hong Kong and Macao.Source: DGE, Banque de France, EVE survey 2017.
Length of stay of international tourists
40.5
43.8
46.5 45.9
43.5 43.0
47.651.9
53.1
54.052,6
49.3
53,7
25.3
25.727.6 27.7
26.5
29.0
33.0
31.1 31.8
36.7
35.6
36.4 36.7
2005 2006 2007 2008 2009 2010 2011 2012 2013 2014 2015 2016 2017 (p) 20
25
30
35
40
45
50
55
Receipts (€ billions )Expenditure (€ billions)
The series of receipts has been revised.(p): provisional.Source: Banque de France - Balance of payments line item: Travels.
International tourists resident in EuropeInternational tourists resident outside of Europe
1 2 3 4 5 6 7 8 9 10 11 12 13 14 15-21 22-28 29 +Length of stay (nights)
0
3
6
9
12
15
18
%
Key: 8.9% of international tourists resident in Europe (compared with 6.1% outside of Europe) spend 7 nights in France.Source: DGE, Banque de France, EVE survey 2017.
* Excluding Hong Kong and Macao. Source: World Tourism Organization 2017.
Economic impact of tourism in France
Publication manager: Thomas CourbeEditor-in-chief: Sylvie MarchandPublication coordinator: Abdel KhiatiMaps: Abdel KhiatiEditorial secretariat: Martine Automme, Nicole Merle-LamootLayout: Hélène Allias-Denis, Brigitte BaroinISSN: 2269-3092Copyright registration: 2019DGE - 67, rue Barbès, 94200 Ivry-sur-Seine
MINISTÈRE DE L'ÉCONOMIEET DES FINANCES
KEY FACTS
on tourism
ÉTUDES ÉCONOMIQUES
DIRECTION GÉNÉRALEDES ENTREPRISES
2018 Edition
€ billions
Tourism consumption in France and its share of GDP
Foreign trade
2017 (p)Change 2017/2016
(%)
Domestic tourism consumption (billions of euros at current prices)
168.0 6.1
French visitors 103.7 4.8
Foreign visitors 64.2 8.2
Proportion of domestic tourism consumption in GDP (%)
7.2
French visitors 4.5
Foreign visitors 2.8
(p): provisional. Source: DGE, Tourism Satellite Account, base 2010.
Enterprises in tourism sectors
Enterprises (thousands)
Number of full-time equivalent employees
(thousands)
Revenue net of tax (€ billions)
Added value net of tax (€ billions)
Total tourism sectors 313.0 1,127.2 172.1 68.1
Proportion in total economy
7.3 8.7 4.4 6.0
Accommodation 51.6 179.3 24.8 9.8
Catering 168.0 476.7 50.3 21.1
Cafés and bars 38.8 42.0 6.8 3.0
Transport 5.6 296.3 45.9 23.6
Travel agencies 8.9 35.9 13.3 1.8
Source: Insee, Esane 2016.
Find out more: www.entreprises.gouv.fr
World tourism
International tourist arrivals by country of destination
International tourism revenue by country of destination
Cré
dits
pho
togr
aphi
ques
(de
gauc
he à
dro
ite) :
© P
hovo
ir.fr
; ©
Ser
gey
Boris
ov -
Get
tyIm
ages
; ©
Get
tyIm
ages
; ©
Fot
olia
; ©
Sirc
om
Rank in 1980
Rank in 2017
DestinationArrivals in 2017
(millions)Change 2017/2016
(%)
1 1 France 86.9 5.1
3 2 Spain 81.9 8.8
2 3 United States 76.9 0.7
18 4 China* 60.7 2.4
4 5 Italy 58.2 11.1
8 6 Mexico 39.3 12.0
7 7 United Kingdom 37.7 5.3
52 8 Turkey 37.6 24.1
9 9 Germany 37.5 5.3
27 10 Thailand 35.4 8.9
Total world 1,326.4 7.0
Rank in 1980
Rank in 2017
DestinationRevenue in 2017
(€ billions)Change 2017/2016*
(%)
1 1 United States 186.6 1.9
4 2 Spain 60.3 10.3
2 3 France 53.7 9.0
27 4 Thailand 50.9 13.1
5 5 United Kingdom 45.3 12.2
3 6 Italy 39.2 7.7
24 7 Australia 36.9 9.3
6 8 Germany 35.3 4.2
na 9 Macao 31.5 17.6
na 10 Japan 30.1 14.4
Total world 1186.3 5.5
* Expressed in local currency at current prices. Source: World Tourism Organization 2017.
na: not available.
International tourism in France
Arrivals, overnight stays and revenue, by continent
Arrivals, overnight stays and revenue, by main countries
Continent of residence
Tourist arrivals (millions)
Tourist overnight stays
(millions)
Same-day visitors (millions)
Receipts* (€ billions)
Europe 68.3 428.2 114.8 35.9
EU (28) 59.6 56.9 59.6 29.2
Euro area (19) 44.5 42.2 44.1 21.9
Americas 8.7 68.9 3.0 7.1
Asia, Oceania 5.9 40.5 1.9 8.4
Africa 2.8 36.7 0.8 2.3
Total international visitors 86.9 583.0 120.5 53.7
* Tourists and same-day visitors. Scope: International tourism in Metropolitan France. Source: DGE, Banque de France, EVE survey 2017.
Country of residence
Tourist arrivals (millions)
Tourist overnight stays
(millions)
Same-day visitors (millions)
Receipts* (€ billions)
United Kingdom 12.7 82.8 3.5 5.8
Germany 11.8 77.9 20.1 5.1
Belgium, Luxembourg 11.3 68.2 38.6 7.0
Italy 6.7 39.0 9.5 3.3
Switzerland 7.0 37.1 27.3 5.5
Spain 6.8 34.1 10.0 3.2
Netherlands 4.4 30.7 3.3 1.9
United States 4.4 35.2 1.6 3.6
China** 2.1 11.4 0.7 4.0Australia 0.9 6.9 0.1 1.1
Total Top 10 68.1 423.5 114.7 40.4
*Receipts (tourists and same-day visitors). ** Excluding Hong Kong and Macao.Source: DGE, Banque de France, EVE survey 2017.
Length of stay of international tourists
40.5
43.8
46.5 45.9
43.5 43.0
47.651.9
53.1
54.052,6
49.3
53,7
25.3
25.727.6 27.7
26.5
29.0
33.0
31.1 31.8
36.7
35.6
36.4 36.7
2005 2006 2007 2008 2009 2010 2011 2012 2013 2014 2015 2016 2017 (p) 20
25
30
35
40
45
50
55
Receipts (€ billions )Expenditure (€ billions)
The series of receipts has been revised.(p): provisional.Source: Banque de France - Balance of payments line item: Travels.
International tourists resident in EuropeInternational tourists resident outside of Europe
1 2 3 4 5 6 7 8 9 10 11 12 13 14 15-21 22-28 29 +Length of stay (nights)
0
3
6
9
12
15
18
%
Key: 8.9% of international tourists resident in Europe (compared with 6.1% outside of Europe) spend 7 nights in France.Source: DGE, Banque de France, EVE survey 2017.
* Excluding Hong Kong and Macao. Source: World Tourism Organization 2017.
Economic impact of tourism in France
Publication manager: Thomas CourbeEditor-in-chief: Sylvie MarchandPublication coordinator: Abdel KhiatiMapping: Abdel KhiatiEditorial secretariat: Martine Automme, Nicole Merle-LamootLayout: Hélène Allias-Denis, Brigitte BaroinISSN: 2269-3092Copyright registration: 2019DGE - 67, rue Barbès, 94200 Ivry-sur-Seine
MINISTÈRE DE L'ÉCONOMIEET DES FINANCES
KEY FACTS
on tourism
ÉTUDES ÉCONOMIQUES
DIRECTION GÉNÉRALEDES ENTREPRISES
2018 Edition
€ billions

Personal tourism by French residents* *Residents of metropolitan France aged 15 or older.
Jobs in tourism sectors
Tourism sectors: employment and accommodation
Commercial tourist accommodation in FranceNumber of
establishments (thousands)
Beds
Thousands %
Tourist hotels 17.8 1,282.5 23.3
Tourist residences 2.3 689.8 12.5
Campsites1 8.3 2,731.5 49.7
Holiday villages and family homes 0.9 256.0 4.7
Youth hostels 0.2 34.1 0.6
Classified self-catering accommodations2 95.1 455.2 8.3
Bed and breakfast 25.3 50.6 0.9
Total commercial accommodation 5,499.8 100.0
1 Includes establishments that only offer year-round rentals.2 The classification « self-catering accommodation » is no longer a requirement for the label Gîtes de France ou Clévacances. Some labelled self-catering accommodations are not classified.Sources: Insee, DGE, regional partners, FNGF, Clévacances France, Accueil paysan, Fleurs de soleil, Tourisme et territoire - platform Class as of 1 January 2018.
Key: there are 420,498 jobs in tourism sectors in the Île-de-France region; this represents 9.0% of the region’s total employment.Source : Acoss as of 1 January 2017.
420
21
42
Jobs in tourism sectorsas a percentage of total jobs in the region
More than 7%Between 6 and 7%Between 5 and 6%Less than 5%
Jobs in tourism sectors(thousands)
96
96
3352
50
4582
171
40
92
8
121
420
Departure rate (at least one night spent away from home)
Departure rate (%)
Average number of trips per traveller
Total personal trips 73.8 5.0
Short stays (1 to 3 nights) 55.1 3.7
Long stays (4 nights or more) 57.4 2.8
Metropolitan France 69.7 4.6
Stays abroad or in overseas France 25.2 1.6
Scope: travel for personal purposes by French residents aged 15 or older.Source: DGE, SDT Survey 2017.
Trips by length of stay
Trips (millions)
Overnight stays
(millions)
Average length of stay (nights)
Total personal trips 196.1 1,048.8 5.3
Metropolitan France 170.9 835.6 4.9
Stays abroad or in overseas France 25.2 213.2 8.5
Short stays (1 to 3 nights) 105.6 193.5 1.8
Metropolitan France 99.3 180.0 1.8
Stays abroad or in overseas France 6.3 13.5 2.1
Long stays (4 nights or more) 90.5 855.3 9.4
Metropolitan France 71.6 655.6 9.2
Stays abroad or in overseas France 18.9 199.7 10.6
Scope: travel for personal purposes by French residents aged 15 or older.Source: DGE, SDT Survey 2017.
Trips by type of reservation
Metropolitan France
Stays abroad or in overseas
FranceTotal
Reserved trips (millions) 69.2 22.3 91.5
Travel agencies and tour operators1 (%) 7.7 38.3 15.1
Service providers2 (%) 61.3 45.5 57.5
Reservation platform3 (%) 9.0 11.2 9.6
Comparison website or search engine4 (%) 9.0 22.1 12.2
Other reservation agencies5 (%) 18.3 11.5 16.7
Reserved trips as a percentage of total trips (%) 40.5 89.0 46.7 1 Including online travel agencies. 2 Transport firm, hotel, etc. 3 Airbnb.fr, couchsurfing.org, echangedemaison.com, etc. 4 trivago.fr, kayak.fr, liligo.fr, booking.com, etc. 5 Association, tourist office, works council, etc. Scope: travel for personal purposes by French residents aged 15 or older.Source: DGE, SDT Survey 2017.
Tourism in metropolitan France by type of accommodation
Tourism in metropolitan France by type of destinationBreakdown by trips (%)
Breakdown by nights (%)
Average length of stay (nights)
Seashore destinations 22.9 32.1 6.8
Rural seashore 7.5 11.1 7.3
Urban seashore 15.5 20.9 6.6
Mountain destinations 19.1 21.9 5.6
Non-resorts 13.5 14.6 5.3
Resorts 5.6 7.3 6.4
Rural destinations 21.8 18.6 4.2
Urban destinations 30.3 21.7 3.5
Not reported 5.9 5.7 4.9
Metropolitan France 100.0 100.0 4.9
Scope: travel for personal purposes by French residents aged 15 or older.Source: DGE, SDT Survey 2017.
Breakdown by trips
(%)
Breakdown by nights
(%)
Average length of stay
(nights)
Commercial accommodation 34.0 37.6 5.4
Hotels 12.2 6.5 2.6
Campsites 6.0 9.9 8.1
Rentals, self-catering, bed and breakfast 11.4 15.5 6.7
Non-commercial accommodation 66.0 62.4 4.6
Second home 9.4 16.5 8.6
Family 44.1 36.8 4.1
Friends 10.7 7.4 3.4
Metropolitan France 100.0 100.0 4.9
Scope: travel for personal purposes by French residents aged 15 or older.Source: DGE, SDT Survey 2017.
Same-day trips*
Number of trips (millions)
Total same-day trips 68.1
Metropolitan France 54.8
Stays abroad or in overseas France 13.3
* Trips taken in the same day more than 100 km from home. Scope: travel for personal purposes by French residents aged 15 or older.Source: DGE, SDT Survey 2017.
Overnight stays by «département» of destination
Scope: travel for personal purposes by French residents aged 15 or older.Source: DGE, SDT Survey 2017.
Trips to overseas France and abroad
Trips (millions)Overnight stays
(millions)
Average length of stay
(nights)
Europe 19.3 132.6 6.9
Spain 4.4 34.2 7.7
Italy 3.2 22.9 7.2
Belgium, Luxembourg 1.7 5.3 3.2
United Kingdom 1.7 9.4 5.7
Germany 1.4 6.3 4.6
Americas 1.8 25.4 14.3
United States 0.8 10.4 13.2
Africa 2.0 21.4 10.7
Morocco 0.6 5.6 9.6
Tunisia 0.3 3.3 11.5
Asia, Oceania 1.4 22.7 15.8
Total trips abroad 24.5 202.1 8.2
Overseas France 0.6 11.1 17.5
Scope: travel for personal purposes by French residents aged 15 or older.Source: DGE, SDT Survey 2017.
Overnights staysper "département" as a shareof the national total (%)
More than 1,5 Between 0,7 and 1,5Between 0,5 and 0,7 Less than 0,5

Tourism consumption in France and its share of GDP
Foreign trade
2017 (p)Change 2017/2016
(%)
Domestic tourism consumption (billions of euros at current prices)
168.0 6.1
French visitors 103.7 4.8
Foreign visitors 64.2 8.2
Proportion of domestic tourism consumption in GDP (%)
7.2
French visitors 4.5
Foreign visitors 2.8
(p): provisional. Source: DGE, Tourism Satellite Account, base 2010.
Enterprises in tourism sectors
Enterprises (thousands)
Number of full-time equivalent employees
(thousands)
Revenue net of tax (€ billions)
Added value net of tax (€ billions)
Total tourism sectors 313.0 1,127.2 172.1 68.1
Proportion in total economy
7.3 8.7 4.4 6.0
Accommodation 51.6 179.3 24.8 9.8
Catering 168.0 476.7 50.3 21.1
Cafés and bars 38.8 42.0 6.8 3.0
Transport 5.6 296.3 45.9 23.6
Travel agencies 8.9 35.9 13.3 1.8
Source: Insee, Esane 2016.
Find out more: www.entreprises.gouv.fr
World tourism
International tourist arrivals by country of destination
International tourism revenue by country of destination
Cré
dits
pho
togr
aphi
ques
(de
gauc
he à
dro
ite) :
© P
hovo
ir.fr
; ©
Ser
gey
Boris
ov -
Get
tyIm
ages
; ©
Get
tyIm
ages
; ©
Fot
olia
; ©
Sirc
om
Rank in 1980
Rank in 2017
DestinationArrivals in 2017
(millions)Change 2017/2016
(%)
1 1 France 86.9 5.1
3 2 Spain 81.9 8.8
2 3 United States 76.9 0.7
18 4 China* 60.7 2.4
4 5 Italy 58.2 11.1
8 6 Mexico 39.3 12.0
7 7 United Kingdom 37.7 5.3
52 8 Turkey 37.6 24.1
9 9 Germany 37.5 5.3
27 10 Thailand 35.4 8.9
Total world 1,326.4 7.0
Rank in 1980
Rank in 2017
DestinationRevenue in 2017
(€ billions)Change 2017/2016*
(%)
1 1 United States 186.6 1.9
4 2 Spain 60.3 10.3
2 3 France 53.7 9.0
27 4 Thailand 50.9 13.1
5 5 United Kingdom 45.3 12.2
3 6 Italy 39.2 7.7
24 7 Australia 36.9 9.3
6 8 Germany 35.3 4.2
na 9 Macao 31.5 17.6
na 10 Japan 30.1 14.4
Total world 1186.3 5.5
* Expressed in local currency at current prices. Source: World Tourism Organization 2017.
na: not available.
International tourism in France
Arrivals, overnight stays and revenue, by continent
Arrivals, overnight stays and revenue, by main countries
Continent of residence
Tourist arrivals (millions)
Tourist overnight stays
(millions)
Same-day visitors (millions)
Receipts* (€ billions)
Europe 68.3 428.2 114.8 35.9
EU (28) 59.6 56.9 59.6 29.2
Euro area (19) 44.5 42.2 44.1 21.9
Americas 8.7 68.9 3.0 7.1
Asia, Oceania 5.9 40.5 1.9 8.4
Africa 2.8 36.7 0.8 2.3
Total international visitors 86.9 583.0 120.5 53.7
* Tourists and same-day visitors. Scope: International tourism in Metropolitan France. Source: DGE, Banque de France, EVE survey 2017.
Country of residence
Tourist arrivals (millions)
Tourist overnight stays
(millions)
Same-day visitors (millions)
Receipts* (€ billions)
United Kingdom 12.7 82.8 3.5 5.8
Germany 11.8 77.9 20.1 5.1
Belgium, Luxembourg 11.3 68.2 38.6 7.0
Italy 6.7 39.0 9.5 3.3
Switzerland 7.0 37.1 27.3 5.5
Spain 6.8 34.1 10.0 3.2
Netherlands 4.4 30.7 3.3 1.9
United States 4.4 35.2 1.6 3.6
China** 2.1 11.4 0.7 4.0Australia 0.9 6.9 0.1 1.1
Total Top 10 68.1 423.5 114.7 40.4
*Receipts (tourists and same-day visitors). ** Excluding Hong Kong and Macao.Source: DGE, Banque de France, EVE survey 2017.
Length of stay of international tourists
40.5
43.8
46.5 45.9
43.5 43.0
47.651.9
53.1
54.052,6
49.3
53,7
25.3
25.727.6 27.7
26.5
29.0
33.0
31.1 31.8
36.7
35.6
36.4 36.7
2005 2006 2007 2008 2009 2010 2011 2012 2013 2014 2015 2016 2017 (p) 20
25
30
35
40
45
50
55
Receipts (€ billions )Expenditure (€ billions)
The series of receipts has been revised.(p): provisional.Source: Banque de France - Balance of payments line item: Travels.
International tourists resident in EuropeInternational tourists resident outside of Europe
1 2 3 4 5 6 7 8 9 10 11 12 13 14 15-21 22-28 29 +Length of stay (nights)
0
3
6
9
12
15
18
%
Key: 8.9% of international tourists resident in Europe (compared with 6.1% outside of Europe) spend 7 nights in France.Source: DGE, Banque de France, EVE survey 2017.
* Excluding Hong Kong and Macao. Source: World Tourism Organization 2017.
Economic impact of tourism in France
Publication manager: Thomas CourbeEditor-in-chief: Sylvie MarchandPublication coordinator: Abdel KhiatiMapping: Abdel KhiatiEditorial secretariat: Martine Automme, Nicole Merle-LamootLayout: Hélène Allias-Denis, Brigitte BaroinISSN: 2269-3092Copyright registration: 2019DGE - 67, rue Barbès, 94200 Ivry-sur-Seine
MINISTÈRE DE L'ÉCONOMIEET DES FINANCES
KEY FACTS
on tourism
ÉTUDES ÉCONOMIQUES
DIRECTION GÉNÉRALEDES ENTREPRISES
2018 Edition
€ billions
Tourism consumption in France and its share of GDP
Foreign trade
2017 (p)Change 2017/2016
(%)
Domestic tourism consumption (billions of euros at current prices)
168.0 6.1
French visitors 103.7 4.8
Foreign visitors 64.2 8.2
Proportion of domestic tourism consumption in GDP (%)
7.2
French visitors 4.5
Foreign visitors 2.8
(p): provisional. Source: DGE, Tourism Satellite Account, base 2010.
Enterprises in tourism sectors
Enterprises (thousands)
Number of full-time equivalent employees
(thousands)
Revenue net of tax (€ billions)
Added value net of tax (€ billions)
Total tourism sectors 313.0 1,127.2 172.1 68.1
Proportion in total economy
7.3 8.7 4.4 6.0
Accommodation 51.6 179.3 24.8 9.8
Catering 168.0 476.7 50.3 21.1
Cafés and bars 38.8 42.0 6.8 3.0
Transport 5.6 296.3 45.9 23.6
Travel agencies 8.9 35.9 13.3 1.8
Source: Insee, Esane 2016.
Find out more: www.entreprises.gouv.fr
World tourism
International tourist arrivals by country of destination
International tourism revenue by country of destinationC
rédi
ts p
hoto
grap
hiqu
es (d
e ga
uche
à d
roite
) : ©
Pho
voir.
fr ;
© S
erge
y Bo
risov
- G
etty
Imag
es ;
© G
etty
Imag
es ;
© F
otol
ia ;
© S
ircom
Rank in 1980
Rank in 2017
DestinationArrivals in 2017
(millions)Change 2017/2016
(%)
1 1 France 86.9 5.1
3 2 Spain 81.9 8.8
2 3 United States 76.9 0.7
18 4 China* 60.7 2.4
4 5 Italy 58.2 11.1
8 6 Mexico 39.3 12.0
7 7 United Kingdom 37.7 5.3
52 8 Turkey 37.6 24.1
9 9 Germany 37.5 5.3
27 10 Thailand 35.4 8.9
Total world 1,326.4 7.0
Rank in 1980
Rank in 2017
DestinationRevenue in 2017
(€ billions)Change 2017/2016*
(%)
1 1 United States 186.6 1.9
4 2 Spain 60.3 10.3
2 3 France 53.7 9.0
27 4 Thailand 50.9 13.1
5 5 United Kingdom 45.3 12.2
3 6 Italy 39.2 7.7
24 7 Australia 36.9 9.3
6 8 Germany 35.3 4.2
na 9 Macao 31.5 17.6
na 10 Japan 30.1 14.4
Total world 1186.3 5.5
* Expressed in local currency at current prices. Source: World Tourism Organization 2017.
na: not available.
International tourism in France
Arrivals, overnight stays and revenue, by continent
Arrivals, overnight stays and revenue, by main countries
Continent of residence
Tourist arrivals (millions)
Tourist overnight stays
(millions)
Same-day visitors (millions)
Receipts* (€ billions)
Europe 68.3 428.2 114.8 35.9
EU (28) 59.6 56.9 59.6 29.2
Euro area (19) 44.5 42.2 44.1 21.9
Americas 8.7 68.9 3.0 7.1
Asia, Oceania 5.9 40.5 1.9 8.4
Africa 2.8 36.7 0.8 2.3
Total international visitors 86.9 583.0 120.5 53.7
* Tourists and same-day visitors. Scope: International tourism in Metropolitan France. Source: DGE, Banque de France, EVE survey 2017.
Country of residence
Tourist arrivals (millions)
Tourist overnight stays
(millions)
Same-day visitors (millions)
Receipts* (€ billions)
United Kingdom 12.7 82.8 3.5 5.8
Germany 11.8 77.9 20.1 5.1
Belgium, Luxembourg 11.3 68.2 38.6 7.0
Italy 6.7 39.0 9.5 3.3
Switzerland 7.0 37.1 27.3 5.5
Spain 6.8 34.1 10.0 3.2
Netherlands 4.4 30.7 3.3 1.9
United States 4.4 35.2 1.6 3.6
China** 2.1 11.4 0.7 4.0Australia 0.9 6.9 0.1 1.1
Total Top 10 68.1 423.5 114.7 40.4
*Receipts (tourists and same-day visitors). ** Excluding Hong Kong and Macao.Source: DGE, Banque de France, EVE survey 2017.
Length of stay of international tourists
40.5
43.8
46.5 45.9
43.5 43.0
47.651.9
53.1
54.052,6
49.3
53,7
25.3
25.727.6 27.7
26.5
29.0
33.0
31.1 31.8
36.7
35.6
36.4 36.7
2005 2006 2007 2008 2009 2010 2011 2012 2013 2014 2015 2016 2017 (p) 20
25
30
35
40
45
50
55
Receipts (€ billions )Expenditure (€ billions)
The series of receipts has been revised.(p): provisional.Source: Banque de France - Balance of payments line item: Travels.
International tourists resident in EuropeInternational tourists resident outside of Europe
1 2 3 4 5 6 7 8 9 10 11 12 13 14 15-21 22-28 29 +Length of stay (nights)
0
3
6
9
12
15
18
%
Key: 8.9% of international tourists resident in Europe (compared with 6.1% outside of Europe) spend 7 nights in France.Source: DGE, Banque de France, EVE survey 2017.
* Excluding Hong Kong and Macao. Source: World Tourism Organization 2017.
Economic impact of tourism in France
Publication manager: Thomas CourbeEditor-in-chief: Sylvie MarchandPublication coordinator: Abdel KhiatiMapping: Abdel KhiatiEditorial secretariat: Martine Automme, Nicole Merle-LamootLayout: Hélène Allias-Denis, Brigitte BaroinISSN: 2269-3092Copyright registration: 2019DGE - 67, rue Barbès, 94200 Ivry-sur-Seine
MINISTÈRE DE L'ÉCONOMIEET DES FINANCES
KEY FACTS
on tourism
ÉTUDES ÉCONOMIQUES
DIRECTION GÉNÉRALEDES ENTREPRISES
2018 Edition
€ billions