International Tax Competitiveness Index 2016 · PDF file · 2017-06-30The...
47
International Tax Competitiveness Index 2016 PRINCIPLED INSIGHTFUL ENGAGED By Kyle Pomerleau
Transcript of International Tax Competitiveness Index 2016 · PDF file · 2017-06-30The...
International Tax Competitiveness Index 2016
PRINCIPLED INSIGHTFUL ENGAGED
By Kyle Pomerleau

ISBN: 978-1-942768-13-5
© 2017 Tax Foundation1325 G Street, NW, Suite 950
Washingtion, D.C. 20005202.464.6200
taxfoundation.org
1
TAX FOUNDATIONIN
TROD
UC
TION
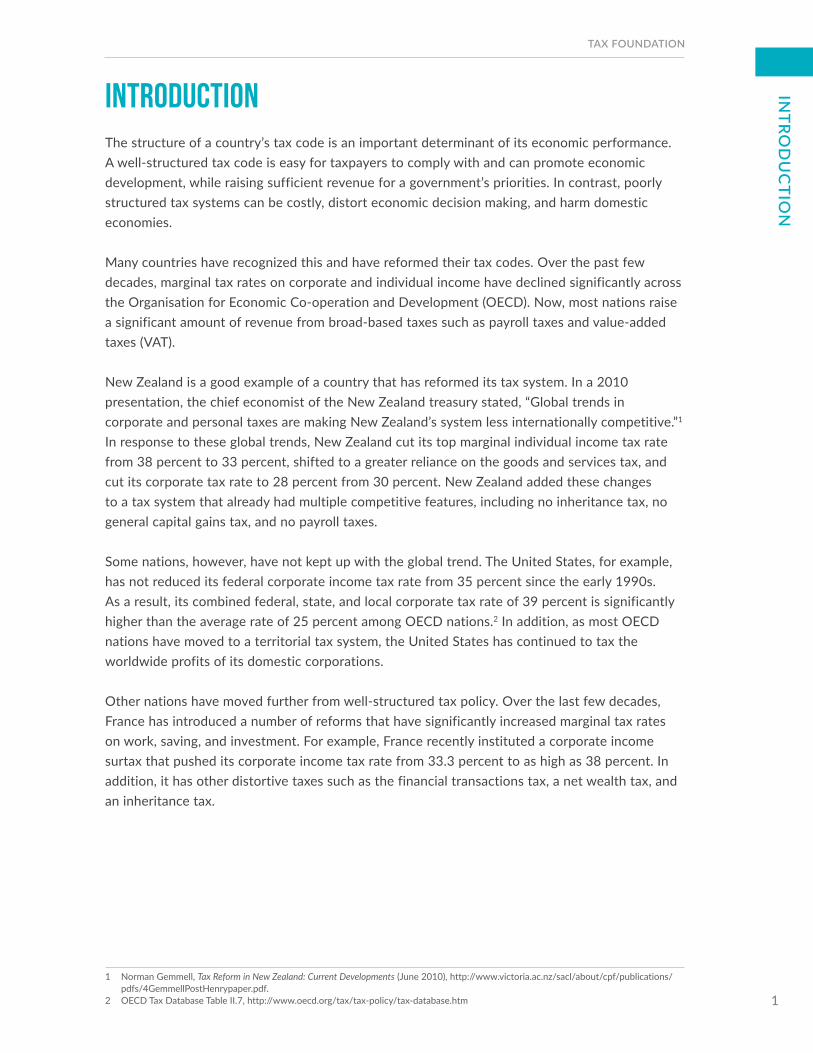
IntroductionThe structure of a country’s tax code is an important determinant of its economic performance. A well-structured tax code is easy for taxpayers to comply with and can promote economic development, while raising sufficient revenue for a government’s priorities. In contrast, poorly structured tax systems can be costly, distort economic decision making, and harm domestic economies.
Many countries have recognized this and have reformed their tax codes. Over the past few decades, marginal tax rates on corporate and individual income have declined significantly across the Organisation for Economic Co-operation and Development (OECD). Now, most nations raise a significant amount of revenue from broad-based taxes such as payroll taxes and value-added taxes (VAT).
New Zealand is a good example of a country that has reformed its tax system. In a 2010 presentation, the chief economist of the New Zealand treasury stated, “Global trends in corporate and personal taxes are making New Zealand’s system less internationally competitive.”1 In response to these global trends, New Zealand cut its top marginal individual income tax rate from 38 percent to 33 percent, shifted to a greater reliance on the goods and services tax, and cut its corporate tax rate to 28 percent from 30 percent. New Zealand added these changes to a tax system that already had multiple competitive features, including no inheritance tax, no general capital gains tax, and no payroll taxes.
Some nations, however, have not kept up with the global trend. The United States, for example, has not reduced its federal corporate income tax rate from 35 percent since the early 1990s. As a result, its combined federal, state, and local corporate tax rate of 39 percent is significantly higher than the average rate of 25 percent among OECD nations.2 In addition, as most OECD nations have moved to a territorial tax system, the United States has continued to tax the worldwide profits of its domestic corporations.
Other nations have moved further from well-structured tax policy. Over the last few decades, France has introduced a number of reforms that have significantly increased marginal tax rates on work, saving, and investment. For example, France recently instituted a corporate income surtax that pushed its corporate income tax rate from 33.3 percent to as high as 38 percent. In addition, it has other distortive taxes such as the financial transactions tax, a net wealth tax, and an inheritance tax.
1 Norman Gemmell, Tax Reform in New Zealand: Current Developments (June 2010), http://www.victoria.ac.nz/sacl/about/cpf/publications/pdfs/4GemmellPostHenrypaper.pdf.
2 OECD Tax Database Table II.7, http://www.oecd.org/tax/tax-policy/tax-database.htm
2
INTERNATIONAL TAX COMPETITIVENESS INDEX 2016IN
TRO
DU
CTI
ON The International Tax Competitiveness Index
The International Tax Competitiveness Index (ITCI) seeks to measure the extent to which a country’s tax system adheres to two important aspects of tax policy: competitiveness and neutrality.
A competitive tax code is one that keeps marginal tax rates low. In today’s globalized world, capital is highly mobile. Businesses can choose to invest in any number of countries throughout the world in order to find the highest rate of return. This means that businesses will look for countries with lower tax rates on investment in order to maximize their after-tax rate of return. If a country’s tax rate is too high, it will drive investment elsewhere, leading to slower economic growth. In addition, high marginal tax rates can drive tax avoidance.
A neutral tax code is simply one that seeks to raise the most revenue with the fewest economic distortions. This means that it doesn’t favor consumption over saving, as happens with investment taxes and wealth taxes. This also means few or no targeted tax breaks for specific activities carried out by businesses or individuals.
A tax code that is competitive and neutral promotes sustainable economic growth and investment while raising sufficient revenue for government priorities.
There are many factors unrelated to taxes which affect a country’s economic performance. Nevertheless, taxes play an important role in the health of a country’s economy.
In order to measure whether a country’s tax system is neutral and competitive, the ITCI looks at more than 40 tax policy variables. These variables measure not only the specific burden of taxes, but also how taxes are structured. The index looks at a country’s corporate taxes, individual income taxes, consumption taxes, property taxes, and the treatment of profits earned overseas. The ITCI gives a comprehensive overview of how developed countries’ tax codes compare, explains why certain tax codes stand out as good or bad models for reform, and provides important insight into how to think about tax policy.
2016 RankingsFor the third year in a row, Estonia has the best tax code in the OECD. Its top score is driven by four positive features of its tax code. First, it has a 20 percent tax rate on corporate income that is only applied to distributed profits. Second, it has a flat 20 percent tax on individual income that does not apply to personal dividend income. Third, its property tax applies only to the value of land rather than taxing the value of real property or capital. Finally, it has a territorial tax system that exempts 100 percent of the foreign profits earned by domestic corporations from domestic taxation, with few restrictions.
3
TAX FOUNDATIONIN
TROD
UC
TION
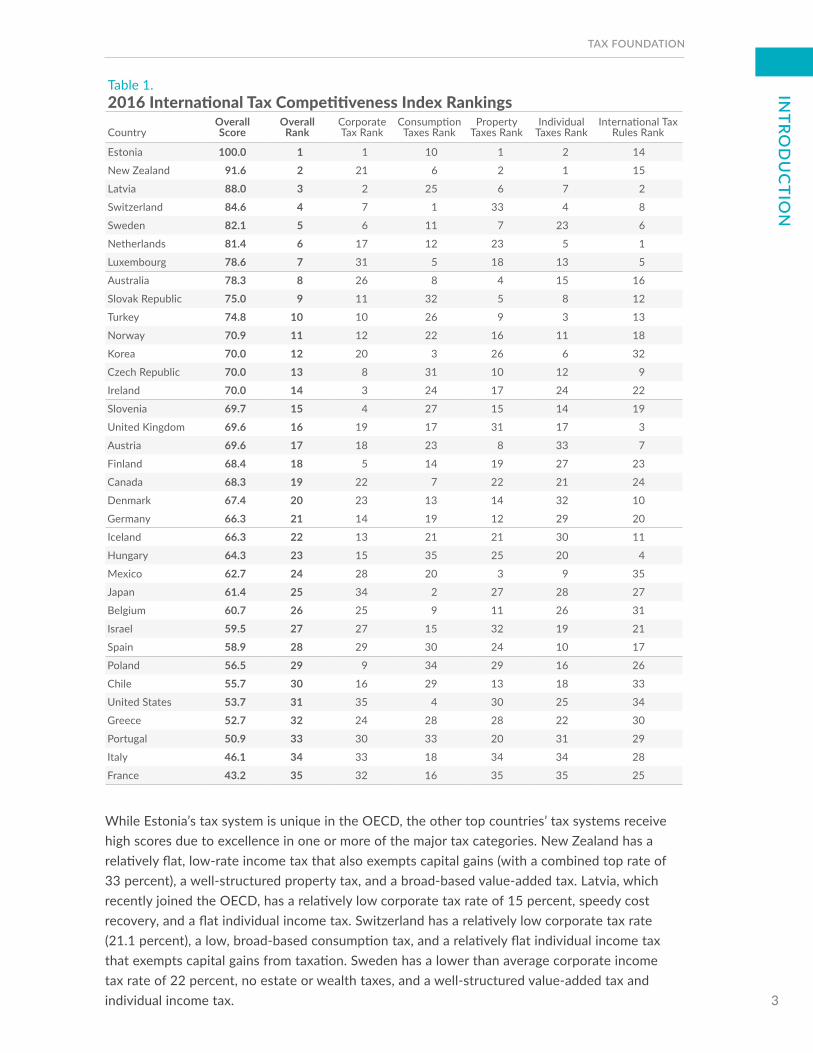
While Estonia’s tax system is unique in the OECD, the other top countries’ tax systems receive high scores due to excellence in one or more of the major tax categories. New Zealand has a relatively flat, low-rate income tax that also exempts capital gains (with a combined top rate of 33 percent), a well-structured property tax, and a broad-based value-added tax. Latvia, which recently joined the OECD, has a relatively low corporate tax rate of 15 percent, speedy cost recovery, and a flat individual income tax. Switzerland has a relatively low corporate tax rate (21.1 percent), a low, broad-based consumption tax, and a relatively flat individual income tax that exempts capital gains from taxation. Sweden has a lower than average corporate income tax rate of 22 percent, no estate or wealth taxes, and a well-structured value-added tax and individual income tax.
Table 1.2016 International Tax Competitiveness Index Rankings
CountryOverall Score
Overall Rank
Corporate Tax Rank Taxes Rank
Property Taxes Rank
Individual Taxes Rank Rules Rank
Estonia 100.0 1 1 10 1 2 14
New Zealand 91.6 2 21 6 2 1 15
Latvia 88.0 3 2 25 6 7 2
Switzerland 84.6 4 7 1 33 4 8
Sweden 82.1 5 6 11 7 23 6
Netherlands 81.4 6 17 12 23 5 1
Luxembourg 78.6 7 31 5 18 13 5
Australia 78.3 8 26 8 4 15 16
Slovak Republic 75.0 9 11 32 5 8 12
Turkey 74.8 10 10 26 9 3 13
Norway 70.9 11 12 22 16 11 18
Korea 70.0 12 20 3 26 6 32
Czech Republic 70.0 13 8 31 10 12 9
Ireland 70.0 14 3 24 17 24 22
Slovenia 69.7 15 4 27 15 14 19
United Kingdom 69.6 16 19 17 31 17 3
Austria 69.6 17 18 23 8 33 7
Finland 68.4 18 5 14 19 27 23
Canada 68.3 19 22 7 22 21 24
Denmark 67.4 20 23 13 14 32 10
Germany 66.3 21 14 19 12 29 20
Iceland 66.3 22 13 21 21 30 11
Hungary 64.3 23 15 35 25 20 4
Mexico 62.7 24 28 20 3 9 35
Japan 61.4 25 34 2 27 28 27
Belgium 60.7 26 25 9 11 26 31
Israel 59.5 27 27 15 32 19 21
Spain 58.9 28 29 30 24 10 17
Poland 56.5 29 9 34 29 16 26
Chile 55.7 30 16 29 13 18 33
United States 53.7 31 35 4 30 25 34
Greece 52.7 32 24 28 28 22 30
Portugal 50.9 33 30 33 20 31 29
Italy 46.1 34 33 18 34 34 28
France 43.2 35 32 16 35 35 25
4
INTERNATIONAL TAX COMPETITIVENESS INDEX 2016R
ECEN
T C
HA
NG
ES
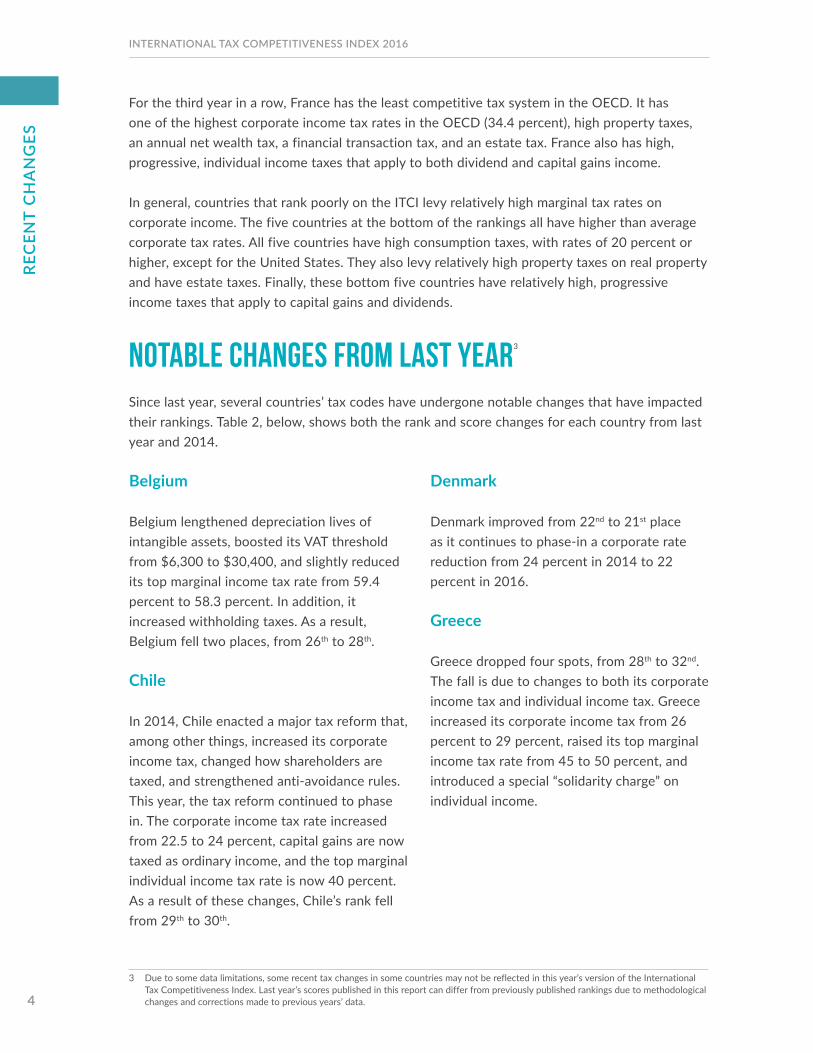
For the third year in a row, France has the least competitive tax system in the OECD. It has one of the highest corporate income tax rates in the OECD (34.4 percent), high property taxes, an annual net wealth tax, a financial transaction tax, and an estate tax. France also has high, progressive, individual income taxes that apply to both dividend and capital gains income.
In general, countries that rank poorly on the ITCI levy relatively high marginal tax rates on corporate income. The five countries at the bottom of the rankings all have higher than average corporate tax rates. All five countries have high consumption taxes, with rates of 20 percent or higher, except for the United States. They also levy relatively high property taxes on real property and have estate taxes. Finally, these bottom five countries have relatively high, progressive income taxes that apply to capital gains and dividends.
Notable Changes from Last Year3
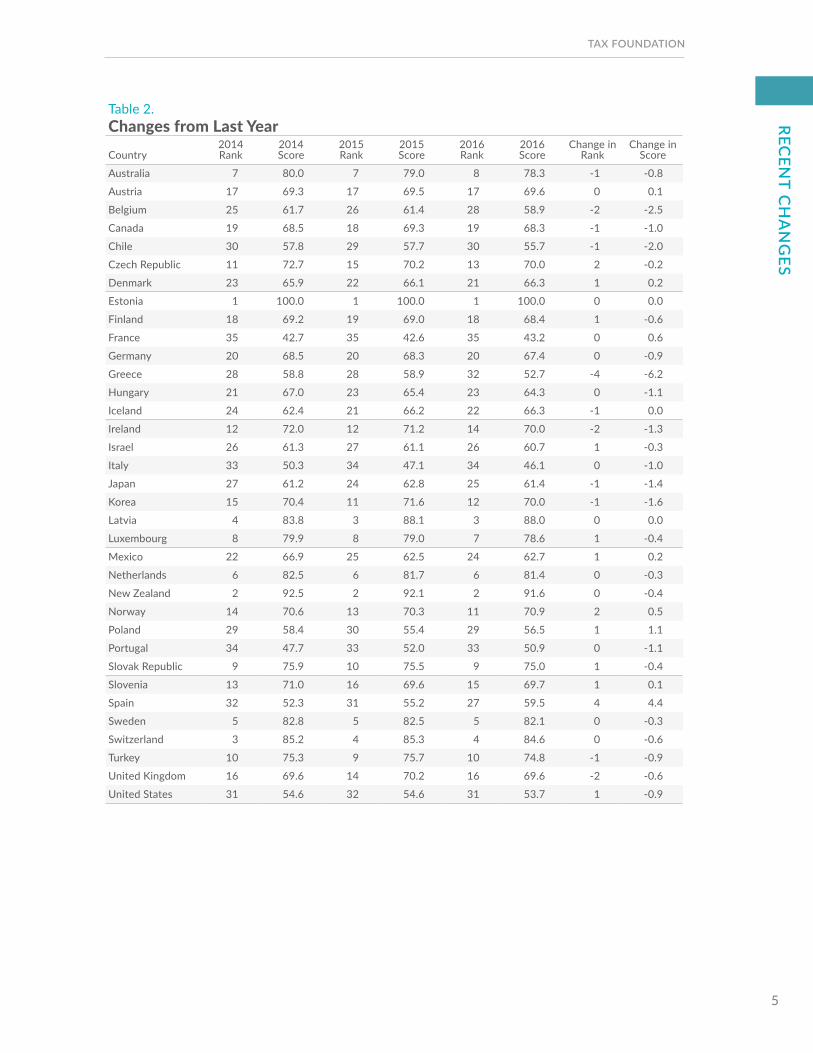
Since last year, several countries’ tax codes have undergone notable changes that have impacted their rankings. Table 2, below, shows both the rank and score changes for each country from last year and 2014.
3 Due to some data limitations, some recent tax changes in some countries may not be reflected in this year’s version of the International Tax Competitiveness Index. Last year’s scores published in this report can differ from previously published rankings due to methodological changes and corrections made to previous years’ data.
Belgium
Belgium lengthened depreciation lives of intangible assets, boosted its VAT threshold from $6,300 to $30,400, and slightly reduced its top marginal income tax rate from 59.4 percent to 58.3 percent. In addition, it increased withholding taxes. As a result, Belgium fell two places, from 26th to 28th.
Chile
In 2014, Chile enacted a major tax reform that, among other things, increased its corporate income tax, changed how shareholders are taxed, and strengthened anti-avoidance rules. This year, the tax reform continued to phase in. The corporate income tax rate increased from 22.5 to 24 percent, capital gains are now taxed as ordinary income, and the top marginal individual income tax rate is now 40 percent. As a result of these changes, Chile’s rank fell from 29th to 30th.
Denmark
Denmark improved from 22nd to 21st place as it continues to phase-in a corporate rate reduction from 24 percent in 2014 to 22 percent in 2016.
Greece
Greece dropped four spots, from 28th to 32nd. The fall is due to changes to both its corporate income tax and individual income tax. Greece increased its corporate income tax from 26 percent to 29 percent, raised its top marginal income tax rate from 45 to 50 percent, and introduced a special “solidarity charge” on individual income.
5
TAX FOUNDATIONR
ECEN
T CH
AN
GES
Table 2.Changes from Last YearCountry
2014 Rank
2014 Score
2015 Rank
2015 Score
2016 Rank
2016 Score
Change in Rank
Change in Score
Australia 7 80.0 7 79.0 8 78.3 -1 -0.8
Austria 17 69.3 17 69.5 17 69.6 0 0.1
Belgium 25 61.7 26 61.4 28 58.9 -2 -2.5
Canada 19 68.5 18 69.3 19 68.3 -1 -1.0
Chile 30 57.8 29 57.7 30 55.7 -1 -2.0
Czech Republic 11 72.7 15 70.2 13 70.0 2 -0.2
Denmark 23 65.9 22 66.1 21 66.3 1 0.2
Estonia 1 100.0 1 100.0 1 100.0 0 0.0
Finland 18 69.2 19 69.0 18 68.4 1 -0.6
France 35 42.7 35 42.6 35 43.2 0 0.6
Germany 20 68.5 20 68.3 20 67.4 0 -0.9
Greece 28 58.8 28 58.9 32 52.7 -4 -6.2
Hungary 21 67.0 23 65.4 23 64.3 0 -1.1
Iceland 24 62.4 21 66.2 22 66.3 -1 0.0
Ireland 12 72.0 12 71.2 14 70.0 -2 -1.3
Israel 26 61.3 27 61.1 26 60.7 1 -0.3
Italy 33 50.3 34 47.1 34 46.1 0 -1.0
Japan 27 61.2 24 62.8 25 61.4 -1 -1.4
Korea 15 70.4 11 71.6 12 70.0 -1 -1.6
Latvia 4 83.8 3 88.1 3 88.0 0 0.0
Luxembourg 8 79.9 8 79.0 7 78.6 1 -0.4
Mexico 22 66.9 25 62.5 24 62.7 1 0.2
Netherlands 6 82.5 6 81.7 6 81.4 0 -0.3
New Zealand 2 92.5 2 92.1 2 91.6 0 -0.4
Norway 14 70.6 13 70.3 11 70.9 2 0.5
Poland 29 58.4 30 55.4 29 56.5 1 1.1
Portugal 34 47.7 33 52.0 33 50.9 0 -1.1
Slovak Republic 9 75.9 10 75.5 9 75.0 1 -0.4
Slovenia 13 71.0 16 69.6 15 69.7 1 0.1
Spain 32 52.3 31 55.2 27 59.5 4 4.4
Sweden 5 82.8 5 82.5 5 82.1 0 -0.3
Switzerland 3 85.2 4 85.3 4 84.6 0 -0.6
Turkey 10 75.3 9 75.7 10 74.8 -1 -0.9
United Kingdom 16 69.6 14 70.2 16 69.6 -2 -0.6
United States 31 54.6 32 54.6 31 53.7 1 -0.9
6
INTERNATIONAL TAX COMPETITIVENESS INDEX 2016R
ECEN
T C
HA
NG
ES
Ireland
Ireland fell two spots, from 12th to 14th place. This move was driven by the introduction of a “patent box,” which provides a special rate of 6.25 percent to profits attributable to patents.
Israel
Israel made several changes to its tax system in the past year. Israel cut its corporate income tax rate from 26.5 percent to 25 percent. It reduced its value-added tax from 18 percent to 17 percent while slightly narrowing the base. Israel also increased its dividend tax rate from 30 percent to 32 percent and slightly increased its tax burden on wage earners from 20.5 percent to 21.5 percent. Lastly, it cut withholding taxes from 26.5 percent to 25 percent for both interest and royalty payments. On net, Israel’s rank improved from 27th to 26th place.
Japan
Japan continues to phase in a corporate rate cut. Its corporate income tax rate fell from 32.1 percent in 2015 to 29.9 percent in 2016. However, Japan fell one place, from 24th to 25th, due mainly to a narrowing of its VAT base and an increase in its top marginal income tax rate from 51 percent to 56.1 percent.
Korea
Korea fell from 11th to 12th place. Korea worsened cost recovery by limiting loss carryforwards to eight years, from 10 years. In addition, corporate tax complexity increased, as reflected in longer compliance time and an increase in the number of required payments.
Mexico
Mexico improved from 25th to 24th place. This improvement was driven primarily by improvements in its corporate compliance time (measured in hours a year), which declined from 170 hours to 122 hours. Conversely, Mexico’s top marginal income tax rate increased from 31.65 percent to 35 percent and applies narrowly to income 29 times the average national income.
Norway
Norway enacted a number of changes that impacted the taxation of capital income in 2016. Norway reduced its corporate income tax rate from 27 percent to 25 percent. In addition, it reduced its capital gains tax rate from 27 percent to 25 percent and raised its dividend tax rate from 27 percent to 28.75 percent. Norway’s rank improved from 13th to 11th place.
Spain
Spain improved four places, from 31st to 27th, due to a number of improvements to its tax code. It improved its corporate tax by reducing the rate from 30 percent to 28 percent, speeding up cost recovery for both machinery and buildings, and by reducing compliance costs. Spain also improved its individual income tax system. It reduced its capital gains and dividend tax rates from 24 percent to 23 percent, reduced its top marginal tax rate on ordinary income from 52 percent to 46 percent, and flattened the tax system by applying its top rate to income over 2.4 times the average national income, down from 11.6 times.
7
TAX FOUNDATIONC
OR
POR
ATE INC
OM
E TAX
Corporate Income TaxThe corporate income tax is a direct tax on the profits of a corporation. All OECD countries levy a tax on corporate profits, but the rates and bases vary widely from country to country. Corporate income taxes reduce the after-tax rate of return on corporate investment. This increases the cost of capital, which leads to lower levels of investment and economic output. Additionally, the corporate tax can lead to lower wages for workers, lower returns for investors, and higher prices for consumers.
Although the corporate income tax has a relatively significant impact on a country’s economy, it raises a relatively low amount of tax revenue for most governments. The ITCI breaks the corporate income tax category into three subcategories.
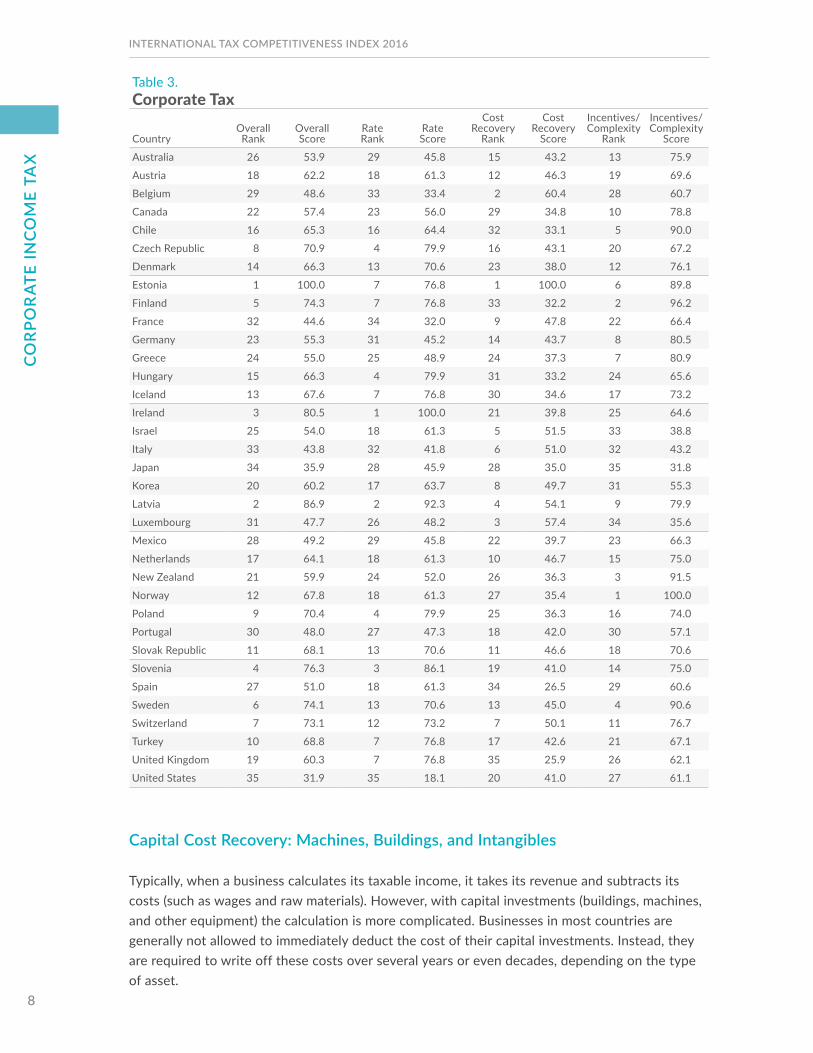
Table 3 displays the Corporate Tax category rank and score along with the ranks and scores of the subcategories.
Top Marginal Corporate Income Tax Rate
The top marginal corporate tax rate measures the rate at which each additional dollar of profit is taxed. High marginal corporate tax rates tend to discourage capital formation and slow economic growth.4 Countries with higher top marginal corporate income tax rates than the OECD average receive lower scores than those with lower, more competitive rates.
The United States has the highest top marginal corporate income tax rate at 39 percent. This is followed by France (34.4 percent), Belgium (33.9 percent), and Italy (31.3 percent). The lowest top marginal corporate income tax rate in the OECD is found in Ireland (12.5 percent). There are five other countries with rates below 20 percent: the Czech Republic (19 percent), Hungary (19 percent), Poland (19 percent), Slovenia (17 percent), and Latvia (15 percent). The OECD average top corporate income tax rate is 24.7 percent.5
Cost Recovery
To a business, income is revenue (what a business makes in sales) minus costs (the cost of doing business). The corporate income tax is meant to be a tax on this income. Thus, it is important that a tax code properly defines what constitutes taxable income. If a tax code does not allow businesses to account for all of the costs of doing business, it will inflate a business’s taxable income and thus its tax bill. This increases the cost of capital, which reduces the demand for capital, leading to slower investment and economic growth.
4 Organisation for Economic Co-operation and Development, Tax Policy Reform and Economic Growth, OECD Tax POliCy STuDiES NO. 20 (2010), http://www.oecd.org/ctp/tax-policy/46605695.pdf.
5 Organisation for Economic Co-operation and Development, OECD Tax Database, Table II.1 - Corporate income tax rates: basic/non-targeted (2000-2016) (updated May 2016), http://www.oecd.org/tax/tax-policy/tax-database.htm.
8
INTERNATIONAL TAX COMPETITIVENESS INDEX 2016C
OR
POR
ATE
INC
OM
E TA
X
Capital Cost Recovery: Machines, Buildings, and Intangibles
Typically, when a business calculates its taxable income, it takes its revenue and subtracts its costs (such as wages and raw materials). However, with capital investments (buildings, machines, and other equipment) the calculation is more complicated. Businesses in most countries are generally not allowed to immediately deduct the cost of their capital investments. Instead, they are required to write off these costs over several years or even decades, depending on the type of asset.
Table 3.Corporate Tax
CountryOverall Rank
Overall Score
Rate Rank
Rate Score
Cost Recovery
Rank
Cost Recovery
Score
Incentives/ Complexity
Rank
Incentives/ Complexity
Score
Australia 26 53.9 29 45.8 15 43.2 13 75.9
Austria 18 62.2 18 61.3 12 46.3 19 69.6
Belgium 29 48.6 33 33.4 2 60.4 28 60.7
Canada 22 57.4 23 56.0 29 34.8 10 78.8
Chile 16 65.3 16 64.4 32 33.1 5 90.0
Czech Republic 8 70.9 4 79.9 16 43.1 20 67.2
Denmark 14 66.3 13 70.6 23 38.0 12 76.1
Estonia 1 100.0 7 76.8 1 100.0 6 89.8
Finland 5 74.3 7 76.8 33 32.2 2 96.2
France 32 44.6 34 32.0 9 47.8 22 66.4
Germany 23 55.3 31 45.2 14 43.7 8 80.5
Greece 24 55.0 25 48.9 24 37.3 7 80.9
Hungary 15 66.3 4 79.9 31 33.2 24 65.6
Iceland 13 67.6 7 76.8 30 34.6 17 73.2
Ireland 3 80.5 1 100.0 21 39.8 25 64.6
Israel 25 54.0 18 61.3 5 51.5 33 38.8
Italy 33 43.8 32 41.8 6 51.0 32 43.2
Japan 34 35.9 28 45.9 28 35.0 35 31.8
Korea 20 60.2 17 63.7 8 49.7 31 55.3
Latvia 2 86.9 2 92.3 4 54.1 9 79.9
Luxembourg 31 47.7 26 48.2 3 57.4 34 35.6
Mexico 28 49.2 29 45.8 22 39.7 23 66.3
Netherlands 17 64.1 18 61.3 10 46.7 15 75.0
New Zealand 21 59.9 24 52.0 26 36.3 3 91.5
Norway 12 67.8 18 61.3 27 35.4 1 100.0
Poland 9 70.4 4 79.9 25 36.3 16 74.0
Portugal 30 48.0 27 47.3 18 42.0 30 57.1
Slovak Republic 11 68.1 13 70.6 11 46.6 18 70.6
Slovenia 4 76.3 3 86.1 19 41.0 14 75.0
Spain 27 51.0 18 61.3 34 26.5 29 60.6
Sweden 6 74.1 13 70.6 13 45.0 4 90.6
Switzerland 7 73.1 12 73.2 7 50.1 11 76.7
Turkey 10 68.8 7 76.8 17 42.6 21 67.1
United Kingdom 19 60.3 7 76.8 35 25.9 26 62.1
United States 35 31.9 35 18.1 20 41.0 27 61.1
9
TAX FOUNDATIONC
OR
POR
ATE INC
OM
E TAX
Depreciation schedules establish the amounts businesses are legally allowed to write off, as well as how long assets need to be written off. For instance, a government may require a business to deduct an equal percent of the cost of a machine over a seven-year period. By the end of the depreciation period, the business would have deducted the total initial dollar cost of the asset. However, due to the time value of money (a normal real return plus inflation), write-offs in later years are not as valuable in real terms as write-offs in earlier years. As a result, businesses effectively lose the ability to deduct the full present value of their investment cost. This treatment of capital expenses understates true business costs and overstates taxable income in present value terms.6
A country’s cost recovery score is determined by the capital allowances for three asset types: machinery, industrial buildings, and intangibles.7 Capital allowances are expressed as a percent of the present value cost that corporations can write off over the life of an asset. A 100 percent capital allowance represents a business’s ability to deduct the full cost of an investment over its life. Countries that provide faster write-offs for capital investments receive higher scores in the ITCI.
On average, across the OECD, businesses can write off 83.3 percent of the cost of machinery, 45.6 percent of the cost of industrial buildings, and 74 percent of the cost of intangibles.8 Estonia, which has a corporate tax only on distributed profits, is coded as allowing 100 percent of the present value of a capital investment to be written off, because a business’s distributed profits are determined by cash flow.
Inventories
In the same vein as capital investments, the costs of inventories are not written off in the year in which the purchases are made. Instead, the costs of inventories are deducted when the inventory is sold. As a result, it is necessary for governments to define the total cost of inventories sold. There are three methods governments allow businesses to use to calculate their inventories: Last In, First Out (LIFO); Average Cost; and First In, First Out (FIFO).
Countries that allow businesses to choose the LIFO method receive the highest score, those that allow the Average Cost method receive an average score, and countries that only allow the FIFO method receive the lowest score. Fifteen countries allow companies to use the LIFO method of accounting.9 Fourteen countries use the Average Cost method of accounting, and six countries limit companies to using the FIFO method of accounting.
6 Kyle Pomerleau, Cost Recovery across the OECD, Tax FOuNDaTiON FiSCal FaCT NO. 402 (Nov. 19, 2013), http://taxfoundation.org/article/capital-cost-recovery-across-oecd.
7 Intangible assets are typically amortized, but the write-off is similar to depreciation. 8 Oxford University Centre for Business Taxation, CBT tax database, http://www.sbs.ox.ac.uk/faculty-research/tax/publications/data. Capital
allowances are calculated assuming a fixed interest rate of 5 percent and fixed inflation rate of 2.5 percent. 9 Id.
10
INTERNATIONAL TAX COMPETITIVENESS INDEX 2016C
OR
POR
ATE
INC
OM
E TA
X
Loss Offset Rules: Carryforwards and Carrybacks
In most countries, corporations are allowed to either deduct current year losses against future profits, or deduct current year losses against past profits, receiving a tax rebate for overpayments. Loss offset rules dictate the number of years a corporation is allowed to carry forward or carry back net operating losses.
The ability for a corporation to carry forward or carry back operating losses ensures that a corporation is taxed on its average profitability over many years. This more efficiently accounts for a business’s true costs and profits, rather than taxing a given year’s profits, which are susceptible to the ups and downs of the economy. Restricting the carry forward or carry back of losses places a greater average tax burden on industries that are more susceptible to business cycles.
In 14 of the 35 OECD countries, corporations can carry forward losses indefinitely.10 Of the countries with restrictions, the average loss carryforward period is 19.4 years. Hungary and Poland have the most restrictive loss carryforward period at 2.5 years. The ITCI ranks countries higher that allow losses to be carried forward indefinitely than countries that restrict the number of years corporations are allowed to carry forward losses.
Countries are much more restrictive with loss carryback provisions than they are with carryforward provisions. Only two countries allow unlimited carrybacks of losses (Estonia and Chile). Of the nine countries that allow limited carrybacks, the average period is 1.3 years.11 The ITCI penalizes the 24 countries that do not allow any loss carrybacks at all.
Tax Incentives and Complexity
Good tax policy treats economic decisions neutrally, neither encouraging nor discouraging one activity over another. A tax incentive is a tax credit, deduction, or preferential tax rate that applies for one type of economic activity but not others. Providing tax incentives or special provisions distorts economic decisions.
For instance, when an industry receives a tax credit for producing a specific product, it may choose to overinvest in that activity, which might otherwise not be profitable. Additionally, the cost of special provisions is often offset by shifting the burden onto other taxpayers in the form of higher tax rates.
10 Deloitte, International Tax Guides and Country Highlights, https://dits.deloitte.com/#TaxGuides. These countries are coded as having carryforward periods of 100 years.
11 Some countries restrict the amount of losses that can be deducted each year. For example, Korea only allows 50 percent of losses to be carried back one year. These restrictions are coded as 0.5 times the number of allowable years. Thus, Korea is coded as 0.5.
11
TAX FOUNDATIONC
OR
POR
ATE INC
OM
E TAX
In addition, the possibility of receiving incentives invites efforts to secure these tax preferences,12 such as lobbying, which creates additional deadweight economic loss as firms focus resources on influencing the tax code in lieu of producing products. For instance, the deadweight losses in the United States attributed to tax compliance and lobbying were estimated to be between $215 billion and $987 billion in 2012. These expenditures for lobbying, along with compliance, have been shown to reduce economic growth by crowding out potential economic activity.13
The ITCI considers whether countries provide incentives such as research and development (R&D) credits and patent box provisions, which apply lower tax rates on income earned from patented technologies or procedures held within the country. Countries which provide such incentives are scored lower than those that do not.
Research and Development
In the absence of full expensing, an R&D tax credit provides a partially compensating offset for the costs of business investment. Unfortunately, R&D tax credits are rarely neutral—they usually define very specific activities that qualify—and are often complex in their implementation.
As with other incentives, R&D credits distort investment decisions and lead to the inefficient allocation of resources. Additionally, the desire to secure R&D incentives encourages lobbying activities that consume resources and detract from investment and production. In Italy, for instance, firms can engage in a negotiation process for incentives, such as easy term loans and tax credits, as long as the incentives have EU approval.14
Countries could better use the revenue spent on special tax incentives to provide a lower business tax rate across the board or to improve the treatment of capital investment.
In the OECD, 21 countries provide credits for research and development. The remaining 14 countries either do not provide any special treatment for R&D or allow businesses to expense R&D investments. Countries that provide R&D tax credits receive a lower score on the ITCI.15
Patent Boxes
As globalization has increased, countries have searched for ways to prevent corporations from reincorporating or shifting operations or profits elsewhere. One solution has been the creation of patent boxes.
12 Christopher J. Coyne & Lotta Moberg, The Political Economy of State-Provided Targeted Benefits (George Mason University, Mercatus Center Working Paper No. 14-13, May 2014), http://mercatus.org/sites/default/files/Coyne_TargetedBenefits_v2.pdf.
13 Jason J. Fichtner & Jacob Feldman, The Hidden Costs of Tax Compliance (May 20, 2013), http://mercatus.org/sites/default/files/Fichtner_TaxCompliance_v3.pdf.
14 Deloitte, International Tax Guides and Country Highlights, https://dits.deloitte.com/#TaxGuides.15 Id.
12
INTERNATIONAL TAX COMPETITIVENESS INDEX 2016C
OR
POR
ATE
INC
OM
E TA
X
Patent boxes provide corporations a lower rate on income earned from intellectual property. Intellectual property is extremely mobile. Hence, a country can use the lower tax rate of a patent box to entice corporations to hold their intellectual property within its borders. This strategy provides countries with revenue they might not otherwise receive if those companies were to move their patents elsewhere.
Instead of providing patent boxes for intellectual property, countries should recognize that all capital is mobile and lower their corporate tax rate across the board. This would encourage investment of all kinds instead of merely incentivizing corporations to locate their patents in a specific country.
Ten OECD countries—Belgium, France, Ireland, Italy, Hungary, Luxembourg, Netherlands, Portugal, Spain, and the United Kingdom—have patent box legislation, with rates and exemptions varying among countries.16 Countries with patent box regimes score lower than those without patent boxes.
Complexity
Corporate tax code complexity is quantified by measuring the tax compliance burden placed on firms. These burdens are measured by the number of payments made for the corporate income tax as well as the time needed to comply with the tax (measured in hours of compliance time per year). Tax code compliance consumes resources that could otherwise be used for investment and business operations.
Countries that require higher numbers of tax payments and larger amounts of time for tax compliance receive lower scores on the ITCI. The results are based on data from PwC’s Paying Taxes 2016 component of the Doing Business report from the World Bank.17
The nation with the highest number of required tax payments is Israel with 21. Italy follows with 13, then Switzerland with 12. Norway imposes the fewest number of payments with 3, while Mexico imposes the second fewest with 4. The average across the OECD is 8.1 payments; the U.S. requires 7 payments.
Complying with corporate income taxes takes the most time in Japan, at 155 hours, followed by 122 hours in Mexico and 110 hours in Israel. Tax compliance takes the least amount of time in Ireland, at 12 hours, followed by 15 hours in Switzerland and 19 hours in Luxembourg. The average across the OECD is 50 hours.
16 Id. See also Robert D. Atkinson & Scott Andes, Patent Boxes: Innovation in Tax Policy and Tax Policy for Innovation (Oct. 2011), http://www.itif.org/files/2011-patent-box-final.pdf.
17 PricewaterhouseCoopers & The World Bank Group, Paying Taxes 2016, http://www.pwc.com/gx/en/paying-taxes-2016/paying-taxes-2016.pdf.
13
TAX FOUNDATIONC
ON
SUM
PTION
TAX
ES
Consumption TaxesConsumption taxes are levied on individuals’ purchases of goods and services. Consumption taxes can take various forms. In the OECD and most of the world, the value-added tax (VAT) is the most common consumption tax. In order to properly define the consumption tax base, most consumption taxes either do not tax intermediate business inputs or allow a credit for taxes already paid on them. The exclusion of business inputs makes a consumption tax one of the most economically efficient means of raising tax revenue.
However, many countries fail to define their tax base correctly. Countries often exempt too many goods and services from taxation, which requires them to levy higher rates to raise sufficient revenue. Some countries also fail to properly exempt business inputs. For example, states in the United States often levy sales taxes on machinery and equipment.18
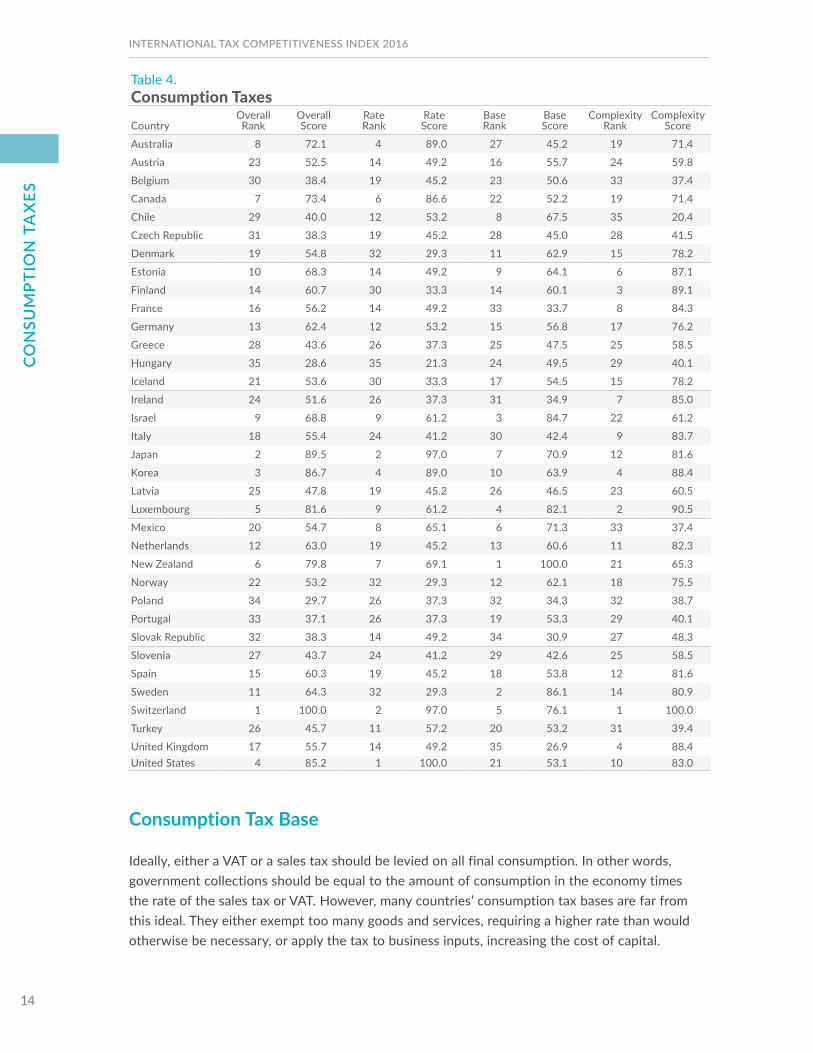
A country’s consumption tax score is broken down into three subcategories: the marginal rate, the base, and complexity. Table 4 displays the ranks and scores for the Consumption Taxes category.
Consumption Tax Rate
If levied at the same rate and properly structured, a VAT and a retail sales tax will each raise approximately the same amount of revenue. Ideally, either a VAT or a sales tax should be levied on all final consumption (although they are implemented in slightly different ways). With a sufficiently broad consumption tax base, the rate at which the tax is levied does not need to be high. A VAT or retail sales tax with a low rate and neutral structure limits economic distortions while raising sufficient revenue.
However, many countries have consumption taxes that exempt goods and services that should be taxed. This requires a country (or states, in the case of the United States) to have a higher rate than would otherwise be necessary in order to raise sufficient revenue. If not neutrally structured, high tax rates create economic distortions by discouraging the purchase of highly taxed goods and services in favor of untaxed or self-provided goods and services.
Countries with lower consumption tax rates score better than those with high tax rates. This is because lower rates do less to discourage economic activity and allow for more future consumption and investment.
The average consumption tax rate in the OECD is 19 percent. Hungary has the highest tax rate at 27 percent, while the United States has the lowest tax rate at 7.25 percent.19
18 Patrick Fleenor & Andrew Chamberlain, Tax Pyramiding: The Economic Consequences of Gross Receipts Taxes, Tax FOuNDaTiON SPECial REPORT NO. 147 (Dec. 4, 2006), http://taxfoundation.org/article/tax-pyramiding-economic-consequences-gross-receipts-taxes.
19 Scott Drenkard and Nicole Kaeding, State and Local Sales Tax Rates in 2016, Tax FOuNDaTiON FiSCal FaCT NO. 504 (Mar., 2016),http://taxfoundation.org/article/state-and-local-sales-tax-rates-2016.
14
INTERNATIONAL TAX COMPETITIVENESS INDEX 2016C
ON
SUM
PTIO
N T
AX
ES
Consumption Tax Base
Ideally, either a VAT or a sales tax should be levied on all final consumption. In other words, government collections should be equal to the amount of consumption in the economy times the rate of the sales tax or VAT. However, many countries’ consumption tax bases are far from this ideal. They either exempt too many goods and services, requiring a higher rate than would otherwise be necessary, or apply the tax to business inputs, increasing the cost of capital.
Table 4.Consumption TaxesCountry
Overall Rank
Overall Score
Rate Rank
Rate Score
Base Rank
Base Score
Complexity Rank
Complexity Score
Australia 8 72.1 4 89.0 27 45.2 19 71.4
Austria 23 52.5 14 49.2 16 55.7 24 59.8
Belgium 30 38.4 19 45.2 23 50.6 33 37.4
Canada 7 73.4 6 86.6 22 52.2 19 71.4
Chile 29 40.0 12 53.2 8 67.5 35 20.4
Czech Republic 31 38.3 19 45.2 28 45.0 28 41.5
Denmark 19 54.8 32 29.3 11 62.9 15 78.2
Estonia 10 68.3 14 49.2 9 64.1 6 87.1
Finland 14 60.7 30 33.3 14 60.1 3 89.1
France 16 56.2 14 49.2 33 33.7 8 84.3
Germany 13 62.4 12 53.2 15 56.8 17 76.2
Greece 28 43.6 26 37.3 25 47.5 25 58.5
Hungary 35 28.6 35 21.3 24 49.5 29 40.1
Iceland 21 53.6 30 33.3 17 54.5 15 78.2
Ireland 24 51.6 26 37.3 31 34.9 7 85.0
Israel 9 68.8 9 61.2 3 84.7 22 61.2
Italy 18 55.4 24 41.2 30 42.4 9 83.7
Japan 2 89.5 2 97.0 7 70.9 12 81.6
Korea 3 86.7 4 89.0 10 63.9 4 88.4
Latvia 25 47.8 19 45.2 26 46.5 23 60.5
Luxembourg 5 81.6 9 61.2 4 82.1 2 90.5
Mexico 20 54.7 8 65.1 6 71.3 33 37.4
Netherlands 12 63.0 19 45.2 13 60.6 11 82.3
New Zealand 6 79.8 7 69.1 1 100.0 21 65.3
Norway 22 53.2 32 29.3 12 62.1 18 75.5
Poland 34 29.7 26 37.3 32 34.3 32 38.7
Portugal 33 37.1 26 37.3 19 53.3 29 40.1
Slovak Republic 32 38.3 14 49.2 34 30.9 27 48.3
Slovenia 27 43.7 24 41.2 29 42.6 25 58.5
Spain 15 60.3 19 45.2 18 53.8 12 81.6
Sweden 11 64.3 32 29.3 2 86.1 14 80.9
Switzerland 1 100.0 2 97.0 5 76.1 1 100.0
Turkey 26 45.7 11 57.2 20 53.2 31 39.4
United Kingdom 17 55.7 14 49.2 35 26.9 4 88.4United States 4 85.2 1 100.0 21 53.1 10 83.0
15
TAX FOUNDATIONC
ON
SUM
PTION
TAX
ES
Consumption Tax Base as a Percent of Total Consumption
A country’s VAT or sales tax base score is measured as a ratio of the revenue collected by the VAT or sales tax compared to the potential tax revenue under a VAT or sales tax levied on all final goods and services.20
For example, if final consumption in a country is $100 and a country levies a 10 percent VAT on all goods and services, a pure base would raise $10. Revenue collection below $10 reflects either a high number of exemptions built in to the tax code or low levels of compliance (or both).21 The base is measured as a ratio of the pure base collections to the actual collections. Countries with tax base ratios near 1, signifying a pure tax base, score higher.
Under this measure, no country has a perfect VAT or sales tax base. Luxembourg has the broadest base with a ratio of 1 and Mexico has the worst with a ratio of 0.31.22 The OECD average tax base ratio is 0.55.
Deduction Limitations
When a business is calculating the VAT it owes, it is able to credit the VAT it previously paid on an input. For example, a woodworking business may purchase lumber from a mill for $110: $100 for the price plus $10 for the VAT. The woodworking business then makes a chair and sells it for $132. It charges $120 plus $12 for the VAT. Before it submits the VAT payment to the government, it deducts the $10 in VAT it paid on the lumber. Thus, it only pays $2 in VAT. Between the mill and the woodworking business, the $12 VAT on the $120 value of the chair is paid. As long as each business is able to deduct the VAT paid on its inputs, the tax base will remain neutral.
However, some countries restrict deductions for VAT paid on certain goods and services purchased by businesses. These restrictions are meant to prevent businesses from sheltering consumption by classifying it as the cost of business inputs. The most common examples are restaurant meals and cars. While these restrictions prevent some hidden consumption, purchases of restricted goods are often actually purchases of business inputs. These restrictions cause tax pyramiding, which creates uneven tax burdens across industries, distorts companies’ structures, and harms economic performance.23
Countries score higher if they do not restrict the ability of a business to deduct VAT or sales taxes paid.
Deduction limitations are found in 29 countries. The six countries that allow businesses to deduct all VAT costs are Israel, Japan, Mexico, New Zealand, Sweden, and Switzerland.
20 Organisation for Economic Cooperation and Development, Consumption Tax Trends 2014 (Dec. 10, 2014), http://www.oecd.org/tax/consumption/consumption-tax-trends-19990979.htm. This paper does not provide the measure for the United States. The U.S. measure was calculated by the author.
21 It is also possible that the number is biased by VAT/sales tax evasion. If this is caused by a very high rate, it is still appropriate that a lower base score should penalize a country.
22 Organisation for Economic Co-operation and Development, Consumption Tax Trends 2014, op. cit. 23 Patrick Fleenor & Andrew Chamberlain, Tax Pyramiding: The Economic Consequences of Gross Receipts Taxes, op. cit.
16
INTERNATIONAL TAX COMPETITIVENESS INDEX 2016C
ON
SUM
PTIO
N T
AX
ES
Although the United States does not have a VAT, its sales tax suffers from an issue similar to that caused by deduction limitations. A few U.S. states apply retail sales taxes to business inputs,24 which also creates tax pyramiding.
The VAT/Sales Tax Threshold
Most OECD countries set thresholds for their VATs/sales taxes. This means that a business’s sales of taxable items must reach a certain value before it is required to register and pay a VAT or sales tax on its products. Although it may be the case that exempting very small businesses saves time and money in compliance, unnecessarily large thresholds create a distortion by favoring smaller businesses over larger ones.25
Countries receive better scores for lower thresholds. The United Kingdom receives the worst threshold score with a VAT threshold of $118,841. Six countries receive the best scores for having no general VAT/sales tax threshold (Chile, Mexico, Spain, Sweden, Turkey, and the United States). The average threshold across the OECD is approximately $39,521.
Complexity
Although consumption taxes are generally more neutral than other taxes, they can be complex in their implementation. Complex VATs and sales taxes create significant compliance costs for businesses that need to remit payment to the government. This adds to the total cost of paying taxes by reallocating resources from productive activities to complying with tax laws. The complexity of a country’s consumption tax is measured by the number of hours a business uses to comply with the tax, as measured by PwC’s Paying Taxes 2016 component of the Doing Business report from the World Bank.26
Countries receive higher scores if compliance with their consumption taxes takes fewer hours. Chile receives the worst score with a 125-hour compliance time. Switzerland receives the best score by requiring only 8 hours a year to comply with its consumption tax. The average number of compliance hours across the OECD is 55.7 hours.
24 This is also the case for some Canadian provinces. See Duanjie Chen & Jack Mintz, 2013 Annual Global Tax Competitiveness Ranking: Corporate Tax Policy at a Crossroads (Nov. 2013), http://www.policyschool.ucalgary.ca/sites/default/files/research/mintz-2013-globtax.pdf.
25 Organisation for Economic Co-operation and Development, Consumption Tax Trends 2014, op. cit. 26 PricewaterhouseCoopers & The World Bank Group, Paying Taxes 2016, op. cit.
17
TAX FOUNDATIONIN
DIV
IDU
AL TA
XES
Individual TaxesIndividual taxes are one of the most prevalent means of raising revenue to fund government. Individual income taxes are levied on an individual’s income (wages and, often, capital gains and dividends) in order to fund general government operations. These taxes are typically progressive, meaning that the rate at which an individual’s income is taxed increases as the individual earns more income.
In addition, countries have payroll taxes. These typically flat-rate taxes are levied on wage income in addition to a country’s general individual income tax. However, revenue from these taxes is typically allocated specifically toward social insurance programs such as unemployment insurance, government pension programs, and health insurance.27
Individual taxes have the benefit of being some of the more transparent taxes. Taxpayers are made aware of their total amount of taxes paid at some point in the process, unlike consumption taxes, which are collected and remitted by a business.
However, most individual taxes have the effect of discouraging work, due to a highly progressive structure, and discouraging saving and investment by applying to capital gains and dividend income, which causes double taxation of corporate income.28
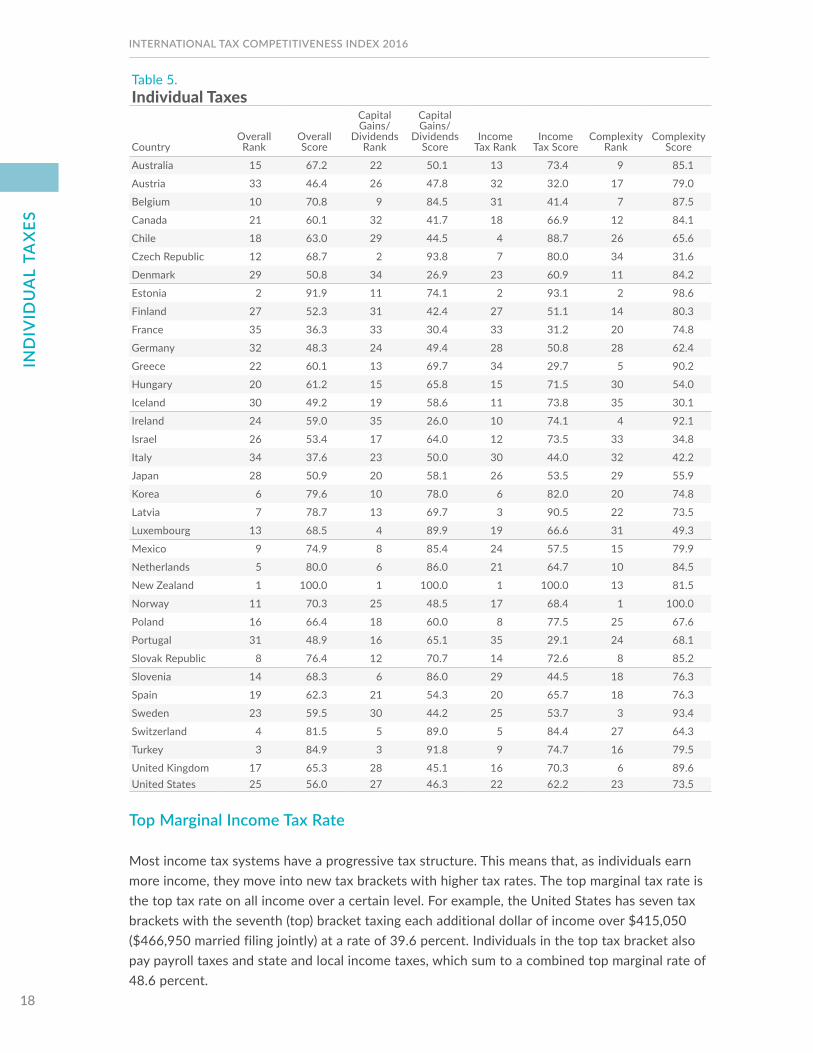
A country’s score for its individual income tax is determined by three subcategories: the rate and progressivity of wage taxation, the extent to which the income tax double taxes corporate income, and complexity. Table 5 shows the ranks and scores for the entire Individual Taxes category as well as the rank and score for each subcategory.
Taxes on Ordinary Income
Individual income taxes are a tax levied on the income of individuals. Many countries, such as the United States, rely on individual income taxes as a significant source of revenue. They are used to raise revenue for both general government operations and for specific programs, such as social insurance and government-provided health insurance.
A country’s taxes on ordinary income are measured according to three variables: the top rate at which ordinary income is taxed, the progressivity of the income tax system, and the total tax burden on an average laborer.
27 Kyle Pomerleau and Kevin Adams, A Comparison of the Tax Burden on Labor in the OECD, Tax FOuNDaTiON FiSCal FaCT NO. 522 (Aug. 09, 2016), http://taxfoundation.org/article/comparison-tax-burden-labor-oecd-2016.
28 Kyle Pomerleau, High Burden of Capital Gains Tax Rates, Tax FOuNDaTiON FiSCal FaCT NO. 460 (Mar. 24, 2015), http://taxfoundation.org/article/high-burden-state-and-federal-capital-gains-tax-rates.
18
INTERNATIONAL TAX COMPETITIVENESS INDEX 2016IN
DIV
IDU
AL
TAX
ES
Top Marginal Income Tax Rate
Most income tax systems have a progressive tax structure. This means that, as individuals earn more income, they move into new tax brackets with higher tax rates. The top marginal tax rate is the top tax rate on all income over a certain level. For example, the United States has seven tax brackets with the seventh (top) bracket taxing each additional dollar of income over $415,050 ($466,950 married filing jointly) at a rate of 39.6 percent. Individuals in the top tax bracket also pay payroll taxes and state and local income taxes, which sum to a combined top marginal rate of 48.6 percent.
Table 5.Individual Taxes
CountryOverall Rank
Overall Score
Capital Gains/
Dividends Rank
Capital Gains/
Dividends Score
Income Tax Rank
Income Tax Score
Complexity Rank
Complexity Score
Australia 15 67.2 22 50.1 13 73.4 9 85.1
Austria 33 46.4 26 47.8 32 32.0 17 79.0
Belgium 10 70.8 9 84.5 31 41.4 7 87.5
Canada 21 60.1 32 41.7 18 66.9 12 84.1
Chile 18 63.0 29 44.5 4 88.7 26 65.6
Czech Republic 12 68.7 2 93.8 7 80.0 34 31.6
Denmark 29 50.8 34 26.9 23 60.9 11 84.2
Estonia 2 91.9 11 74.1 2 93.1 2 98.6
Finland 27 52.3 31 42.4 27 51.1 14 80.3
France 35 36.3 33 30.4 33 31.2 20 74.8
Germany 32 48.3 24 49.4 28 50.8 28 62.4
Greece 22 60.1 13 69.7 34 29.7 5 90.2
Hungary 20 61.2 15 65.8 15 71.5 30 54.0
Iceland 30 49.2 19 58.6 11 73.8 35 30.1
Ireland 24 59.0 35 26.0 10 74.1 4 92.1
Israel 26 53.4 17 64.0 12 73.5 33 34.8
Italy 34 37.6 23 50.0 30 44.0 32 42.2
Japan 28 50.9 20 58.1 26 53.5 29 55.9
Korea 6 79.6 10 78.0 6 82.0 20 74.8
Latvia 7 78.7 13 69.7 3 90.5 22 73.5
Luxembourg 13 68.5 4 89.9 19 66.6 31 49.3
Mexico 9 74.9 8 85.4 24 57.5 15 79.9
Netherlands 5 80.0 6 86.0 21 64.7 10 84.5
New Zealand 1 100.0 1 100.0 1 100.0 13 81.5
Norway 11 70.3 25 48.5 17 68.4 1 100.0
Poland 16 66.4 18 60.0 8 77.5 25 67.6
Portugal 31 48.9 16 65.1 35 29.1 24 68.1
Slovak Republic 8 76.4 12 70.7 14 72.6 8 85.2
Slovenia 14 68.3 6 86.0 29 44.5 18 76.3
Spain 19 62.3 21 54.3 20 65.7 18 76.3
Sweden 23 59.5 30 44.2 25 53.7 3 93.4
Switzerland 4 81.5 5 89.0 5 84.4 27 64.3
Turkey 3 84.9 3 91.8 9 74.7 16 79.5
United Kingdom 17 65.3 28 45.1 16 70.3 6 89.6United States 25 56.0 27 46.3 22 62.2 23 73.5
19
TAX FOUNDATIONIN
DIV
IDU
AL TA
XES
Individuals consider the marginal tax rate when deciding whether to work an additional hour. High top marginal tax rates make additional work more expensive, which lowers the relative cost of not working. This makes it more likely that an individual will choose leisure over work. When high tax rates increase the cost of labor, this has the effect of decreasing hours worked, which decreases the amount of production in the economy.
Countries with high marginal income tax rates receive a lower score on the ITCI than countries with low marginal tax rates. Portugal has the highest top combined marginal income tax rate at nearly 61.3 percent.29 Estonia has the lowest, at 21.3 percent.
Income Level at Which Top Rate Applies
The level at which the top marginal rate begins to apply is also important. If a country has a top rate of 20 percent, but almost everyone pays that rate because it applies to any income over $10,000, that country essentially has a flat income tax. In contrast, a tax system that has a top rate that applies to all income over $1 million requires a much higher marginal tax rate to raise the same amount of revenue, because it targets a small number of people that earn a high level of income.
Countries with top rates that apply at lower levels score better on the ITCI. The ITCI bases its measure on the income level at which the top rate begins as compared to the country’s average income.30 According to this measure, Mexico applies its tax at the highest level of income (the top marginal income tax rate applies at 28.4 times the average Mexican income), whereas Hungary and Latvia apply their top rate on the first dollar, with a flat tax of 34.5 percent and 23 percent respectively.
Tax Burden on Labor
The total tax burden faced by a worker in a country or the total tax cost of labor for the average worker in a country is called the tax wedge. The tax wedge includes income taxes and payroll taxes (both the employee-side and employer-side).
A high tax burden on labor increases the cost of labor relative to leisure. This discourages work and increases the cost to hire labor. Fewer hours worked damages economic growth and leads to lower levels of total output.
The ITCI gives countries with high tax wedges a low score due to the higher labor costs associated with high tax burdens on workers. Workers in Belgium face the highest tax burden at 55.3 percent, while workers in Chile face the lowest tax burden at 7 percent. The average across the OECD is 36 percent.
29 Organisation for Economic Co-operation and Development, OECD Tax Database, Table I.7 - Top statutory personal income tax rate and top marginal tax rates for employees, 2000-2014 (updated Apr. 2015), http://www.oecd.org/tax/tax-policy/tax-database.htm. This measures the total tax burden on the next dollar of income earned by an individual who is earning enough to be taxed at the top marginal rate. These rates include the impact of sub-central income taxes, social insurance taxes, and any phaseout of benefits.
30 Id.
20
INTERNATIONAL TAX COMPETITIVENESS INDEX 2016IN
DIV
IDU
AL
TAX
ES
Capital Gains and Dividends Taxes
In addition to wage income, many countries’ individual income tax systems tax investment income. They do this by levying taxes on income from capital gains and dividends.
A capital gain occurs when an individual purchases an asset (usually corporate stock) in one period and sells it in another for a profit. A dividend is a payment made to an individual from after-tax corporate profits.
Capital gains and personal dividend taxes are a form of double taxation of corporate profits that contribute to the tax burden on capital. When a corporation makes a profit, it must pay the corporate income tax. It can then generally do one of two things. The corporation can retain the after-tax profits, which boost the value of the business and thus its stock price. Stockholders then sell the stock and realize a capital gain, which requires them to pay tax on that income. Alternatively, the corporation can distribute the after-tax profits to shareholders in the form of dividends. Stockholders who receive dividends then pay tax on that income.
Dividends taxes and capital gains taxes create a bias against saving and investment, reduce capital formation, and slow economic growth.31
In the ITCI, a country receives a higher score for lower capital gains and dividends taxes.
Capital Gains Tax Rate
Countries generally tax capital gains at a lower rate than ordinary income, provided that specific requirements are met. For example, the United States taxes capital gains at a reduced rate if the taxpayer holds the asset for at least one year before selling it (these are called long-term capital gains). The ITCI gives countries with higher capital gains rates a lower score than those with lower rates.
Some countries use additional provisions to help mitigate the double taxation of income due to the capital gains tax. For instance, the United Kingdom provides an annual exemption of £11,100 ($14,406 USD), and Canada excludes half of all capital gains income from taxation.32
The average top marginal capital gains tax rate (given that requirements are met) is 18.8 percent across the OECD. Denmark has the highest top marginal capital gains tax rate at 42 percent. Nine countries exempt capital gains from taxation.
31 Kyle Pomerleau, The Tax Burden on Personal Dividend Income across the OECD, 2015, Tax FOuNDaTiON FiSCal FaCT NO. 471 (June 25, 2015), http://taxfoundation.org/article/united-states-high-tax-burden-personal-dividend-income.
32 Deloitte, International Tax Guides and Country Highlights, https://dits.deloitte.com/#TaxGuides.
21
TAX FOUNDATIONIN
DIV
IDU
AL TA
XES
Inflation Indexing
Indexing capital gains for inflation ensures that investors are only taxed on the real return on their investment, as opposed to any returns due simply to inflation.33 Countries that index capital gains taxes for inflation receive a higher score. Twelve countries allow taxpayers to adjust the basis of their taxable capital gains for inflation: Belgium, Czech Republic, Israel, Korea, Luxembourg, Mexico, Netherlands, New Zealand, Portugal, Slovenia, Switzerland, and Turkey.
Dividend Tax Rates
Dividend taxes can adversely impact capital formation in a country. High dividend tax rates increase the cost of capital, which deters investment and slows economic growth.
Countries’ rates are expressed as the total top marginal personal dividend tax rate after any imputation or credit system.
Countries with lower overall dividend tax rates score higher on the ITCI due to the dividend tax rate’s effect on the cost of investment (i.e., the cost of capital) and the more neutral treatment between saving and consumption. Ireland has the highest dividend tax rate in the OECD at 51 percent.34 Both Estonia and the Slovak Republic have a dividend tax rate of 0 percent.
Complexity
On top of the direct costs of paying income taxes, there are indirect costs associated with complying with the tax code. These compliance costs are directly related to the complexity of the tax code. The more complex an individual income tax code, the more time and money it requires for individuals and businesses to comply with it.
Complexity is measured as the number of hours it takes a business to comply with wage tax laws in each country. This measure is from the PwC and World Bank Doing Business report.35 The Czech Republic receives the lowest score with a compliance time of 217 hours. Luxembourg receives the best score with a compliance time of 14 hours.
33 Kyle Pomerleau & John Aldridge, Inflation Can Cause an Infinite Effective Tax Rate on Capital Gains, Tax FOuNDaTiON FiSCal FaCT NO. 406 (Dec. 17, 2013), http://taxfoundation.org/article/inflation-can-cause-infinite-effective-tax-rate-capital-gains.
34 Organisation for Economic Co-operation and Development, OECD Tax Database, Table II.4 - Overall Statutory Tax Rates on Dividend Income, 2000-2016 (updated May 2016), http://www.oecd.org/tax/tax-policy/tax-database.htm.
35 PricewaterhouseCoopers & The World Bank Group, Paying Taxes 2016, op. cit.
22
INTERNATIONAL TAX COMPETITIVENESS INDEX 2016IN
TER
NAT
ION
AL
TAX
SYS
TEM
International Tax SystemIn an increasingly globalized economy, businesses often expand beyond the borders of their home countries to reach customers around the world. As a result, countries need to define rules determining how, or if, income earned in foreign countries is taxed. International tax rules deal with the systems and regulations that countries apply to those business activities.
The United States has a worldwide tax system. This means that a U.S. corporation operating in a foreign country must still pay taxes to the United States up to the rate of 35 percent on foreign earned income.
There has been a growing trend of moving from worldwide taxation toward a system of territorial taxation, in which a country’s corporate tax is limited to profits earned within its borders. In a territorial tax system, corporations only pay taxes to the country in which they earn income. Since the 1990s, the number of OECD countries with worldwide tax systems has fallen from 20 to 6.36
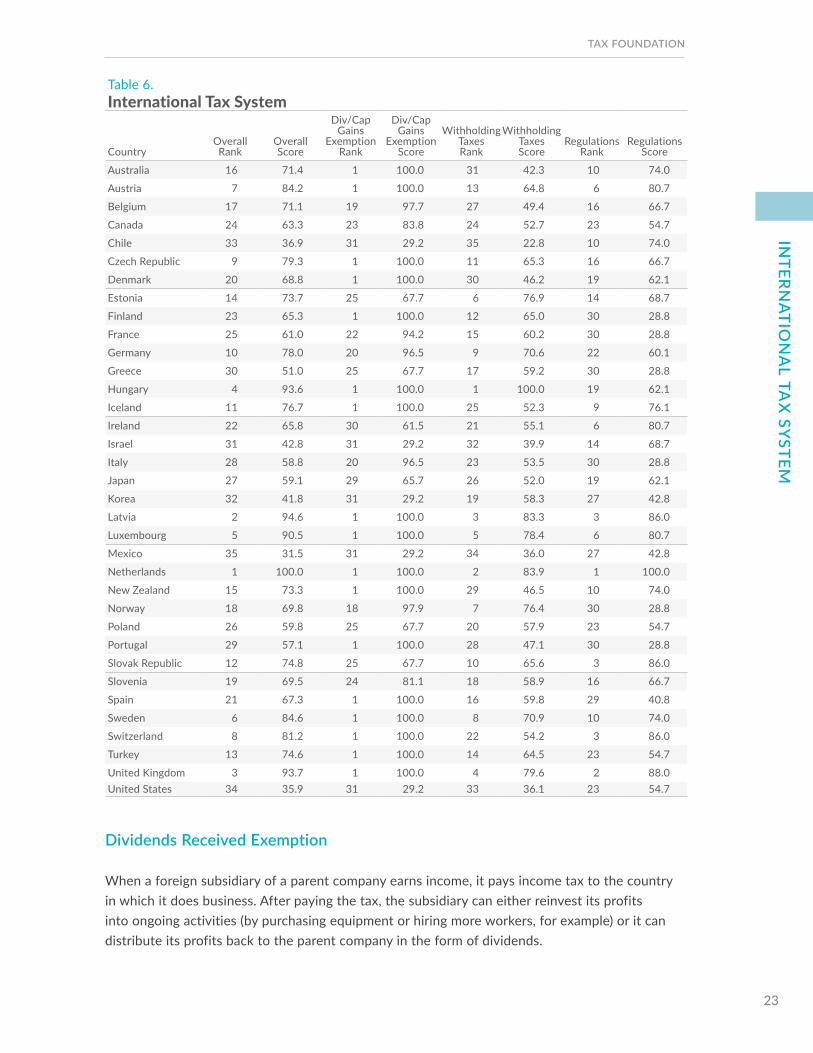
Table 6 displays the overall rank and score for the International Rules category as well as the ranks and scores for the subcategories.
Territoriality
Under a territorial tax system, international businesses pay taxes to the countries in which they earn their income. This means that territorial tax regimes do not tax the income companies earn in foreign countries. A worldwide tax system—such as the system employed by the United States—requires companies to pay taxes on every dollar of worldwide income, no matter where it is earned.
Companies based in countries with worldwide tax systems are at a competitive disadvantage, because they face potentially higher levels of taxation than their competitors based in countries with territorial tax systems. Additionally, taxes on repatriated corporate income in a company’s home country increase complexity and discourage investment and production.37
The territoriality of a tax system is measured by the degree to which a country exempts foreign earned income through dividend and capital gain exemptions.
36 PricewaterhouseCoopers, Evolution of Territorial Tax Systems in the OECD (Apr. 2, 2013), http://www.techceocouncil.org/clientuploads/reports/Report%20on%20Territorial%20Tax%20Systems_20130402b.pdf.
37 William McBride, Twelve Steps toward a Simpler, Pro-Growth Tax Code, Tax FOuNDaTiON FiSCal FaCT NO. 400 (Oct. 30, 2013), http://taxfoundation.org/article/twelve-steps-toward-simpler-pro-growth-tax-code.
23
TAX FOUNDATIONIN
TERN
ATION
AL TA
X SYSTEM
Dividends Received Exemption
When a foreign subsidiary of a parent company earns income, it pays income tax to the country in which it does business. After paying the tax, the subsidiary can either reinvest its profits into ongoing activities (by purchasing equipment or hiring more workers, for example) or it can distribute its profits back to the parent company in the form of dividends.
Table 6.International Tax System
CountryOverall Rank
Overall Score
Div/Cap Gains
Exemption Rank
Div/Cap Gains
Exemption Score
Withholding Taxes Rank
Withholding Taxes Score
Regulations Rank
Regulations Score
Australia 16 71.4 1 100.0 31 42.3 10 74.0
Austria 7 84.2 1 100.0 13 64.8 6 80.7
Belgium 17 71.1 19 97.7 27 49.4 16 66.7
Canada 24 63.3 23 83.8 24 52.7 23 54.7
Chile 33 36.9 31 29.2 35 22.8 10 74.0
Czech Republic 9 79.3 1 100.0 11 65.3 16 66.7
Denmark 20 68.8 1 100.0 30 46.2 19 62.1
Estonia 14 73.7 25 67.7 6 76.9 14 68.7
Finland 23 65.3 1 100.0 12 65.0 30 28.8
France 25 61.0 22 94.2 15 60.2 30 28.8
Germany 10 78.0 20 96.5 9 70.6 22 60.1
Greece 30 51.0 25 67.7 17 59.2 30 28.8
Hungary 4 93.6 1 100.0 1 100.0 19 62.1
Iceland 11 76.7 1 100.0 25 52.3 9 76.1
Ireland 22 65.8 30 61.5 21 55.1 6 80.7
Israel 31 42.8 31 29.2 32 39.9 14 68.7
Italy 28 58.8 20 96.5 23 53.5 30 28.8
Japan 27 59.1 29 65.7 26 52.0 19 62.1
Korea 32 41.8 31 29.2 19 58.3 27 42.8
Latvia 2 94.6 1 100.0 3 83.3 3 86.0
Luxembourg 5 90.5 1 100.0 5 78.4 6 80.7
Mexico 35 31.5 31 29.2 34 36.0 27 42.8
Netherlands 1 100.0 1 100.0 2 83.9 1 100.0
New Zealand 15 73.3 1 100.0 29 46.5 10 74.0
Norway 18 69.8 18 97.9 7 76.4 30 28.8
Poland 26 59.8 25 67.7 20 57.9 23 54.7
Portugal 29 57.1 1 100.0 28 47.1 30 28.8
Slovak Republic 12 74.8 25 67.7 10 65.6 3 86.0
Slovenia 19 69.5 24 81.1 18 58.9 16 66.7
Spain 21 67.3 1 100.0 16 59.8 29 40.8
Sweden 6 84.6 1 100.0 8 70.9 10 74.0
Switzerland 8 81.2 1 100.0 22 54.2 3 86.0
Turkey 13 74.6 1 100.0 14 64.5 23 54.7
United Kingdom 3 93.7 1 100.0 4 79.6 2 88.0United States 34 35.9 31 29.2 33 36.1 23 54.7
24
INTERNATIONAL TAX COMPETITIVENESS INDEX 2016IN
TER
NAT
ION
AL
TAX
SYS
TEM
Under a worldwide tax system, the dividends received by a parent company are taxed again by the parent company’s home country, minus a tax credit for taxes already paid on that income. Under a pure territorial system, those dividends are exempt from taxation in the parent’s country.
Countries receive a score based on the level of dividend exemption they provide. Countries with no dividend exemption (worldwide tax systems) receive the lowest score.
Twenty-two OECD countries exempt all dividends received by parent companies from taxation.38 Seven countries allow 95 percent or 97 percent of dividends to be exempt from taxation. Six OECD countries have a worldwide tax system that generally does not exempt foreign dividends from taxation.
Branch or Subsidiary Capital Gains Exclusion
Another feature of an international tax system is its treatment of capital gains from foreign investments. When a parent company invests in a foreign subsidiary (i.e., purchases shares in a foreign subsidiary), it can realize a capital gain on that investment if it later divests the asset. A territorial tax system would exempt these gains from taxation, due to the fact that they are derived from overseas activity.
Taxing foreign-sourced capital gains income at domestic rates results in double taxation and discourages saving and investment.
Countries that exempt foreign-sourced capital gains from taxation receive a higher score on the ITCI. Foreign-sourced capital gains are excluded from taxation by 18 OECD countries. Seven countries partially exclude foreign-sourced capital gains. Eleven countries do not exclude foreign-sourced capital gains income from domestic taxation.39
Withholding Taxes and Tax Treaties
When firms pay dividends, interest, and royalties to foreign investors or businesses, governments often require those firms to withhold a certain portion to pay as a tax. For example, the United States requires businesses to withhold a maximum 30 percent tax on payments to foreign individuals.
These taxes make investment more costly both for investors, who will receive a lower return on dividends, and for firms, that must pay a higher amount in interest or royalty payments to compensate for the cost of the withholding taxes. These taxes also reduce funds available for investment and production and increase the cost of capital.
38 Deloitte, International Tax Guides and Country Highlights, https://dits.deloitte.com/#TaxGuides. See also PricewaterhouseCoopers, Evolution of Territorial Tax Systems in the OECD (Apr. 2, 2013), op. cit.
39 Deloitte, International Tax Guides and Country Highlights, op. cit. See also PricewaterhouseCoopers, Evolution of Territorial Tax Systems in the OECD (Apr. 2, 2013), op. cit.
25
TAX FOUNDATIONIN
DIV
IDU
AL TA
XES
Withholding Tax Rates
Countries with higher withholding tax rates on dividends, interest, and royalties score lower in the ITCI. Dividends, interest, and royalties rarely face the same tax rate within a nation. Chile and Switzerland levy the highest dividend and interest withholding rates, requiring firms to withhold 35 percent of a dividend or interest payment paid to foreign entities or persons. Meanwhile, Estonia, Hungary, and Latvia do not levy withholding taxes on dividends or interest payments.
For royalties, Mexico requires firms to retain the highest amount, at 40 percent, followed by France, at 33.3 percent, and Chile, at 30 percent. Hungary, Latvia, Luxembourg, Netherlands, Norway, Sweden, and Switzerland do not require companies to retain any amount of royalties for withholding tax purposes.40
Treaty Network
Tax treaties align many tax laws between two countries, particularly with regard to withholding taxes, and attempt to reduce double taxation. Countries with a greater number of partners in their tax treaty network have more attractive tax regimes for foreign investment and receive a higher score than countries with fewer treaties.
The United Kingdom has the broadest network of tax treaties (127 countries) and so receives the highest score. Chile receives the lowest score, with a treaty network of only 25 countries. Across the OECD, the average size of a tax treaty network is 75 countries.41
International Tax Regulations
International tax regulations seek to prevent corporations from minimizing their tax liability through aggressive tax planning. These regulations can take several forms, such as rules for controlled foreign corporations (CFC) and thin capitalization rules.
International tax regulations often have the effect of making countries with uncompetitive tax structures even less competitive. These regulations place substantial burdens on companies and require them to shift valuable resources away from production and toward accountants and tax lawyers.
40 Deloitte, International Tax Guides and Country Highlights, op. cit. 41 Id.
26
INTERNATIONAL TAX COMPETITIVENESS INDEX 2016IN
TER
NAT
ION
AL
TAX
SYS
TEM
Controlled Foreign Corporation Rules
CFC rules are intended to prevent corporations from shifting their pre-tax profits from a high tax country to a low tax country by using highly liquid forms of income. These regulations define what a controlled foreign corporation is for tax purposes. If a foreign entity is deemed “controlled,” these regulations subject the foreign corporation’s passive income (rent, royalties, interest) and sometimes active income to the tax rate of the home country of the subsidiary’s parent corporation. In the U.S., these are called Subpart F rules. These rules subject all passive income to taxation in the year in which it is earned.42
CFC rules vary widely among countries. The definition of what constitutes “control” is a somewhat arbitrary decision that often increases tax code complexity. For instance, the United States considers a subsidiary with 50 percent U.S. ownership to be controlled and subject to U.S. tax rates, while Australia considers a foreign company that is 50 percent owned by five or fewer Australian residents, or 40 percent owned by one Australian resident, to be controlled.
Countries without CFC regulations are given the highest score. Countries with CFC regulations that only apply to passive income receive an average score, and countries with CFC regulations that apply to a subsidiary’s active and passive income are given the lowest score. CFC rules exist in 25 of the 35 OECD countries.43 Thirteen of the 25 countries’ CFC rules capture both active and passive income, while 12 only apply to passive income. Ten countries do not have CFC rules.
Restrictions on Eligible Countries
An ideal territorial system would only concern itself with the profits earned within its borders. However, many countries have restrictions on their territorial systems that determine when a business’s dividends received from overseas subsidiaries are exempt from tax.
Some countries treat foreign corporate income differently depending on the country in which the foreign income was earned. For example, many countries restrict their territorial systems based on the OECD “black list” of countries. The OECD deems these countries as having “harmful tax practices,” such as low or no taxes, a lack of transparency characterized by “inadequate regulatory supervision or financial disclosure,” and a lack of information exchange with OECD governments.44 For some countries, income earned in restricted countries by domestic corporations is not exempt from domestic taxation.
The eligibility rules create additional complexity for companies and are often established in an arbitrary manner. Portugal, for instance, limits exemptions for dividends and capital gains earned abroad to those earned in countries that have an income tax equal to at least 60 percent of its corporate tax rate. Italy, which normally allows a 95 percent tax exemption for foreign-sourced dividends paid to Italian shareholders, does not allow the exemption if the income was earned in a subsidiary located in a blacklisted country.45
42 U.S.-held corporations are able to defer taxes on active, or reinvested, income until that income is repatriated to the United States. 43 Deloitte, International Tax Guides and Country Highlights, op. cit. 44 Organisation for Economic Co-operation and Development, Towards Global Tax Co-operation (2000), http://www.oecd.org/tax/
harmful/2090192.pdf. 45 Deloitte, International Tax Guides and Country Highlights, op. cit.
27
TAX FOUNDATIONIN
TERN
ATION
AL TA
X SYSTEM
In the OECD, 21 of 35 countries place restrictions on whether they exempt foreign-sourced income from domestic taxation based on the source of the income. Countries that have these restrictions on their territorial tax system receive a lower score on the ITCI.46
Interest Deduction Limitations
Many countries limit the amount of interest a multinational corporation, or one of its subsidiaries, can deduct for tax purposes. Low-tax countries create an incentive for companies to equity finance their investments, while high-tax countries create an incentive for companies to finance investments with debt and use interest deductions to reduce their tax liabilities. As a result, some countries limit the amount companies can deduct in interest.
Interest deduction limitations can vary widely among countries, and there is much discretion available to governments in enforcing these laws.47 Some countries limit interest deductions by applying transfer pricing regulations to interest rates. Others apply what are called “thin capitalization rules,” which limit the amount of deductible interest by capping the amount of debt a firm is allowed to bear based on a company’s ratio of debt to assets. More recently, countries have started applying hard caps on the amount of interest countries can deduct in general.
Interest deduction rules such as thin capitalization rules, in particular, have been shown to reduce the value of firms and distort firm decisions about how to invest in capital.48
Countries that limit interest deductions with only transfer pricing regulations receive the highest score. Countries with thin capitalization receive an average score, and countries with hard caps on interest deductibility receive the lowest score. Interest deduction limitations are found in 27 of the 35 countries measured in the ITCI. For instance, Denmark limits interest deductions if a firm’s debt-to-equity ratio reaches 4 to 1, while Japan limits deductions at a 3 to 1 ratio.49 Germany, Portugal, Spain, and Greece limit interest deductions (regardless of whether they are for cross-border loans) to 30 percent of operating income. Countries such as Iceland, Estonia, and Ireland have no established limitations on interest deductions and rely on transfer pricing rules.
46 PricewaterhouseCoopers, Evolution of Territorial Tax Systems in the OECD (Apr. 2, 2013), op. cit. 47 Jennifer Blouin, Harry Huizinga, Luc Laeven, & Gaëtan Nicodème, Thin Capitalization Rules and Multinational Firm Capital Structure
(International Monetary Fund, Working Paper WP/14/12, Jan. 2014), https://www.imf.org/external/pubs/ft/wp/2014/wp1412.pdf. 48 Id. This paper finds a 10 percent rise results in a 2 percent rise in debt-to-assets ratio. 49 Japan has a complex clause that sets the limit at 3 to 1 unless a firm can point to comparable Japanese firms with higher debt-to-equity
ratios, at which point Japan will allow the firm to reach the higher ratio before limiting deductions.
28
INTERNATIONAL TAX COMPETITIVENESS INDEX 2016PR
OPE
RTY
TA
XES
Property TaxesProperty taxes are government levies on the assets of an individual or business. The methods and intervals of collection vary widely among the types of property taxes. Estate and inheritance taxes, for example, are due upon the death of an individual and the passing of his or her estate to an heir. Taxes on real property, on the other hand, are paid at set intervals—often annually—on the value of taxable property such as land and houses.
Many property taxes are highly distortive and add significant complexity to the life of a taxpayer or business. Estate and inheritance taxes create heavy disincentives against additional work and saving, which damages productivity and output. Financial transaction taxes increase the cost of capital, which limits the flow of investment to its most efficient allocation. Taxes on wealth limit the capital available in the economy, which damages long-term economic growth and innovation.
Sound tax policy minimizes economic distortions. With the exception of taxes on land, most property taxes increase economic distortions and have long-term negative effects on an economy and its productivity.
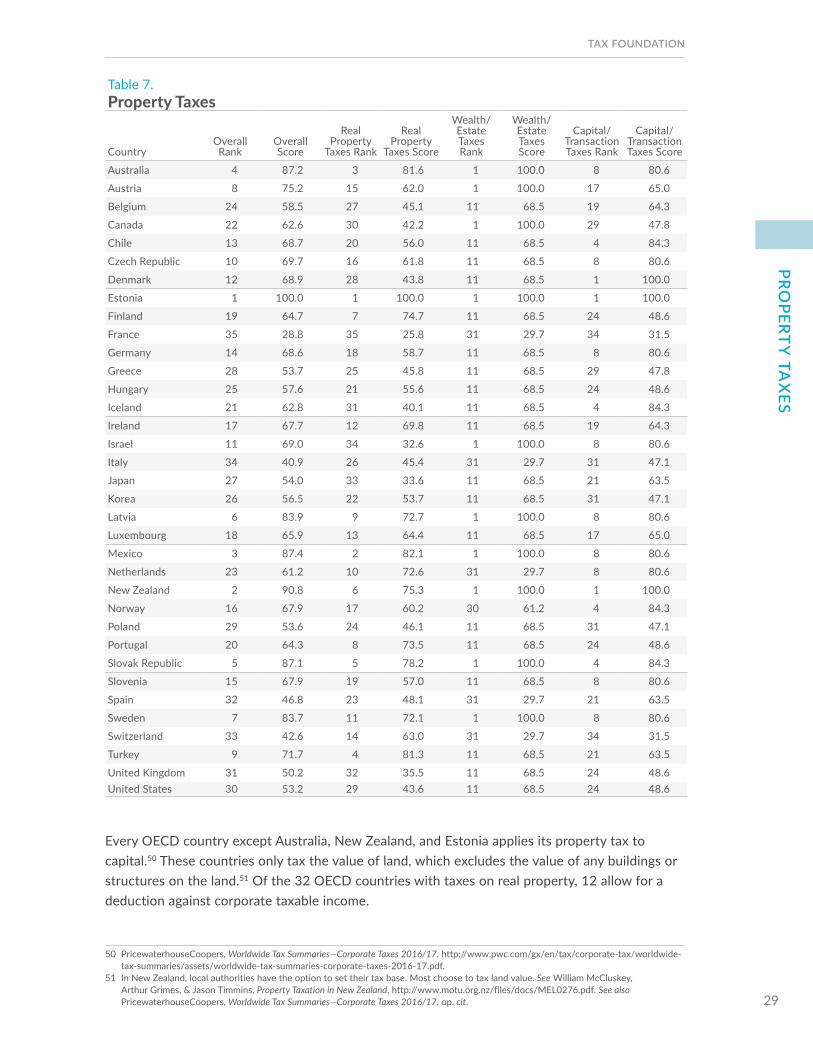
Table 7 shows the ranks and scores for the Property Taxes category and each of its subcategories.
Real Property Taxes
Real property taxes are levied on a recurrent basis on taxable property, such as real estate or business capital. For example, in most states or municipalities in the United States, businesses and individuals pay a property tax based on the value of their real property.
Structure of Property Taxes
Although taxes on real property are generally an efficient way to raise revenue, some property taxes can become direct taxes on capital. This occurs when a tax applies to more than just the value of the land itself, such as the buildings or structures on the land. This increases the cost of capital, discourages the formation of capital (such as the building of new structures), and can negatively impact business location decisions.
Countries that tax the value of capital as well as land receive the lowest score on the ITCI. Some countries mitigate this treatment with a deduction for property taxes paid against corporate taxable income. These countries receive a slightly better score. Countries receive the best possible score if they have either no property tax or only have a tax on land.
29
TAX FOUNDATIONPRO
PERTY TA
XES
Table 7.Property Taxes
CountryOverall Rank
Overall Score
Real Property
Taxes Rank
Real Property
Taxes Score
Wealth/ Estate Taxes Rank
Wealth/ Estate Taxes Score
Capital/ Transaction Taxes Rank
Capital/ Transaction Taxes Score
Australia 4 87.2 3 81.6 1 100.0 8 80.6
Austria 8 75.2 15 62.0 1 100.0 17 65.0
Belgium 24 58.5 27 45.1 11 68.5 19 64.3
Canada 22 62.6 30 42.2 1 100.0 29 47.8
Chile 13 68.7 20 56.0 11 68.5 4 84.3
Czech Republic 10 69.7 16 61.8 11 68.5 8 80.6
Denmark 12 68.9 28 43.8 11 68.5 1 100.0
Estonia 1 100.0 1 100.0 1 100.0 1 100.0
Finland 19 64.7 7 74.7 11 68.5 24 48.6
France 35 28.8 35 25.8 31 29.7 34 31.5
Germany 14 68.6 18 58.7 11 68.5 8 80.6
Greece 28 53.7 25 45.8 11 68.5 29 47.8
Hungary 25 57.6 21 55.6 11 68.5 24 48.6
Iceland 21 62.8 31 40.1 11 68.5 4 84.3
Ireland 17 67.7 12 69.8 11 68.5 19 64.3
Israel 11 69.0 34 32.6 1 100.0 8 80.6
Italy 34 40.9 26 45.4 31 29.7 31 47.1
Japan 27 54.0 33 33.6 11 68.5 21 63.5
Korea 26 56.5 22 53.7 11 68.5 31 47.1
Latvia 6 83.9 9 72.7 1 100.0 8 80.6
Luxembourg 18 65.9 13 64.4 11 68.5 17 65.0
Mexico 3 87.4 2 82.1 1 100.0 8 80.6
Netherlands 23 61.2 10 72.6 31 29.7 8 80.6
New Zealand 2 90.8 6 75.3 1 100.0 1 100.0
Norway 16 67.9 17 60.2 30 61.2 4 84.3
Poland 29 53.6 24 46.1 11 68.5 31 47.1
Portugal 20 64.3 8 73.5 11 68.5 24 48.6
Slovak Republic 5 87.1 5 78.2 1 100.0 4 84.3
Slovenia 15 67.9 19 57.0 11 68.5 8 80.6
Spain 32 46.8 23 48.1 31 29.7 21 63.5
Sweden 7 83.7 11 72.1 1 100.0 8 80.6
Switzerland 33 42.6 14 63.0 31 29.7 34 31.5
Turkey 9 71.7 4 81.3 11 68.5 21 63.5
United Kingdom 31 50.2 32 35.5 11 68.5 24 48.6United States 30 53.2 29 43.6 11 68.5 24 48.6
Every OECD country except Australia, New Zealand, and Estonia applies its property tax to capital.50 These countries only tax the value of land, which excludes the value of any buildings or structures on the land.51 Of the 32 OECD countries with taxes on real property, 12 allow for a deduction against corporate taxable income.
50 PricewaterhouseCoopers, Worldwide Tax Summaries—Corporate Taxes 2016/17, http://www.pwc.com/gx/en/tax/corporate-tax/worldwide-tax-summaries/assets/worldwide-tax-summaries-corporate-taxes-2016-17.pdf.
51 In New Zealand, local authorities have the option to set their tax base. Most choose to tax land value. See William McCluskey, Arthur Grimes, & Jason Timmins, Property Taxation in New Zealand, http://www.motu.org.nz/files/docs/MEL0276.pdf. See also PricewaterhouseCoopers, Worldwide Tax Summaries—Corporate Taxes 2016/17, op. cit.
30
INTERNATIONAL TAX COMPETITIVENESS INDEX 2016PR
OPE
RTY
TA
XES
Real Property Tax Collections
Property tax collections measure the burden of property taxes as a percent of a country’s gross domestic product. Higher tax burdens, specifically when on capital, tend to slow investment, which damages productivity and economic growth.
Countries with a high level of collection place a larger tax burden on taxpayers and receive a lower score on the ITCI. The United Kingdom relies on property taxes most heavily at 3.2 percent of GDP, with Canada and the United States both closely behind at 2.8 and 2.7 percent of GDP respectively. Luxembourg has the lowest real property tax burden at 0.07 percent of GDP.52
Wealth and Estate Taxes
Many countries also levy property taxes on an individual’s wealth. These taxes can take the form of estate or inheritance taxes that are levied either upon an individual’s estate at death or upon the assets transferred from the decedent’s estate to the heirs. These taxes can also take the form of a recurring tax on an individual’s net wealth. The effect of the estate tax is to limit resources available for investment or production and to reduce the incentive to save and invest.53 This reduction in investment adversely affects economic growth. Moreover, these taxes, the estate and inheritance tax especially, can be avoided with certain planning techniques, which makes the tax an inefficient and unnecessarily complex source of revenue.
Estate, Inheritance, and Gift Taxes
Estate taxes are levied on the value of an individual’s taxable estate at the time of death and are paid by the estate itself, while inheritance taxes are levied on the value of assets transferred to an individual’s heirs upon death and are paid by the heirs (not the estate of the deceased individual). Gift taxes are taxes on the transfer of property (cash, stocks, and other property) that are typically used to prevent individuals from circumventing estate and inheritance taxes by gifting away their assets before death. Rates, exemption levels, and rules vary substantially among countries. For example, the United States levies a top rate of 40 percent on estates but has an exemption level of $5.45 million. Belgium, on the other hand, has an inheritance tax with an exemption of €15,000 ($16,857 USD) and a variety of top rates depending on who receives assets from the estate, what the assets are, and in which region they reside.54
Estate, inheritance, and gift taxes create significant compliance costs for taxpayers while raising insignificant amounts of revenue. According to OECD data, estate taxes across the OECD raised an average of 0.1 percent of GDP in tax revenue, with the highest amount raised being only 0.6 percent of GDP in Belgium, despite Belgium’s top estate tax rate of up to 80 percent in some cases.55
52 Organisation for Economic Co-operation and Development, OECD.StatExtracts, Revenue Statistics – OECD Member Countries, http://stats.oecd.org/.
53 William McBride, Twelve Steps toward a Simpler, Pro-Growth Tax Code, Tax FOuNDaTiON FiSCal FaCT NO. 400 (Oct. 30, 2013), op. cit. 54 Ernst & Young, International Estate and Inheritance Tax Guide 2016, http://www.ey.com/Publication/vwLUAssets/ey-worldwide-estate-and-
inheritance-tax-guide-june-2016/$FILE/ey-worldwide-estate-and-inheritance-tax-guide-june-2016.pdf.55 Organisation for Economic Co-operation and Development, OECD.StatExtracts, Revenue Statistics – OECD Member Countries, http://stats.
oecd.org/.

31
TAX FOUNDATIONPRO
PERTY TA
XES
Countries without these taxes score better than countries that have them. Eleven countries in the OECD have no estate or inheritance taxes: Australia, Austria, Canada, Estonia, Israel, Latvia, Mexico, New Zealand, Norway, Slovak Republic, and Sweden. All others levy an estate or inheritance tax.
Net Wealth Taxes
In addition to estate and inheritance taxes, some countries levy net wealth taxes. Net wealth taxes are often low-rate, progressive taxes on an individual’s or family’s net assets or the net assets of a corporation. Unlike estate taxes, net wealth taxes are levied on an annual basis.
Six countries levy net wealth taxes on individuals. Italy levies three different wealth taxes based on the type and location of the asset. Spain taxes residents at progressive rates from 0.2 percent to 2.5 percent on worldwide net wealth. Other countries with net wealth taxes include France, Norway, and Switzerland (at the canton level).56
Capital, Wealth, and Property Taxes on Businesses
Countries have a number of taxes they levy on the assets and fixed capital of businesses. These include taxes on the transfer of real property, taxes on the net assets of businesses, taxes on raising capital, and taxes on financial transactions. These taxes contribute directly to the cost of capital for businesses and reduce the after-tax rate of return on investment.
Property Transfer Taxes
Property transfer taxes are taxes on the transfer of real property (real estate, land improvements, machinery) from one person or firm to another. A common example in the United States is the real estate transfer tax, which is commonly levied at the state level on the value of homes that are purchased by individuals.57 Property transfer taxes represent a direct tax on capital and increase the cost of purchasing property.
Countries receive a lower score if they have property transfer taxes. Seven OECD countries do not have property transfer taxes, including Chile, Estonia, and New Zealand.
Corporate Asset Taxes
Similar to a net wealth tax, asset taxes are levied on the wealth, or assets, of a business. For instance, Luxembourg levies a 0.5 percent tax on the worldwide net wealth of Luxembourg-based companies every year.58 Similarly, cantons in Switzerland levy taxes that vary from 0.001 percent to 0.5 percent of the net assets of corporations. Other countries levy these taxes exclusively on bank assets. 56 Deloitte, International Tax Guides and Country Highlights, op. cit. 57 National Conference of State Legislatures, Real Estate Transfer Taxes, http://www.ncsl.org/research/fiscal-policy/real-estate-transfer-taxes.
aspx. 58 It levies this tax on non-Luxembourg companies as well, but only on wealth held within Luxembourg. See Government of the Grand Duchy
of Luxembourg, Net Wealth Tax, http://www.guichet.public.lu/entreprises/en/fiscalite/impots-benefices/impots-divers/impot-fortune/index.html.
32
INTERNATIONAL TAX COMPETITIVENESS INDEX 2016PR
OPE
RTY
TA
XES
Fifteen countries have some type of corporate wealth or asset tax. Luxembourg, France, and Switzerland have net wealth taxes on corporations. Five countries have bank taxes of some type.
Capital Duties
Capital duties are taxes on the issuance of shares of stock. Typically, countries either levy these taxes at very low rates or require a small, flat fee. For example, Switzerland requires resident companies to pay a 1 percent tax on the issuance of shares of stock. These types of taxes increase the cost of capital, limit funds available for investment, and make it more difficult to form businesses.59
Countries with capital duties score lower than countries without them. Ten countries in the OECD levy some type of capital duty.
Financial Transaction Taxes
A financial transaction tax is a levy on the sale or transfer of a financial asset. Financial transaction taxes take different forms in different countries. Finland levies a tax of 1.6 percent on stock transactions. On the other hand, Portugal levies a stamp duty on the deeds and documents associated with financial transactions.
Financial transaction taxes impose an additional layer of taxation on the purchase or sale of stocks. Markets run on efficiency and capital needs to flow quickly to its most economically productive use. A financial transaction tax impedes this process.
The ITCI ranks countries with financial transaction taxes lower than the countries without them. Twelve countries in the OECD have financial transaction taxes, including the United Kingdom, Portugal, France, and Hungary, while 24 countries do not impose financial transaction taxes.
59 Council Directive 2008/7/EC, Concerning Indirect Taxes on the Raising of Capital, 2008 O.J. (L 46) 11, http://eur-lex.europa.eu/legal-content/EN/ALL/?uri=CELEX:32008L0007.

33
TAX FOUNDATION
34
INTERNATIONAL TAX COMPETITIVENESS INDEX 2016A
PPEN
DIX
Appendix
Methodology
The ITCI is a relative ranking of the competitiveness and neutrality of the tax code in each of the 35 OECD countries. It utilizes more than 40 variables across five categories: corporate income tax, consumption taxes, property taxes, individual taxes, and international tax rules. Each category has multiple subcategories, and each subcategory holds a number of the 40 variables. For example, the consumption tax category contains three subcategories: rate, base, and complexity. The consumption tax base subcategory then has three variables: consumption tax as a percentage of total consumption, deduction limitations, and VAT threshold.
The ITCI is designed to measure a country’s tax code on a relative basis rather than on an absolute measurement. This means that a score of 100 does not signify the absolute best possible tax code but the best tax code among the 35 OECD countries. Each country’s score on the ITCI represents its relative difference from the best country’s score.
The Calculation of the Variable, Subcategory, and Category Scores
First, the standard deviation and average of each variable is calculated. The standard deviation measures the average difference of a country’s tax variables from the mean among all 35 countries.60 For example, the average corporate income tax rate across the 35 OECD countries is about 24.7 percent, with a standard deviation of 5.6 percentage points. This means that on average, an OECD country’s corporate tax rate is 5.6 percentage points off from the mean rate of 25 percent.
In order to compare each variable, it is necessary to standardize them, because each variable has a different mean and standard deviation. To standardize the variables, each observation is given a normalized score. This sets every variable’s mean to 0 with a standard deviation of 1. Each country’s score for each variable is a measure of its difference from the mean across all countries for that variable. A score of 0 means a country’s score is equal to the average, a score of -1 means it is one standard deviation below average, and a score of 1 is one standard deviation above average.
The score for the corporate tax rate demonstrates this process. Of the 35 OECD countries, the average corporate income tax rate is 24.7 percent, and the standard deviation is 5.6 percentage points. The United States’ corporate tax rate normalized score is -2.52,61 or 2.52 standard deviations less competitive than the average OECD country. In contrast, Ireland’s tax rate of 12.5 percent is 2.20 standard deviations more competitive than the average OECD country.
60 To calculate the standard deviation we find the mean of a data set (corporate tax rates, for example) and the difference of each country’s tax rate from the mean tax rate among the 35 countries. We then take each country’s difference from the mean and find the average difference for the group.
61 The true normal score is 2.52. The score is a negative value to reflect the fact that being higher than the OECD average is less ideal.
35
TAX FOUNDATIONA
PPEND
IX
The next step is to combine variable scores in order to calculate subcategory scores. Within subcategories, each individual variable’s score is equally weighted and added together. For instance, the subcategory of cost recovery includes six variables: loss carryback, loss carryforward, the present discounted value of depreciation schedules for machines, industrial buildings, and intangibles, and inventory accounting method. The scores for each of these six variables are multiplied by 1/6, or 16.6 percent, to give them equal weight, and then added together. The result is the cost recovery subcategory score.
From here, each category’s score is constructed by combining the scores of each contained subcategory. This is computed by multiplying each subcategory by a weight (all weights are equal) and adding the results together. For example, the score for the corporate rate category is calculated by multiplying the scores of the rate, cost recovery, incentives/complexity subcategories by 33.3 percent and adding them together. This is done for all five categories.
The overall normalized score for each country is calculated by taking each category’s normalized score, multiplying each by 20 percent (equal weight for the five categories), and adding them together.
Calculating the Final Score
From here, two transformations occur on the category scores and the overall score. First, in order to eliminate any negative values, the inverse of the lowest z-score plus one in each category is added to each country’s z-score. For example, the United States has the lowest z-score for the corporate income tax rate (-2.52). Thus, 2.52 plus 1 (3.52) is added to each country’s z-score. This sets the lowest score in each category to 1.
Second, the adjusted overall and category scores for each country are scaled to 100, relative to the country with the highest scores overall and in each category. This is done by taking each country’s adjusted z-score and dividing it by the highest adjusted z-score in each category. For example, Estonia, which has the highest overall adjusted z-score of 2.288, receives a final overall score of 100. The United States, which has an overall adjusted z-score of 1.21, receives a final overall score of 52.8.
Methodological Changes
A change was made to how we scored interest deduction limitations in the international tax regulations category. The change better reflects many countries’ movement towards new “interest-stripping” regulations that significantly limit the amount of interest companies can deduct annually. This has the impact of reducing the scores of countries that have adopted this policy over the last three years. This change is reflected in all years’ scores.
36
INTERNATIONAL TAX COMPETITIVENESS INDEX 2016A
PPEN
DIX
Data Sources
The ITCI includes data from numerous sources, including:
• PricewaterhouseCoopers Worldwide Tax Summaries • Ernst & Young International Tax Guide• Deloitte International Tax Source• The Organisation for Economic Co-operation and Development• The Oxford University Said School of Business Corporate Tax Database• The Tax Foundation
The ITCI uses the most up-to-date data available as of July 2016. See footnotes for specific data citations. Data may not reflect changes in countries making rapid reforms.

37
TAX FOUNDATIOND
ATA TA
BLES
Table A. Corporate Taxes
Country
Corporate Rate Cost Recovery
Top Marginal Corporate Tax Rate
Loss Carryback (Number of Years)
Loss Carryforward (Number of Years) Machinery
Industrial Buildings Intangibles
Inventory (Best
Available)Australia 30.0% 0 No Limit 85.1% 47.9% 54.8% Average CostAustria 25.0% 0 No limit, limited to
75% of taxable income81.3% 39.1% 73.8% LIFO
Belgium 34.0% 0 No Limit 88.2% 62.2% 80.3% LIFOCanada 26.7% 3 20 96.5% 24.2% 51.9% Average CostChile 24.0% No Limit No Limit 63.3% 33.8% 0.0% Average CostCzech Republic 19.0% 0 5 87.4% 54.3% 84.1% Average CostDenmark 22.0% 0 No Limit, limited to
60% of taxable income82.7% 47.9% 81.3% FIFO
Estonia 20.0% No Limit No Limit 100.0% 100.0% 100.0% N/AFinland 20.0% 0 10 82.7% 51.9% 73.8% FIFOFrance 34.4% 1 50 85.8% 54.8% 87.0% Average CostGermany 30.2% 1, limited to 50%
of taxable incomeNo Limit, limited to
60% of taxable income73.8% 39.1% 87.0% LIFO
Greece 29.0% 0 5 73.8% 47.9% 73.8% LIFOHungary 19.0% 0 5, limited to 50%
of taxable income81.6% 27.9% 87.0% Average Cost
Iceland 20.0% 0 10 86.0% 47.8% 81.2% FIFOIreland 12.5% 1 No Limit 78.7% 47.9% 54.8% Average CostIsrael 25.0% 0 No Limit 87.0% 54.8% 78.7% Average CostItaly 31.3% 0 No Limit, limited to
80% of taxable income76.0% 46.3% 96.5% LIFO
Japan 30.0% 0 9, limited to 80% of taxable income
77.0% 27.9% 78.7% LIFO
Korea 24.2% 1, limited to 50% of taxable income
8 92.2% 54.8% 73.8% LIFO
Latvia 15.0% 0 No Limit 90.5% 61.4% 73.8% Average CostLuxembourg 29.2% 0 No Limit 87.1% 47.9% 87.0% LIFOMexico 30.0% 0 10 73.8% 54.8% 73.8% LIFONetherlands 25.0% 1 9 96.5% 33.8% 73.8% LIFONew Zealand 28.0% 0 No Limit 73.2% 30.7% 73.8% Average CostNorway 25.0% 2 No Limit 78.2% 37.4% 73.8% FIFOPoland 19.0% 0 5, limited to 50%
of total loss per year73.8% 33.8% 87.0% LIFO
Portugal 29.5% 0 12, limited to 70% of taxable income
88.8% 54.8% 73.8% Average Cost
Slovak Republic 22.0% 0 4 87.4% 65.3% 87.0% Average CostSlovenia 17.0% 0 No limit, limited to
50% of taxable income87.0% 39.1% 73.8% Average Cost
Spain 25.0% 0 No Limit, limited to 60% of taxable income
77.9% 39.1% 27.9% Average Cost
Sweden 22.0% 0 No Limit 86.0% 47.9% 86.0% FIFOSwitzerland 21.2% 0 7 86.0% 55.5% 90.5% LIFOTurkey 20.0% 0 5 87.6% 47.9% 63.2% LIFOUnited Kingdom 20.0% 1 No Limit 75.9% 0.0% 82.7% FIFOUnited States 38.9% 2 20 87.7% 35.0% 63.3% LIFO
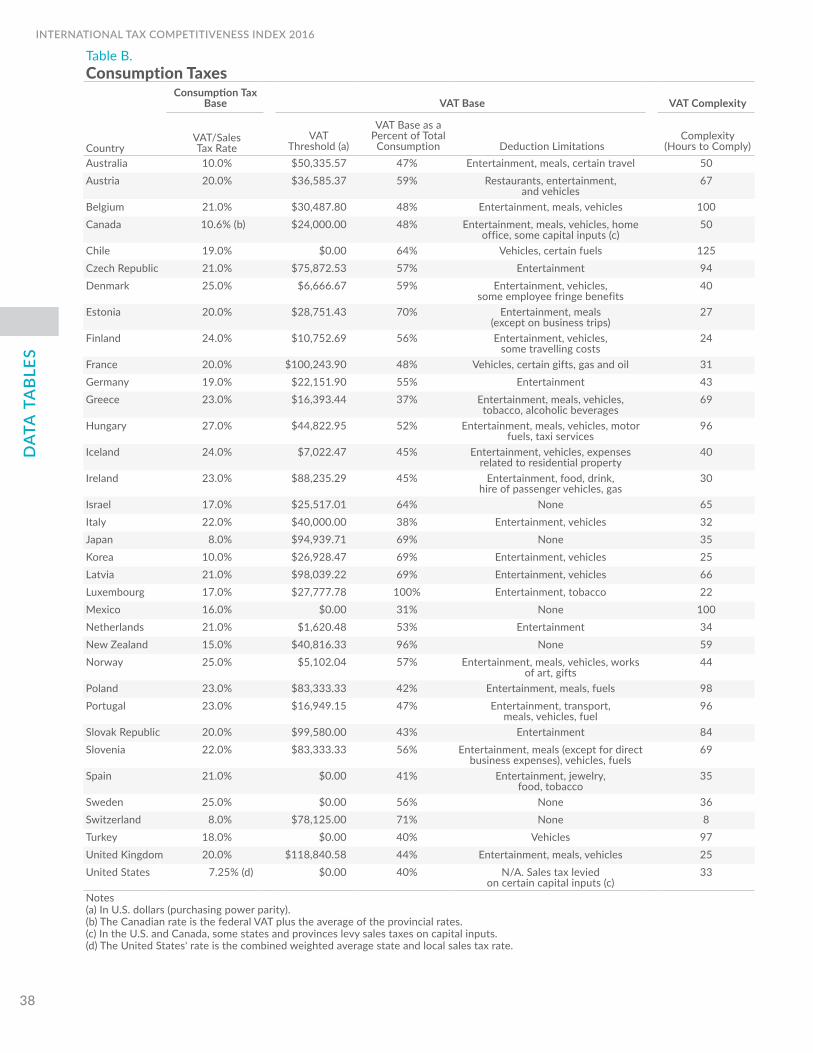
38
INTERNATIONAL TAX COMPETITIVENESS INDEX 2016D
ATA
TA
BLE
STable B. Consumption Taxes
Consumption Tax Base VAT Base VAT Complexity
CountryVAT/Sales Tax Rate
VAT Threshold (a)
VAT Base as a Percent of Total Consumption Deduction Limitations
Complexity (Hours to Comply)
Australia 10.0% $50,335.57 47% Entertainment, meals, certain travel 50Austria 20.0% $36,585.37 59% Restaurants, entertainment,
and vehicles67
Belgium 21.0% $30,487.80 48% Entertainment, meals, vehicles 100Canada 10.6% (b) $24,000.00 48% Entertainment, meals, vehicles, home
office, some capital inputs (c)50
Chile 19.0% $0.00 64% Vehicles, certain fuels 125Czech Republic 21.0% $75,872.53 57% Entertainment 94Denmark 25.0% $6,666.67 59% Entertainment, vehicles,
some employee fringe benefits40
Estonia 20.0% $28,751.43 70% Entertainment, meals (except on business trips)
27
Finland 24.0% $10,752.69 56% Entertainment, vehicles, some travelling costs
24
France 20.0% $100,243.90 48% Vehicles, certain gifts, gas and oil 31Germany 19.0% $22,151.90 55% Entertainment 43Greece 23.0% $16,393.44 37% Entertainment, meals, vehicles,
tobacco, alcoholic beverages69
Hungary 27.0% $44,822.95 52% Entertainment, meals, vehicles, motor fuels, taxi services
96
Iceland 24.0% $7,022.47 45% Entertainment, vehicles, expenses related to residential property
40
Ireland 23.0% $88,235.29 45% Entertainment, food, drink, hire of passenger vehicles, gas
30
Israel 17.0% $25,517.01 64% None 65Italy 22.0% $40,000.00 38% Entertainment, vehicles 32Japan 8.0% $94,939.71 69% None 35Korea 10.0% $26,928.47 69% Entertainment, vehicles 25Latvia 21.0% $98,039.22 69% Entertainment, vehicles 66Luxembourg 17.0% $27,777.78 100% Entertainment, tobacco 22Mexico 16.0% $0.00 31% None 100Netherlands 21.0% $1,620.48 53% Entertainment 34New Zealand 15.0% $40,816.33 96% None 59Norway 25.0% $5,102.04 57% Entertainment, meals, vehicles, works
of art, gifts44
Poland 23.0% $83,333.33 42% Entertainment, meals, fuels 98Portugal 23.0% $16,949.15 47% Entertainment, transport,
meals, vehicles, fuel96
Slovak Republic 20.0% $99,580.00 43% Entertainment 84Slovenia 22.0% $83,333.33 56% Entertainment, meals (except for direct
business expenses), vehicles, fuels69
Spain 21.0% $0.00 41% Entertainment, jewelry, food, tobacco
35
Sweden 25.0% $0.00 56% None 36Switzerland 8.0% $78,125.00 71% None 8Turkey 18.0% $0.00 40% Vehicles 97United Kingdom 20.0% $118,840.58 44% Entertainment, meals, vehicles 25United States 7.25% (d) $0.00 40% N/A. Sales tax levied
on certain capital inputs (c)33
Notes (a) In U.S. dollars (purchasing power parity).(b) The Canadian rate is the federal VAT plus the average of the provincial rates.(c) In the U.S. and Canada, some states and provinces levy sales taxes on capital inputs. (d) The United States' rate is the combined weighted average state and local sales tax rate.
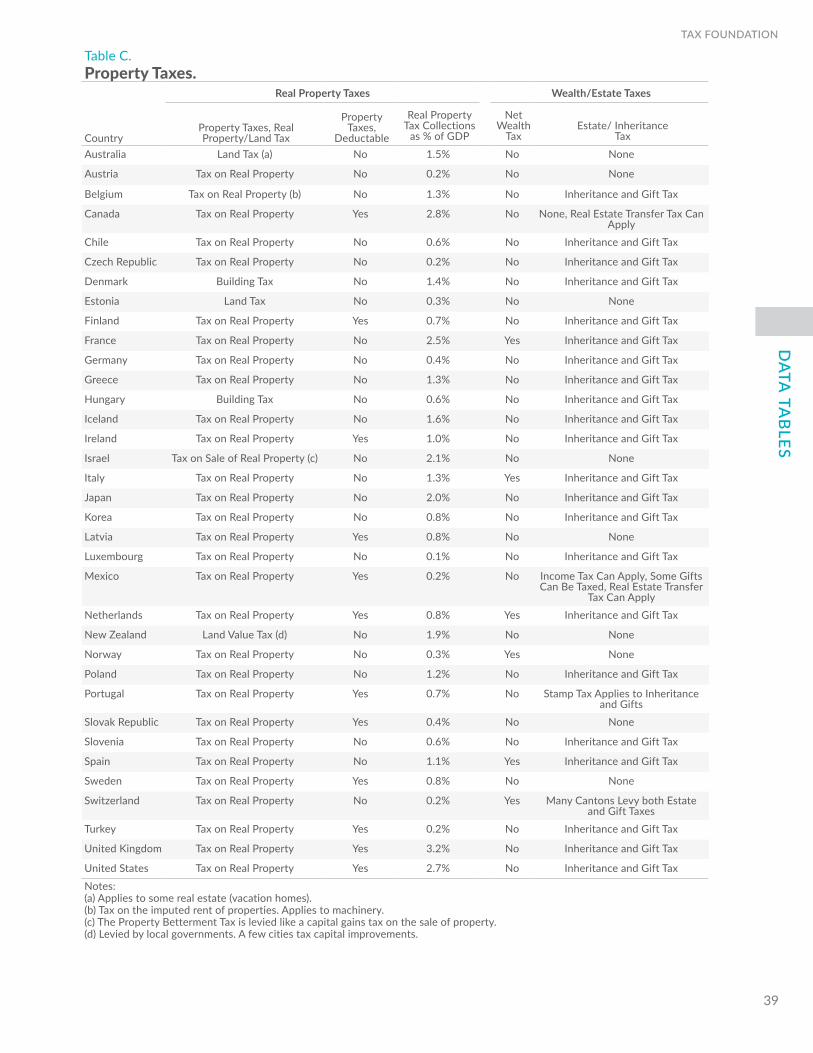
39
TAX FOUNDATIOND
ATA TA
BLES
Table C. Property Taxes.
Real Property Taxes Wealth/Estate Taxes
CountryProperty Taxes, Real Property/Land Tax
Property Taxes,
Deductable
Real Property Tax Collections
as % of GDP
Net Wealth
TaxEstate/ Inheritance
Tax
Australia Land Tax (a) No 1.5% No None
Austria Tax on Real Property No 0.2% No None
Belgium Tax on Real Property (b) No 1.3% No Inheritance and Gift Tax
Canada Tax on Real Property Yes 2.8% No None, Real Estate Transfer Tax Can Apply
Chile Tax on Real Property No 0.6% No Inheritance and Gift Tax
Czech Republic Tax on Real Property No 0.2% No Inheritance and Gift Tax
Denmark Building Tax No 1.4% No Inheritance and Gift Tax
Estonia Land Tax No 0.3% No None
Finland Tax on Real Property Yes 0.7% No Inheritance and Gift Tax
France Tax on Real Property No 2.5% Yes Inheritance and Gift Tax
Germany Tax on Real Property No 0.4% No Inheritance and Gift Tax
Greece Tax on Real Property No 1.3% No Inheritance and Gift Tax
Hungary Building Tax No 0.6% No Inheritance and Gift Tax
Iceland Tax on Real Property No 1.6% No Inheritance and Gift Tax
Ireland Tax on Real Property Yes 1.0% No Inheritance and Gift Tax
Israel Tax on Sale of Real Property (c) No 2.1% No None
Italy Tax on Real Property No 1.3% Yes Inheritance and Gift Tax
Japan Tax on Real Property No 2.0% No Inheritance and Gift Tax
Korea Tax on Real Property No 0.8% No Inheritance and Gift Tax
Latvia Tax on Real Property Yes 0.8% No None
Luxembourg Tax on Real Property No 0.1% No Inheritance and Gift Tax
Mexico Tax on Real Property Yes 0.2% No Income Tax Can Apply, Some Gifts Can Be Taxed, Real Estate Transfer
Tax Can ApplyNetherlands Tax on Real Property Yes 0.8% Yes Inheritance and Gift Tax
New Zealand Land Value Tax (d) No 1.9% No None
Norway Tax on Real Property No 0.3% Yes None
Poland Tax on Real Property No 1.2% No Inheritance and Gift Tax
Portugal Tax on Real Property Yes 0.7% No Stamp Tax Applies to Inheritance and Gifts
Slovak Republic Tax on Real Property Yes 0.4% No None
Slovenia Tax on Real Property No 0.6% No Inheritance and Gift Tax
Spain Tax on Real Property No 1.1% Yes Inheritance and Gift Tax
Sweden Tax on Real Property Yes 0.8% No None
Switzerland Tax on Real Property No 0.2% Yes Many Cantons Levy both Estate and Gift Taxes
Turkey Tax on Real Property Yes 0.2% No Inheritance and Gift Tax
United Kingdom Tax on Real Property Yes 3.2% No Inheritance and Gift Tax
United States Tax on Real Property Yes 2.7% No Inheritance and Gift TaxNotes: (a) Applies to some real estate (vacation homes).(b) Tax on the imputed rent of properties. Applies to machinery.(c) The Property Betterment Tax is levied like a capital gains tax on the sale of property.(d) Levied by local governments. A few cities tax capital improvements.
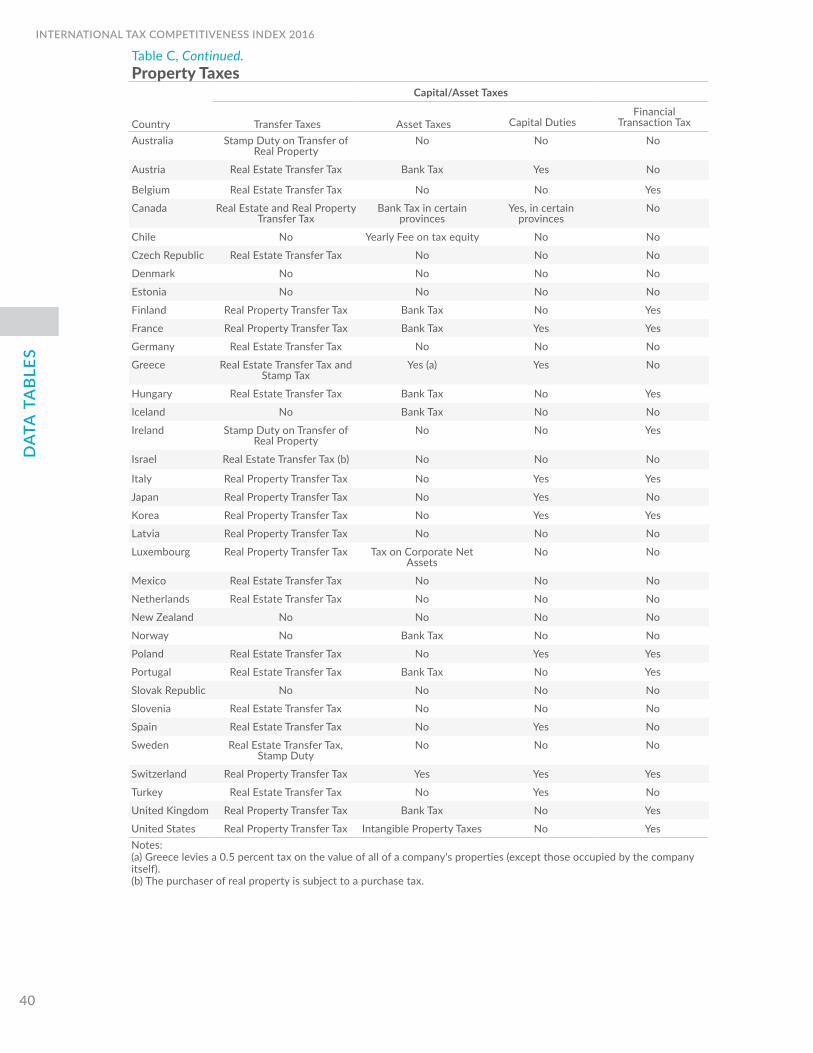
40
INTERNATIONAL TAX COMPETITIVENESS INDEX 2016D
ATA
TA
BLE
STable C, Continued.Property Taxes
Capital/Asset Taxes
Country Transfer Taxes Asset Taxes Capital DutiesFinancial
Transaction Tax
Australia Stamp Duty on Transfer of Real Property
No No No
Austria Real Estate Transfer Tax Bank Tax Yes No
Belgium Real Estate Transfer Tax No No Yes
Canada Real Estate and Real Property Transfer Tax
Bank Tax in certain provinces
Yes, in certain provinces
No
Chile No Yearly Fee on tax equity No No
Czech Republic Real Estate Transfer Tax No No No
Denmark No No No No
Estonia No No No No
Finland Real Property Transfer Tax Bank Tax No Yes
France Real Property Transfer Tax Bank Tax Yes Yes
Germany Real Estate Transfer Tax No No No
Greece Real Estate Transfer Tax and Stamp Tax
Yes (a) Yes No
Hungary Real Estate Transfer Tax Bank Tax No Yes
Iceland No Bank Tax No No
Ireland Stamp Duty on Transfer of Real Property
No No Yes
Israel Real Estate Transfer Tax (b) No No No
Italy Real Property Transfer Tax No Yes Yes
Japan Real Property Transfer Tax No Yes No
Korea Real Property Transfer Tax No Yes Yes
Latvia Real Property Transfer Tax No No No
Luxembourg Real Property Transfer Tax Tax on Corporate Net Assets
No No
Mexico Real Estate Transfer Tax No No No
Netherlands Real Estate Transfer Tax No No No
New Zealand No No No No
Norway No Bank Tax No No
Poland Real Estate Transfer Tax No Yes Yes
Portugal Real Estate Transfer Tax Bank Tax No Yes
Slovak Republic No No No No
Slovenia Real Estate Transfer Tax No No No
Spain Real Estate Transfer Tax No Yes No
Sweden Real Estate Transfer Tax, Stamp Duty
No No No
Switzerland Real Property Transfer Tax Yes Yes Yes
Turkey Real Estate Transfer Tax No Yes No
United Kingdom Real Property Transfer Tax Bank Tax No Yes
United States Real Property Transfer Tax Intangible Property Taxes No YesNotes: (a) Greece levies a 0.5 percent tax on the value of all of a company's properties (except those occupied by the company itself).(b) The purchaser of real property is subject to a purchase tax.
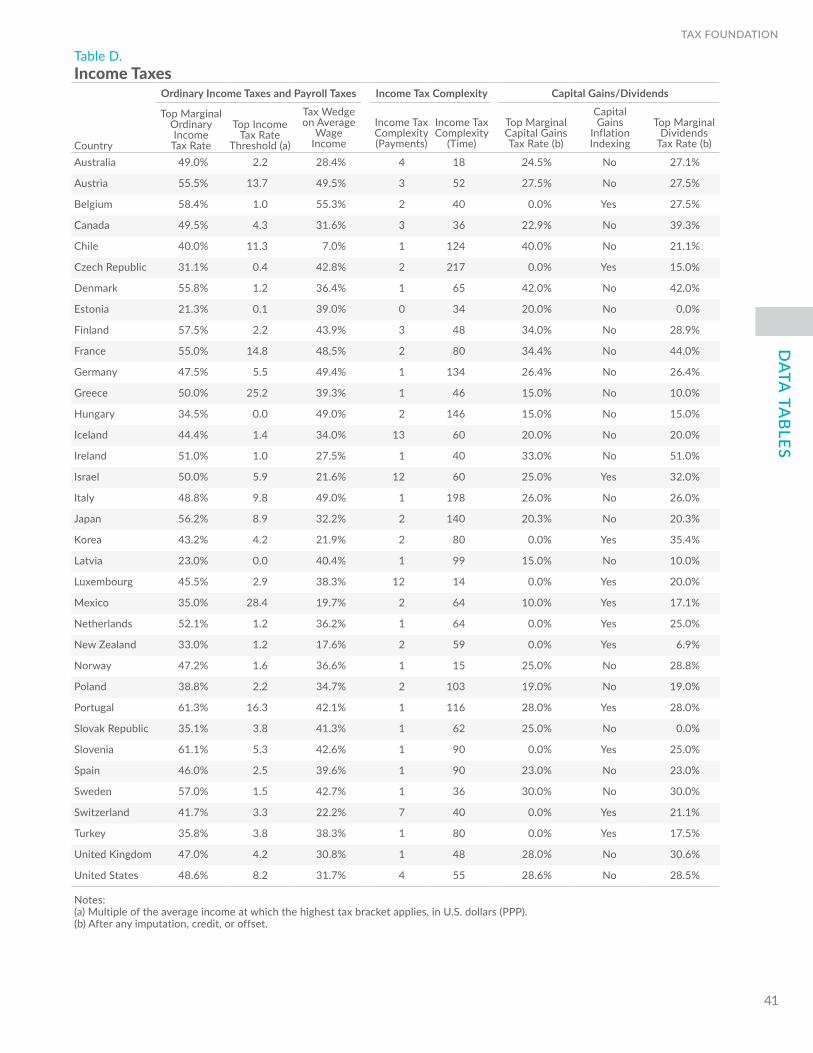
41
TAX FOUNDATIOND
ATA TA
BLES
Table D. Income Taxes
Ordinary Income Taxes and Payroll Taxes Income Tax Complexity Capital Gains/Dividends
Country
Top Marginal Ordinary Income
Tax Rate
Top Income Tax Rate
Threshold (a)
Tax Wedge on Average
Wage Income
Income Tax Complexity (Payments)
Income Tax Complexity
(Time)
Top Marginal Capital Gains Tax Rate (b)
Capital Gains
Inflation Indexing
Top Marginal Dividends
Tax Rate (b)
Australia 49.0% 2.2 28.4% 4 18 24.5% No 27.1%
Austria 55.5% 13.7 49.5% 3 52 27.5% No 27.5%
Belgium 58.4% 1.0 55.3% 2 40 0.0% Yes 27.5%
Canada 49.5% 4.3 31.6% 3 36 22.9% No 39.3%
Chile 40.0% 11.3 7.0% 1 124 40.0% No 21.1%
Czech Republic 31.1% 0.4 42.8% 2 217 0.0% Yes 15.0%
Denmark 55.8% 1.2 36.4% 1 65 42.0% No 42.0%
Estonia 21.3% 0.1 39.0% 0 34 20.0% No 0.0%
Finland 57.5% 2.2 43.9% 3 48 34.0% No 28.9%
France 55.0% 14.8 48.5% 2 80 34.4% No 44.0%
Germany 47.5% 5.5 49.4% 1 134 26.4% No 26.4%
Greece 50.0% 25.2 39.3% 1 46 15.0% No 10.0%
Hungary 34.5% 0.0 49.0% 2 146 15.0% No 15.0%
Iceland 44.4% 1.4 34.0% 13 60 20.0% No 20.0%
Ireland 51.0% 1.0 27.5% 1 40 33.0% No 51.0%
Israel 50.0% 5.9 21.6% 12 60 25.0% Yes 32.0%
Italy 48.8% 9.8 49.0% 1 198 26.0% No 26.0%
Japan 56.2% 8.9 32.2% 2 140 20.3% No 20.3%
Korea 43.2% 4.2 21.9% 2 80 0.0% Yes 35.4%
Latvia 23.0% 0.0 40.4% 1 99 15.0% No 10.0%
Luxembourg 45.5% 2.9 38.3% 12 14 0.0% Yes 20.0%
Mexico 35.0% 28.4 19.7% 2 64 10.0% Yes 17.1%
Netherlands 52.1% 1.2 36.2% 1 64 0.0% Yes 25.0%
New Zealand 33.0% 1.2 17.6% 2 59 0.0% Yes 6.9%
Norway 47.2% 1.6 36.6% 1 15 25.0% No 28.8%
Poland 38.8% 2.2 34.7% 2 103 19.0% No 19.0%
Portugal 61.3% 16.3 42.1% 1 116 28.0% Yes 28.0%
Slovak Republic 35.1% 3.8 41.3% 1 62 25.0% No 0.0%
Slovenia 61.1% 5.3 42.6% 1 90 0.0% Yes 25.0%
Spain 46.0% 2.5 39.6% 1 90 23.0% No 23.0%
Sweden 57.0% 1.5 42.7% 1 36 30.0% No 30.0%
Switzerland 41.7% 3.3 22.2% 7 40 0.0% Yes 21.1%
Turkey 35.8% 3.8 38.3% 1 80 0.0% Yes 17.5%
United Kingdom 47.0% 4.2 30.8% 1 48 28.0% No 30.6%
United States 48.6% 8.2 31.7% 4 55 28.6% No 28.5%
Notes: (a) Multiple of the average income at which the highest tax bracket applies, in U.S. dollars (PPP).(b) After any imputation, credit, or offset.
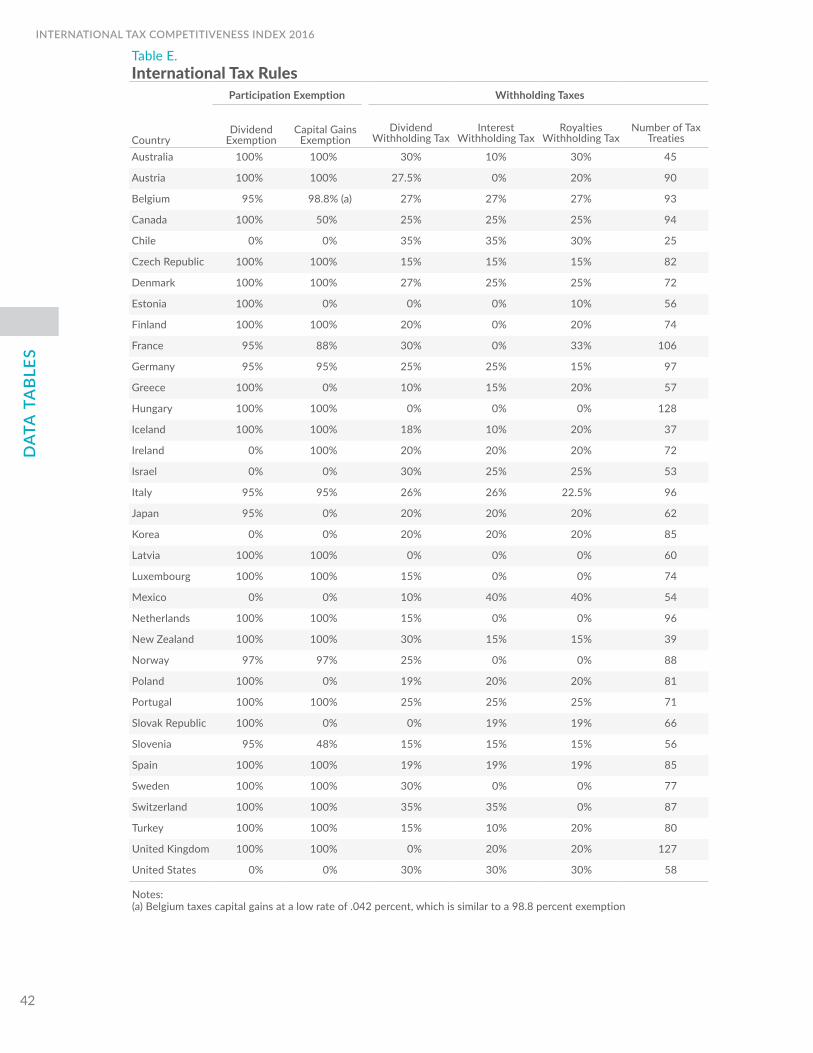
42
INTERNATIONAL TAX COMPETITIVENESS INDEX 2016D
ATA
TA
BLE
STable E. International Tax Rules
Participation Exemption Withholding Taxes
CountryDividend
ExemptionCapital Gains
ExemptionDividend
Withholding TaxInterest
Withholding TaxRoyalties
Withholding TaxNumber of Tax
Treaties
Australia 100% 100% 30% 10% 30% 45
Austria 100% 100% 27.5% 0% 20% 90
Belgium 95% 98.8% (a) 27% 27% 27% 93
Canada 100% 50% 25% 25% 25% 94
Chile 0% 0% 35% 35% 30% 25
Czech Republic 100% 100% 15% 15% 15% 82
Denmark 100% 100% 27% 25% 25% 72
Estonia 100% 0% 0% 0% 10% 56
Finland 100% 100% 20% 0% 20% 74
France 95% 88% 30% 0% 33% 106
Germany 95% 95% 25% 25% 15% 97
Greece 100% 0% 10% 15% 20% 57
Hungary 100% 100% 0% 0% 0% 128
Iceland 100% 100% 18% 10% 20% 37
Ireland 0% 100% 20% 20% 20% 72
Israel 0% 0% 30% 25% 25% 53
Italy 95% 95% 26% 26% 22.5% 96
Japan 95% 0% 20% 20% 20% 62
Korea 0% 0% 20% 20% 20% 85
Latvia 100% 100% 0% 0% 0% 60
Luxembourg 100% 100% 15% 0% 0% 74
Mexico 0% 0% 10% 40% 40% 54
Netherlands 100% 100% 15% 0% 0% 96
New Zealand 100% 100% 30% 15% 15% 39
Norway 97% 97% 25% 0% 0% 88
Poland 100% 0% 19% 20% 20% 81
Portugal 100% 100% 25% 25% 25% 71
Slovak Republic 100% 0% 0% 19% 19% 66
Slovenia 95% 48% 15% 15% 15% 56
Spain 100% 100% 19% 19% 19% 85
Sweden 100% 100% 30% 0% 0% 77
Switzerland 100% 100% 35% 35% 0% 87
Turkey 100% 100% 15% 10% 20% 80
United Kingdom 100% 100% 0% 20% 20% 127
United States 0% 0% 30% 30% 30% 58
Notes: (a) Belgium taxes capital gains at a low rate of .042 percent, which is similar to a 98.8 percent exemption
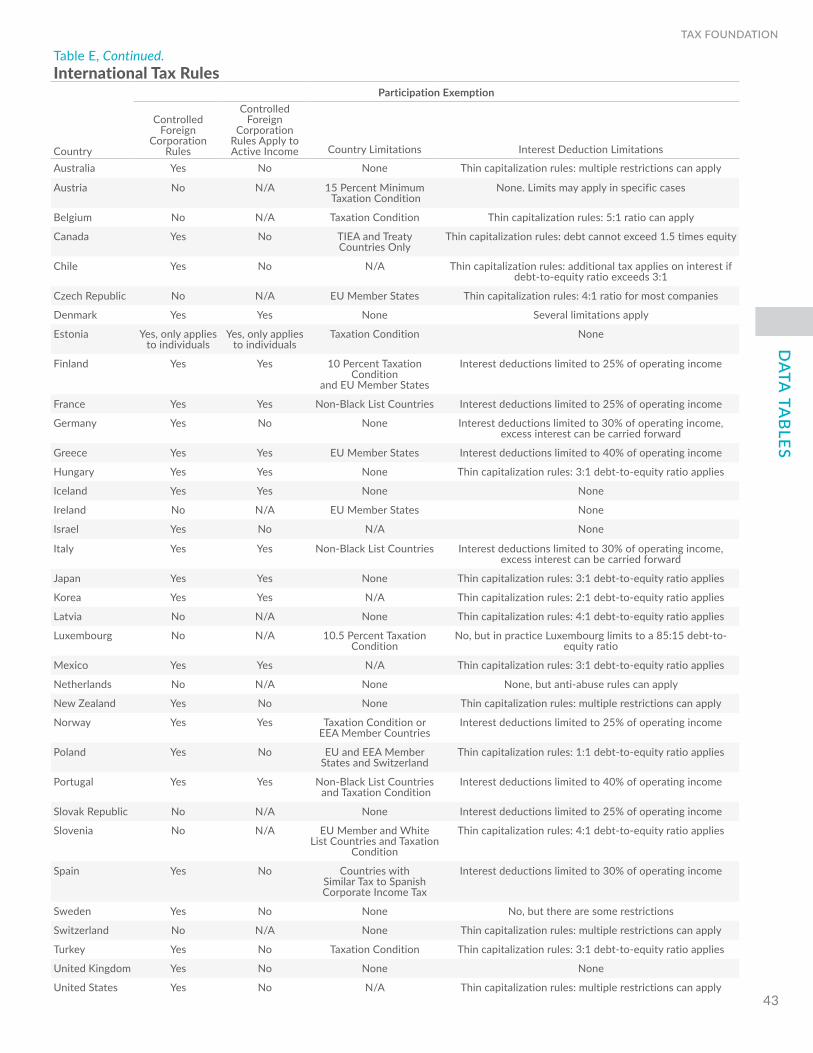
43
TAX FOUNDATIOND
ATA TA
BLES
Table E, Continued. International Tax Rules
Participation Exemption
Country
Controlled Foreign
Corporation Rules
Controlled Foreign
Corporation Rules Apply to Active Income Country Limitations Interest Deduction Limitations
Australia Yes No None Thin capitalization rules: multiple restrictions can apply
Austria No N/A 15 Percent Minimum Taxation Condition
None. Limits may apply in specific cases
Belgium No N/A Taxation Condition Thin capitalization rules: 5:1 ratio can apply
Canada Yes No TIEA and Treaty Countries Only
Thin capitalization rules: debt cannot exceed 1.5 times equity
Chile Yes No N/A Thin capitalization rules: additional tax applies on interest if debt-to-equity ratio exceeds 3:1
Czech Republic No N/A EU Member States Thin capitalization rules: 4:1 ratio for most companies
Denmark Yes Yes None Several limitations apply
Estonia Yes, only applies to individuals
Yes, only applies to individuals
Taxation Condition None
Finland Yes Yes 10 Percent Taxation Condition
and EU Member States
Interest deductions limited to 25% of operating income
France Yes Yes Non-Black List Countries Interest deductions limited to 25% of operating income
Germany Yes No None Interest deductions limited to 30% of operating income, excess interest can be carried forward
Greece Yes Yes EU Member States Interest deductions limited to 40% of operating income
Hungary Yes Yes None Thin capitalization rules: 3:1 debt-to-equity ratio applies
Iceland Yes Yes None None
Ireland No N/A EU Member States None
Israel Yes No N/A None
Italy Yes Yes Non-Black List Countries Interest deductions limited to 30% of operating income, excess interest can be carried forward
Japan Yes Yes None Thin capitalization rules: 3:1 debt-to-equity ratio applies
Korea Yes Yes N/A Thin capitalization rules: 2:1 debt-to-equity ratio applies
Latvia No N/A None Thin capitalization rules: 4:1 debt-to-equity ratio applies
Luxembourg No N/A 10.5 Percent Taxation Condition
No, but in practice Luxembourg limits to a 85:15 debt-to-equity ratio
Mexico Yes Yes N/A Thin capitalization rules: 3:1 debt-to-equity ratio applies
Netherlands No N/A None None, but anti-abuse rules can apply
New Zealand Yes No None Thin capitalization rules: multiple restrictions can apply
Norway Yes Yes Taxation Condition or EEA Member Countries
Interest deductions limited to 25% of operating income
Poland Yes No EU and EEA Member States and Switzerland
Thin capitalization rules: 1:1 debt-to-equity ratio applies
Portugal Yes Yes Non-Black List Countries and Taxation Condition
Interest deductions limited to 40% of operating income
Slovak Republic No N/A None Interest deductions limited to 25% of operating income
Slovenia No N/A EU Member and White List Countries and Taxation
Condition
Thin capitalization rules: 4:1 debt-to-equity ratio applies
Spain Yes No Countries with Similar Tax to Spanish Corporate Income Tax
Interest deductions limited to 30% of operating income
Sweden Yes No None No, but there are some restrictions
Switzerland No N/A None Thin capitalization rules: multiple restrictions can apply
Turkey Yes No Taxation Condition Thin capitalization rules: 3:1 debt-to-equity ratio applies
United Kingdom Yes No None None
United States Yes No N/A Thin capitalization rules: multiple restrictions can apply
About the TAx FoundationThe Tax Foundation is the nation’s leading independent tax policy research organization. Since 1937, our research, analysis, and experts have informed smarter tax policy at the federal, state, and local levels. Our Center for Federal Tax Policy’s research and outreach highlight our tax code’s strengths and weaknesses and show how tax policy impacts taxpayers, the government, and the economy at large.
Center for Federal Tax PolicyScott A. Hodge President
Kyle Pomerleau Director of Federal Projects
Stephen J. Entin Senior Fellow
Huaqun Li, PhD Economist
W. Gavin Ekins, PhD Research Economist
Alan Cole Economist
Scott Greenberg Analyst
Kadri Kallas-Zelek, PhD Taxes and Growth Fellow
taxfoundation.org
202-464-6200
facebook.com/taxfoundation
twitter.com/taxfoundation
1325 G Street N.W. Suite 950, Washington, D.C. 20005
Learn More
PRINCIPLED INSIGHTFUL ENGAGED
The International Tax Competitiveness Index measures how well a country’s tax system promotes sustainable economic growth and investment. The report looks at over 40 tax policy variables in five categories: corporate income taxes, individual taxes, consumption taxes, property taxes, and the treatment of foreign earnings. The ITCI gives a comprehensive overview of how developed countries’ tax codes compare, explains why certain tax codes stand out as good or bad models for reform, and provides important insight into how to think about tax policy.
The Tax Foundation is the nation’s leading independent tax policy research organization. Since 1937, our research, analysis, and experts have informed smarter tax policy at the federal, state, and local levels. We are a 501(c)(3) non-profit organization.
©2016 Tax Foundation
Editor, Rachel Shuster Designer, Dan Carvajal
Tax Foundation1325 G Street, N.W. Suite 950Washingtion, D.C. 20005202.464.6200
taxfoundation.org