
International Symposium on Demographic Change and Policy Response 13-14 November 2014, Beijing,...
26
International Symposium on Demographic Change and Policy Response 13-14 November 2014, Beijing, China INDIA’S PROPOSED UNIVERSAL HEALTH COVERAGE POLICY: EVIDENCE AND IMPLICATIONS FOR AGE STRUCTURE TRANSITION EFFECTS AND FISCAL SUSTAINABILITY M.R. Narayana Institute for Social and Economic Change Bangalore, India 13 November 2014
-
Upload
dominick-mcgee -
Category
Documents
-
view
216 -
download
3
Transcript of International Symposium on Demographic Change and Policy Response 13-14 November 2014, Beijing,...
International Symposium on Demographic Change and Policy Response
13-14 November 2014, Beijing, China
INDIA’S PROPOSED UNIVERSAL HEALTH COVERAGE
POLICY: EVIDENCE AND IMPLICATIONS FOR AGE STRUCTURE TRANSITION EFFECTS AND FISCAL
SUSTAINABILITY
M.R. NarayanaInstitute for Social and Economic Change
Bangalore, India
13 November 2014

Gratitude• Professors Ronald Lee and Andrew Mason for the
opportunity to present and participate in this international symposium, and for professional help and encouragement
• Professor Sang-Hyop Lee for constructive suggestions
• Professor Young Jun Chun for valuable technical guidance and support for calculation of GA for India
• Dr Tim Miller and Dr Carl Mason for providing me with health expenditure projections for India based on Lee-Carter model on forecasting mortality rates

Recent works
• WHO. (2013). Research on Universal Health Coverage. World Health Report 2013, World Health Organization (Luxembourg)
• Stabile, Mark., and Thomson, Sarah. (2014). The Changing Role of Government in Financing Health Care: An International Perspective, Journal of Economic Literature, 52(2), 480-518

Year Public health expenditureShare of health expenditure in aggregate public expenditure (%)
Share of health expenditure in GDP (%)
Total(INR billion)
Share of States (%)
Share of revenue expenditure (%)
Total Revenue
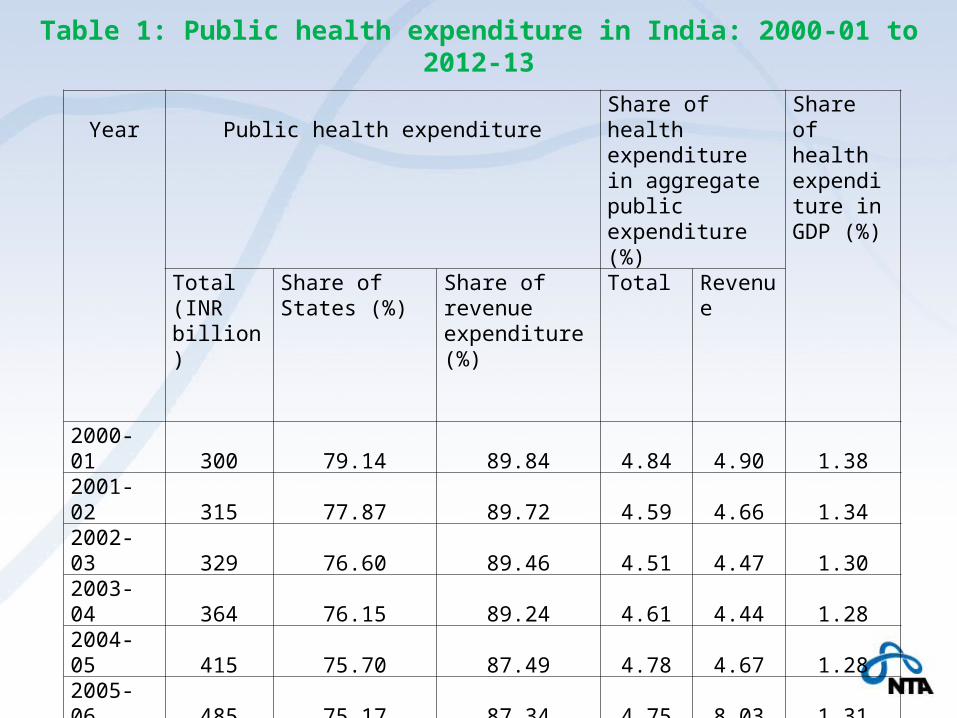
2000-01 300 79.14 89.84 4.84 4.90 1.382001-02 315 77.87 89.72 4.59 4.66 1.342002-03 329 76.60 89.46 4.51 4.47 1.302003-04 364 76.15 89.24 4.61 4.44 1.282004-05 415 75.70 87.49 4.78 4.67 1.282005-06 485 75.17 87.34 4.75 8.03 1.312006-07 557 75.83 86.91 4.70 7.75 1.302007-08 644 72.24 85.35 4.71 7.66 1.292008-09 759 71.69 84.70 4.59 6.89 1.352009-10 936 69.53 87.05 4.75 7.59 1.442010-11 1071 67.51 89.48 4.70 7.91 1.382011-12 1185 68.85 88.08 4.66 7.76 1.322012-13* 1411 72.83 67.13 4.79 6.22 1.39
Table 1: Public health expenditure in India: 2000-01 to 2012-13

India’s current policy proposal for Universal Health Coverage (UHC)
• High Level Expert Group on Universal Health Coverage (HLEG), instituted by India’s Planning Commission: 2011
• UHC refers to equitable access for all in the country to affordable, accountable, appropriate and assured quality health services (promotive, preventive, curative and rehabilitative) regardless of income level, social status, gender, caste or religion of persons.
• The goal of the UHC is to ensure universal entitlement for every citizen to a National Health Package (NHP) of essential primary, secondary and tertiary health care services that will be funded by the government.
• Under proposed UHC, people have a choice of facilities provided by public sector or contracted-in private providers (i.e. NGOs and non-profits). The private providers who opt for participation in the UHC would be required to provide at least 75 percent of out-patient and 50 percent of in-patient services to all in the NHP. The cost of these services is proposed to be reimbursed by the government.

Proposed financing of UHC
• (a) Increase the share of public expenditure by Central and State governments from 1.2 per cent in 2011-12 to 2.2 per cent of GDP in 2016-17 and to 3 per cent by 2022;
• (b) Use general taxation as the principle source of health care funding; and
• (c) Not to use insurance companies or any other independent agencies to purchase health care services on behalf of the government.
• In terms of per capita public expenditure, the increase in public health care spending (at 2009-10 prices) is projected to grow from INR675 in 2011-12, INR1975 in 2016-17 and INR3450 in 2022.
• This projection (without age specificities) is based on the assumptions that total (public + private) health expenditure would remain at 4.5 per cent of GDP, a real growth rate of GDP at 8 per cent at 2009-10 prices and projected population totals by the Registrar General of India.
Key policy issues in India’s proposed UHC
• Key research gaps in the current proposals to India’s UHC policy are lack of explicit recognition and inclusion of
• (a) age specific demand for the UHC by young, working and elderly population;
• (b) impact of age structure transition on changes in this age specific demand for UHC
• (c) sustainability of current fiscal policies in the presence of expected UHC policy and projected health expenditures
These gaps are the key policy imperatives /issues for research in this paper.

Research questions • Does demand for health services under a UHC Policy vary across ages? If
so, which of the age groups (young/working/elderly) is highest demander of the services?
• Does age structure transition in India’s population from 2005 through 2050 and beyond have implications on demand issues in question (1) above? If so, can the changes in size of demand (or demanders) be distinguished by the age groups and over time?
• What are the health expenditure requirements for implementation of a proposed UHC policy? How can such expenditures be projected in future?
• What are fiscal options to financing a UHC policy in question (3) above?
• If a proposed UHC policy is entirely pubic-funded, non-means tested and non-contributory, can it be sustained by current fiscal policies? If not, what are additional conditions required to attain fiscal sustainability under the proposed UHC policy?
Objective of this paper is to offer plausible answer to the above questions

Methodology
Combined methodology of NTA, health expenditure projections and GA
Measurement of UHC – NTA methodology
• A measure of age profile of UHC is calculated by combining the age profiles of public and private health consumption.
• This age profile is also a measure of observed demand for UHC in the benchmark year 2004-05
• Consistent with the current policy proposal on UHC from consumption side
GA methodology – Young’s spreadsheets
• Two version based on different GDP projections
• One version based on Mason-Miller public health expenditure projections

Mason and Miller health expenditure projections
• Mason and Miller apply the Lee-Carter model on forecasting age specific mortality rates, and show how the level and shape of spending changes as GDP/capita rises.
• The projection model shows the transition in health care spending by age as countries become wealthier. That is, poorer countries are projected to adopt the health care spending patterns observed in the richer countries (OECD countries)
• They assume that this transition takes place as GDP per capita increases. That is, as India's GDP per capita moves toward the levels observed in the high-income countries, its age pattern of spending in health care will also come to resemble that of the richer countries. This is called convergence scenario
• The convergence scenario is obtained by using data from 18 NTA countries – projection results are sent to all researchers in these countries


Year of projection
Projected per capita public health expenditure (INR)
Projected per capita private health expenditure (INR)
Projected per capita total health expenditure (INR)
Planning Commission
(2011)
MM Projections
(2014b)
Planning Commission
(2011)
MM Projections
(2014b)
Planning Commission
(2011)
MM Projections
(2014b)
2011-12 675 546 1825 2014 2500 2536
2016-17 1975 726 1750 2834 3725 3560
2021-22 3450 1056 1725 4174 5175 5229
Table 2: Comparison of public health expenditure projections for India

Fiscal sustainability• Using GA methodology, fiscal sustainability of current fiscal
policies is defined by Generational Imbalance (GI) • GI is measured by the difference in present value of net
payment of future generation and newborn (or age-0 cohort in the benchmark year) divided by the present value of net payment of the newborn.
• Current fiscal policies are sustainable if the value of GI is less than zero. This means that the lifetime net payment of future generation is smaller than that of current generation.
• Thus, to restore the long term budgetary balance, tax burden should be reduced, or transfer benefits should be increased, in future.

Model Main assumptions Computed value of GI
GDP growth rate (1)
GDP growth rate (2)
Baseline Model 1 Real interest rate = 8.13%Productivity growth rate =3.01%
97.75 111.15
Baseline Model 2 Same as Baseline Model 1 except population age structure in 2005 remains the same for all years
64.98 64.98
Baseline Model 3 Same as Baseline Model 1 except the productivity growth rate = 1.5%
89.01 104.05
Baseline Model 4 Same as Baseline Model 2 except the productivity growth rate =1.5%
100.83 100.83
Baseline Model 5 Same as Baseline Model 1 except the interest rate = 12%
97.60 113.60
Baseline Model 6 Same as Baseline Model 2 except the interest rate = 12%
115.49 116.49
Table 3: Sustainability of current fiscal policies: Basic results of baseline models

Model Main assumptions Computed value of GI
GDP growth rate (1)
GDP growth rate (2)
UHC Model 7 Real interest rate = 8.13%Productivity growth rate =3.01%
360.99 437.98
UHC Model 2 Same as UHC Model 1 except that population age structure in 2005 remains the same for all years
242.66 242.66
UHC Model 3 Same as UHC Model 1 except that the productivity growth rate =1.5%
465.47 561.62
UHC Model4 Same as Baseline Model 2 except that the productivity growth rate =3.01%
470.51 470.51
UHC Model 5 Same as Baseline Model 1 except the interest rate = 10%
525.25 632.00
UHC Model 6 Same as Baseline Model 2 except the interest rate = 10%
561.41 561.41
Table 4: Sustainability of current fiscal policies under a UHC for India
Sensitivity of sustainabilityIs fiscal sustainability sensitive to • health expenditure projections?• Assumptions on generosity of public
expenditure on social welfare expenditure and/or health expenditure?

Model Main assumptions Computed value of GI
UHC (MM) Model 1 Productivity growth rate=3.01% Real interest rate = 8.13%
-37
UHC (MM) Model 2 Same as MM Model 1 except that the productivity rate is reduced to 1.5%
80
UHC (MM) Model 3 Same as Baseline Model 2 and the interest rate = 10%
70
Table 5: Sustainability of current fiscal policies under MM health expenditure projections for India

Generation’s age in 2004-05
Net payments(INR in ‘000)
0 (New born) 311.2395 316.138
10 310.31715 301.61520 288.87925 279.87130 256.71735 232.28740 207.98945 182.52950 156.85155 130.43560 101.56265 75.65870 53.18875 37.94180 28.41885 15.37890 15.762
Table 6: Generational Accounts and its composition based on Mason-Miller health care expenditure projections for India,

Composition (INR in ‘000) Transfers Payments
EducationHealth
Cash Income
taxCorporation
taxIndirect
taxesNon-tax revenues
-28.067 -7.451 -16.747 28.962 55.365 224.805 54.371-27.964 -8.020 -19.342 30.423 59.412 226.040 55.589-24.021 -8.618 -22.613 30.935 61.771 218.141 54.722-18.001 -9.136 -27.589 31.414 64.475 207.097 53.354-9.810 -9.603 -34.603 31.558 67.694 192.280 51.364-0.064 -10.097 -34.112 30.790 70.756 174.077 48.522-0.054 -10.360 -36.169 28.675 72.527 156.723 45.376-0.045 -10.263 -37.685 25.507 72.033 140.802 41.937-0.036 -9.873 -37.546 21.752 69.545 125.941 38.206-0.027 -9.162 -36.816 17.398 66.631 110.311 34.194-0.018 -8.256 -35.062 12.781 63.825 93.653 29.929-0.010 -7.224 -35.273 8.134 61.387 77.494 25.927-0.002 -5.914 -35.653 3.880 55.554 62.222 21.4750.000 -4.687 -36.362 2.266 46.571 50.262 17.6080.000 -3.453 -35.717 1.407 36.875 39.978 14.0980.000 -2.206 -33.234 0.803 29.994 31.019 11.5640.000 -1.079 -26.174 0.438 22.461 23.289 9.4830.000 -0.174 -21.247 0.223 12.104 18.122 6.3500.000 -0.159 -14.781 0.099 9.151 15.684 5.608
Table 6: Generational Accounts and its composition based on Mason-Miller health care expenditure projections for India,

Future generation 197.569
Generational imbalance (%) -37.00
Sustainability gap (%) -9.10
Net payments as % of lifetime income 1.1. Current (newborn) generation
27.701.2. Future generation
11.60
Table 6: Generational Accounts and its composition based on Mason-Miller health care expenditure projections for India,

Required adjustments by tax burden and transfer payments
Generations Tax adjustment (%) Tax and transfer adjustment (%)
Current generation-388.0 -185.9
Future generation-45.4 -39.5
2010-41.8 -33.7
2020-43.0 -35.0
2030-44.1 -36.4
Table 6: Generational Accounts and its composition based on Mason-Miller health care expenditure projections for India,

Indicators Baseline Model 1 UHC Model 1Generational imbalance (%) 97.75 360.99Sustainability gap (%) 1.98 6.26Net payments as % of lifetime income 1.1. Current (newborn) generation 11.3 4.91.2. Future generation 14.9 14.9
Required adjustments by tax burden and transfer paymentsGenerations Tax
adjustment (%)
Tax and transfer adjustment (%)
Tax adjustment (%)
Tax and transfer adjustment (%)
Current generation 255.0 162.7 804.7 453.5Future generation 11.5 7.3 36.4 19.9 2010 11.1 7.0 35.1 19.2 2020 11.2 7.1 35.4 19.4 2030 11.3 7.2 35.7 19.6
Table 7: Required adjustments in unsustainability scenarios, India
Sensitivity for generosity of public expenditure
• We recalculated the GA models in Table 1 for different values of income elasticity of public expenditure on health.
• Our findings suggest that if the policy makers set this elasticity at 0.64 or less for all the baseline models 1 and 0.75 or less for all the baseline models 2 in Table 1.
• On the other hand, UHC models need simultaneous adjustments in income elasticity of public expenditure on social welfare expenditure and health expenditure.
• In particular, UHC models 1 (2) require adjustments for income elasticity of social welfare expenditure at 0.70 (0.90) or below and health expenditure at 0.40 (0.35) or less.
Major conclusions and implications
• The methodology of NTA, MM health expenditure projections and GA are useful to offer new insights in to the current policy proposals on UHC in India . These insights include:
• Age specific demand for health expenditure/consumption
• Measurement of UHC in terms of age profile of total health consumption
• Impact of age structure transition on demand for health services in general and UHC in particular
• Determination of fiscal sustainability by current and projected public health expenditure
• Determination of fiscal sustainability in the context of expected reform on UHC
• Developing plausible options for consideration for policy makers

THANK YOU


