State Clean Energy Policy Analysis: Renewable Energy Feed-in Tariffs

International Support for Feed-in Tariffs in Developing Countries –
A Review and Analysis of Proposed Mechanisms
Joern Huentelera,b*
An edited version of this paper has been published in the journal Renewable and Sustainable Energy
Reviews 2014, 39, 857–873.
aDepartment of Management, Technology and Economics, ETH Zurich, Switzerland bBelfer Center for Science and International Affairs, John F. Kennedy School of Government, Harvard
University, USA
*corresponding author: [email protected]; phone: +41 44 632 97 39; fax: +41 44 632 05 41
Abstract
Government support in the form of so-called feed-in tariff policies (FITs), which combine long-term, fixed-
price electricity purchase agreements and guaranteed grid-access, has attracted large private-sector
investments in sustainable electricity generation in the industrialized world. In an effort to replicate these
experiences globally, a number of international organizations, NGOs, banks and donor countries are
proposing mechanisms to cover part of the cost of FITs in developing countries. This paper reviews these
proposals for supported FITs and then uses a case study of Thailand’s Alternative Energy Development
Plan 2013-2021 to investigate the opportunities and challenges of supporting FITs at a global scale. The
review highlights that these proposed mechanisms foresee different roles for national governments and
supporting entities, particularly in terms of who is responsible to balance fixed FIT payments with
uncertain revenues and savings from carbon markets, donors and avoided fuel consumption. The case
study results then show that the uncertainty about the actual cost of supported FITs is so significant that
the responsibility to balance the FIT budget has to be considered carefully in the design of any mechanism
that is to be employed at scale. To a considerable extent, the uncertainty is driven by the counterfactual
analysis, i.e., by assumptions about the future savings from avoided fossil fuel consumption: for example,
depending on the fossil fuel price scenario the FIT may result in a cost of USD 17bn or savings of 23bn.
Unlike uncertainty about the necessary level of FIT payments, uncertainty about the avoided fossil fuel
cost materializes only over the course of the policy’s lifetime, making it politically challenging. This
suggests that an international support mechanism that differentiates the allocation of responsibility
depending on the income-level of the recipient country is more suitable for global-scale support than a
one-size-fits-all approach.
Keywords: Renewable energy, Feed-in tariffs, Development assistance, Developing countries; Climate policy
1

Highlights:
• Review of proposals for international financial support for FITs in developing countries • Classification of proposals according to proposed payment structure • Analysis of cost uncertainty for international donors and national governments using Thailand’s
Alternative Energy Development Plan as a case study • Cost uncertainty is driven by uncertain cost of avoided, fossil-fueled electricity • One-size-fits-all approach will not be suitable for all donor-recipient combinations
2

1. Introduction
Avoiding dangerous climate change will require a rapid up-scaling and redirection of electricity
infrastructure investments. The Intergovernmental Panel on Climate Change projects that the average
annual investment in conventional fossil-fuelled electricity generation over the next 15 years will need to
decrease by 20% compared to 2010 levels, while annual investment in low-carbon electricity supply will
need to rise to around USD 300bn over the same period, about twice the current level [1]. Trends in
overall emission growth indicate that an increasing share of these investments will need to flow into
infrastructure in developing countries [2]. How the industrialized world can best support developing
countries in attracting these investments is therefore keenly debated among researchers and
policymakers [3–10].
Much of the global investment in renewable energy in the last decade has been incentivized by so-called
feed-in tariff policies (FITs), which combine long-term, fixed-price electricity purchase agreements and
guaranteed grid-access. FITs have been especially successful in attracting private-sector investments in
new renewable energy technologies, supporting 64% of global wind and 87% of global PV capacity [8]. The
United Nations Development Program estimates that by 2012, 66 countries had some form of FIT in place,
up from only two countries in 1990, as shown in Figure 1 [11]. More than half of these tariffs have been
enacted in the developing world, where renewable energy investments reached USD 112 bn in 2012,
representing some 46% of the world total [12].
Figure 1: Number of countries with some form of FIT legislation worldwide, 1990-2012 [11]
The finance flows necessary to alter the trajectory of electricity sector investments in developing
countries are significant. The United Nations Department of Economic and Social Affairs (UN DESA)
estimates that a large-scale rollout of FITs in developing countries would cost about USD 250-270bn per
year [13]. Smaller countries in particular often lack the resources to provide sufficiently stable support to
attract private sector investments at a large scale. Most of the current investment in renewable energy in
developing countries is thus heavily concentrated, in major markets such as China and India [14]. In an
effort to replicate and expand the effects of FITs globally, a number of international organizations, NGOs,
banks and donor countries have proposed mechanisms that the international community covers a share
60
80
20
0
10
30
50
70
40
20102005200019951990
Developed countriesDeveloping countries
3

of the incremental cost1, i.e., the cost gap between conventional electricity generation and the FITs in
low- and middle-income countries [9,13,15–20].
This paper presents a review and a case study to investigate how FITs in developing countries can be
supported internationally. The proposals for “supported FITs” all aim to provide some form of direct
international financial transfer to fund FITs in developing countries, but they span a wide range of policy
designs, with different administrative forms, responsibilities and tariff structures. Given the size of
required commitments, and the long-term nature of payments under FITs, the institutional mechanisms
used to allocate and channel international support need to be very well understood before they can be
applied on a global scale. However, since most proposals have been formulated in the last four to five
years, there has been limited systematic research on supported FITs and how they compare to other
forms of international support. For the same reason, there has been little comparative work on the
different proposals. To address this gap, this paper first reviews the proposed supported FIT mechanisms,
highlighting the ways in which the proposals differ in terms of the roles they assign to the international
donors and the national government. In a second step, the paper presents a quantitative case study of a
hypothetical internationally supported FIT to finance Thailand’s renewable energy targets for 2021 [21].
The case study illustrates the cost and cost determinants of supported FITs, and suggests that the roles
assigned to the international donors and the national government – in particular the responsibility to
balance fixed FIT payments with uncertain and volatile revenues and savings – are a crucial design
element for internationally supported FITs.
The following section will introduce the different proposals for internationally supported FITs (Section 2).
Section 3 introduces the case, followed by section 4 which presents the model, data sources, and
methodology. The results of the case study are presented in Section 5, and their policy implications are
discussed in Section 6. The main conclusions of the paper are summarized in section 7.
2. International Support Mechanisms for Feed-in Tariffs in Developing Countries
2.1. Scope of Analysis
This paper defines a FIT in accordance with the World Bank as a performance-based support instrument
that offers three key incentives to investors in renewable energy projects: a standardized, fixed electricity
purchase tariff per kWh, guaranteed purchase of the electricity produced for a specified period, and
guaranteed access to the grid [22]. “Standardized” implies in this case that the available tariff is
determined administratively at the moment of project installation and defined by project characteristics,
notably installation year, quality of the resource, location, technology and size, rather than individually
1 In this paper “incremental cost” refers to the difference between conventional and renewable electricity in USD/kWh and is used interchangeably with “cost gap” and “additional cost”.
4

negotiated or determined by market competition.2 FITs are generally specified as a regulated purchase
obligation on national or regional electric utilities. In addition to the tariffs itself, FIT policies are often
complemented by additional incentives in the form of investment grants or low-interest loans [5].
Supported FITs are understood here as mechanisms that aim to channel international support to directly
cover a share of the FIT payments over the lifetime of the projects. Other means of international support
for FITs in developing countries are possible, of course, including technical assistance, grants, loans,
financial guarantees, and procedural support, and a number of alternatives to direct FIT coverage have
been proposed to support developing countries [4,11,23]. However, these alternatives go beyond the
scope of this paper. Furthermore, the presented discussion is limited to FITs for grid-connected policies;
proposals for decentralized mini grids supported by FITs are therefore not considered here [24,25].
2.2. Proposed Mechanisms to Cover FIT Cost in Developing Countries
Existing international funding sources have historically neither been large nor flexible enough to support
national FITs in a broad and programmatic way [5]. Aiming to alleviate this situation, the ten main
proposals for supported FITs, identified by the author and listed in Table 1, can be classified into three
categories (see Figure 2): (1) globally managed FITs, which propose global FIT policy regimes that give all
developing countries, below certain income or consumption thresholds, the right to opt in to a single,
homogenous FIT policy; (2) domestically managed supported FITs, which propose ways for heterogeneous,
domestically designed and managed FIT policies to access (existing or emerging) international funding
sources; and (3) globally managed incremental FITs, which propose to upgrade heterogeneous,
domestically designed and managed FIT policies through an additional, homogenous global FIT premium,
thereby creating, in essence, two parallel FITs which are paid on top of each other.
2.2.1. Globally Managed FITs
Three ambitious proposals link global support for FITs to global technology cost or development targets.
The European Renewable Energy Council (EREC) and Greenpeace proposed a scheme, called the “FIT
Support Mechanism”, that aims to bring down the electricity generation cost for all renewable energy
technologies to a level below that of conventional coal and gas power plants [20]. Under this proposal, a
global fund, financed by indicator-based international contributions, would finance the incremental cost
of FITs for a broad range of renewable energy technologies to all developing countries that enact a
national FIT law “based on successful examples”. Teske et al. [20] estimate that the scheme could cover
up to 7,400 TWh of annual renewable electricity generation by 2030, corresponding to roughly 37% of the
world’s total generation in 2010 [26], with incremental cost projected to average USD 60-80bn annually
from 2010 to 2030.
2 This definition excludes reverse auctions for purchase tariffs.
5

Figure 2: Payment structure of three alternative types of supported FITs
A similar program was proposed in 2009 by UN DESA, called the Global Green New Deal [18], through
which technology-specific FITs are provided to all developing countries until all supported renewable
energy technologies have reached a target cost level of USD 0.03-0.05/kWh. Also under the auspices of
UN DESA, DeMartino and Blanc discussed the option to provide a “Global FIT” to all developing countries
below a certain electricity consumption threshold. The authors estimate that the cost of reaching this
target would peak at around USD 250-270bn (in constant 2010 USD) annually from 2025 to 2030, about
twice of the current total development assistance [13]. All three proposals expect income-based
contributions by the host countries to the FIT budget, but do not go into detail on how they would be
determined.
Although designed initially for a specific country, and without a global goal in mind, the “fossil-fuelled FIT”,
proposal by Rickerson and Beukering [17] can also be classified as globally managed FIT mechanism if
rolled out on a global scale. Developed for the case of Indonesia, the mechanism aims to make FIT
support attractive for energy import-dependent developing countries through an innovative cost sharing
approach. The national government pays the electricity producer a variable electricity tariff that is
indexed to the price of fossil fuel imports. This domestic contribution is topped up by an internationally
supported fund to provide, in sum, a fixed FIT payment stream. The fund can recover its investment if the
domestic contribution exceeds the FIT level long enough, after which the savings are passed through to
the ratepayers.
a) Globally managed FIT
Fixed, guaranteedFIT
Avoided cost + possibledomestic contribution
Investor
Carbon credit purchasesand /or bilateral transfers
Fixed, guaranteedFIT
International fund / donors
Domestic FIT budget
Investor
Fixed, guaranteedFIT
International fund / donors
Domestic FIT budget
Fixed, guaranteedFIT premium
Investor
International fund / donors
Domestic FIT budget
b) Supported domestically managed FIT c) Globally managed incremental FIT
Time-variant payments
Fixed payments
6

Table 1: Proposed mechanism for internationally supported FITs in developing countries
Type Proposal References / Examples Eligibility Domestic contribution Main international support Institutional structure of support
Who balances FIT budgets? Further support
Globally managed FITs
FIT support mechanism (FTSM)
Greenpeace; EREC [20]
Countries which fulfil certain policy and income criteria; environmental criteria for projects
Avoided cost (plus possibly carbon credit sales)
Incremental cost (possibly in part through carbon credit purchases)
Global fund International side Additional support for infrastructure cost; debt finance
Global Green New Deal (GGND)
UN DESA [18] Countries which fulfil income criteria
Avoided cost (plus possibly indicator-based contribution)
(Remaining) incremental cost
Global fund International side Additional financial and technical assistance for least developing countries
Global FIT (GFIT) DeMartino & Blanc [13] Countries below electricity consumption threshold, during 2010-2025
Avoided cost (plus possibly additional contribution)
(Remaining) incremental cost
Global fund International side Additional financial for least developing countries
Fossil-fuelled FIT Proposal for Indonesia FIT Fund [17]
Countries with high share of commodity-type fossil fuels
Avoided cost Incremental cost (through variable premium based on fossil fuel price development)
Internationally supported fund for each country
International side NA
Domestically managed supported FITs
FITs with carbon credits under the UNFCCC
Okubo et al. [16] Burian & Arens [28] Edkins et al. [30]
Countries which fulfil certain policy and UNFCCC criteria
Incremental cost minus carbon credit revenues
Carbon credits purchased at market price
Global carbon market National government
Diverse
FITs with bilateral carbon credits
Japan’s Joint Crediting Mechanism [31]
Based on bilateral agreements
Incremental cost minus carbon credit revenues
Carbon credits purchased at negotiated price
Bilateral carbon market
National government
Technology, assistance in implementation
Bilateral assistance to national FITs
E.g., Energy+ initiative [27] supports FIT in India
Bilateral decision Incremental cost minus bilateral transfers
Negotiated bilateral transfers
Bilateral support National government
Diverse
Globally managed incremental FITs
Global energy transfer FITs (GET FIT)
Deutsche Bank Climate Change Advisors [32,33]; Rickerson et al. [9]
Small-scale plants in countries which fulfil certain policy and income criteria
Fixed tariff representing projected avoided cost (possibly plus domestic contribution)
Fixed premium equal to projected (remaining) incremental cost
Global fund / Supported national funds
National government and international side
Front-loadinga; debt & equity finance; insurance products; technical assistance
Green Climate Fund Private Sector Facility (GCF PSF)
Green Climate Fund business model framework [37]
Small and medium-sized projects in low-income countries
Fixed tariff representing projected avoided cost (possibly plus domestic contribution)
Fixed premium equal to projected (remaining) incremental cost
Global fund National government and international side
Insurance products
Global REFIT Facility under the GCF PSF
World Future Council [15]
Countries which fulfil certain policy and income criteria
Fixed tariff representing projected avoided cost (possibly plus domestic contribution)
Fixed premium equal to projected (remaining) incremental cost
Global fund in cooperation with national funding entities
National government and international side
Additional financial assistance
aFront –loading refers to a FIT payment structure under which a certain share of the tariff payments is paid upfront, rather than on an annual basis, to the investor to reduce capital expenditures.
7

2.2.2. Domestically Managed Supported FITs
In contrast to the “top-down” approach of the globally managed FITs, a number of proposals focus on
how bottom-up, domestically managed FIT policies can get access to broader, existing or emerging
international funding structures, notably bilateral development assistance and carbon markets.
Given the nature of performance-based FIT payments, a number of international donors have emphasized
that FIT policies are well suited to be supported by result-based, bilateral development assistance [5]. The
Norwegian government’s Energy+ initiative, for example, provides funding to the domestic FIT in India on
a bilateral basis [27].
Several other proposals explore the option to receive carbon credits for national FIT policies under the
emerging post-Kyoto regime for the United Nations Framework Convention on Climate Change (UNFCCC).
Central to these ideas is the fact that carbon credits are generated on a sectoral basis rather than a
project-by-project basis, possibly easing administrative and transaction cost. For example, Burian & Arens
[28], Grant [29] and Edkins et al. [30] consider the possibility of financing FITs in South Africa through
sectoral carbon credits. The most detailed elaboration on the topic is provided by Okubo et al. [16], who
analyzed South Korea’s FIT and suggested that FITs can be supported as a “credited nationally appropriate
mitigation action” under the UNFCCC. An alternative is the bilateral carbon market structure that is
emerging with Japan’s Joint Crediting Mechanism, under which bilateral agreements create a regulatory
framework that allows a wide range of carbon emission mitigation initiatives to receive carbon credits. A
feasibility study explored how to fund part of the cost of Mongolia’s FIT, in addition to technological and
financial assistance, in return for the carbon credits generated under the program [31].
2.2.3. Globally Managed Incremental FITs
Striking a balance between the approaches presented above, globally managed incremental FITs aim to
build on domestic FITs and support them with a centrally managed FIT support mechanism that draws on
established sources and means of development finance.
The GET FIT program, developed by Deutsche Bank for the Advisory Group on Energy and Climate Change
of the Secretary General of the United Nations, is the most advanced of these [9,32,33]. It aims to up-
grade existing national FIT policies through a country-specific combination of up-front payments,
performance-based payments, risk insurances and attractive debt finance conditions. The performance-
based payments come in the form of a fixed tariff premium, which is paid on top of domestic FITs and
aims to close the gap between the cost of renewable electricity and the host country’s ability to pay. In
essence, the GET FIT program creates a second FIT policy, with a tariff that reflects the projected cost gap,
in addition to the domestic policy. A version of the GET FIT program is currently being tested in Uganda,
where GET FIT upgraded the existing FIT in cooperation with the German development bank KfW [34].
8

Other proposals envision a FIT-specific facility under the Green Climate Fund (GCF), which will manage the
annual USD 100bn pledged to be transferred each year to developing countries from 2020 onward under
the UNFCCC [15,19,35,36]. The most elaborate scheme, prepared by Michaelowa and Hoch for the World
Future Council, calls for the GCF to elicit applications from bottom-up, domestically designed FITs that
would be supported by a centrally managed FIT fund. Through this centrally managed fund, the
Renewable Energy FIT Facility, the GCF would then subsidize developing countries with an income-
dependent share of the cost gap of national FIT policies, in the form of a tariff premium paid on the
domestic FIT, together with concessional loans and grants. Under one proposed option, least-developing
countries would receive 100% of the projected cost gap between fossil and renewable generation,
estimated to range between 2-4 c€/kWh, or 2.76-5.52 cUSD, while medium-income and advanced
developed countries would be supported with 50% and 20%, respectively. The authors estimate their
proposal to cost USD 1.3bn per year for a program that supports 100GW of new installations annually [15].
In its recently published business model framework, the GCF itself considers funding incremental FITs for
small to medium scale renewables in low and medium income countries as one opportunity for its private
sector facility (without going into much further detail) [37].
2.3. Three Ways to Balance the FIT Budget
The most important factors that make FITs an attractive policy for investors in the developed world are
stable revenue streams for built projects and predictable FIT levels for new projects [38]. All of the
reviewed proposals aim to replicate this stability and certainty for investors in developing countries, and
share the fundamental FIT design features. In fact, many of the proposed mechanisms explicitly build on
each other. Crucially, however, the three categories of supported FITs differ in how the payments are
structured, and how the payment structure in turn shapes the roles of international supporters and the
national government (see Figure 2). In particular, the proposals differ in how the FIT budget is balanced,
i.e., how the responsibility to maintain investment security over the full lifetime of the policy is allocated
between the developing country government and the international side. “Balancing the FIT budget” is
understood here as balancing fixed FIT payments with uncertain and volatile revenues and fuel cost
savings to ensure stable income streams for built projects and predictable FIT levels for new investors.
The essential question is: which side is covering the uncertainty in the development of incremental cost
over time?
Globally managed FIT mechanisms directly guarantee the full required FIT to the investor (see Figure 2a).
The international side thus buffers volatile revenues from carbon credit sales and savings from avoided
fossil fuel consumption, and has to adjust its contribution to the incremental cost if projected FIT
payments do not match actual revenues and savings. The domestic contribution to the incremental cost,
on the other hand, is set ex-ante and by design isolated from any uncertainty about the future
development of the incremental cost. EREC and Greenpeace’s proposal, for example, suggests that the
9

domestic contribution consists of carbon credit sales and the avoided cost, with the latter being
determined according to the “German model”. In this model the avoided cost is recovered for the FIT
budget by centrally collecting the renewable electricity and selling it on the wholesale market [20].3
Rickerson and Beukering’s [17] proposal directly links the domestic contribution to a fossil-fuel price index.
In both cases, the domestic contribution to the incremental cost is controlled by linking the domestic
payments to the actual revenues and savings.
Domestically managed supported FITs, in contrast, represent FIT policies in which the national
government guarantees the full FIT and is solely responsible for balancing uncertainty in carbon markets
as well as donor commitments (Figure 2b). Under globally managed incremental FITs, finally, the
international side provides a fixed premium on a fixed domestic FIT. Since both tariffs are fixed at the
beginning of the policy, neither side absorbs the full incremental cost uncertainty; rather, the cost
uncertainty over the lifecycle of built projects is absorbed by the national government, while the cost
uncertainty for new projects over the lifecycle of the policy is absorbed by the international side (Figure
2c).4 Table 2 summarizes how variable revenues and savings affect national governments and
international donors in different types of supported FITs.
Table 2: Impact of variable revenues and savings on national governments and international donors
Type Impact of time-variant donor contributions, carbon credit revenues and avoided cost savings over time on … … international side … national government
Globally managed FIT mechanisms
Global fund directly guarantees stable FITs and balances uncertain and volatile revenues and savings
No direct impact, but may be required to increase contribution over time
Domestically managed supported FITs
No direct impact, but may be required to increase contribution over time
National government directly guarantees stable FITs and balances uncertain and volatile revenues and savings
Globally managed incremental FITs
Built projects: no direct impact New projects: Global fund could adjust the FIT premium over time
Built projects: National government balances tariff with uncertain and volatile revenues and savings cost over the project’s lifetime New projects: if global fund does not adjust FIT premiums to changes in incremental cost, the national government would need to raise its payment beyond avoided cost to maintain attractive FIT
It is important to note that there is no systematic difference between the three types as to how much of
the projected cost is covered by either side. All contain provisions for the host country to cover the
avoided cost, and many foresee some form of local contribution to the incremental cost. The difference is
in how volatile and uncertain revenues and savings are buffered and balanced. In fact, the clear
boundaries between the three categories would blur in a world with perfect foresight of the future cost of
renewable and fossil electricity, carbon price trends and donor commitments. Since these cost and price
trends are uncertain, however, and the entity that balances the FIT budget shoulders the risk of
3 The UN DESA proposals also assume that developing countries cover the actual avoided cost, although the documents leave open how they would be determined in the case of implementation. 4 Deutsche Bank’s GET FIT and the GCF proposal [81] each contain provisions to insure the domestic contribution against a default. However, the international contribution is under normal circumstances limited to the fixed premium, while the national government’s contribution varies over the lifecycle of the projects with volatile fossil fuel prices.
10

unforeseen cost developments, the allocation of budget-balancing responsibility between the
international and national sides affects the degree of security that the FIT can provide to investors.
The uncertainty in the incremental cost implies that in order to ensure investment security, the budget-
balancing responsibility has to be allocated in a way that reflects each side’s political and financial capital
to support the FIT. It also implies that the degree of uncertainty about the actual incremental cost is as
important for the political feasibility of the policy as the overall magnitude of involved commitments. The
quantitative case study presented in the following sections therefore explores both the overall magnitude
of the incremental cost and the impact of cost uncertainty on the national and international sides under
the three different supported-FIT designs.
3. Thailand’s Alternative Energy Development Plan
3.1. Electricity Sector Background
This paper presents a quantitative case study of Thailand’s electricity sector, which assumes that the
country’s renewable energy targets for 2021, specified in the Alternative Energy Development Plan (AEDP)
[21], are achieved with the help of an internationally supported FIT.
Thailand was chosen as case study because its electricity sector is representative of many middle-income
countries in three significant ways. First, the country’s electricity is mainly produced from fossil fuels. As
of 2011, the electricity sector is dominated by natural gas (67%), with lignite and hard coal providing
together an additional 20%. Besides large hydropower (5%), renewable energy constitutes only a small
fraction of the electricity mix, mostly in the form of biomass (1.4%) [39]. Second, the country is witnessing
a rapid growth in energy demand. A country of 66.9 million with a GDP per capita at USD 5,210, Thailand’s
primary energy consumption has almost tripled from 1990 to 2011, making it the second-largest energy
consumer in the Association of Southeast Asian Nations (ASEAN), while its carbon emissions have grown
by 177.5% over the same period.5 Electricity generation reached 162 TWh in 2011, up from 29 TWh in
1987, and is projected to double yet again by 2035 [39–41]. Third, like many other middle-income
countries, Thailand is increasingly dependent on fossil fuel imports. The country is a net importer of oil,
gas and coal, with imports projected to increase to about 90% of consumed oil and gas by 2030 [41].
Nakawiro et al [42] estimate that gas and coal import cost will rise as share of GDP from 0.92% in 2011 to
2.19-2.69% in 2025, depending on the development of fuel prices in the region.
All three factors have particular implications for the calculation of the incremental cost of renewable
energy, and are thus relevant to the potential of the case study’s results to inform a possible global
application of internationally supported FITs. The dependence on fossil fuels makes the savings from
5 The power sector is the largest carbon source, with a share in national emissions that grew from 33% in 1990 to 42% in 2011.
11

avoided fossil fuel consumption the most important factor in the calculation of avoided cost, while rapid
demand growth introduces uncertainty into the calculation of avoided cost of conventional generation,
because assumptions have to be made about the impact of renewable energy diffusion on the
construction of new fossil fuel power plants. Lastly, import dependence implies that the avoided costs are
determined by international energy commodity prices, which tend to be more volatile than domestic
fossil fuel sources, especially lignite and natural gas.
3.2. Renewable Energy Targets and Current Policy Support
An additional reason to select Thailand as a case study for a supported FIT is that the country has
ambitious goals for renewable electricity, but still faces challenges in providing an integrated, stable
regulatory framework to achieve these targets [43].
Thailand’s electricity sector planning officials have begun to consider renewable energy as a significant
source of electricity generation. The country first formulated its ambitious renewable energy goals in the
AEDP of 2012. Updated in 2013 and now aiming to increase the renewable energy in the power sector to
14 GW by 2021, or 24% of the total capacity, the plan is expected to be integrated in the country’s overall
electricity sector plan over the course of 2014 [44,45]. As shown in Figure 3, the largest part of renewable
capacity is projected to come from biomass (4.8 GW), followed by biogas (3.6 GW), solar power (3 GW),
wind power (1.8 GW), municipal solid waste (400 MW) and micro hydro (324 MW). The largest relative
increase is targeted for biogas (17-fold) and wind energy (15-fold). It is notable that large hydro is not part
of the AEDP. For simplification, we therefore use the term ‘renewable electricity’ in this paper to refer to
non-large-hydro renewable electricity technologies.
Figure 3: Targets for renewable electricity under Thailand‘s Alternative Energy Development Plan; data for 2012 are from DEDE [64]; updated targets for 2021 from Kamolpanus [44]
The policies and regulatory framework to support these ambitious targets are still in flux. In addition to
tax incentives and investment grants, the primary government policy to induce renewable energy
investments is a FIT premium scheme, referred to as FIT adder, under which technology-specific
premiums are paid on top of the (variable) wholesale electricity price [43,46]. One of the first developing
countries to introduce a FIT program, Thailand implemented preferential grid-connection and avoided-
+1,761%
+697%
+145%
+836% +218%
+1,511%
Micro hydro
324102
Municipal solid waste
40043
Wind
1,800
112
PV
3,000
377
Biogas
3,600
193
Biomass
4,800 MW
1,960 MW
+400%
2,786 MW
13,924 MW
Total renewables (excluding large hydro)
2021
2012
12

cost tariffs in 2002, followed by technology-specific FIT premiums in 2006 [43]. The FIT adder program
offers investors a power purchase agreement under which fixed premiums, dependent on technology,
capacity and project location, are paid on top of a base tariff that is determined by the utility’s avoided
cost. The FIT adder has been quite successful in attracting private sector investment, but has experienced
cycles of boom and bust of applications, fuelled in part by speculation on the value of land with issued
licenses for renewable installations [43]. A significant share of issued solar licenses has since been revoked
[47]. In 2010, Thailand’s government announced plans to transform the FIT adder into a FIT with fixed
payments, but has done it so far only for rooftop solar PV [44].
4. Methodology
4.1. Framework of Analysis
A two-step methodology was employed to investigate the overall magnitude of the incremental cost of
the AEDP targets and the impact of incremental cost uncertainty on the national and international sides
under the three different supported-FIT designs.
First, a bottom-up, techno-economic model was developed to identify the incremental policy cost and the
main cost drivers (details in sections 4.2 and 4.3). The model focuses on six renewable energy
technologies: biomass, biogas, micro-hydro, on-shore wind, solar PV, and concentrating solar power
(CSP).6 Figure 9 in the appendix depicts the overall structure of the model with its key variables and
relationships. Two main model outcome metrics are used to assess the policy support needed to achieve
Thailand’s renewable electricity targets: the incremental policy cost as a proxy for marginal social cost
[48,49], calculated as cumulative difference between the total cost of renewable electricity generation
and the cost of avoided fossil electricity; and the abatement cost, i.e., the incremental cost divided by the
reduction of carbon emissions resulting from the AEDP.
The impact of different policy design options was then analyzed in a second step by estimating the
changes to cost commitments from the national and the international side under different cost trends and
assumptions. To gauge the uncertainty about the level of required FIT payments a sensitivity analysis was
used (all major input values were varied by ±20%). The uncertainty about the avoided cost was estimated
using different counterfactual scenarios in the form of alternative fossil fuel price assumptions, fossil fuel
price trends and methodologies to calculate the avoided cost (see section 4.4).
4.2. Cost of FIT Payments
The electricity generated by each source of renewable electricity is a function of the diffusion path (in GW
installed each year) and the plant utilization (in GWh produced per GW of installed capacity each year).
6 Municipal solid waste was not considered because of a lack of data on technology choice and cost in Thailand.
13

Since the AEDP does not contain interim targets, the diffusion of the six considered technologies was
modeled as a linear increase in installed capacity over the period 2013-2021.7 All renewable electricity is
assumed to be fed into the grid, so the plant utilization is a function only of the resource potential. In the
case of micro hydro, biogas and biomass, for which significant domestic experience exists, the capacity
values were taken from domestic academic sources [50–52]. For wind, solar PV and CSP the capacity
factors were estimated using resource information from the IRENA global atlas [53].
To model the FIT payments per unit of electricity produced, it was assumed that the government supports
each investment with an inflation-adjusted FIT over 20 years, resulting in FIT payments over the period
2013-2040 for the investments in 2013-2021. The FIT rates for each technology are assumed to exactly
reflect the technology’s LCOE, or levelized cost of electricity for investments at any point between 2013
and 2021 [23]. An additional 0.0115 USD/kWh were added to the LCOE to account for balancing and grid
integration cost of variable renewable energy technologies (PV, CSP and wind) [54]. Table 4 and Table 7 in
the appendix provide an overview of input parameters used to calculate the LCOE for the six renewable
energy technologies as well as key sector-wide assumptions used in the model.
4.3. Avoided Cost
To model the effect of renewable energy diffusion on conventional electricity generation, we compared
the hypothetical scenario without renewable energy diffusion to the case of full implementation of the
AEDP targets. The total avoided conventional electricity was then calculated by aggregating the
differences between total generation in 2013-2040 with and without AEDP targets for each of the
dispatchable technologies (generation from non-dispatachable technologies is not affected by the AEDP).
4.3.1. Fuel Mix Model
Thailand’s electricity sector is partly vertically integrated and dominated by state-owned enterprises [55].
The Electricity Generation Authority of Thailand is the transmission system operator, but also operates
around 50% of the generation assets directly and controls, as their largest shareholder, the two largest
independent power producers. Furthermore, the wholesale market is not liberalized. Decisions over new
power plant investments are therefore still made based on long-term integrated plans, rather than purely
based on market signals, and plant utilization is based on long-term allocations rather than marginal cost
of generation.
The model aims to capture this decision-making process when calculating the fuel mix. The power plant
pipeline was taken from the current Power Development Plan (PDP), published in June 2012 [40]. The
model builds additional power plants in the sequence determined by the PDP whenever dependable
7 The split between PV and CSP in the (un-differentiated) total solar target is assumed as a relation of 9: (PV) to 1 (CSP).
14

capacity does not exceed peak demand by at least 15%, reflecting the reserve margin required by
electricity sector planners [40], or total expected demand exceeds expected generation, based on historic
capacity factors, by more than 5%. An exception was made for all hydro power, combined-heat-and-
power, and contracted import capacity, which were assumed to come online as planned. This approach is
similar to the one adopted by domestic researchers [56]. The dependable capacity equals the total
capacity adjusted by factors that aim to reflect the fact that not all built capacity can be expected to be
available in the moment of peak demand, because of maintenance, failures, or intermittent generation.8
The fuel mix was then calculated, on a yearly basis, from historic capacity factors, marginally adjusted for
the dispatchable plant fleet to exactly meet yearly demand. ‘Dispatchable’ here refers to the plants that
are ramped up and down to balance demand, i.e., the full fleet excluding renewables, contracted import
capacity (lignite and hydro), municipal solid waste and (heat-led) cogeneration.
4.3.2. The Cost of Avoided Electricity
Modeling the marginal cost of avoided electricity required differentiating the impact of renewable
capacity installations on fossil generation capacity. This impact can be twofold: plant utilization of
dispatchable power plants can be reduced, or the construction of new power plants postponed. The
model accounted for these two effects by dividing the total avoided electricity into operating margin and
build margin. For all displaced electricity, the cost of electricity was calculated as LCOE. However, in the
case of reduced plant utilization, the operating margin, we assumed the marginal cost of electricity to
contain only the variable cost (O&M and fuel). The displaced electricity from postponed power plants, the
build margin, contains all fixed and variable cost.9 All input assumptions for the conventional electricity
LCOE calculations are summarized in Table 5 in the appendix.
4.4. Avoided Cost Scenarios
In total, 11 models were specified to analyze uncertainty in the avoided cost. Nine models estimate the
impact of different assumptions about fossil fuel prices and price trends (M1-9). These nine specifications
represent the combination of three different assumptions about the price per unit of avoided natural gas
consumption and three different fossil fuel price trends (3 x 3 price scenarios). When making assumptions
about the price of natural gas in the displaced electricity, it is important to note that natural gas in
Thailand, as in the rest of the world, is not priced uniformly.10 Which type of natural gas is displaced by
renewables therefore greatly affects the incremental cost. To analyze this effect, models were calculated
using the average price, the average import price, and the average LNG import price. The three fossil fuel
8 The factors were taken from Sangarasri-Greacen and Greacen [56] and Naksrisuk and Audomvongseree [68]. 9 This procedure was also employed by Schmidt et al. [48] and is related to the rules employed to calculate avoided carbon emissions in the Clean Development Mechanism under the UNFCCC. 10 The average price overall is about 7 USD/MBTU, the average import price about 8.4 USD/MBTU and the average price of imported liquefied natural gas (LNG) about 14.6 USD/MBTU [78].
15

price trends were taken from the International Energy Agency [57]. The two remaining specifications, M10-
11, estimated the impact of two alternative assumptions on the degree to which renewables delay new
fossil power plants. The standard specification assumes that the displaced electricity is a mix of operating
and build margin (see section 4.3.2). Greenpeace’s proposal [20], however, determines the avoided cost
using the German model, i.e., through wholesale electricity prices, which typically only reflects operating
cost. This implies that all displaced electricity is calculated as operating margin. The opposite assumption
is made in the proposal by UN DESA [13], which assumes that all displaced electricity would have to come
from new power plants – and therefore contains both capital and operating cost. Models M10-11 estimate
the impact of these alternative assumptions.
5. Results
5.1. Incremental Cost of and Cost Drivers of FIT Policy
The AEDP capacity targets will, if implemented as planned, lead to a significant transformation of
Thailand’s electricity sector. The model predicts that the new capacity installed under the AEDP will
increase the share of renewable energy generation, excluding large hydro, in the electricity mix from less
than 1% to 24% in 2021 (see Figure 4). Over the entire policy lifetime, the AEDP will reduce carbon
emissions by some 457 million tons CO2eq.
Figure 4: Change in fuel mix through the AEDP: a) fuel mix in 2021 without any new renewable installations after 2012; b) fuel mix in 2021 with AEDP targets; c) shows the renewable generation in 2021 with the AEDP targets in detail
FIT payments of USD 87.66bn, or 68.34bn in discounted terms11, are needed to finance this rise in
renewable electricity generation. This translates into an abatement cost of USD 36 per ton of CO2eq in
discounted USD2012. The payment streams for all technologies for the period 2013-2040 are displayed in
Figure 5, together with the avoided cost over the same period. Aggregated over all six renewable
11 Discounted to the year 2012 with the yield of 40-year Thai government bonds (4.43%), which reflects the refinancing cost of the Thai government over the period of the assumed FIT payments.
3%
Fuel oil & diesel
13%Coal
12%Lignite
6%
Natural gas
59%
Renewables0%
Hydro6%
Imported
2021: Fuel mix w/o AEDP capacity(total :255.6 TWh)
a) b) c)
Electricity production by source, TWh
8%Lignite6%
Natural gas
46%
Renewables24%
Hydro
3%
Other
0%
Imported
13%Coal
2021: Fuel mix w/ AEDP capacity(total: 255.6 TWh)
Solar PV (8%)
Biogas
CSP (1%) Micro hydro (1%)
Wind (7%)
47%
36%
Biomass
2021: Renewables mix(total: 62.0 TWh)
16

technologies, FIT payments rise linearly to USD 4.38bn in 2021 and stay stable until 2032, before falling to
zero in 2041, when the last plant installed under the FIT goes offline. The avoided cost is USD 66.46bn, or
51.84bn in present value. Over time, the avoided cost follows a similar path, with some volatility, reaching
a maximum of USD 3.74bn in 2027 in the standard model specification M1. Subtracting these from the FIT
cost leaves an incremental cost of USD 21.20bn (discounted: 16.50bn). The incremental cost peaks at USD
1.18bn in 2026 and remain positive over the entire policy lifetime. On average, the FIT policy costs an
additional USD 0.76bn per year, which corresponds to an average incremental cost of cUSD 2.2 per kWh
of renewable electricity.
Figure 5: a) Assumed FIT payments (positive), avoided cost (negative) and resulting incremental cost under the AEDP 2013-2040; b) total FIT cost, avoided cost and incremental cost, 2013-2040
The LCOE by technology are displayed in Figure 6 for the period 2013-2021. Benefiting from global
learning effects, the costs of all renewable technologies decrease over time. The decrease is strongest for
CSP (35%) and PV (32%) and weakest for biomass (2%). Nevertheless, CSP, PV, wind and micro hydro are
more expensive than the main fossil technologies and remain so until 2021. Biomass and biogas are in the
same range as most fossil fuel technologies, costing 8.2 cUSD/kWh and 6.9 cUSD/kWh in 2021, with only
subcritical lignite and subcritical coal power plants being significantly cheaper. These LCOE trends are
reflected in each technology’s contribution to the FIT cost. As shown in Figure 4, biomass and biogas
together account for 83% of renewable generation, but only 67% of the FIT payments (see Figure 5). PV
and wind are responsible for 8% and 7% of generation, respectively, while receiving 16% and 12% of the
payments. CSP and micro hydro also receive a significantly larger share of FIT payments (4% and 2%) than
they contribute to generation (1% each).
As can be seen when comparing Figure 4a and b, the additional renewable generation displaces mostly
coal (-4%) and natural gas (-13%). The avoided costs thus comes primarily from avoided natural gas
consumption (71% of avoided cost), followed by coal with 16% and nuclear with 7%. This illustrates that
1
0
5
4
3
2
-1
-2
-3
-4204020352030202520202015
Incremental costFIT payments
In billion USD2012, undiscounted
Incremental cost
$21bn
a) b)
Diesel turbineCoalLigniteNuclearNatural gas
CSP
34%
12%2%
FIT cost
Micro Hydro
Biogas
Biomass
4%
PV
Wind16%
33%
Total: $88bn
Avoided cost$67bn
17

the chosen mix of renewable energy and the type of displaced electricity are the most important drivers
of the incremental cost.
Figure 6: Trends in LCOE for six modeled renewable energy technologies and main fossil fuel alternatives 2013-2021 (avoided cost scenario specification: M1); *the reason for the increase in wind LCOE in 2021 is that the best wind resources will be exhausted by then
5.2. Uncertainty of Incremental Cost
This section explores how sensitive the incremental cost calculations presented above are to input
assumptions. The results for FIT payments, avoided cost and incremental cost in section 5.1 are based on
the baseline model specification M1, which assumes standard assumptions for renewable energy cost,
average natural gas prices, IEA’s “current policy” fuel trends, and a mix of operating and build margin in
the avoided cost. Figure 7 shows the impact of changes in renewable cost assumptions, while Figure 8
displays results for the different avoided cost scenarios.
Figure 7: Sensitivity of incremental cost to renewable energy input parameters
The results suggest that the incremental cost is most strongly affected by changes in the investment cost
of renewable technologies (2.8% change in incremental cost per 1% change of diffusion) and the learning
rate (2.7%). Although smaller in magnitude, the incremental cost is also sensitive to the capacity factor
(1.2%) and the cost of equity (1.3%; shown in Figure 7b). The incremental cost is less sensitive to changes
In USD2012,per kWh
0.00
0.05
0.10
0.15
0.20
0.25
0.30
0.35 2013
2014
2015
2016
2017
2018
2019
2020
2021
In billion USD2012, undiscounted (model M1)
20
15
10
5
020%10%0%-10%-20%
35
30
25
30
25
20
15
10
5
020%10%0%-10%-20%
35
Learning rate
Capacity Factor
Fixed O&M
Investment
a) b)
Cost of equity
Bank interest rate
Equity-debt split
Credit duration
18

in the fixed operation and maintenance (O&M) cost, bank interest rate, debt-equity split and the credit
duration.
Figure 8: Avoided and incremental cost in different fossil-fuel cost scenarios
As shown in Figure 8, the differences between avoided cost scenarios have an even stronger impact than
the renewable cost parameters. If it is assumed that the displaced natural gas consumption is priced at
the average natural gas price (model M1), the avoided cost are USD 66.46bn; if it assumed that imported
natural gas is displaced first (M4), the avoided cost reach USD 74.51bn, which reduces the incremental
cost by 38% to USD 13.15bn. If it is assumed that the avoided electricity would have been fueled by
liquefied natural gas (M7), the avoided cost rise to USD 109.64bn, which translates into negative
incremental cost, or savings, of USD 21.98bn. Although weaker, the different fuel price trend scenarios
also have an impact on the incremental cost, as shown for M2-3, M5-6, and M8-9. The difference between
the high and low fossil-fuel price scenarios of the IEA is about USD 9bn, corresponding to about 45% of
the incremental cost in the standard model specification, and roughly constant across the three sets of
models. Finally, the impact of the assumption whether new or existing power plants are displaced,
modeled in M8 and M11, can change the incremental cost by as much as USD 17.6bn. Overall, these results
imply that the uncertainty about the incremental cost is driven, to a large extent, by the counterfactual,
i.e., by the questions which fossil fuels are displaced, from which type of plants, and at what price.
5.3. Impact of Uncertainty Under Different Supported-FIT Designs
The different types of supported-FIT designs allocate the cost uncertainty differently between the
national and the international side. Table 3 shows the share of incremental cost covered by each side
under the three alternative supported-FIT designs when investment costs are varied by ±20% and fuel
prices follow the two extreme scenarios M7 and M3.
100
60
80
40
20
0
120
17.6-30.8
+ 22.0
M11M10M1M7M1FIT cost
M8
-21.2
M6 M9M5M4M3M2
IEA high-price scenario Medium-price scenario Low-price scenario
Average natural gas price
Average natural gas import price
Average LNG import price
Different assumptions for
displaced electricity
In billion USD2012, undiscounted
19

Table 3: Impact of incremental cost uncertainty on international and domestic cost under different FIT designs
Model / scenario
Total incremental
cost (USD bn)
Incremental cost covered by international side / domestic side (USD bn) Globally managed FIT, with
domestic contribution limited to avoided cost
Domestically managed supported FIT; carbon credits and transfers cover projected total incremental cost
Globally managed incremental FIT; international premium covers projected
incremental cost of each project Standard specification: M1 21.20 21.20 / 0.00a 21.20 / 0.00a 20.26 / 0.94ab
High investment cost (+20%) 33.07 33.07 / 0.00 21.20 / 11.87 32.13 / 0.94
Low investment cost (-20%) 9.33 9.33 / 0.00 21.20 / -11.87 8.39 / 0.94
High fuel prices (M7) -21.98 -21.98 / 0.00 21.20 / -43.18 -21.77 / -0.21
Low fuel prices (M3) 30.78 30.78 / 0.00 21.20 / 9.58 27.21 / 3.57 aOther initial splits of incremental cost between the national and the international sides are possible, of course, but they do not affect the impact of uncertainty as long as the payment structure and the fundamental principle of uncertainty allocation is maintained; bThe domestic contribution is positive because on average the cost of electricity decreases over time, due to learning effects and a decreasing share of displaced build margin.
Under a globally managed FIT the international side would cover all changes in incremental cost. If the
domestic contribution is limited to the real avoided cost, the international contribution in the four
considered cases would range between savings of USD 21.98bn and a cost of 30.78bn. Under a
domestically managed supported FIT that receives international funds from the carbon market and/or
pre-negotiated bilateral transfers, the four scenarios would, ceteris paribus, lead to changes in domestic
costs ranging between a savings of 43.18bn and cost of 11.87bn (for purposes of simplification, the
international contribution is assumed here to cover exactly the projected total incremental cost12). In the
case of a globally managed incremental FIT, both sides are affected by the uncertainty. If each project
receives a FIT equaling the current average avoided cost from the domestic government and the
remaining gap to the LCOE as a FIT premium from the international side, the cost coverage in the standard
specification would be USD 20.26bn and 0.94bn, with variation from -21.77bn to 32.13bn and -0.21bn to
3.57bn, respectively.
6. Discussion
The following discussion is split into two parts. The first part discusses the results of the quantitative case
study and puts the numbers into perspective (section 6.1) The second part explores the policy
implications of the paper’s results, including the findings from the review of proposals in section 2 and the
quantitative case results in section 5 (section 6.2). The section closes with a discussion of the paper’s
limitations (section 6.3).
It has to be noted that the following discussion is limited to FITs as a policy option and does not discuss in
detail the relative merits of FITs compared to other policy instruments aimed at promoting emission
reductions in general, or low-carbon electricity in particular.
12 If the carbon credits are sold on a carbon market, the carbon price creates an additional source of uncertainty in the incremental cost. This uncertainty is not explored in more detail here but needs to be considered by policymakers.
20

6.1. Incremental Cost of Supported FITs
6.1.1. Magnitude of Incremental FIT Cost
The case study of Thailand’s AEDP yields similar results to the global estimates of the incremental cost of
supported FITs [13,15,20]. At an average of cUSD 2.2 per kWh over the period 2013-2040 in the standard
model specification, the incremental cost of Thailand’s AEDP targets are in the cost range of estimates
such as the c€ 2-4 per kWh calculated by Michaelowa and Hoch [15] and the premiums of cUSD 1-2 per
kWh paid by the GET FIT pilot in Uganda [34].
The mitigation cost of USD 36 per ton of CO2eq is slightly higher than the 23.1 calculated by Teske et al. [20]
but, again, in the same order of magnitude. It is also more than the value of the carbon credits yielded
under the Clean Development Mechanism, even when their price peaked in 2008, which means that it is
highly unlikely that carbon credits under the current international climate policy regime would be
sufficient to fully cover the incremental cost of a supported FIT.
When the results for the Thailand case are extrapolated to all non-OECD countries, supporting the same
share of total electricity generation (24%) in 2021 across the Global South would cost some USD 80bn per
year, which is in the same order of magnitude as estimates by the European Renewable Energy Council
and Greenpeace (although they assume a higher share of supported generation) [20]. Notably, this figure
is in the same range as the total global official development assistance flows of USD 127bn in 2010 [58].
Given these large funding needs, any proposed mechanism to allocate and guarantee national and
international commitments must pay great attention to minimizing cost and uncertainty.
6.1.2. Uncertainty in Incremental Cost
The uncertainty in incremental FIT cost consists of two parts that must be discussed separately. Existing
studies have focused on the uncertainty about the level of FIT payments required to attract a given
amount of renewable capacity [13].13 In the case of Thailand, this uncertainty is driven largely by the
investment cost, learning rate, capacity factor and cost of equity. Although significant, uncertainty about
the FIT payments does not affect the commitments ex-post; rather, it is resolved in the moment of
investment, because the FIT rates are fixed for the full lifetime of the project. (Uncertainty in the O&M
cost, which was also identified as an important factor in the sensitivity analysis, is shouldered by the
investor). This part of the incremental cost uncertainty can therefore be resolved and managed with the
existing FIT policy design toolbox: feasibility studies, pilot FIT projects or regions, expert elicitations, and
frequent rate-setting reviews [5]. It does put the overall targets of the policy at risk because escalating
13 Although not explicitly considered here, the uncertainty about how much capacity investment can actually be attracted per year also falls into the ‘ex-ante’ category of uncertainty.
21

incremental cost might jeopardize political legitimacy in the long run, but the impact on short-term
investment security is likely to be limited.
More difficult to manage, and potentially larger in magnitude, is the uncertainty about the avoided fossil
fuel consumption. In the case of Thailand, the impact of different avoided cost scenarios in fact dwarfs the
uncertainty about renewable energy cost: between the nine main marginal fuel price scenarios, the
incremental cost varied between negative USD 22bn and positive USD 30bn – and none of the scenarios
seem entirely implausible. This range of cost corresponds to -4.7% and +4.5% of Thailand’s GDP in 2012
[59], which compares to the total government tax revenue in 2013 of about 16.5% of GDP [59].
6.2. Policy Implications
The quantitative case study results suggest that the incremental cost of renewable electricity in
developing countries is still substantial. Any supported FIT therefore needs to be designed with all major
cost drivers in mind in order to minimize necessary financial assistance. The model results suggest that
the incremental FIT cost is largely determined by (1) the growth rate of different renewable energy
sources, (2) the FIT rates for each technology and (3) the displaced electricity sources. The policy
implications of these drivers will be discussed in detail in 6.2.1.
Furthermore, the review of proposals in section 2 highlighted that the proposals differ in how they
allocate the uncertainty of the avoided cost. In view of its magnitude, highlighted by the quantitative case
study, allocating the uncertainty in incremental cost becomes a major challenge in the design of
supported FITs. The implications of this finding for policymakers are discussed in section 6.2.2.
6.2.1. Containing the Incremental FIT Cost
6.2.1.1. Resources and Capacity Growth Rates
When managing the growth rate of different renewable energy sources, donors and national
governments should aim to ensure that the best resources and most appropriate technologies are
exploited first. Unlike other policy options such as emission trading or technology-neutral reverse
auctions, FITs are not designed to prefer the cheapest technology – on the contrary, their success in
bringing down costs of technologies such as PV is based on the fact that they allow for experimentation,
learning and economies of scale in technologies that cannot yet compete with established technologies.
Any supported FIT therefore needs to be accompanied by capacity building activities to enhance the local
policymakers’ and regulators’ understanding of the resource potentials of different renewable energy
sources and the cost of state-of-the-art technology. Initiatives such as the IRENA Cost Database and the
Global Atlas of renewable resources [53] are very important steps in that direction, as are the numerous
initiatives going on in the realm of bilateral development cooperation.
22

Besides technical aspects, international policy learning and the exchange of legislative experience are
needed, too. Some developed countries, notably Germany and Spain, have had problems containing the
overall cost of their FIT policies because there were no limit to how much of each renewable technology
can be installed at any given time, and tariff rates at times did not reflect the actual cost of renewables.
Given that developing countries are less well positioned to shoulder unexpected cost overruns,
international collaboration is needed to ensure that supported FITs avoid pitfalls that might jeopardize
their long-term political legitimacy.
6.2.1.2. FIT Rates
To ensure that rates are set appropriately, a supported FIT needs to be administered through a carefully
designed application, review and licensing process. If the rates are set by the regulator, they should be
subject to regular review and revision. Some emerging economies have successfully linked FIT policies to
reverse auctions, a measure that could be used to manage both the FIT rates and the cost of new
commitments [81]. The Green Climate Fund has also considered this option [37]. In a supported FIT,
reverse auctions could be implemented in a two-staged model, with national designated entities applying
for batches of FIT projects at fixed rates to the international fund and investors applying to the designated
national entity for the individual projects.
6.2.1.3. The Cost of Avoided Electricity
The third factor – in which fossil fuel sources are displaced by renewable electricity – is at least as
important for the incremental cost as the first two factors discussed above, but often neglected in FIT cost
analyses [48]. The case study showed that the avoided costs cover a very significant share of the total FIT
cost (USD 67bn of the total 88bn, or 76%). What type of electricity is displaced and how its price is
determined therefore affects the cost-effectiveness of a supported FIT and its political feasibility. As such,
a supported FIT design should aim to fulfill two requirements with regard to the avoided cost.
The first requirement is that the most expensive fossil fuel is displaced first. In many countries, including
Thailand, the decommissioning of power plants is not always based on marginal cost, but a complex
outcome of contractual and political arrangements. Which electricity is displaced is therefore not always
determined by costs alone. Supported FITs should either be designed ex-ante to only cover the cost gap to
the most expensive fossil technology in use or – if the international contribution is determined ex-post, as
in some of the proposed mechanisms – require that plant decommissioning is cost-based.14
14 One way to approximate the marginal cost would be to link support to projected fossil fuel import prices [17], because these are typically more expensive and should therefore be the first to be replaced. However, how to design such a mechanism for countries with multiple import sources and multiple fossil fuels, such as Thailand, requires further investigation.
23

The second requirement is that the full avoided fossil electricity cost provide the basis for calculating the
incremental FIT cost. In the case of small quantities of renewable electricity, the avoided cost equals the
marginal cost of electricity, which is roughly equal to the fuel cost in the case of most fossil fuel powered
electricity. Whenever large quantities of renewable electricity are supported, however, the capital cost of
avoided new fossil power plants needs to be considered in the avoided cost calculations, too. This is
inherently difficult because it is based on counterfactuals – i.e. what would have been built without the
renewable installations. Developed countries have some experience with determining capacity credits of
renewable installations [e.g., 60] and should assist developing countries in designing mechanisms to
account for capital cost in the avoided cost of renewable installations.
6.2.2. Allocating the Uncertainty in the Avoided Cost
The quantitative case study illustrated how the three different types of supported FITs differ in the way
they allocate the avoided-cost uncertainty between the national and the international side. It also
illustrated that the uncertainty within the avoided cost is so large that it may jeopardize the ability of the
FIT to attract private sector investment. The choice between the three types of supported FITs therefore
critically affects the ability of a supported FIT to achieve its targets.
If the avoided cost is absorbed by the national government, as under domestically managed supported
FITs, the policy may become unsustainable domestically, as recent experience in Europe suggests. In the
long run, surging incremental costs may delegitimize support for new projects and lead to policy changes,
as happened in Germany [61,62]. New investments become less attractive or even unprofitable,
potentially compromising long-term diffusion targets. In the short term, political legitimacy may also
diminish so far that FIT revenues are changed or taxed retroactively, as with Spain and The Czech Republic,
the value of existing renewable generation assets plummets immediately. Both scenarios put the policy’s
long-term targets at risk. What’s more, since the investors’ cost of capital is affected by their and the
lenders’ degree of trust in the ability of the budget-balancing entity to deliver on its promise over the
entire life-time of the project, even the prospect of either scenario may inhibit the FIT from attaining its
targets cost-effectively. In addition, reducing the dependence on volatile fossil fuel prices is a major
motivation for developing countries to invest in renewables [63] – requiring the host country to balance
this volatile avoided cost would re-introduce the dependence on fuel prices and could therefore remove
most incentives to invest in the first place. On the other hand, assigning this uncertainty to the
international side, as done by the globally managed FITs, renders credible long-term commitments
politically difficult, and very large bilateral commitments probably infeasible.
It seems unrealistic that one solution to this conundrum can satisfy all combinations of donor and host
countries. For least-developed countries it might be necessary for international donors to absorb the full
avoided cost risk by guaranteeing the full FIT payments (as proposed by globally managed FITs), whereas
domestically managed supported FITs could be more appropriate for upper middle-income countries,
24

because they can be expected to shoulder most of the avoided cost risks of the FIT policies. Sharing the
uncertainty between the national and international side, as done by globally managed incremental FITs,
could be a suitable approach for the many developing countries that lie in between the two extremes. For
the design of a globally applicable mechanism, differentiating the budget-balancing responsibility
depending on the income-level of the recipient country and other characteristics such as the existing fuel
mix, thus might be more promising than a one-size-fits all approach.
6.3. Limitations
A techno-economic model such as the one presented here can provide quantitative estimates for the
investigated variables, but also has inherent limitations. Thus, three main factors need to be emphasized.
First and foremost, although the model’s assumption aimed to reflect the economics of projects in
Thailand by using local sources whenever possible, all absolute model results are to be taken with a grain
of salt. Investment cost parameters for renewable and fossil generation in particular varied by two-digit
percentages between reviewed studies and are thus particularly subject to uncertainty. A second
important limitation is that this paper employed sensitivity and scenario analyses because it was
impossible to obtain probabilities for different cost parameters or trends. However, the real policy cost
uncertainty is a function of probabilities in addition to sensitivities. Better models to estimate the
uncertainty of the policy cost need to be built before any of the proposed mechanisms can be rolled out
on a large scale. Thirdly, the model assumed that all FIT payments are made in USD and neglected the
currency risk, which could be a significant barrier for developing countries when providing USD tariffs [7].
How the currency risk is treated by different supported FIT proposals and how significant it is compared to
other drivers of uncertainty should be the subject of further research.
The presented case study can thus only provide one additional step toward a better understanding of the
economics of renewable energy in developing countries and international support mechanisms.
7. Conclusion
This paper investigated how feed-in tariffs (FITs) in developing countries can be supported through direct
international financial assistance. FITs in developed countries have been successful in attracting private
sector investments because of the secure and predictable cash flows they provide. Many developing
country governments, international organizations, NGOs and international donors are therefore
considering the option of internationally-supported FITs in developing countries to decouple their
economic growth from greenhouse gas emissions.
However, given the long-term nature of the promised payments, designing internationally supported FIT
mechanisms that provide the same level of investment security as in developed countries will be
challenging. This article aimed to inform the discussion on how to design such a mechanism. It first
25

reviewed and classified proposed mechanisms, before presenting a techno-economic analysis of a
potential internationally supported FIT to assist Thailand’s renewable energy targets for 2021.
Four main conclusions can be drawn from the analysis of the proposed mechanisms and the quantitative
case study. First, the magnitude of the incremental cost of supported FITs is considerable. In the
considered case of Thailand, the incremental cost of the FIT were estimated at USD 21bn, or 3.15% of
Thailand’s GDP in 2012. This magnitude of necessary commitments suggests that a global mechanism to
channel financing to FITs in developing countries would have to be established outside the currently
existing institutional landscape. The Green Climate Fund under the UNFCCC could be a suitable vehicle if
the proposed USD 100bn per year from 2020 will indeed be raised from developed economies, but a long
process of demonstration and institutional experimentation will surely be necessary to the build trust
required before donors commit such large sums of money over decades.
Second, the incremental costs of supported FITs in developing countries are very uncertain. In the
presented avoided cost scenarios for the case of Thailand, which all assume the same diffusion of
renewable energy at the same absolute cost of energy, the incremental cost varied between -4.7% and
+4.5% of Thailand’s GDP in 2012. Because this uncertainty is only resolved over the lifetime of the FIT
policy, which includes the lifetime of all supported projects, it implies further challenges for the design
and implementation of a supported FIT: Donor countries will be unwilling to commit to financial
assistance flows without knowing their eventual volume, while investors will only be attracted with a clear,
long-term support commitment. Other options for international support for FITs in developing countries
that do not envision the international side to directly cover part of the FIT payments, notably initiatives to
reduce investment cost and investment risks [e.g., 23], are not subject to this uncertainty. These options
might therefore face fewer political and institutional challenges in the short term.
Third, the uncertainty in the incremental cost is driven, to a large extent, by the uncertain savings from
avoided fossil fuel consumption. This is in part due to the absolute size of the avoided cost: In the case of
Thailand, the incremental cost of the FIT were only 24% of the total FIT cost, because the avoided fossil
fuel cost covered the remaining 76%. But it is also due to the nature of the uncertainty. Unlike the cost of
the supported renewable electricity, which is also uncertain but can be managed by carefully designing
the process in which commitments are made, the avoided cost uncertainty is resolved only over the life-
time of the supported projects. Fuel prices may vary substantially over the 10-20 years that FIT payments
have to be committed, and changes over time in the type of displaced electricity may result in large step
changes in the avoided cost. In addition, the savings from the avoided fossil fuel consumption have to be
determined through an analysis of the counterfactuals - i.e., by determining which power plants would
have been built and which types of fuels consumed without the renewable installations. Arriving at a
process to determine these counterfactuals that satisfies domestic governments and international donors
will require much experimentation and policy learning.
26

Fourth, the reviewed proposals for internationally supported FITs differ in how they allocate the avoided
cost uncertainty between national governments and international donors. Some proposals assign all cost
uncertainty to the national government, whereas the international side assumes all uncertainty in others.
Ideally, the avoided cost uncertainty would be allocated dependent on characteristics of the host country.
While emerging middle-income countries can be expected to absorb this risk, international donors might
be willing assume it when they support the least-developed countries. A support mechanism that
differentiates the tariff payment structure depending on characteristics of the recipient country could
thus be more suitable for large-scale support than a one-size-fits all approach.
Acknowledgements
The author would like to thank the participants of the workshop on “Governance Architecture towards
Low-Carbon Society: Technology and Actor Configuration” at the United Nations University in Yokohama
and the Sustainability Innovation Seminar at Tokyo University, as well as Volker Hoffmann, Tobias Schmidt,
Christian Niebuhr, Tillmann Lang, Joern Hoppmann, Suzanne Greene and Kavita Surana for their help and
comments. All errors remain my own.
27

References
[1] Edenhofer O, Pichs-Madruga R, Sokona Y, Agrawala S, Bashmakov IA, Blanco G, et al. Assessment
Report 5 - Working Group III - Summary for Policymakers. Geneva, Switzerland: Intergovernmental
Panel for Climate Change (IPCC); 2014.
[2] IEA. World Energy Outlook 2013. Paris, France: International Energy Agency (IEA) / Organisation for
Economic Cooperation and Development (OECD); 2013.
[3] Schmidt TS. Low-carbon investment risks and de-risking. Nat Clim Chang 2014;4:237–9.
[4] Glemarec Y. Catalysing Climate Finance - A Guidebook on Policy and Financing Options to Support
Green, Low-Emission and Climate-Resilient Development. New York, NY: United Nations Development
Programme (UNDP); 2011.
[5] Rickerson W, Laurent C, Jacobs D, Dietrich C, Hanley C, UNEP. Feed-in Tariffs as a Policy Instrument for
Promoting Renewable Energies and Green Economies in Developing Countries. Nairobi, Kenya: United
Nations Environmental Programme (UNEP); 2012.
[6] Shrimali G, Nelson D, Goel S, Konda C, Kumar R. Renewable deployment in India: Financing costs and
implications for policy. Energy Policy 2013:1–16.
[7] Nelson D, Shrimali G. Finance Mechanisms for Lowering the Cost of Renewable Energy in Rapidly
Developing Countries. San Francisco, CA: Climate Policy Initiative (CPI); 2014.
[8] Couture TD, Becker-Birck C. Energy Policy Design for Low and Middle Income Countries: From Best
Practices to “Next” Practices. In: Colombo E, Bologna S, Masera D, editors. Renew. Energy Unleashing
Sustain. Dev., Geneva, Switzerland: Springer International Publishing; 2013, p. 239–54.
[9] Rickerson W, Hanley C, Laurent C, Greacen C. Implementing a global fund for feed-in tariffs in
developing countries: A case study of Tanzania. Renew Energy 2013;49:29–32.
[10] Jacobs D, Marzolf N, Paredes JR, Rickerson W, Flynn H, Becker-Birck C, et al. Analysis of renewable
energy incentives in the Latin America and Caribbean region: The feed-in tariff case. Energy Policy
2013;60:601–10.
[11] Glemarec Y, Rickerson W, Waissbein O. Transforming on-grid renewable energy markets. New York, NY:
United Nations Development Programme (UNDP); 2012.
[12] REN21. Renewables 2013: Global Status Report. Paris, France: Renewable Energy Policy Network for
the 21st Century (REN21); 2013.
[13] DeMartino S, Le Blanc D. Estimating the Amount of a Global Feed-in Tariff for Renewable Electricity. UN
Dep Econ Soc Aff Work Pap No 95 2010;54.
28

[14] UNEP & BNEF. Global Trends in Renewable Energy Investment. Frankfurt, Germany: Frankfurt School-
UNEP Centre / Bloomberg New Energy Finance (BNEF); 2014.
[15] Michaelowa A, Hoch S. FIT for Renewables? Design options for the Green Climate Fund to support
renewable energy feed-in tariffs in developing countries. Hamburg, Germany: World Future Council;
2013.
[16] Okubo Y, Hayashi D, Michaelowa A. NAMA crediting: how to assess offsets from and additionality of
policy-based mitigation actions in developing countries. Greenh Gas Meas Manag 2011;1:37–46.
[17] Rickerson W, Beukering G. The fossil-fuelled feed-in tariff. Environ Financ 2012:22–3.
[18] AtKisson A. A Global Green New Deal for Climate, Energy, and Development. Geneva, Switzerland:
United Nations Department of Economic and Social Affairs (UN DESA); 2009.
[19] Jacobs D, Butzengeiger S, Schurig S, Stephan B. Unleashing renewable energy power in developing
countries. Hamburg, Germany: World Future Council; 2009.
[20] Teske S, Zervos A, Lins C, Muth J, Krewitt W, Pregger T, et al. energy [r]evolution. Amsterdam, The
Netherlands: European Renewable Energy Council (EREC) and Greenpeace; 2010.
[21] DEDE. The Renewable and Alternative Energy Development Plan for 25 Percent in 10 Years ( AEDP
2012-2021 ). Bangkok, Thailand: Ministry of Energy - Department of Alternative Energy Development
and Efficiency (DEDE); 2012.
[22] Elizondo Azuela G, Barroso LA. Design and Performance of Policy Instruments to Promote the
Development of Renewable Energy. Washington, DC: The World Bank; 2012.
[23] Waissbein O, Glemarec Y, Bayraktar H, Schmidt TS. Derisking Renewable Energy Investment. A
Framework to Support Policymakers in Selecting Public Instruments to Promote Renewable Energy
Investment in Developing Countries. New York, NY: United Nations Development Programme (UNDP);
2013.
[24] Moner-Girona M. A new tailored scheme for the support of renewable energies in developing countries.
Energy Policy 2009;37:2037–41.
[25] Thiam DR. An energy pricing scheme for the diffusion of decentralized renewable technology
investment in developing countries. Energy Policy 2011;39:4284–97.
[26] EIA. International Energy Statistics. Washington, DC, Available Online at Http://www.eia.gov/: US
Energy Information Administration (EIA); 2014.
[27] Norwegian Government. Energy+ Partnering for a transformational energy future, Oslo. Oslo, Norway:
energy+ International Energy and Climate Initiative; 2011.
29

[28] Burian M, Arens C. Carbon REFIT - Case Study for the Southern African Power Pool Region. Wuppertal
and Hamburg, Germany: Wuppertal Institute for Climate, Environment and Energy; GFA Envest; 2012.
[29] Grant K. Concentrated solar power in South Africa. Clim Policy 2009;9:544–52.
[30] Edkins MAX, Winkler H, Marquard A. Large-scale rollout of concentrating solar power in South Africa.
Cape Town, South Africa: University of Cape Town, Energy Research Centre; 2009.
[31] GEC. Joint Crediting Mechanism (JCM) Promotion Scheme by MOEJ/GEC in 2013. Tokyo, Japan: Global
Environment Centre Foundation (GEC); 2013.
[32] DBCCA. GET FiT Plus: De-Risking Clean Energy Business Models in A Developing Country Context.
Frankfurt, Germany: Deutsche Bank Climate Change Advisors (DBCCA), Deutsche Bank Group; 2011.
[33] DBCCA. GET FiT Program - Global Energy Transfer Feed-in Tariffs for Developing Countries. Frankfurt,
Germany: Deutsche Bank Climate Change Advisors (DBCCA), Deutsche Bank Group; 2010.
[34] Kreibiehl S, Miltner S. GET FiT in Uganda - Observations & open issues from a financial perspective.
Frankfurt, Germany: Deutsche Bank (DB) Research Policy Paper - Natural Resources; 2014.
[35] Sierra K. The Green Climate Fund: Options for Mobilizing the Private Sector. Washington, DC: Climate &
Development Knowledge Network; 2011.
[36] SSNC. A green energy revolution for climate and development through a global system of feed-in tariffs
for renewable energy. Bonn, Germany: Submission to the UNFCCC: Views on the establishment of one
or more non-market-based mechanisms by the Swedish Society for Nature (SSNC); 2011.
[37] GCF. Business Model Framework: Private Sector Facility. Songdo, Republic of Korea: Green Climate
Fund (GCF) GCF/B.04/07; 2013.
[38] Couture T, Gagnon Y. An analysis of feed-in tariff remuneration models: Implications for renewable
energy investment. Energy Policy 2010;38:955–65.
[39] EPPO. Energy Database Statistics. Bangkok, Thailand: Ministry of Energy - Energy Policy and Planning
Office (EPPO); 2012.
[40] EPPO. Power Development Plan 2010, Revision 3 (June 2012). vol. 2030. Bangkok, Thailand: Ministry of
Energy - Energy Policy and Planning Office (EPPO); 2012.
[41] IEA. Southeast Asia Energy Outlook. Paris, France: International Energy Agency (IEA) / Organisation for
Economic Cooperation and Development (OECD); 2013.
[42] Nakawiro T, Bhattacharyya S, Limmeechokchai B. Electricity capacity expansion in Thailand: An analysis
of gas dependence and fuel import reliance. Energy 2008;33:712–23.
30

[43] Tongsopit S, Greacen C. An assessment of Thailand’s feed-in tariff program. Renew Energy 2013;60:1–
24.
[44] Kamolpanus S. Thailand’s Renewable Power - Current Status, Challenges, and Future Trend. AORC-
CIGRE Tech Meet Sept 3rd, 2013, Guangzhou China 2013.
[45] Somcharoenwattana W. Distributed Generation Shines in Thailand. Renew Energy World - Available
Online Http//www.renewableenergyworld.com /rea/news/article/2014/04/distributed-Generation-
Shines- In-Thail 2014.
[46] DEDE. The Renewable and Alternative Energy Development Plan for 25 Percent in 10 Years (AEDP 2012-
2021) 2012.
[47] Photon. Thailand to revoke licenses for a further 700 MW of solar projects. Aachen, Germany: Market
News 28.05.2013, available online at
http://www.photon.info/photon_news_detail_en.photon?id=77103; 2013.
[48] Schmidt T, Born R, Schneider M. Assessing the costs of photovoltaic and wind power in six developing
countries. Nat Clim Chang 2012;2:548–53.
[49] Palmer K, Burtraw D. Cost-effectiveness of renewable electricity policies. Energy Econ 2005;27:873–94.
[50] Delivand MK, Barz M, Gheewala SH, Sajjakulnukit B. Economic feasibility assessment of rice straw
utilization for electricity generating through combustion in Thailand. Appl Energy 2011;88:3651–8.
[51] Pattanapongchai A, Limmeechokchai B. Least cost energy planning in Thailand: A case of biogas
upgrading in palm oil industry. Songklanakarin J Sci Technol 2011;33:705–15.
[52] Promjiraprawat K, Limmeechokchai B. Assessment of Thailand’s Energy Policies and CO2 Emissions:
Analyses of Energy Efficiency Measures and Renewable Power Generation. Energies 2012;5:3074–93.
[53] IRENA. Global Atlas. Abu Dhabi, UAE: International Renewable Energy Agency (IRENA); 2014.
[54] IEA. World Energy Outlook 2008. vol. 23. Paris, France: International Energy Agency (IEA) / Organisation
for Economic Cooperation and Development (OECD); 2008.
[55] Wisuttisak P. Regulation and competition issues in Thai electricity sector. Energy Policy 2012;44:185–98.
[56] Sangarasri-Greacen C, Greacen C. Proposed Power Development Plan 2012 and a Framework for
Improving Accountability and Performance of Power Sector Planning. Bangkok, Thailand: 2012.
[57] IEA. World Energy Outlook 2011. Paris, France: International Energy Agency (IEA) / Organisation for
Economic Cooperation and Development (OECD); 2012.
[58] OECD. Development Co-operation Report 2013. Paris, France: Organization for Economic Cooperation
and Development (OECD); 2013.
31

[59] The World Bank. Databank. Washington, DC: The World Bank; 2014.
[60] Giebel G. Wind power has a capacity credit a catalogue of 50+ supporting studies. Risoe, Denmark:
Risoe National Laboratory, available online at http://ejournal.windeng.net/3/01/GGiebel-
CapCredLit_WindEngEJournal_2005_right_links.pdf; 2005.
[61] Huenteler J, Schmidt TS, Kanie N. Japan’s post-Fukushima challenge – implications from the German
experience on renewable energy policy. Energy Policy 2012;45:6–11.
[62] Hoppmann J, Huenteler J, Girod B. Compulsive policy-making—The evolution of the German feed-in
tariff system for solar photovoltaic power. Res Policy 2014:1–20.
[63] Rentschler JE. Oil Price Volatility, Economic Growth and the Hedging Role of Renewable Energy. The
World . Washington, DC: 2013.
[64] DEDE. Energy in Thailand: Facts and Figures 2012. Bangkok, Thailand: Ministry of Energy - Department
of Alternative Energy Development and Efficiency (DEDE); 2013.
[65] NREL. Cost and performance data for power generation technologies. Boulder, Colorado: National
Renewable Energy Laboratory (NREL); 2012.
[66] Pattanapongchai A, Limmeechokchai B. Least cost energy planning in Thailand : A case of biogas
upgrading in palm oil industry. Renew Energy 2011;33:705–15.
[67] IRENA. Wind Power. Abu Dhabi, UAE: International Renewable Energy Agency (IRENA) - Renewable
Energy Technologies: Cost Analysis Series 5/5; 2012.
[68] Naksrisuk C, Audomvongseree K. Dependable capacity evaluation of wind power and solar power
generation systems. 2013 10th Int Conf Electr Eng Comput Telecommun Inf Technol 2013.
[69] Muncharoen C, Limmeechokchai B, Yoohoon A, Kumpeera K, Buakhiew C, Kunanopparat S, et al. The
study of emission factor for an electricity system in Thailand in Year 2010. Bangkok, Thailand: Thailand
Greenhouse Gas Management Organization; 2010.
[70] Hayward JA, Graham PW. A global and local endogenous experience curve model for projecting future
uptake and cost of electricity generation technologies. Energy Econ 2013;40:537–48.
[71] Mott McDonald. Costs of low-carbon generation technologies. London, UK: UK Committee on Climate
Change; 2011.
[72] Junginger HM, Sark W, Faaij A. Technological Learning in the Energy Sector: Lessons for Policy, Industry
and Science. Cheltenham, UK: Edward Elgar; 2010.
[73] IEA. Renewable Energy - Medium-Term Market Report 2013. Paris, France: International Energy Agency
(IEA) / Organisation for Economic Cooperation and Development (OECD); 2013.
32

[74] IRENA. Biomass for Power Generation. Abu Dhabi, UAE: International Renewable Energy Agency (IRENA)
- Renewable Energy Technologies: Cost Analysis Series 2/5; 2012.
[75] IRENA. Hydropower. Abu Dhabi: International Renewable Energy Agency (IRENA) - Renewable Energy
Technologies: Cost Analysis Series 3/5; 2012.
[76] DOE/EIA. Electricity Market Module of the National Energy Modeling System. Washington, DC: US
Department of Energy (DOE) and Energy Information Adminstration (EIA); 2013.
[77] EPPO. Thailand’s Automatic Tariff Adjustment Formula. Bangkok, Thailand: Ministry of Energy - Energy
Policy and Planning Office (EPPO); 2012.
[78] PTIT. Facts about Natural Gas in Thailand. Bangkok, Thailand: Petroleum Institute of Thailand (PTIT);
2012.
[79] UNFCCC. Guidelines on the Assessment of Investment Analysis. Bonn, Germany: United Nations
Framework Convention on Climate Change (UNFCCC); 2010.
[80] Ondraczek J, Komendantova N, Patt A. WACC the Dog: The Effect of Financing Costs on the Levelized
Cost of Solar PV Power. Hamburg, Germany: Working Paper FNU-201; 2013.
[81] Green Climate Fund. Business Model Framework: Objectives, Results and Performance Indicators.
GCF/B04/03, Available Online http://www.gcfund.net/fileadmin/00_customer/documents/pdf/B-
04_03_BMF_Objectives_Results_PerformanceIndicators_10Jun13.pdf 2013;4.
33
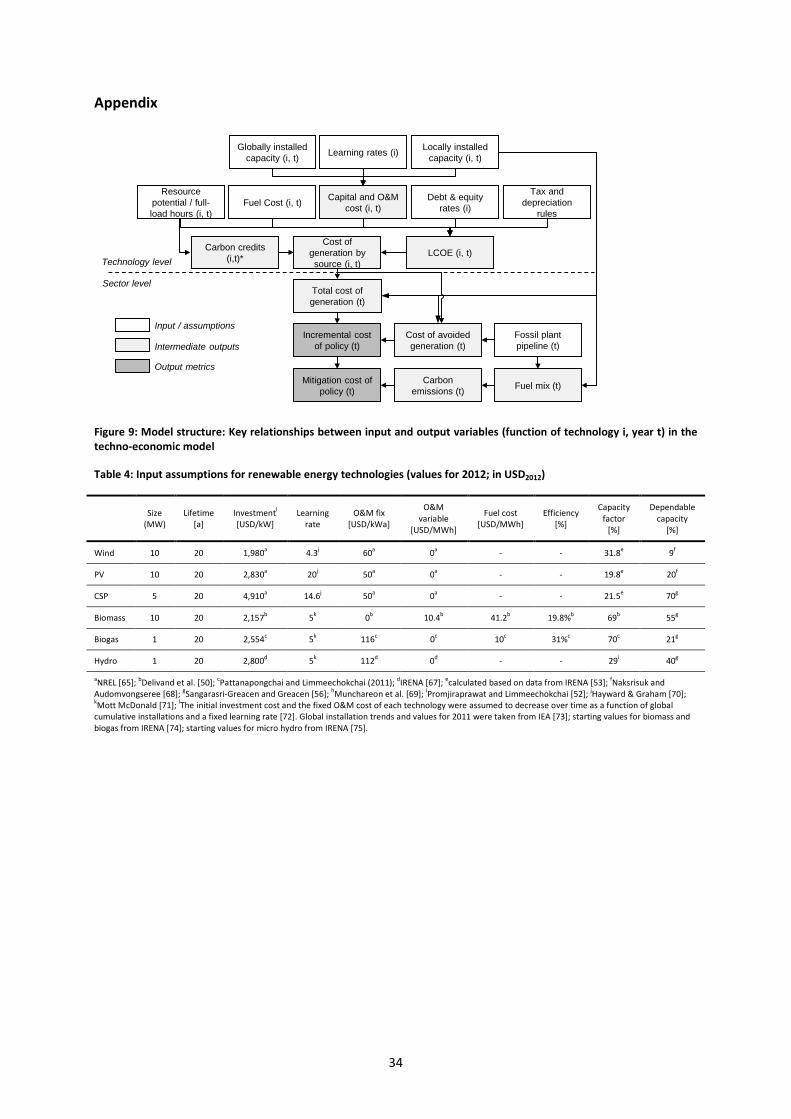
Appendix
Figure 9: Model structure: Key relationships between input and output variables (function of technology i, year t) in the techno-economic model
Table 4: Input assumptions for renewable energy technologies (values for 2012; in USD2012)
Size (MW)
Lifetime [a]
Investmentl [USD/kW]
Learning rate
O&M fix [USD/kWa]
O&M variable
[USD/MWh]
Fuel cost [USD/MWh]
Efficiency [%]
Capacity factor
[%]
Dependable capacity
[%]
Wind 10 20 1,980a 4.3j 60a 0a - - 31.8e 9f
PV 10 20 2,830a 20j 50a 0a - - 19.8e 20f
CSP 5 20 4,910a 14.6j 50a 0a - - 21.5e 70g
Biomass 10 20 2,157b 5k 0b 10.4b 41.2b 19.8%b 69b 55g
Biogas 1 20 2,554c 5k 116c 0c 10c 31%c 70c 21g
Hydro 1 20 2,800d 5k 112d 0d - - 29i 40g
aNREL [65]; bDelivand et al. [50]; cPattanapongchai and Limmeechokchai (2011); dIRENA [67]; ecalculated based on data from IRENA [53]; fNaksrisuk and Audomvongseree [68]; gSangarasri-Greacen and Greacen [56]; hMunchareon et al. [69]; iPromjiraprawat and Limmeechokchai [52]; jHayward & Graham [70]; kMott McDonald [71]; lThe initial investment cost and the fixed O&M cost of each technology were assumed to decrease over time as a function of global cumulative installations and a fixed learning rate [72]. Global installation trends and values for 2011 were taken from IEA [73]; starting values for biomass and biogas from IRENA [74]; starting values for micro hydro from IRENA [75].
Technology level
Sector level
LCOE (i, t)Cost of
generation by source (i, t)
Carbon credits (i,t)*
Cost of avoided generation (t)
Total cost of generation (t)
Incremental cost of policy (t)
Capital and O&M cost (i, t)Fuel Cost (i, t) Debt & equity
rates (i)
Fossil plant pipeline (t)
Globally installed capacity (i, t) Learning rates (i) Locally installed
capacity (i, t)
Resource potential / full-load hours (i, t)
Tax and depreciation
rules
Carbon emissions (t) Fuel mix (t)Mitigation cost of
policy (t)
Input / assumptions
Intermediate outputs
Output metrics
34

Table 5: Input assumptions for dispatchable fossil fuel technologies (values for 2012; in USD2012)
Table 6: Different pathways for natural gas prices 2010-2050 in Thailand. Starting values are taken from PTIT [78]; trend scenarios are adopted and extrapolated from IEA [57], and applied to the starting values.
Starting price Trend scenario 2010 2015 2020 2025 2030 2035 2040 2045 2050
LNG import price
450 degree 6.95 7.52 7.58 7.58 7.64 7.64 7.64 7.64 7.64
New policies 6.95 7.71 8.15 8.47 8.78 9.03 9.29 9.54 9.79
Current policies 6.95 8.02 8.53 8.97 9.35 9.60 9.86 10.11 10.36
Average import price
450 degree 8.38 9.06 9.14 9.14 9.22 9.22 9.22 9.22 9.22
New policies 8.38 9.29 9.83 10.21 10.59 10.89 11.20 11.50 11.81
Current policies 8.38 9.67 10.28 10.82 11.27 11.58 11.88 12.19 12.49
Average price
450 degree 14.61 15.81 15.94 15.94 16.08 16.08 16.08 16.08 16.08
New policies 14.61 16.21 17.14 17.80 18.47 19.00 19.53 20.06 20.59
Current policies 14.61 16.87 17.94 18.87 19.66 20.19 20.73 21.26 21.79
Lifetime [a] Investmentg [USD/kW]
O&M fixed [USD/kWa]
O&M variable
[USD/MWh]
Fuel efficiency [%]
Fuel costh [cUSD/kWhth]
Capacity factor [%]
Carbon emissions
[tCO2e/MWh]
Subcritic. lignite 30 1,125a 38.91b 11.02b 35b 0.54d 90 1,159b
IGCC lignite 30 2,830c 50c 7.9c 46c 0.54d 90 882
Adv. nuclear 40 5,429c 91.65c 2.1c 33c 0.31d 90 21b
Gas turbine n/a n/a 7.21c 15.28c 31.4c 2.49e 30 631b
CCGT 30 1,006c 15.1c 3.21c 54c 2.49e 60 404b
Subcritic. coal n/a n/a 38b 0.04b 36b 1.39f 90 973b
Supercrit. coal 30 2,934c 31.18d 4.7d 39c 1.39f 90 782b
IGCC coal 30 3,784c 51.39c 8.45c 39c 1.39f 90 782b
Diesel turbine n/a n/a 12a 28.6a 22a 6.81d 30 808b
CCGT: combined cycle gas turbine; IGCC: integrated gasification combined cycle; aPattanapongchai and Limmeechokchai [66]; bPromjiraprawat and Limmeechokchai [52]; cDOE/EIA [76]; dEPPO [77];eprice for natural gas is for imports from Myanmar, from PTIT [78] fIEA [2]; gInvestment cost and fixed O&M are assumed to decrease by 2.0% p.a.; hFuel price reflect average natural gas prices, see section 4.4; n/a : Not needed because no new power plants in the pipeline
35

Table 7: Sector-wide assumptions in the model
Factor Assumption Source
Currency USD 2012 in real terms ---
Exchange rate 1 USD = 31.5 Thai Baht The World Bank
Inflation 2.5% Bank of Thailand
Equity/debt spilt 30/70 Current practice
Return on equity 11.2% real UNFCCC [79]
Lending rate 6.7% nominal Ondraczek et al. [80]
Loan tenor Half of investment lifetime Waissbein et al. [23]
Tax rate 30% Current practice
Depreciation Linear, max 5% p.a., min book value 5% Current practice
Discounting of public expenditures Equals 40-year bond yield of 4.43 % Thai Bond Market Associationa
ahttp://www.thaibma.or.th/yieldcurve/YieldTTM.aspx,; assessed on 4/3/2014
36