
INTERNATIONAL PUBLIC PROCUREMENT - Trade...
19
1 INTERNATIONAL PUBLIC PROCUREMENT: FROM SCANT FACTS TO HARD DATA Lucian Cernat and Zornitsa Kutlina-Dimitrova * ABSTRACT Public procurement is a negotiating area gaining in importance at multilateral and bilateral level, as evidenced by a brief review of procurement provisions in existing trade agreements. The size of procurement spending stands in most developed economies at double-digit percentage points of GDP. However, despite the size and importance of these markets, the factual information available to trade negotiators remains scarce. Although public procurement patterns (e.g. size of procurement markets, composition of procurement spending and level of government procurement) can be derived from traditional national accounts statistics, these figures fall short of capturing the international dimension of public procurement. Hence, the paper puts forward a basic conceptual framework for data collection on public procurement that would best serve the future negotiating agenda in this area. * Lucian Cernat is the Chief Economist of DG TRADE of the European Commission. Zornitsa Kutlina- Dimitrova is senior economist in the Chief Economist and Trade Analysis Unit of DG TRADE. The opinions expressed in this article are the authors’ own and do not necessarily reflect the views and opinions of the European Commission. The authors would like to thank Desislava Borisova for data analysis of the WTO list of all RTAs and to their colleagues in DG TRADE for comments and fruitful discussions. Issue 1 April 2015 For further information: ISSN 2034-9815
-
Upload
vuongquynh -
Category
Documents
-
view
216 -
download
3
Transcript of INTERNATIONAL PUBLIC PROCUREMENT - Trade...

1
INTERNATIONAL PUBLIC PROCUREMENT:
FROM SCANT FACTS TO HARD DATA
Lucian Cernat and Zornitsa Kutlina-Dimitrova*
ABSTRACT
Public procurement is a negotiating area gaining in importance at multilateral and
bilateral level, as evidenced by a brief review of procurement provisions in existing trade
agreements. The size of procurement spending stands in most developed economies at
double-digit percentage points of GDP. However, despite the size and importance of
these markets, the factual information available to trade negotiators remains scarce.
Although public procurement patterns (e.g. size of procurement markets, composition of
procurement spending and level of government procurement) can be derived from
traditional national accounts statistics, these figures fall short of capturing the
international dimension of public procurement. Hence, the paper puts forward a basic
conceptual framework for data collection on public procurement that would best serve
the future negotiating agenda in this area.
* Lucian Cernat is the Chief Economist of DG TRADE of the European Commission. Zornitsa Kutlina-
Dimitrova is senior economist in the Chief Economist and Trade Analysis Unit of DG TRADE.
The opinions expressed in this article are the authors’ own and do not necessarily reflect the
views and opinions of the European Commission. The authors would like to thank Desislava
Borisova for data analysis of the WTO list of all RTAs and to their colleagues in DG TRADE for
comments and fruitful discussions.
Issue 1
April 2015
For further
information:
ISSN 2034-9815

2
The combination of large share of
government expenditures in GDP and
the ‘home bias’ characteristics makes
public procurement one of the few
fields in which liberalisation efforts at
international level have substantial
untapped potential.
1. INTRODUCTION
Public procurement is a major component of public spending, with a sizable impact on total demand
of any domestic economy. Public procurement expenditures represent about one third of total
government expenditures in OECD countries. In 2013, in GDP terms, government procurement
expenditures as measured in national accounts amount to an average of almost 14% of GDP in the
European Union and to more than 10% of GDP in the US.2 But the actual public procurement spending
is in reality higher as these national accounts aggregates do not include procurement spending of public
utilities providers. For example, in the EU the total public procurement spending (including state-owned
enterprises) accounted for €2.4 trillion, corresponding to nearly 19% of EU GDP in 2011.3
Around the world, historically, public procurement
contracts have to a large extent benefitted domestic
companies, thus ensuring a safe market for local suppliers of
goods and services. However, at the same time
policymakers and academics strive to come up with the best
procurement procedure that would maximize the efficiency
of this complex process.4 This preference for domestic
producers, the so called ‘home bias’, raises serious efficiency considerations. It can significantly distort
trade flows and international specialisation, particularly in sectors characterized by a large share of
public consumption in total demand and in sectors affected by monopolistic competition.5 Moreover,
domestic preferences in government procurement such as ‘buy national’ provisions may alter
international companies’ outsourcing choices and significantly affect production decisions along global
2 See OECD statistics, available at: http://stats.oecd.org/, web access 5 December 2014.
3 See also the EU official submission to the WTO reported under Article XIX:5 of the GPA agreement, available
online at http://www.wto.org/english/tratop_e/gproc_e/notnat_e.htm#statPro.
4 See for instance Saussier and Tirole (2015) for an insightful analysis of the various public procurement
procedures available at EU and national level and the need to reinforce their efficiency.
5 See Trionfetti, F. (2000).

3
A growing number of recent free
trade agreements (FTAs) contain
legally binding public procurement
provisions with various degrees of
liberalization ambition.
The lack of such basic statistics
negatively affects also the
implementation and monitoring
efforts of existing agreements.
value chains. Empirical evidence of the presence of this home bias is provided in a series of studies.6 The
combination of large share of government expenditures in GDP and the ‘home bias’ characteristics
makes public procurement one of the few fields in which liberalisation efforts at international level have
substantial untapped potential, and thus an area of growing importance in international negotiations.
Liberalisation efforts in the area of government
procurement at multilateral level started as early as 1979
leading to the adoption of the plurilateral Government
Procurement Agreement (GPA) under the aegis of the WTO.
However, only a small set of countries undertook binding
commitments to open their procurement markets for foreign goods and service suppliers. In recent
years, the importance of liberalizing public procurement markets was recognized not only as part of the
GPA negotiations but also in a bilateral/regional context. A growing number of recent free trade
agreements (FTAs) contain legally binding public procurement provisions with various degrees of
liberalization ambition.
Despite gradual improvements in the openness level of public procurement markets for GPA
members and many FTA partners, a large number of WTO members are not part of the GPA. It is still fair
to say that by and large public procurement markets around the world are yet to become part of future
liberalisation rounds.
There are many intrinsic and political economy reasons
why public procurement (alongside other economic
activities) is less prone to internationalisation. However,
unlike other negotiating areas where sometimes progress is
difficult, public procurement negotiations are fraught with
an additional difficulty: the lack of often basic, comparable information that renders the negotiating
process even more complex (e.g. market size, cross-border share of foreign companies participation and
geographical breakdown, a clear taxonomy of barriers and their restrictiveness level). The lack of such
basic statistics negatively affects also the implementation and monitoring efforts of existing agreements.
6 See Shingal, A. (2015), Shingal, A. (2011), Brülhart, M. and Trionfetti, F. (2001).
4
Given the importance of having accurate data on public procurement and a common analytical base,
one of the main aims of this paper is to suggest ways on how to deal with this lack of sound analytical
framework that is needed for successful procurement negotiations and implementation efforts. The
paper goes further and argues that negotiating partners need to frontload this analytical infrastructure
as part of their current and future negotiating agenda. It also puts forward an empirically-driven
conceptual approach on how to structure and adapt this future data collection efforts in order to
identify existing barriers to international public procurement, with a view to address them in future
negotiations.
The rest of the paper is organized as follows: Section 2 takes account of the importance of
government procurement provisions at the multilateral and EU level, inter alia by reviewing the public
procurement disciplines found in the RTAs announced to the WTO. Using national accounts statistics,
Section 3 describes public procurement patterns in terms of size of procurement markets, composition
of procurement spending and level of government procurement. Section 4 puts forward a basic
conceptual framework for future data collection on public procurement that would best serve the future
negotiating agenda in this area. Finally, Section 5 concludes and identifies a straightforward set of
priorities for this important policy area.
2. THE INTERNATIONALISATION OF PUBLIC PROCUREMENT
2.1. THE MULTILATERAL DIMENSION OF PUBLIC PROCUREMENT
At multilateral level government procurement is negotiated under the aegis of the WTO.
Liberalisation efforts in this area started in 1979, when the so-called “Tokyo Round Code on
Government Procurement” was signed. A decade later, the agreement was amended and in 1994 joint
efforts of the negotiating countries led to the “Agreement on Government Procurement”, which was
signed on the same date as the agreement establishing the WTO. Further liberalisation efforts in the
area of government procurement in a plurilateral context led to the entry into force of the revised GPA
on 6 April 2014. The "GPA II" is characterized by an extended scope, as a number of additional
government entities has now been included. The coverage of the revised GPA has been enlarged as well

5
by adding new services and public procurement activities. The gains from the extended GPA are
assessed to be ranging from US$ 80 to 100 billion annually.7
The GPA also contains binding provisions on collection and submission of statistical data on
government procurement by the GPA Member States, pursuant to Article XIX:5. This data reporting
requirement is supposed to cover the number of contracts awarded and a breakdown of the award
value by government entities and type of contract i.e. works, services and supplies.8 In addition, the GPA
data submissions by members should provide information on cross-border purchases and the country of
origin of the purchased goods and services.9 Despite these GPA provisions the process of data collection
and submission has not functioned well, as also acknowledged by the WTO Secretariat.10 For instance,
there are GPA countries that have never submitted a statistical report (such as Israel and Iceland) or
countries for which the latest report submitted dates a few years back, as in the case of the US to 2008.
Even more important, in an international context, is the fact that the cross-border dimension of the
submitted data is scarce. Looking at the GPA members who have submitted a statistical report, only two
of them have provided information on cross-border procurement purchases in recent years: Japan and
Chinese Taipei. There is information on the cross-border dimension of government procurement
submitted by the EU, Switzerland and Korea but it dates back to 2007 and 2003, respectively.
Apart from the fact that information on cross-border procurement expenditures is outdated, even
where such information is available it covers in general only few countries of origin. In the case of Japan,
for example, a breakdown is provided for government procurement purchases from five countries and
the rest of the world. The most complete information on the origin of the goods and services purchased
by governments abroad is submitted by Korea and includes cross-border procurement from 14 countries
and the rest of the world in 2003.
7 See WTO (2014a), Annual Report 2014, Geneva.
8 This requirement applies only for procurement covered by the GPA agreement. Note that obligations may
differ across GPA annexes.
9 The revised GPA has amended the obligation to provide cross-border statistics to the extent that such
statistics is available.
10 See WTO (2014b), Statistics reports under Article XIX:5 of the GPA, http://www.wto.org/english/tratop_e/
gproc_e/ gpstat_e.htm, web access on 8 December 2014.

6
The fact that the data on cross-border government procurement is so scarce makes any attempt to
analyse the economic impact of liberalisation efforts in this area an ambitious challenge. This applies not
only to an economic impact assessment of market opening in public procurement at multilateral level
but also to identifying economic benefits of public procurement provisions in bilateral FTAs.
The latter is crucial also because there is a trend showing an increased importance of government
procurement provisions in regional trade agreements (RTAs). Analysing all RTAs announced to the WTO
in terms of stand-alone public procurement provisions (a chapter or an article for example) shows that,
until the year 2000, out of all agreements announced to WTO only 17 had separate legal provision on
procurement (Figure 1).11
Figure 1: Public procurement provisions in RTAs
Source: Authors' calculations, based on WTO RTA database.
11 For this analysis the WTO list of all RTAs was used. All agreements are available at
http://rtais.wto.org/UI/PublicAllRTAList.aspx. Thereof the agreements on Custom Unions were excluded.
Web access on 8 December 2014.

7
The importance of bilateral
negotiations in the area of public
procurement has increased
substantially and has yet to play a
major role in upcoming EU trade
negotiations.
Since the year 2000 until today the amount of agreements with a stand-alone procurement article
or chapter almost quadrupled, reaching 88 FTAs. This shows that negotiating countries are aware of the
importance and untapped potential of cross-border procurement markets and are willing to increase
market opening and/or improve transparency provisions.
2.2. GOVERNMENT PROCUREMENT IN EU’S FTAS
Since 1970 the EU has announced 40 FTAs to the WTO,
out of which 36 have already entered into force.12 Analysing
these FTAs against the background of having a separate
chapter or article on government procurement shows that
until 2000 none of 13 RTAs signed had an stand-alone
chapter or article on public procurement. 13 Since 2000
however, out of the 24 EU FTAs 13 had a separate public procurement provision; this corresponds to a
share of 54%. Out of these 13 EU FTAs containing separate public procurement provisions 9 have
dedicated a chapter on public procurement and the remaining 4 contain a stand-alone article on
government procurement.14
This growing trend shows that the importance of bilateral negotiations in the area of public
procurement has increased substantially and has yet to play a major role in upcoming EU trade
negotiations, as this is a key negotiating area in the Transatlantic Trade and Investment Partnership with
the US (TTIP).
12 See WTO (2014), List of all RTAs, last updated on: Thursday, December 4, 2014, Web access on 8 December
2014 at http://rtais.wto.org/UI/PublicAllRTAList.aspx. The four EU agreements which have been negotiated
but are yet to be notified are: Canada, Singapore, SADC and West Africa. They have been included in the data
analysis of this sub-section.
13 The agreements between the EU and Israel and the EU and Korea were not considered as having a separate
public procurement provision as both are members of the GPA and the procurement provision mentioned in
the FTA refers to the GPA.
14 For this analysis ‘Titles’ in RTAs are considered as Chapters.

8
3. CHARACTERISTICS OF PUBLIC PROCUREMENT MARKETS
This Section 15 aims at quantifying the size, the composition and the level of government
procurement. The data source used for this purpose is EUROSTAT and OECD national accounts
statistics. The advantage of using national accounts lies in the cross-country comparability of the data,
as national statistics authorities follow the same methodology by collecting and reporting the data.16
However as already mentioned these public procurement aggregates do not include procurement
spending of state-own corporations, such as state-owned utilities and therefore the sizes of the market
is underestimated in countries where utilities providers are state-owned. Public procurement as
measured by the OECD and in this section comprises intermediate consumption (e.g. government
expenditures on IT systems or stationary), social transfers in kind via market producers (e.g. medical
expenses ultimately refunded by national social security systems) and gross fixed capital formation
(infrastructure expenditures on building new roads for example).17 The data covers the most recent
year 2012 for which data for almost all OECD and all EU Member States is available.
3.1. SIZE OF PROCUREMENT MARKETS BASED ON NATIONAL ACCOUNTS DATA
In 2012 the size of the government procurement markets ranged from nearly 23% of GDP in the
Netherlands to 8% in Switzerland (Figure 2). Public procurement expenditures in GDP terms are
particularly high in Finland (18%), Sweden (16%), Japan (16%), Denmark and France (15%). In the US,
government procurement spending accounts for nearly 11% and in Canada for 14% of GDP.
In 2012 the average procurement spending in the Euro-area stands at almost 14% and for the
sample of countries presented in this section at 15% (Figure 2). This shows the significant importance of
public procurement entities as buyers of goods and services in an economy. Converted in absolute
values the size of these public procurement markets accounts for nearly €1.8 trillion in the EU, nearly
15 The public procurement data analysed in this Section does include total procurement spending at all levels:
central, state and local. It does not however include expenditures of state-own corporations, such as state-
owned utilities provides.
16 See OECD (2013).
17 Note that government procurement as accounted for in national accounts may be overestimated as the above
mentioned categories may include non-procurement government expenditures, OECD (2011).

9
€1.3 trillion in the Euro-area and $1.7 trillion in the US in 2012. If there was any doubt, the magnitude of
these figures also shows the importance of achieving cost-efficiency in government spending.
For example in the EU, policy measures which would help achieving savings on procurement
expenditures of 10 percent would result in an efficiency gain of almost 1.4% of GDP, the equivalent of
around €180 billion.
Figure 2: Public procurement in % of GDP, in 2012 and 2002
Source: EUROSTAT, OECD National Account Statistics, own calculations, web access 5 December 2014.*No
complete data on Australia, Chile and Turkey. There is no data for the EU for the year 2002.
In this respect an interesting analysis shows that the procurement costs decrease as the number of
bidders for a contract increases and especially so if the number of bidders goes beyond 5.18
Consequently, policy measures which would foster international competition on government
procurement markets, increase transparency of tendering procedures and insure non-discrimination
among bidders would induce cost savings with significant impact in terms of magnitude on the entire
economy.
Compared to 2002 procurement spending in relation to GDP increased in the Euro-area by 9% and
by 3% on average of the country sample included in Figure2. Government purchases increased the most
18 See McAffee, R. and McMillan, J. (1989).

10
In OECD countries, the share of public
procurement expenditure in total
government expenditure amounts to
around 30%.
in Finland by 31% and in Netherlands and Denmark by 24%. However, there are a few countries in which
procurement spending decreased in the 10 years period considered here. The largest decrease took
place in Ireland (15%) and Iceland (8%).
Government procurement purchases account for a
considerable amount not only of GDP but also of total
government expenditure. In OECD countries, the share of
public procurement expenditure in total government
expenditure amounts to around 30%.19
3.2. COMPOSITION OF PUBLIC PROCUREMENT
Comparable cross-country data about government procurement expenditures on aggregate
categories is of great importance for assessing public spending by broad categories. Figure 3 provides
information on the composition of the three government procurement aggregates: intermediate
consumption, gross fixed capital formation and social transfers in kind.
In general, intermediate consumption (i.e. government purchases of goods and services) is the most
important government procurement expenditure (Figure 3). Looking at the average of the countries
included in the sample, intermediate consumption accounts for 50% of total procurement purchases
and for 49% in the EU. Intermediate consumption expenditures as a share of total procurement
expenditures however vary widely across the countries considered here. In Iceland and the UK,
procurement of goods and services accounts for 85% of total expenditures (Figure 3). Canada and the
United States are other examples of countries with high intermediate consumption expenditures shares
of 69% and 66% respectively. On the other side of the spectrum, intermediate consumption accounts for
only 26% in Japan, 28% in Belgium, 31% in Germany and Luxemburg.
The second most important component of public procurement spending is social transfers in kind
via market producers. Calculating a simple average of the countries included in Figure 3 shows that 26%
of total procurement is spent on social transfers. For the EU as a whole the proportion of social transfers
is higher and stand at 34% in 2012, reflecting the larger weight of the European social system as
compared to the average of the countries considered here. Also in terms of this category of
19 See OECD (2013).

11
procurement expenditures there are substantial differences across countries. At the same time
government purchases of goods and services produced by companies and offered to households (e.g.
medical care or special equipment) reaches 56% in Belgium, 54% in Japan, 53% in Germany and 52% in
the Netherlands (Figure 3).
Figure 3: Public procurement composition by category, 2012
0%
10%
20%
30%
40%
50%
60%
70%
80%
90%
100%
Ice
lan
d
Un
ite
d K
ingd
om
Can
ada
Un
ite
d S
tate
s
De
nm
ark
Fin
lan
d
Swit
zerl
and
Hu
nga
ry
Spai
n
Slo
ven
ia
Me
xico
Swe
de
n
No
rwa
y
Ital
y
Ire
lan
d
Gre
ece
Latv
ia
Esto
nia
Au
stri
a
Ne
w Z
eal
and
Po
lan
d
Po
rtu
gal
Slo
vak
Re
pu
blic
Ko
rea
Fran
ce
Cze
ch R
ep
ub
lic
Ne
the
rla
nd
s
Ge
rma
ny
Luxe
mb
ou
rg
Be
lgiu
m
Jap
an
EU
Intermediate consumption Social transfers in kind Gross fixed capital formation
Source: EUROSTAT, OECD National Account Statistics, own calculations, web access 5 December 2014. *No
complete data on Australia, Chile and Turkey.
The third public procurement component discussed in this section is government spending on gross
fixed capital formation.20 The data presented in Figure 3 shows that it is an important component of
public procurement expenditures. Calculating a simple average of fixed capital formation expenditures
of the countries presented in Figure 3 points to a share of 24% in total public procurement spending and
of 17% in the EU.
The countries with the highest spending on gross fixed capital formation in 2012 are Mexico (44%),
Estonia and Korea (38%), and Poland (37%). This may be an indication that these countries were in the
process of building up and extending infrastructural capacities. Latvia, the Netherlands, Germany,
Iceland and the United Kingdom on the other hand are countries in which government procurement of
20 Gross fixed capital formation is the annual acquisition of capital less the sales of fixed assets.
12
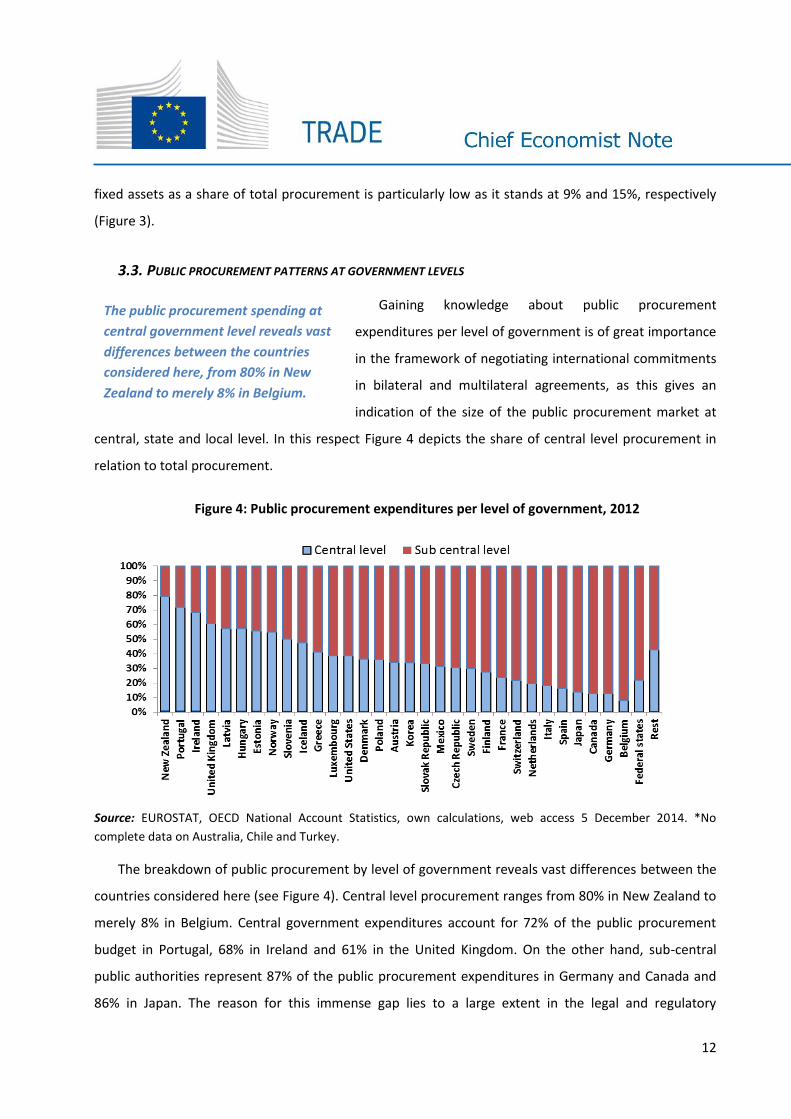
The public procurement spending at
central government level reveals vast
differences between the countries
considered here, from 80% in New
Zealand to merely 8% in Belgium.
fixed assets as a share of total procurement is particularly low as it stands at 9% and 15%, respectively
(Figure 3).
3.3. PUBLIC PROCUREMENT PATTERNS AT GOVERNMENT LEVELS
Gaining knowledge about public procurement
expenditures per level of government is of great importance
in the framework of negotiating international commitments
in bilateral and multilateral agreements, as this gives an
indication of the size of the public procurement market at
central, state and local level. In this respect Figure 4 depicts the share of central level procurement in
relation to total procurement.
Figure 4: Public procurement expenditures per level of government, 2012
Source: EUROSTAT, OECD National Account Statistics, own calculations, web access 5 December 2014. *No
complete data on Australia, Chile and Turkey.
The breakdown of public procurement by level of government reveals vast differences between the
countries considered here (see Figure 4). Central level procurement ranges from 80% in New Zealand to
merely 8% in Belgium. Central government expenditures account for 72% of the public procurement
budget in Portugal, 68% in Ireland and 61% in the United Kingdom. On the other hand, sub-central
public authorities represent 87% of the public procurement expenditures in Germany and Canada and
86% in Japan. The reason for this immense gap lies to a large extent in the legal and regulatory

13
architecture of the countries considered here. Figure 4 shows that in general federal states have
significantly larger sub-central level procurement compared to the rest of the countries. Indeed, local
and state procurement of federal states like Belgium, Germany, Canada, Spain, Switzerland, Mexico and
the United States account on average for 78% of total national public procurement, whereas the
average for the rest of the countries lies at 57%. The spending at central level of non-federal countries is
more than twice as high as the central level spending of federal countries.
Nonetheless, some non-federal states such as Japan, Italy and the Netherlands also have high
spending ratios at sub-central level.
4. INTERNATIONAL PUBLIC PROCUREMENT: MODALITIES OF DELIVERY
The previous section has illustrated the existing statistical information on public procurement that
can be derived from national accounts and data on overall public spending, essentially across OECD
countries. Based on this standard source of data, one can derive a handful of useful indicators, e.g.
public procurement market size, distribution of spending between central and sub-central level,
expenditure patterns, etc.
However, these national account figures do not provide information on international public
procurement. The reason for this is the fact that many countries do not systematically make available
such figures across various agencies, levels of government and type of contracts. In a number of
economies such information nevertheless exists.
One of the best known examples is the EU Tender Electronics Daily (TED) database. The TED
database is part of the e-procurement system across Europe that allows for the electronic publication of
public tenders and awards for services, public works, and supplies as well as for other types of public
contracts and projects (e.g. projects financed by the European Investment Bank, EBRD, and also external
aid projects).21 22 The TED structure contains very important information for international public
procurement negotiations: it identifies the administrative level of the contracting authority (central
versus sub-central) and the service or product sought based on the so-called Common Procurement
21 The TED database covers not only EU Member States but also EEA countries and Switzerland.
22 A recent paper by Kutlina-Dimitrova and Lakatos (2014) analyses the determinants of direct cross-border
public procurement by using inter alia TED data.

14
Like in the case of services trade,
public procurement purchases
(irrespective of the type of contract
i.e. works, supplies, etc) can take
place under different modalities.
Vocabulary (CPV), a common and recognised classification. It also contains inter alia the country and
address of the contractor, the number of offers received, the final value of the award, the type of
procedure, and the award criteria. 23
While this is a major enhancement in terms of the cross-
border dimension compared to public procurement statistics
derived from national accounts, there is scope for
considerable improvement. In order to identify the most
important missing elements that would be needed in an
international negotiation on public procurement (and its
subsequent monitoring and implementation) one has to consider the complexity of today's global
economy and to draw inspiration from the way in which goods and services are delivered across the
border in a non-public procurement context.
When looking at the international public procurement transactions through this new lens, several
important additional elements become apparent, if one wants to capture the various ways in which
'home bias' and discriminatory policies hamper the internationalization of public procurement.
The first dimension that needs to be taken into account when trying to generate statistics relevant
for international public procurement negotiations is the "value-added" dimension reflecting the
existence of global supply chains.24
The second important element that needs to be considered are the so called "modes of supply", a
concept already widely used in services negotiations. 25 Like in the case of services trade, public
procurement purchases (irrespective of the type of contract i.e. works, supplies, etc) can take place
23 A growing number of countries, both developed and developing, have started to adopt comprehensive e-
procurement systems covering similar types of data (or parts thereof) as the TED system.
24 See for instance the EU-sponsored World Input-Output Database (WIOD), the OECD-WTO Trade in Value
Added (TiVA) database and the associated literature for a comprehensive set of international trade in value-
added indicators for both goods and services.
25 A recent paper argues that ‘modes of supplies’ have to be considered also in other trade areas (e.g. custom
valuation) as there is large amount of services traded embodied into goods, see Cernat, L. and Kutlina-
Dimitrova, Z. (2014).

15
under different modalities. One can think of an infrastructure project involving either setting up a new
4G mobile telecom network, or a new power grid, a railway upgrade or simply a new building. In all
these cases foreign companies can participate through various channels and ways of bidding, either
directly from abroad or through local subsidiaries. In doing so, they will use a combination of domestic
and imported goods and services needed for the public project. Alternatively, foreign companies can be
subcontractors or merely suppliers of certain parts and/or intermediate services to a domestic company
that will carry out the project.
Thus, one can differentiate between three key dimensions of international public procurement: (i)
the nationality of the bidding firm, (ii) the location of the bidding firm (e.g. located abroad or a domestic
subsidiary of a foreign firm), and (iii) the purchase of foreign value-added along the supply chain,
irrespective of the location and nationality of the companies winning the public tender. Based on these
key dimensions one can distinguish 3 main modalities of international public procurement of goods and
services:
Direct cross-border international procurement: a foreign company submitting a bid and
winning "from abroad".
Commercial presence procurement: a domestic subsidiary of a foreign company wins “locally"
the public contract.
"Value-added" indirect international procurement: a foreign company participates indirectly
with parts and components (goods and services) without necessarily being part of the winning
bid. In this case the foreign company may supply goods and services to a domestic company
winning the bid or to another foreign company that received the public contract.
Equipped with this simple set of international procurement modalities one can make better sense of the
scant data currently available. Take the TED data for instance analysed in Kutlina-Dimitrova and Lakatos
(2014). This data only covers the direct cross-border public procurement contracts and does not
distinguish specifically the international procurement trough commercial presence, e.g. the public
contracts won across EU by domestic subsidiaries of foreign firms in Europe. Similarly, neither does the
TED database (nor probably any other similar e-procurement platforms in other countries) capture the
"value-added" international procurement, since there is not a systematic assessment of the foreign
value-added content in the final basket of goods and services purchased by public authorities.

16
For a number of reasons, the value of
commercial presence public
procurement could be significantly
higher than the one for direct cross-
border procurement.
Therefore, the very few papers that tried to quantify the foreign penetration of public procurement
markets severely underestimate the actual openness, since they capture essentially one mode of supply
and only a part of the total international procurement.
The existing anecdotal evidence and the various case
studies carried out in the past seem to suggest convincingly
that, for a number of reasons, the value of commercial
presence public procurement would be significantly higher
than the one for direct cross-border procurement.26
On the one hand, commercial presence public
procurement may be less subject to discriminatory
restrictions against foreign participation, whenever national treatment is granted to foreign affiliates
(like in the case of the EU procurement markets). On the other hand, there are good objective reasons
why commercial presence would be the preferred way of bidding, since given the complex technical
nature of certain procurement contracts, both contracting authorities and prospective companies value
proximity and local presence.
Value-added indirect procurement contracts also have certain specific characteristics. First, the GPA
distinguishes clearly between companies and their goods and services provided under public
procurement contracts. Therefore, the existing disciplines create a different set of rules when one looks
at the products and services delivered, as opposed to a "company-based" approach. Similarly, domestic
public procurement legislation subjects such value-added international participation to different rules
than the foreign companies themselves. For instance, a particular procurement contract may be only
open to domestic companies but it may put no restrictions on the purchase of key components (steel or
high-tech equipment) from foreign firms or on minimum local value-added. Conversely, government
procurement provisions may be very liberal vis-a-vis foreign companies but at the same time there
might be strong discriminatory ‘buy local’ restrictions on imported intermediate goods and services.
26 See Ramboll/HTW Huhr (2011).

17
The internationalisation of public
procurement should be a key
priority for trade negotiators,
given the significant size of public
procurement markets and the high
level of restrictions that still
persist.
Systematic data collection could enable
identification of the nature of the
procurement market restrictions and the
value of international procurement flows
for each mode of supply.
Therefore, two clear conclusions come out from this
conceptual taxonomy of different modalities of
international procurement. First, any statistical
indicators capturing openness in public procurement
needs to reflect the fact that foreign companies, as well
as their goods and services can become part of public
contracts abroad under different modalities of international procurement. Incomplete data and
definitive conclusions drawn based on only a subset of procurement modalities may lead to wrong
political perceptions and policy priorities.
Second, having such a comprehensive and structured approach to public procurement data
collection by modalities of delivery (both under the new GPA statistical work programme and as part of
bilateral trade negotiations) would allow a more informed debate about the different nature of
restrictions and barriers affecting each procurement mode of supply, and facilitate the implementation
of existing rules. Some countries may be more restrictive on one mode or the other. Other countries
may have an interest in trying to liberalize one mode or the other in a particular negotiation once more
systematic data collection enables identification of the nature of the procurement market restrictions
and the value of international procurement flows for each mode of supply.
5. CHALLENGES AND LOOKING AHEAD
The current paper tried to argue in favour of a rather straight forward point: the internationalisation
of public procurement should be a key priority for trade negotiators, given the significant size of public
procurement markets and the high level of restrictions that still persist, despite decades of attempts to
arrive at binding commitments and less discriminatory policies.
However, this task is made even more difficult by the
absence of a suitable factual basis for negotiations. In the
absence of hard data and clear indicators that measure existing
international procurement flows, the ‘home bias’ tendency and
pronounced offensive interests may hamper progress on new
more liberal procurement rules as well as monitoring and
implementation of existing procurement provisions.

18
Comparable and commonly accepted figures based on a solid methodology are also needed to build
consensus for new prospective members to understand what the benefits from participating in future
public procurement negotiations are.
All these tasks remain daunting but not impossible. For some modalities of international
procurement (e.g. value-added indirect participation) the figures would have to rely on estimates, as
opposed to other modalities of delivery (direct cross-border or commercial presence) where the actual
data can be collected during the procurement process.
A first step would be to agree on an international procurement data collection methodology that all
WTO members would be ready to apply in their domestic procurement legislation. The methodology
could be tested and fine-tuned based on some pilot cases, covering countries with different legal
systems and level of development. The data collection process in developing countries can be supported
by donors and other relevant international organisations (OECD, IMF, World Bank, UN agencies) with
benefits also for a number of other domestic policy objectives. As it happened in other trade and
investment areas, the policymakers and the academic community could join forces to put the basis for a
comparable and consistent data collection process that could eventually put public procurement on the
same level of analytical rigor and data availability as in WTO trade negotiations in the goods and services
areas.

19
REFERENCE
Brülhart, M. and F. Trionfetti (2001), Industrial Specialisation and Public Procurement: Theory and
Empirical Evidence, Journal of Economic Integration, 16, pp 106-127.
Cernat, L. and Kutlina-Dimitrova, Z. (2014), Thinking in a box: A 'Mode 5' approach to services trade,
Journal of World Trade, volume 48(6), pp 1109-1127.
Kutlina-Dimitrova, Z and Lakatos, C. (2014), Determinants of direct cross-border public procurement in
EU Member States, Chief Economist Note 2014-2.
McAfee, R. and McMillan J. (1989), Government Procurement and International Trade, Journal of
International Economics 26, pp 291-308.
OECD (2011), Government at a Glance 2011, OECD Publishing, Paris.
OECD (2011), National Accounts at a Glance 2011, OECD Publishing, Paris.
OECD (2013), Government at a Glance 2013, OECD Publishing, Paris.
Ramboll/HTW Huhr (2011), Cross-border procurement above EU thresholds, final report for the
European Commission, DG Internal Market and Services, Copenhagen.
Saussier, S. and Tirole, J. (2015), Renforcer l'efficacité de la commande publique, Note du Conseil
d'Analyse Economique, no. 22, April 2015.
Shingal, A. (2011), The WTO’s Agreement on Government Procurement: Whither Market Access? World
Trade Review, 10(4), pp 1-23.
Shingal, A. (2015), Econometric analysis of home bias in government procurement, Review of
International Economics, 23(1), pp 188-219.
Trionfetti, F. (2000), Discriminatory Public Procurement and International Trade, The World Economy,
23, pp 57-76.
WTO (2014a), Annual Report 2014, Geneva.
WTO (2014b), Statistics reports under Article XIX:5 of the GPA, http://www.wto.org/english/tratop_e/
gproc_e/gpstat_e.htm, web access on 8 December 2014.


