International Productivity Gaps and the Export Status of Firms ...7 Greenaway and Kneller (2007),...
40
INTERNATIONAL PRODUCTIVITY GAPS AND THE EXPORT STATUS OF FIRMS: EVIDENCE FROM FRANCE AND JAPAN Documents de travail GREDEG GREDEG Working Papers Series Flora Bellone Kozo Kiyota Toshiyuki Matsuura Patrick Musso Lionel Nesta GREDEG WP No. 2012-07 http://www.gredeg.cnrs.fr/working-papers.html Les opinions exprimées dans la série des Documents de travail GREDEG sont celles des auteurs et ne reflèlent pas nécessairement celles de l’institution. Les documents n’ont pas été soumis à un rapport formel et sont donc inclus dans cette série pour obtenir des commentaires et encourager la discussion. Les droits sur les documents appartiennent aux auteurs. The views expressed in the GREDEG Working Paper Series are those of the author(s) and do not necessarily reflect those of the institution. The Working Papers have not undergone formal review and approval. Such papers are included in this series to elicit feedback and to encourage debate. Copyright belongs to the author(s). Groupe de REcherche en Droit, Economie, Gestion UMR CNRS 7321
Transcript of International Productivity Gaps and the Export Status of Firms ...7 Greenaway and Kneller (2007),...

INTERNATIONAL PRODUCTIVITY GAPS AND THE EXPORT STATUS OF FIRMS: EVIDENCE FROM FRANCE AND JAPAN
Documents de travail GREDEG GREDEG Working Papers Series
Flora BelloneKozo KiyotaToshiyuki MatsuuraPatrick MussoLionel Nesta
GREDEG WP No. 2012-07http://www.gredeg.cnrs.fr/working-papers.html
Les opinions exprimées dans la série des Documents de travail GREDEG sont celles des auteurs et ne reflèlent pas nécessairement celles de l’institution. Les documents n’ont pas été soumis à un rapport formel et sont donc inclus dans cette série pour obtenir des commentaires et encourager la discussion. Les droits sur les documents appartiennent aux auteurs.
The views expressed in the GREDEG Working Paper Series are those of the author(s) and do not necessarily reflect those of the institution. The Working Papers have not undergone formal review and approval. Such papers are included in this series to elicit feedback and to encourage debate. Copyright belongs to the author(s).
Groupe de REcherche en Droit, Economie, GestionUMR CNRS 7321

January 31, 2014
International Productivity Gaps and the Export Status of Firms:Evidence from France and Japan∗
Flora Bellone† Kozo Kiyota‡ Toshiyuki Matsuura§ Patrick Musso¶ Lionel Nesta‖
Abstract
This paper provides new evidence on international productivity gaps; this evidenceis obtained from large-scale �rm-level data from the French and Japanese man-ufacturing industries using non-parametric methodologies designed to overcomecon�dentiality restrictions. Our primary �nding is that international productivitygaps are sensitive to the export status of �rms. We also show that productivitydi�erences between French and Japanese exporters vary across export destinations.We propose a simple analytical framework to relate those basic �ndings to thenew models of international trade with heterogeneous �rms. Under this frame-work, international �rm-level productivity comparisons provide new insights intothe importance of trade-related institutional and policy di�erences across countries.
Key words: International productivity gap; Exports; Firm heterogeneity; Trade costs;
Productivity distribution
JEL classi�cation code: F1, D24
Highlights
• We link international productivity gaps and export-participation rates.• We compare the distributions of �rm-level total factor productivity acrosscountries.• We �nd that international productivity gaps are sensitive to the export statusof �rms.
∗Abbreviations: BSJBSA: Basic Survey of Japanese Business Structure and Activities; EAE: Enquête
Annuelle d'Entreprises; FJ: France�Japan; FTA: Free Trade Agreement; GGDC: Groningen Growth Devel-opment Centre; GNS: Good, Nadiri and Sickles; INSEE: French National Statistical O�ce; ISGEP: Interna-tional Study Group on Exports and Productivity; KS: Kolmogorov�Smirno�; METI: Ministry of Economy,Trade and Industry; RIETI: Research Institute for Economy, Trade and Industry; SESSI: Research andStatistical Department of the French Ministry of Industry†Corresponding author: Université Nice Sophia Antipolis, GREDEG, UMR 7321, 250 rue Albert Ein-
stein, 06560 Valbonne, France. tel:+33 4 93 95 43 51‡RIETI and Keio Economic Observatory, Keio University, 2-15-45, Mita, Minato-ku, Tokyo 108-8345
Japan.§Keio Economic Observatory, Keio University, 2-15-45, Mita, Minato-ku, Tokyo 108-8345 Japan.¶Université Nice Sophia Antipolis, GREDEG, UMR 7321, OFCE, SKEMA Business School, 250 rue
Albert Einstein, 06560 Valbonne, France‖OFCE Sciences Po, SKEMA Business School, GREDEG UMR 7321, 60 rue Dostoïevski BP 85, 06902
Sophia-Antipolis Cedex, France.

1. Introduction
Are �rms from di�erent countries that compete in international markets closer in termsof e�cient productivity than purely domestic �rms? This question is non-trivial. On the onehand, if the productivity gap is closer between exporters from two di�erent countries thanbetween domestic �rms, it is important to enhance the productivity of domestic �rms to �llthe international productivity gap. On the other hand, if there are any systematic patterns inthe productivity gap between exporters from di�erent countries, we can relate internationalproductivity gaps to international factors such as trade costs, implying that a reduction oftrade costs is necessary to �ll the international productivity gaps.1 Such di�erences havedi�erent policy implications. While a number of studies attempted to relate internationalproductivity gaps to innovation activities such as research and development (R&D), untilknow, the relationship between international productivity gaps and international activitieshas been overlooked, at least for developed countries. This paper contributes to �lling thisgap by proposing a �rst investigation of the relationship between international productivitygaps and �rm export status across two industrialized countries, namely France and Japan.
Investigating productivity di�erences across �rms over di�erent countries is not a straight-forward exercise. On the empirical side, it requires the ability to compute reliable pro-ductivity estimates at the �rm level that are directly comparable across countries. Thismethodological challenge is serious enough to make international productivity comparisonsusing �rm-level data very scarce in the literature2. On the theoretical side, whereas it iswell established that a �rm's relative productivity is related to its export status withina country�industry, it is less obvious how this property expands to cross-country within-industry comparisons. Assume that countries di�er both in terms of their relative �rmproductivity distributions and in terms of their relative trade costs. Should we expect anysystematic patterns in terms of the productivity gaps across exporters (or non-exporters)from two di�erent countries within the same industry?
In this paper, we make the following three contributions. First, we present a frameworkof analysis in which in the presence of �rm heterogeneity and di�erentiated trade costsacross countries, �rm selection partly determines international productivity gaps. Second,we propose an empirical strategy that allows the comparison of reliable �rm-level total factorproductivity (TFP) indexes from large-scale �rm-level datasets (for which con�dentialityrestrictions apply). Finally, we reveal that a systematic pattern does indeed exist that relatesthe productivity gaps between French and Japanese �rms to their export status. Speci�cally,we show that the productivity gap between French and Japanese exporters is larger thanthe average industry gap in the industries in which Japan has a productivity advantageover France and smaller than the average industry gap in the industries in which Japan
1In this paper, trade costs will re�ect not only transportation costs, but also trade policy such as tari�and non-tari� barriers.
2Most of the recent literature investigating international productivity gaps from a �rm-level perspectiveaddresses allocative e�ciency issues but do not compare directly �rm performances across countries (see ?for one of the most recent contributions in this �eld.)
1

has a productivity disadvantage compared with France. Building on this basic �nding, weshow how productivity comparisons across exporting and non-exporting �rms from di�erentcountries can be used as a further test of relevance for the recent models of international tradeand heterogeneous �rms. In turn, we also show how international �rm-level productivitycomparisons can be used to provide useful insights into important trade-related institutionaland policy di�erences across countries, using a comparison between France and Japan as acase study.
Our motivation for this research comes from two strands of the literature. The �rststrand is the literature on international productivity gaps, which is of central interest invarious research �elds such as industrial organization and growth theory. Numerous studieshave attempted to measure international productivity gaps, relying on country-, industry-,or �rm-level datasets.? in particular emphasized the importance of international produc-tivity comparisons at the �rm level. However, international productivity comparisons builtfrom �rm-level data have remained scarce and limited in scope. Some of the previous studieshave focused only on the average productivity of �rms.3 Some of the studies have focusedonly on large listed �rms, precluding the ability to address the issue of �rm export hetero-geneity because most of the listed �rms are exporters.4 Only a few of the previous studieshave provided comparisons of the entire distributions of �rm productivity.5 Finally, someof the previous studies relied on private data sources that are rich, but limited in scope.For instance, using the McKinsey Global Institute �rm-level database, ? computed severalindustry productivity gaps across the United States, Germany, Japan, and France, but onlyfor a limited number of industries.6
The other strand of literature is the study of �rm heterogeneity in international trade.With the growing number of studies on the relationship between �rm productivity andexports in various countries, we now know that, on average, exporters outperform non-exporters in terms of TFP.7 However, the previous studies on �rm heterogeneity and ex-ports lack the perspective o�ered by an international comparison. An exception is a studyby ISGEP(International Study Group on Exports and Productivity) (2008), which analysed
3For example, Griliches and Mairesse (1983) compared the average productivity of �rms in France andthe United States.
4Fukao et al. (2008a) compared the productivity of listed �rms in China, Japan, and South Korea.Fukaoet al. (2008b) extended the analysis, adding Taiwanese listed �rms.Lee and Fukao (2008) and Jung and Lee(2010) compared the productivity of listed �rms in Japan and Korea. All of these studies have focused onthe di�erence in the average productivity gap.
5Most notably, Aw et al. (2000) compared large-scale Korean and Taiwanese plant-level data, but theperiod is di�erent between the two datasets. Ahn et al. (2004) used Korean plant-level data and Japanese�rm-level data. Strictly speaking, therefore, some of the previous studies did not directly compare theproductivity of �rms (or plants) from two di�erent countries in the same industry�year.
6For France and Japan speci�cally, this previous study provides an estimate of the average productivitygap for the automobile industry only. Japanese �rms were shown to be, on average, twice as productive astheir French counterparts in this speci�c industry (see ?, p. 156, Table 2).
7Greenaway and Kneller (2007), Wagner (2007) , Wagner (2012), and Hayakawa et al. (2012) provideexcellent literature reviews on �rm heterogeneity and export behaviours.
2

the export premia of 14 countries.8 This study compared the export premia across coun-tries, but not the �rm-level productivity. Therefore, none of the previous studies directlycompared the productivity of exporters (or non-exporters) between two di�erent countries.
Both strands of research have made signi�cant contributions to the literature. However,the link between the two strands, namely the connection between �rm export heterogeneityand international productivity gaps, has not been explored yet. In this paper, we proposeto �ll this gap by investigating how international productivity gaps relate to �rms' exportstatus, using balance sheet information and the export status of all French and Japanese�rms operating with 50 or more employees in 18 narrowly de�ned manufacturing industries.
We proceed in two steps. In the �rst step, we provide a framework of analysis derivedfrom the recent models of international trade with heterogeneous �rms which allows to linkinternational productivity gaps to �rms' export status. In the second step, we implementa simple empirical strategy to reconcile the need for international comparisons of �rm-levelproductivity with the requirement of con�dentiality in �rm-level data. To build our empiricalstrategy, we rely on the Good et al. (1997) (GNS) productivity index method that we extendto overcome the speci�c issues of con�dentiality restrictions. We also adapt both parametrict-tests and non-parametric Kolmogorov�Smirno� (KS) tests of stochastic dominance to allowfor cross-country comparisons without merging the two country datasets into a unique set.9
This paper uses �rm-level datasets in France and Japan because these data have thefollowing advantages. First, the French and Japanese �rm-level data are highly comparablewith one another, which is a necessary prerequisite for estimating productivity level di�er-ences. This high degree of comparability allows us to construct two separate unbalancedpanel datasets with the same coverage: the same period, the same industries, the sameemployment threshold, and the same de�nition of inputs and output. Second, France andJapan are expected to exhibit substantial productivity gaps, at least in some narrowly de-�ned industries. Consequently, together they constitute a good case study to investigatewhether all �rms in an industry exhibit the same productivity advantage or disadvantageover their foreign counterparts, or alternatively, whether international productivity gaps aresensitive to �rm characteristics. Finally, France and Japan can also be expected to exhibitsubstantial relative trade cost di�erences. French �rms take advantage of being a memberof the European Union by which they can export at low cost. Japanese �rms instead mustincur signi�cant export costs because Japan still has free trade agreements (FTAs) with onlya limited number of countries.10
The rest of the paper is structured as follows. Section 2 develop a simple analyticalframework from which we derive testable propositions about the relationship between inter-national productivity gaps and the �rm export status that we then use as guidelines for our
8The ISGEP study included France, but not Japan.9Following Delgado et al. (2002) and Fariñas and Ruano (2005), our empirical analysis relies on the
concept of �rst-order stochastic dominance. Establishing stochastic dominance means that one cumulativedistribution lies to the right of another. Therefore, these tests go beyond the tests for di�erences in averageproductivity that are typically found in the international productivity gap literature.
10Section 6 will discuss this issue in more detail.
3
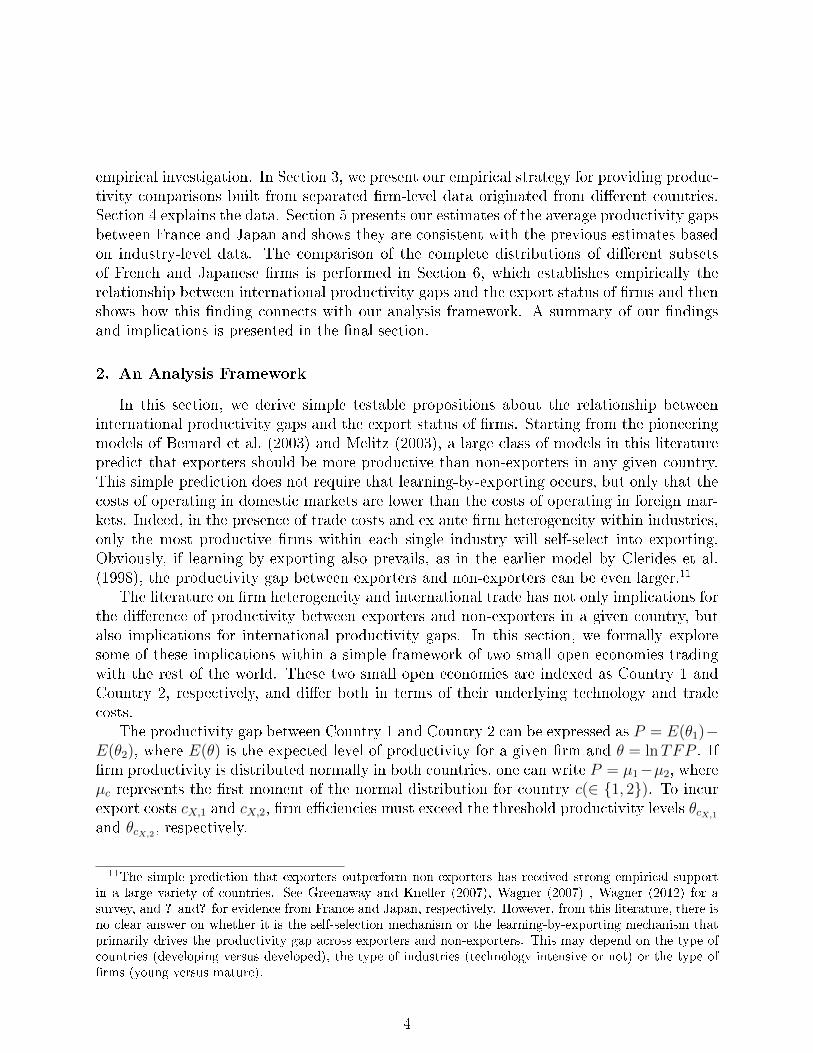
empirical investigation. In Section 3, we present our empirical strategy for providing produc-tivity comparisons built from separated �rm-level data originated from di�erent countries.Section 4 explains the data. Section 5 presents our estimates of the average productivity gapsbetween France and Japan and shows they are consistent with the previous estimates basedon industry-level data. The comparison of the complete distributions of di�erent subsetsof French and Japanese �rms is performed in Section 6, which establishes empirically therelationship between international productivity gaps and the export status of �rms and thenshows how this �nding connects with our analysis framework. A summary of our �ndingsand implications is presented in the �nal section.
2. An Analysis Framework
In this section, we derive simple testable propositions about the relationship betweeninternational productivity gaps and the export status of �rms. Starting from the pioneeringmodels of Bernard et al. (2003) and Melitz (2003), a large class of models in this literaturepredict that exporters should be more productive than non-exporters in any given country.This simple prediction does not require that learning-by-exporting occurs, but only that thecosts of operating in domestic markets are lower than the costs of operating in foreign mar-kets. Indeed, in the presence of trade costs and ex ante �rm heterogeneity within industries,only the most productive �rms within each single industry will self-select into exporting.Obviously, if learning-by-exporting also prevails, as in the earlier model by Clerides et al.(1998), the productivity gap between exporters and non-exporters can be even larger.11
The literature on �rm heterogeneity and international trade has not only implications forthe di�erence of productivity between exporters and non-exporters in a given country, butalso implications for international productivity gaps. In this section, we formally exploresome of these implications within a simple framework of two small open economies tradingwith the rest of the world. These two small open economies are indexed as Country 1 andCountry 2, respectively, and di�er both in terms of their underlying technology and tradecosts.
The productivity gap between Country 1 and Country 2 can be expressed as P = E(θ1)−E(θ2), where E(θ) is the expected level of productivity for a given �rm and θ = lnTFP . If�rm productivity is distributed normally in both countries, one can write P = µ1−µ2, whereµc represents the �rst moment of the normal distribution for country c(∈ {1, 2}). To incurexport costs cX,1 and cX,2, �rm e�ciencies must exceed the threshold productivity levels θcX,1
and θcX,2, respectively.
11The simple prediction that exporters outperform non-exporters has received strong empirical supportin a large variety of countries. See Greenaway and Kneller (2007), Wagner (2007) , Wagner (2012) for asurvey, and ? and? for evidence from France and Japan, respectively. However, from this literature, there isno clear answer on whether it is the self-selection mechanism or the learning-by-exporting mechanism thatprimarily drives the productivity gap across exporters and non-exporters. This may depend on the type ofcountries (developing versus developed), the type of industries (technology intensive or not) or the type of�rms (young versus mature).
4

For the sake of simplicity, we assume that �rm productivity is distributed normally in bothcountries 1 and 2.12 Let us denote G1(z1) and G2(z2) as the �rm productivity distributionsfor Country 1 and Country 2, respectively, where zc = (θcX ,c − µc)/σc and σc is the secondmoment of the normal distribution for country c. We assume that G1(z1) and G2(z2) aresuch that Country 1 bene�ts from an average productivity advantage over Country 2 asillustrated in Figure 1. We assume further that export costs in Country 1 are higher than inCountry 2: cX,1 > cX,2, where cX,1 and cX,2 are export costs incurred by �rms from Country1 and Country 2, respectively.
[Figure 1 about here.]
Under perfect sorting, all of the �rms exceeding the country-speci�c threshold values θcX,c
manage to export, whereas �rms failing to reach the threshold focus on the domestic market.This result implies that the mean of the exporters in a given country is as follows:
E(θc|θc,i > θcX ,c) = µc + σcφ(zc)
1− Φ(zc), (1)
where φ(.) and Φ(.) are the probability density function and the cumulative distributionfunction, respectively, of the standard normal. The usual z statistics must be interpreted,in this case, as the threshold productivity level relative to the productivity distribution ofthe country. In turn, (1 − Φ(zc)) provides us with the export-participation rate. Hence, ifz1 > z2, then (1− Φ(z1)) < (1− Φ(z2)): the relative export threshold of Country 1 exceedsthat of Country 2, then the participation rate of Country 1 is lower than that of Country 2.
Given this framework, the productivity gap between exporters from the two countries,PX , is as follows:
PX = E(θ1|θ1,i > θcX,1)− E(θ2|θ2,i > θcX,2
)
= (µ1 − µ2)︸ ︷︷ ︸=P
+σ1 ×(
φ(z1)1−Φ(z1)
− γ φ(z2)1−Φ(z2)
), (2)
where γ = σ2/σ1 represents the standard deviation of the productivity distribution of Coun-try 2 relative to Country 1. Equation (2) says that the productivity gap between exportersfrom two countries is equal to the overall productivity gap (µ1 − µ2), augmented with(φ(z1)/(1 − Φ(z1)) − γ(φ(z2)/(1 − Φ(z2)). The productivity gap between exporters fromtwo countries will be larger (smaller) if ( φ(z1)
1−Φ(z1)− γ φ(z2)
1−Φ(z2)) > 0, (resp., < 0). Assuming
γ = 1, one can show that φ(z)1−Φ(z)
is a monotonic transformation of z, so that the following
12Whereas this assumption does not hold in practice, our results suggest that �rm TFP distributions donot depart much from normal, as the t-tests produce results that are consistent with those obtained fromthe KS tests. Consequently, we take advantage of the simplifying normality assumption to derive a formalrelationship between the di�erentiated export threshold values and the relative productivity gaps.
5

holds:13
φ(z1)
1− Φ(z1)>
φ(z2)
1− Φ(z2)> 0 if z1 > z2. (3)
The above implies that the productivity gap between exporters PX will be larger (smaller)than the overall productivity gap P if the relative threshold value z1 is greater (smaller) thanz2: PX > P if z1 > z2.14 In turn, the relative threshold value z1 determines the participationrate of �rms in international trade. Hence, under perfect sorting, the productivity gapbetween exporters between Country 1 and Country 2 will exceed the overall productivitygap when the participation rate of Country 1 is lower than the participation rate of Country2.
Figure 1 illustrates this point. The �gure displays the �rm-level productivity distributionof two hypothetical countries, 1 and 2, with identical standard deviations, but with the meanvalue of the productivity of Country 1, E(θ1), lying to the right of the mean value of theproductivity of Country 2, E(θ2). Assume further that the relative export threshold valuez1 is higher than the relative export threshold value z2. This assumption implies that theexport-participation rate of Country 1 is lower than the export threshold value of Country2. This relationship is illustrated by the shaded areas of the two productivity distributions,which, under perfect sorting, display �rms that export to foreign markets. Figure 1 alsoshows the mean productivity of the exporters only. One easily observes that the productivitygap PX is larger than the overall productivity gap P , as a consequence of the relative exportthreshold value z, which is higher in Country 1 than in Country 2. Note that this mechanismcan be inverted to show that φ(z1)
1−Φ(z1)< φ(z2)
1−Φ(z2)if z1 < z2, which in turn implies that PX < P .
The above mechanism is consistent with a large class of models of international tradewith heterogeneous �rms. The mechanism states that in the presence of �rm heterogeneityand di�erentiated trade costs across countries, the �rm-selection e�ect partly determinesinternational productivity gaps. This mechanism could thus �t both Melitz (2003)-typemodels and Bernard et al. (2003)-type models. The mechanism is particularly consistent withthe models that explicitly feature country-speci�c trade costs such as Helpman, Helpmanet al. (2008) or the models that feature �rm heterogeneity, comparative advantage, andcountry-speci�c trade costs such as the Bernard et al. (2007) model.
Note that our approach focuses on the self-selection of more-productive �rms into export-ing. However, learning-by-exporting may also be an important mechanism in some countries,especially in developing countries. The implications we derived about the relationship be-tween relative productivity and relative trade costs across countries should be interpretedas a �rst approximation to countries where self-selection is a main source of the exportpremium.
13For the proof, see Appendix A.14The condition holds as long as the relative standard deviation γ exceeds φ(z1)
1−Φ(z1)/φ(z2)
1−Φ(z2) .
6

3. Empirical Methodology
We begin by describing how one can process internationally comparable TFP indicesat the �rm level. The di�culty is that, because of data-con�dentiality restrictions, onecannot simply merge the two datasets into one unique dataset. One must therefore developalternative methods to infer signi�cant di�erences between any two countries.
3.1. Multilateral �rm-level TFP indices for international comparisons
International comparisons of productivity have always been challenging because of thedi�culty of comparing data that are drawn from di�erent national sources. Above andbeyond the problems of currency conversion, of consistent industry classi�cations, and ofdata comparability, performing �rm-level comparisons adds one additional challenge: thecon�dentiality of individual data. As a rule, national statistical o�ces do not allow micro-level data to be merged with foreign datasets.15 In the case of France and Japan, both theFrench National Statistical O�ce (INSEE) for France and the Ministry of Trade, Economyand Industry (METI) for Japan impose these restrictions on the use of their comprehensivemicro-level datasets.
The issue of con�dentiality raises the challenge of estimating comparable TFP measureswithout pooling together �rm-level data from di�erent countries. For that purpose, thispaper proposes a non-parametric methodology based on the multilateral index number ap-proach developed by GNS.16 Our detailed methodology is presented in Appendix B.
For the purpose of international comparison, the productivity index method has severaladvantages. First, it allows for separate (but comparable) measures of individual TFP acrosscountries without requiring that the �rms share the same production technology.17 Second,as emphasized by Bartelsman et al. (2013), by taking the di�erence between the output(inputs) of each �rm and that of a hypothetical reference �rm in a given country, �rm- andcountry-speci�c factors are �di�erenced� out. Finally, a last advantage of the productivityindex method is that it is similar to the methodology implemented by the Groningen GrowthDevelopment Centre (GGDC). The GGDC has recently provided estimates of internationalTFP gaps, mainly at a detailed industry level, based on the recently compiled EU-KLEMSdatabase (for a description of the dataset, see O'Mahony and Timmer (2009). Implementinga similar methodology to the GGDC allows us to accurately check the consistency between
15Non-con�dential micro-level databases from private sources exist. See the Amadeus database, whichprovides �rm-level data for a very large number of �rms located in 41 di�erent European countries, forinstance. However, those datasets are usually less comprehensive than the �rm-level statistics collected bythe national o�ces.
16A number of studies on �rm export heterogeneity employ the multilateral index number approach. SeeAw et al. (2001), Aw et al. (2003), Girma et al. (2005), and ?, for example.
17On the �ip side, this non-parametric method is sensitive to measurement error (for more detail on therelative advantage of non-parametric and semi-parametric methodologies, see Biesebroeck (2007). As wewill discuss below, both the French and the Japanese data are from government statistics; these surveys arecompulsory for �rms. Therefore, the data are less likely to be subject to measurement error than the datafrom private sources. In that respect, the use of the index method may be more appropriate in our researchthan in the research that relies on private �rm-level data sources.
7

the estimates of productivity gaps built from �rm-level data and the estimates of productivitygaps built from industry-level data.
3.2. Testing procedure under con�dentiality restrictions
Once we have computed the individual relative productivity indices, we investigate theindustry productivity gaps between France and Japan by two means. First, we use thestandard Student's t-test of equality of the TFP means between the French and Japanese�rms operating in the same industry.18
Second, we use the testing procedure proposed by Delgado et al. (2002) and ?, which relieson the concept of �rst-order stochastic dominance. However, we must adapt this procedureto conform to the con�dentiality restrictions imposed by both the French and the Japanesestatistics o�ces. Our methodology of performing the KS tests of stochastic dominance undercon�dentiality restrictions is detailed in Appendix C.
One �nal concern is that the �rms faced various industry�country-speci�c shocks such asthe business cycle and changes in the real exchange rate. Therefore, prior to the computationof t statistics and empirical densities, all observations have been transformed to account forthe shocks common to all �rms within an industry�country:
θ̃c,kit = θc,kit − θc,kt + θc,k, (4)
where c and k represent country c (∈ {FR, JP}) and industry k, respectively. Hence, θc,kt isthe average TFP performance in industry k for country c for a given year t, whereas θc,k isthe average TFP performance in industry k for country c across all years. The latter can alsobe extended to compare all manufacturing �rms within the economy as a whole by addingthe overall sample mean θc, not the mean speci�c to the industry to which the �rm belongs(θc,k). In Section 5 below, we present the results of the KS tests performed on the empiricaldensities derived from the �rm dataset, both at the overall manufacturing level and at thetwo-digit industry level. We also present the results of those tests performed separately onthe subsets of the exporting and non-exporting �rms.
4. Data
Both the French and the Japanese �rm-level data used in this study were collected bynational statistical o�ces. Data for France were drawn from the con�dential Enquête An-nuelle d'Entreprises (EAE) jointly prepared by the Research and Statistics Department ofthe French Ministry of Industry (SESSI) and the INSEE. This survey has been conducted
18One may argue that we should conduct di�erent non-parametric tests such as the Wilcoxon rank-sumtest and the Mann�Whitney U test to check the equality. Note, however, that it is impossible to merge�rm-level datasets between France and Japan. Therefore, this paper employs a t-test. One drawback of thet-test is that it relies on the assumption that the �rm-level TFP is normally distributed; this drawback is anissue because, as has been emphasized in the literature, �rm-level TFP is usually not normally distributedin reality. Indeed, the null hypothesis that the distribution of �rm-level TFP is normal is rejected in 17 outof 18 industries both in France and Japan.
8

annually from 1984 until 2007. It gathers information from the �nancial statements andbalance sheets of individual manufacturing �rms and includes all of the relevant informationto compute productivity indices as well as information on the international activities of the�rms.
Data for Japan were drawn from the con�dential micro-level database of the KigyouKatsudou Kihon Chousa Houkokusho (Basic Survey of Japanese Business Structure andActivities: BSJBSA) prepared annually by the Research and Statistics Department, METI(1994�2006). This survey was �rst conducted in 1991 and then annually from 1994. Themain purpose of the survey is to capture statistically the overall picture of Japanese corporate�rms in light of their activities in diversi�cation, globalization, and strategies for R&D andinformation technology.
The strength of both surveys is the sample coverage and the reliability of information.In France, the survey covers only manufacturing �rms, but it is compulsory for all �rmswith over 20 employees. In Japan, the survey is compulsory for �rms with over 50 employ-ees and with capital of more than 30 million yen (some non-manufacturing industries suchas construction, medical services and transportation services are not included). One com-mon limitation is that some of the information on �nancial and institutional features is notavailable, and small �rms (with fewer than 50 workers for Japan and fewer than 20 workersfor France) are excluded.19 Other limitations are that information on export destination isavailable at the region level, but not at the country level (e.g., Asia, Europe, and NorthAmerica) in Japan, while that of foreign direct investment is not available for France.
One crucial requirement for our study is that the �rm-level variables for di�erent coun-tries be comparable. In that respect, the present study bene�ts from the fact that Franceand Japan conduct very similar types of �rm-level surveys,20 so that we can build a relevantset of comparable variables for the TFP computations using �rm-level information: nominaloutput and input variables, industry-level data for price indices, hours worked, and depre-ciation rates. The precise de�nition of each of our main variables and the methodology weimplemented to make these variables comparable across France and Japan are fully describedin Appendix D.
The data-implementation step allows us to construct two separate unbalanced paneldatasets with the same coverage: the same period (1994�2006), the same industries, thesame employment threshold (over 50 employees), and the same de�nition of inputs andoutput, to estimate the TFP index. In our framework, the TFP index (equation (B-2)) canbe estimated without merging national �rm-level datasets. Only the characteristics of theFrench representative �rms (one for each industry) must be shared across countries.
19In 2002, the BSJBSA covered approximately one-third of Japan's total labour force, excluding the public,�nancial, and other service industries that are not covered in the survey (Kiyota, Nakajima, and Nishimura,2009). In the same year, the EAE covered approximately 75 per cent of aggregate manufacturing employmentand 85 per cent of aggregate manufacturing value added (?) excluding the Food, Beverages, and Tobacco
industry, which is not covered in the survey.20Because of the high comparability of the �rm-level data in Japan and France, a recent international
comparative study by Dobbelaere et al. (2012) also used the EAE and the BSJBSA data.
9
One may be concerned that ignoring �rms with fewer than 50 employees creates somedistortions for the productivity comparison between exporters and non-exporters. AlthoughJapanese �rm-level data are not available for �rms with fewer than 50 employees, the exporterpremium for �rms with 50 employees can be compared with that for �rms with 20 employees,using French �rm-level data. We �nd that the di�erence in the exporter premium betweenthe two datasets is rather small: just 0.8 percentage points for all manufacturing. Thedistortion does not seem to be severe.
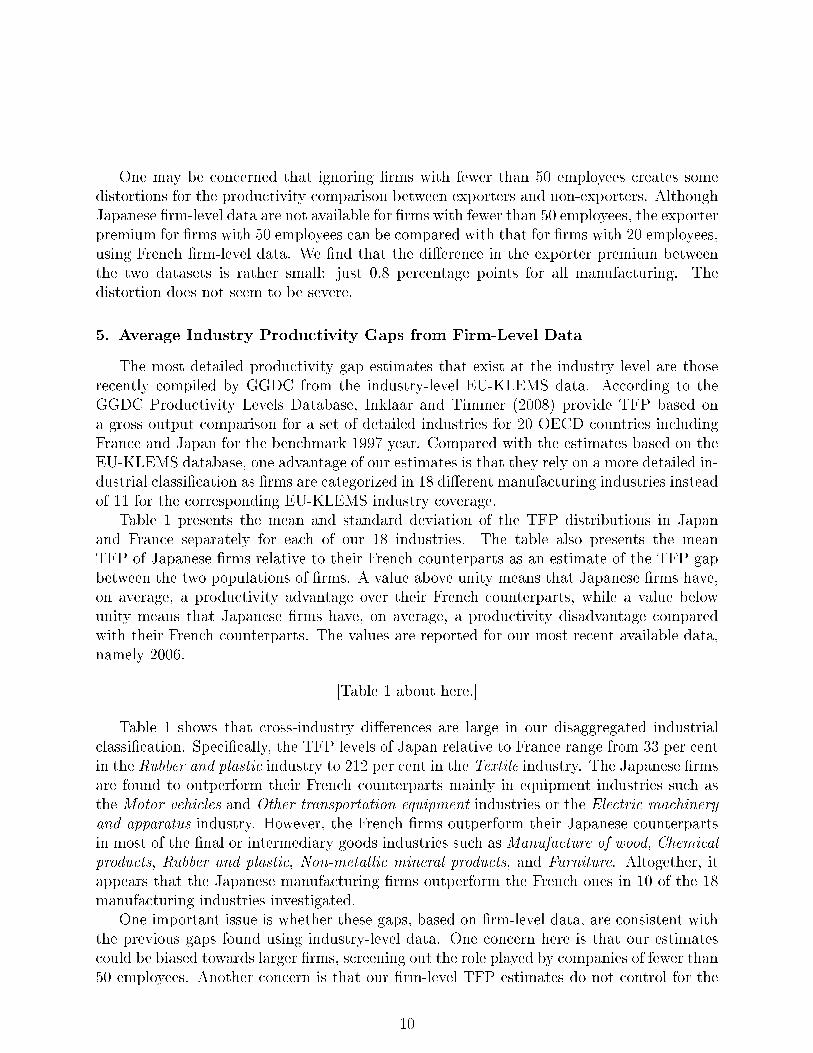
5. Average Industry Productivity Gaps from Firm-Level Data
The most detailed productivity gap estimates that exist at the industry level are thoserecently compiled by GGDC from the industry-level EU-KLEMS data. According to theGGDC Productivity Levels Database, Inklaar and Timmer (2008) provide TFP based ona gross output comparison for a set of detailed industries for 20 OECD countries includingFrance and Japan for the benchmark 1997 year. Compared with the estimates based on theEU-KLEMS database, one advantage of our estimates is that they rely on a more detailed in-dustrial classi�cation as �rms are categorized in 18 di�erent manufacturing industries insteadof 11 for the corresponding EU-KLEMS industry coverage.
Table 1 presents the mean and standard deviation of the TFP distributions in Japanand France separately for each of our 18 industries. The table also presents the meanTFP of Japanese �rms relative to their French counterparts as an estimate of the TFP gapbetween the two populations of �rms. A value above unity means that Japanese �rms have,on average, a productivity advantage over their French counterparts, while a value belowunity means that Japanese �rms have, on average, a productivity disadvantage comparedwith their French counterparts. The values are reported for our most recent available data,namely 2006.
[Table 1 about here.]
Table 1 shows that cross-industry di�erences are large in our disaggregated industrialclassi�cation. Speci�cally, the TFP levels of Japan relative to France range from 33 per centin the Rubber and plastic industry to 212 per cent in the Textile industry. The Japanese �rmsare found to outperform their French counterparts mainly in equipment industries such asthe Motor vehicles and Other transportation equipment industries or the Electric machineryand apparatus industry. However, the French �rms outperform their Japanese counterpartsin most of the �nal or intermediary goods industries such as Manufacture of wood, Chemicalproducts, Rubber and plastic, Non-metallic mineral products, and Furniture. Altogether, itappears that the Japanese manufacturing �rms outperform the French ones in 10 of the 18manufacturing industries investigated.
One important issue is whether these gaps, based on �rm-level data, are consistent withthe previous gaps found using industry-level data. One concern here is that our estimatescould be biased towards larger �rms, screening out the role played by companies of fewer than50 employees. Another concern is that our �rm-level TFP estimates do not control for the
10

quality of inputs. In contrast, the estimates provided by the GGDC productivity databaseare based on two di�erent types of labour (high skilled and others) and two di�erent typesof physical capital (information and communication technology (ICT) capital and non-ICTcapital). To check the consistency between our estimates and the GGDC estimates, we usedconcordance tables to aggregate our data into the industries in the EU-KLEMS database.21
The results of this exercise are reported in Table 2. These results compare the relative TFPlevels of Japan and France for 11 industries; these industries were selected because we wereable to provide �gures for the benchmark year 1997 that were comparable with the GGDC�gures.22
[Table 2 about here.]
Table 2 shows a strong consistency between the GGDC measures based on industry-level data and our own measures based on �rm-level data. In eight of 11 industries, therelative rankings of France and Japan are consistent from one series to the other. Amongthem, Japan leads productivity in three industries (Textiles, textile products, leather, andfootwear, Transport equipment, and Electrical and optical equipment), while France leadsproductivity in �ve industries (Wood and products of wood and cork, Chemicals and chemicalproducts, Other non-metallic mineral products, and Manufacturing nec; recycling). In theremaining three industries for which the ranking is not consistent, Table 2 reveals minorrather than radical di�erences. In the Basic metals and fabricated metal products and theMachinery, nec industries, Japan is slightly more productive than France (less than 5 percent more productive) according to the GGDC series, while Japan is slightly less productivethan France (less than 5 per cent less productive) according to our own series. The largestdi�erence exists for the Pulp and paper, printing and publishing industry, for which Japanis almost as productive as France according to the GGDC series and 16 per cent moreproductive than France according to our own series.
A �nal interesting feature of Table 2 is that the dispersion of the TFP measures basedon �rm-level data is larger than the dispersion of the TFP measures based on industry-level data. In consequence, the average productivity gaps computed from �rm-level data aresystematically larger than the average productivity gaps computed from industry-level data.
All in all, the strong concordance between industry data-based TFP series and �rm data-based TFP series provides us with some con�dence in the robustness of our �rm-level relativeTFP indices. We are now ready to discuss the results from the estimates of the internationalproductivity gap across di�erent subsets of manufacturing �rms within industries.
21The concordance tables are available in Appendix A of the working paper version of our paper (Belloneet al. (2013)
22We had to exclude the Food products, beverages, and tobacco industry and the Coke, re�ned petroleum
products, and nuclear fuel industries, for which we lacked �rm-level data in the EAE and/or the BSJBSA
surveys. We also excluded the Post and communications industry, which is not part of manufacturing andfor which we do not have corresponding �rm-level data in the EAE survey.
11
6. International Comparisons of Firm Distributions by Export Status
In this section, we investigate the extent to which international productivity gaps aresensitive to the export status of �rms. We begin by showing some descriptive statisticsabout the di�erent subsets of exporting and non-exporting �rms in France and in Japan.We then move to cross-country comparisons of the productivity distributions between thesedi�erent subsets of �rms by industry.
6.1. Exporters versus non-exporters in France and Japan
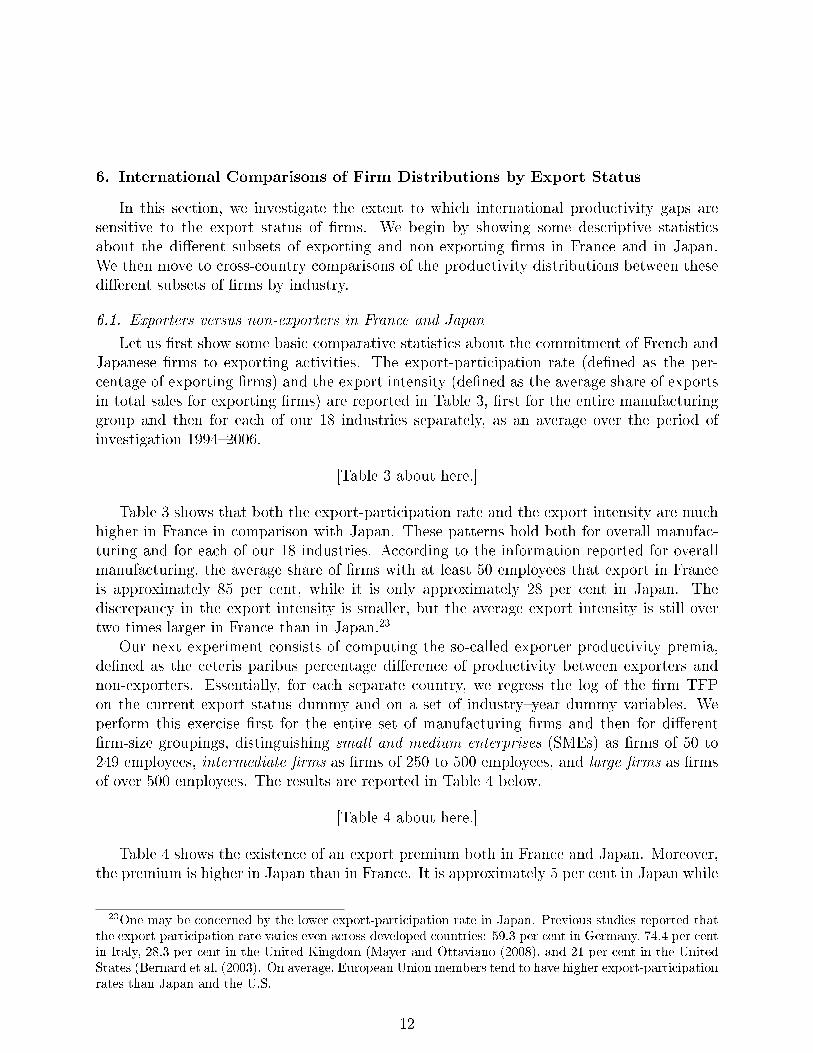
Let us �rst show some basic comparative statistics about the commitment of French andJapanese �rms to exporting activities. The export-participation rate (de�ned as the per-centage of exporting �rms) and the export intensity (de�ned as the average share of exportsin total sales for exporting �rms) are reported in Table 3, �rst for the entire manufacturinggroup and then for each of our 18 industries separately, as an average over the period ofinvestigation 1994�2006.
[Table 3 about here.]
Table 3 shows that both the export-participation rate and the export intensity are muchhigher in France in comparison with Japan. These patterns hold both for overall manufac-turing and for each of our 18 industries. According to the information reported for overallmanufacturing, the average share of �rms with at least 50 employees that export in Franceis approximately 85 per cent, while it is only approximately 28 per cent in Japan. Thediscrepancy in the export intensity is smaller, but the average export intensity is still overtwo times larger in France than in Japan.23
Our next experiment consists of computing the so-called exporter productivity premia,de�ned as the ceteris paribus percentage di�erence of productivity between exporters andnon-exporters. Essentially, for each separate country, we regress the log of the �rm TFPon the current export status dummy and on a set of industry�year dummy variables. Weperform this exercise �rst for the entire set of manufacturing �rms and then for di�erent�rm-size groupings, distinguishing small and medium enterprises (SMEs) as �rms of 50 to249 employees, intermediate �rms as �rms of 250 to 500 employees, and large �rms as �rmsof over 500 employees. The results are reported in Table 4 below.
[Table 4 about here.]
Table 4 shows the existence of an export premium both in France and Japan. Moreover,the premium is higher in Japan than in France. It is approximately 5 per cent in Japan while
23One may be concerned by the lower export-participation rate in Japan. Previous studies reported thatthe export-participation rate varies even across developed countries: 59.3 per cent in Germany, 74.4 per centin Italy, 28.3 per cent in the United Kingdom (Mayer and Ottaviano (2008), and 21 per cent in the UnitedStates (Bernard et al. (2003). On average, European Union members tend to have higher export-participationrates than Japan and the U.S.
12

it is only 1.4 per cent in France when estimated for the entire set of manufacturing �rms.The break-down of the sample by size shows that in France, an export premium exists onlywithin the group of SMEs. In contrast, within the groups of intermediate and large French�rms, being an exporter does not discriminate the most productive �rms. This �nding isconsistent with the fact that most French �rms export to the large and integrated Europeanmarket without signi�cant trade costs.
Only French SMEs may face speci�c trade barriers even within Europe, which show upin a low but still positive and signi�cant export premium of approximately 1 per cent. Incontrast, an export premium exists within each group of SMEs and intermediate and large�rms in Japan. As expected, the export premium is higher within the group of SMEs thanit is within the group of large �rms. However, the export premium for large �rms in Japanis still 2.6 per cent. In the next subsection, we investigate this issue further.
6.2. The relative performance of French and Japanese exporters
Let us begin with graphical descriptions of the comparable cumulative distributions ofFrench and Japanese �rms at the overall manufacturing level. We �rst graph those distri-butions for the full sample of manufacturing �rms and then separately for the subsamplesof exporting and non-exporting �rms. Speci�cally, Figure 2 displays the size (measuredas the number of employees) and TFP distributions for all manufacturing �rms in Franceand Japan. Figure 3 replicates the same exercise, but only for TFP distributions, and itdiscriminates between exporters and non-exporters.
[Figure 2 about here.]
[Figure 3 about here.]
Figure 2 shows that the size distribution of Japanese manufacturing �rms dominates thedistribution of their French counterparts. This feature is consistent with previous �ndingsin the industrial organization literature, which emphasizes, for instance, the speci�c own-ership structures of Japanese �rms (e.g., Lee and O'Neill (2003). Figure 2 also shows thatJapanese manufacturing �rms (slightly) outperform their French counterparts in terms ofTFP.24 Finally, Figure 3 reveals that at the entire manufacturing level, the productivity gapof exporters is larger than the productivity gap of non-exporters. This productivity gap isalso larger than the average productivity gap.
24Note that there is an apparent paradox between this �nding and the �ndings reported in Inklaar andTimmer (2008), according to which France outperformed Japan by 14 per cent in terms of manufacturing,excluding the electrical (Mexelec) aggregate. This result points to two main di�erences between the industrycoverage from the FJ classi�cation and the one from EU-KLEMS. First, contrary to the coverage ofMexelec inthe EU-KLEMS classi�cation, our coverage of manufacturing includes the Electric machinery and apparatus
industry, in which Japanese �rms perform better than French �rms according to both the GGDC estimatesand our own. Second, because of data constraints, our FJ classi�cation excludes two industries in whichJapan performs particularly poorly according to the GGDC estimates: the Food products, beverages, and
tobacco and the Coke, re�ned petroleum products, and nuclear fuel industries.
13

We next investigate whether this pattern still holds at the industry level. We also wantto quantitatively compare the average productivity gaps across the di�erent subsets of �rms.For that purpose, we perform t-tests discriminating exporters from non-exporters in each ofthe 18 industries. The tests are performed over the entire 1994�2006 period. The results arereported in Table 5.
[Table 5 about here.]
The t-tests con�rm the idea that the productivity gaps are larger across exporters thanacross non-exporters at the overall manufacturing level. Basically, Japanese manufacturingexporters outperform their French counterparts with an average TFP advantage of 5 per cent,while the average TFP advantage of Japanese �rms computed for all manufacturing �rms isonly 2 per cent. However, Japanese non-exporters outperform their French counterparts byonly 1 per cent.
A similar pattern exists for individual industries: the productivity gap between Japaneseand French exporters is generally larger than the average productivity gap in the sameindustry. For instance, the productivity advantage of Japanese exporters over their Frenchcounterparts in the Textile industry is 78 per cent (row 5 of Table 5), while the averageproductivity advantage of Japan over France in that industry is 72 per cent (row 4 of Table 5).Conversely, in industries where France has the productivity lead (eight out of 18 industries),the productivity gap between Japanese and French exporters is generally smaller than theaverage productivity gap. For instance, the productivity disadvantage of Japanese exporterscompared with their French counterparts in the Manufacture of wood industry is 38 per cent(row 11 of Table 5), while the average productivity disadvantage of Japan compared withFrance in that industry is 41 per cent (row 10 of Table 5).
Because our t-tests rely on the simplifying, but unveri�ed, assumption that the �rms'TFP is normally distributed within country�industry, we propose to further perform non-parametric KS tests of stochastic dominance following the adapted methodology explainedin Section 2 above. Recall that the KS test is performed on the kernel densities derived fromthe �rm dataset, both at the entire manufacturing group level and at the two-digit industrylevel. Recall also that, at this stage of our testing procedure, all observations have beentransformed to account for the shocks common to all �rms within an industry�country. Theresults of the KS test are reported in Table 6. Note that the negative distance implies �rst-order stochastic dominance of the productivity distribution of Japanese �rms with respectto that of French �rms, so that the distribution of Japanese �rms lies to the right of thedistribution of French �rms. Table 6 indicates that the results are systematically consistentwith the t-tests.
[Table 6 about here.]
The most striking evidence that emerges from Table 6 is that the productivity gap amongJapanese and French exporters is larger than the average industry gap in the industriesin which the Japanese �rms have a productivity advantage and smaller than the average
14

industry gap in the industries in which the French �rms have a productivity lead. Thisempirical pattern indicates that the average productivity gap across exporters of di�erentcountries is driven by something other than mere technology. Indeed, if country-speci�cproductivity advantages were the only force driving international productivity gaps, thereshould be no di�erence between the average industry gaps and the gaps of exporters or non-exporters considered separately. On the other hand, if the learning-by-exporting mechanismwas the primary force driving the productivity gaps between exporters and non-exporters,the productivity gap across the exporters of two di�erent countries should be systematicallynarrower than the productivity gaps across the non-exporters of the same two countries.Speci�cally, in the frame of our comparison, this pattern should hold in all industries, andnot only in industries in which Japan has a productivity disadvantage.
The only way to reconcile our empirical �nding with our analytical framework is toassume that Japan is characterized by higher trade costs compared with France. In such acase, Japanese �rms have a higher cost cut-o� than French �rms, as illustrated in Figure 1with Country 1 portraying Japan and Country 2 portraying France. As a consequence ofthe stronger selection of Japanese �rms into export markets, the productivity advantage ofJapanese �rms widens when comparing exporting �rms exclusively. Conversely, in industrieswhere French �rms outperform their Japanese counterparts, the productivity advantage ofexporters shrinks.
One may be concerned that our �ndings are attributable not to trade costs, but to thedi�erence in destination markets between French and Japanese exporters. Because Franceand Japan are located in di�erent regions, there may be di�erences in destination marketsexplaining the observed pattern. To test for the robustness of our �ndings, we compare therelative productivity of French and Japanese exporters with three di�erent regions of theworld: Asia, Europe, and North America. Table 7 presents the results.
The di�erences in the average productivity of French and Japanese exporters vary sub-stantially across the regions. The largest average gap (about 6.4 per cent) is betweenJapanese exporters to Europe and their French counterparts. This result is consistent withthe idea that trading to Europe is less costly for French �rms than it is for Japanese ones.Conversely, the lowest productivity gap (about 3.9 per cent) is between Japanese exporters toAsia and their French counterparts, which is consistent with the fact that the Asian marketsare more accessible to Japanese exporters compared with the European markets. Finally,the productivity gap of Japanese exporters to North America compared with their Frenchcounterparts is in-between, suggesting that French �rms may bene�t from a cost advantageover their Japanese counterparts in reaching North American markets. Overall, the mostinteresting feature of Table 7 is that whatever the destination, the productivity gap betweenFrench and Japanese exporters remains larger than the average productivity gap. Under ourframework, this feature supports the idea that the di�erences in transport costs are not theonly driver of the productivity gaps between French and Japanese exporters.
[Table 7 about here.]
All in all, our results suggest that France and Japan, despite being both similarly in-dustrialized and liberalized countries, still exhibit substantially di�erent degrees of trade
15

barriers. This di�erence could be because of di�erences in trade-related institutions andnon-tari� barriers rather than because of mere di�erences in trade tari�s or transport costs.For instance, the JapaneseCabinet Secretariat (2010) documents that Japan's trade sharewith FTA partners is much lower than the European Union's trade share (16 per cent ver-sus 76 per cent). Novy (2013) utilized a micro-founded gravity approach to indirectly inferbarriers to international trade for 12 industrialized countries. His study found that the levelof trade barriers di�ers substantially across similarly developed countries. Speci�cally, heestimates that trade barriers are signi�cantly higher in Japan compared to France.
7. Concluding Remarks
This paper provided new evidence on international productivity gaps. One of the con-tributions of this paper was to directly compare the distribution of �rm-level TFP withinthe same industry across two di�erent countries. Another contribution of this paper was topropose an empirical protocol that reconciles the need to establish international comparisonsof �rm-level analysis with data-con�dentiality restrictions.
We �rst presented a simple framework of analysis to relate cross-country productivitygaps to the export status of �rms, by building on the recent models of international tradeand heterogeneous �rms. We showed that market-selection mechanisms generate truncationsin the productivity distribution of �rms, which can be consistent with our cross-countrycomparisons for speci�c values of the relative trade costs across France and Japan. We thenexamined the empirical validity of this prediction using large-scale �rm-level data for Franceand Japan from 1994 to 2006.
We found that Japanese �rms outperform French ones in 10 out of 18 industries. Re-gardless of the export status, French �rms have the productivity lead in industries such asChemical products and Rubber and plastic, whereas Japanese �rms have the productivitylead in such industries as Electric machinery and apparatus and Motor vehicles.
We found that the productivity gap across French and Japanese exporters systematicallydi�ers from the average industry productivity gap: it is wider in industries in which Japanhas a productivity lead and it is narrower in industries in which France has a productivitylead. This result suggests that, as a consequence of the stronger selection of Japanese �rmsinto export markets, the productivity gap between Japanese and French exporters is evenlarger than the average productivity gap in industries in which Japan has a productivitylead. Moreover, we show that this result holds not only when trade is considered globally,but also when trade is di�erentiated by destination markets.
This paper also highlighted the relevance of the new models of international trade with�rm heterogeneity. On the one hand, it provided new support to those models by showingthat �rm selection matters in shaping international productivity gaps, and a corollary thatcross-country di�erences in trade costs matter. On the other hand, it revealed some limi-tations of these new models by showing that productivity and trade cost di�erences across�rms from di�erent countries may not be unique drivers of their export participation.
Extensions of this research could take several directions. First, one would want to investi-gate further how country-speci�c productivity advantages and relative trade costs shape the
16

relationship between a �rm's relative productivity and its trade intensity, as opposed to mereexport status. Second, a study utilizing data on other countries, especially on developingcountries where learning-by-exporting could be a main source of export premium, will addanother national perspective to the literature on international productivity gaps. Because wefocused on two developed countries, our results may be sensitive to the choice of countries.The e�ects of trade costs may not be the same for di�erent countries and di�erent periods.Finally, it is also important to control for innovation activities such as R&D in studying theinternational productivity gap. At the �rm level, the feasibility of such analysis will be highif the governments allow researchers to merge con�dential �rm-level datasets between twocountries.
Acknowledgements
This research was conducted as a part of the Research Institute of Economy, Trade andIndustry (RIETI) research project, �Determinants of the Productivity Gap among Firms inJapan.� The authors acknowledge the helpful comments on an earlier draft from Luis Cas-tro, Naoto Jinji, Dae-Wook Kim, Eiichi Tomiura, Eric Ramstetter, two anonymous referees,the participants at the ETSG 2011 Conference in Copenhagen, the EITI 2012 Conferencein Tokyo, the CAED-COST 2012 Conference in Nuremberg, the Japanese Economic As-sociation 2012 Fall Meeting, the Korea International Economic Association 2012 Meeting,the WEAI Paci�c Rim Conference in Tokyo, and the seminar participants at GRIPS, KobeUniversity, Okinawa University, Otaru University of Commerce, the Research Institute ofCapital Formation, RIETI, and University of California Santa Cruz. Financial support re-ceived from the Japan Society for the Promotion of Science (Grant-in-Aid B-2233080) is alsogratefully acknowledged. Special thanks to Takanobu Nakajima for his guidance through-out this research and to Kiyohiko G. Nishimura for having initiated the French�Japanesescienti�c co-operation under which this research has been completed. The usual disclaimersapply.
References
Ahn, S., Fukao, K., Kwon, H. U., 2004. The internationalization and performance of koreanand japanese �rms: An empirical analysis based on micro-data. Seoul Journal of Economics17 (4), 439�82.
Aw, B. Y., Chen, X., Roberts, M. J., October 2001. Firm-level evidence on productivitydi�erentials and turnover in taiwanese manufacturing. Journal of Development Economics66 (1), 51�86.URL http://ideas.repec.org/a/eee/deveco/v66y2001i1p51-86.html
Aw, B. Y., Chung, S., Roberts, M. J., January 2000. Productivity and turnover in the exportmarket: Micro-level evidence from the republic of korea and taiwan (china). World BankEconomic Review 14 (1), 65�90.URL http://ideas.repec.org/a/oup/wbecrv/v14y2000i1p65-90.html
17

Aw, B. Y., Chung, S., Roberts, M. J., November 2003. Productivity, output, and failure: acomparison of taiwanese and korean manufacturers. Economic Journal 113 (491), F485�F510.URL http://ideas.repec.org/a/ecj/econjl/v113y2003i491pf485-f510.html
Bartelsman, E., Haltiwanger, J., Scarpetta, S., February 2013. Cross-country di�erences inproductivity: The role of allocation and selection. American Economic Review 103 (1),305�34.URL http://ideas.repec.org/a/aea/aecrev/v103y2013i1p305-34.html
Bellone, F., Kiyota, K., Matsuura, T., Musso, P., Nesta, L., Mar. 2013. International pro-ductivity gaps and the export status of �rms: Evidence from france and japan. Discussionpapers 13011, Research Institute of Economy, Trade and Industry (RIETI).URL http://ideas.repec.org/p/eti/dpaper/13011.html
Bernard, A. B., Eaton, J., Jensen, J. B., Kortum, S., September 2003. Plants and produc-tivity in international trade. American Economic Review 93 (4), 1268�1290.URL http://ideas.repec.org/a/aea/aecrev/v93y2003i4p1268-1290.html
Bernard, A. B., Redding, S. J., Schott, P. K., 2007. Comparative advantage and heteroge-neous �rms. Review of Economic Studies 74 (1), 31�66.URL http://ideas.repec.org/a/oup/restud/v74y2007i1p31-66.html
Biesebroeck, J. V., 09 2007. Robustness of productivity estimates. Journal of IndustrialEconomics 55 (3), 529�569.URL http://ideas.repec.org/a/bla/jindec/v55y2007i3p529-569.html
Clerides, S. K., Lach, S., Tybout, J. R., August 1998. Is learning by exporting important?micro-dynamic evidence from colombia, mexico, and morocco. The Quarterly Journal ofEconomics 113 (3), 903�947.URL http://ideas.repec.org/a/tpr/qjecon/v113y1998i3p903-947.html
Delgado, M. A., Farinas, J. C., Ruano, S., August 2002. Firm productivity and exportmarkets: a non-parametric approach. Journal of International Economics 57 (2), 397�422.URL http://ideas.repec.org/a/eee/inecon/v57y2002i2p397-422.html
Dobbelaere, S., Kiyota, K., Mairesse, J., Apr. 2012. Product and labor market imperfectionsand scale economies: Micro-evidence on france, japan and the netherlands. Discussionpapers 12020, Research Institute of Economy, Trade and Industry (RIETI).URL http://ideas.repec.org/p/eti/dpaper/12020.html
Fariñas, J. C., Ruano, S., September 2005. Firm productivity, heterogeneity, sunk costs andmarket selection. International Journal of Industrial Organization 23 (7-8), 505�534.URL http://ideas.repec.org/a/eee/indorg/v23y2005i7-8p505-534.html
18

Fukao, K., Inui, T., Kabe, S., Liu, D., 2008a. An international comparison of the tfp levels ofjapanese, south korean, and chinese listed �rms. Seoul Journal of Economics 21 (1), 5�38.
Fukao, K., Tomohiko, I., Ito, K., Kim, Y. G., Yuan, T., 2008b. `an international comparisonof the tfp levels and the productivity convergence of japanese, korean, taiwanese andchinese listed �rms. Journal of Chinese Economic and Business Studies 21 (1), 5�38.
Girma, S., Kneller, R., Pisu, M., July 2005. Exports versus fdi: An empirical test. Reviewof World Economics (Weltwirtschaftliches Archiv) 141 (2), 193�218.URL http://ideas.repec.org/a/spr/weltar/v141y2005i2p193-218.html
Good, D. H., Nadiri, M. I., Sickles, R. C., 1997. Index number and factor demand approachesto the estimation of productivity. In: Pesaran, M. H., Schmidt, P. (Eds.), Handbook ofApplied Econometrics: Microeconometrics. Vol. 2 of Handbook of Applied Econometrics.Oxford, UK: Blackwell.URL http://ideas.repec.org/h/eee/popchp/1-11.html
Greenaway, D., Kneller, R., 02 2007. Firm heterogeneity, exporting and foreign direct invest-ment. Economic Journal 117 (517), F134�F161.URL http://ideas.repec.org/a/ecj/econjl/v117y2007i517pf134-f161.html
Griliches, Z., Mairesse, J., 1983. Comparing productivity growth: An exploration of frenchand u.s. industrial and �rm data. European Economic Review 21 (1-2), 89�119.URL http://ideas.repec.org/a/eee/eecrev/v21y1983i1-2p89-119.html
Hayakawa, K., Machikita, T., Kimura, F., 04 2012. Globalization and productivity: A surveyof �rm�level analysis. Journal of Economic Surveys 26 (2), 332�350.URL http://ideas.repec.org/a/bla/jecsur/v26y2012i2p332-350.html
Helpman, E., Melitz, M., Rubinstein, Y., 05 2008. Estimating trade �ows: Trading partnersand trading volumes. The Quarterly Journal of Economics 123 (2), 441�487.URL http://ideas.repec.org/a/tpr/qjecon/v123y2008i2p441-487.html
Inklaar, R., Timmer, M. P., 2008. Ggdc productivity level database: International compar-isons of output, inputs and productivity at the industry level. GGDC Research Memoran-dum GD-104, Groningen Growth and Development Centre, University of Groningen.URL http://ideas.repec.org/p/dgr/rugggd/gd-104.html
ISGEP(International Study Group on Exports and Productivity), 2008. Understandingcross-country di�erences in exporter premia: Comparable evidence for 14 countries.Review of World Economics 144 (4), 596�635.URL http://EconPapers.repec.org/RePEc:spr:weltar:v:144:y:2008:i:4:p:
596-635
JapaneseCabinet Secretariat, 2010. The progress of the economic partnership agreements.Tech. rep.
19

Jung, M., Lee, K., August 2010. Sectoral systems of innovation and productivity catch-up:determinants of the productivity gap between korean and japanese �rms. Industrial andCorporate Change 19 (4), 1037�1069.URL http://ideas.repec.org/a/oup/indcch/v19y2010i4p1037-1069.html
Lee, M. J. K., Fukao, K., 2008. Korean �rms and catching up with the japanese �rms. SeoulJournal of Economics 21 (1), 93�137.
Lee, P. M., O'Neill, H. M., 2003. Ownership structures and r&d investments of u.s. andjapanese �rms: Agency and stewardship perspectives. Academy of Management Journal46 (2), 212�225.
Mayer, T., Ottaviano, G. I., 2008. The happy few: The internationalisation of european�rms: New facts based on �rm-level evidence 43 (3), 135�148.
Melitz, M. J., November 2003. The impact of trade on intra-industry reallocations andaggregate industry productivity. Econometrica 71 (6), 1695�1725.URL http://ideas.repec.org/a/ecm/emetrp/v71y2003i6p1695-1725.html
Novy, D., 01 2013. Gravity redux: Measuring international trade costs with panel data.Economic Inquiry 51 (1), 101�121.URL http://ideas.repec.org/a/bla/ecinqu/v51y2013i1p101-121.html
O'Mahony, M., Timmer, M. P., 06 2009. Output, input and productivity measures at theindustry level: The eu klems database. Economic Journal 119 (538), F374�F403.URL http://ideas.repec.org/a/ecj/econjl/v119y2009i538pf374-f403.html
Wagner, J., 01 2007. Exports and productivity: A survey of the evidence from �rm-leveldata. The World Economy 30 (1), 60�82.URL http://ideas.repec.org/a/bla/worlde/v30y2007i1p60-82.html
Wagner, J., June 2012. International trade and �rm performance: a survey of empiricalstudies since 2006. Review of World Economics (Weltwirtschaftliches Archiv) 148 (2),235�267.URL http://ideas.repec.org/a/spr/weltar/v148y2012i2p235-267.html
Appendix A: Proof of the Monotonicity of the Relationship between the Trun-
cated Mean and the Truncation Threshold
To prove that φ(z)1−Φ(z)
is a monotonic transformation of z, we must show that the �rst
derivative does not change sign. De�ne z = θcX−µσ
and Γ(z) = φ(z)1−Φ(z)
, where φ(.) and Φ(.)
are the probability density function (pdf) and the cumulative distribution function (cdf) of
20

the standard normal, respectively. The �rst derivative of Γ(z) with respect to θcX yields thefollowing:
dΓ(z)
dz=φ′(z)[1− Φ(z)] + φ(z)2
[1− Φ(z)]2. (A-1)
Because of the squared terms, the denominator is always positive. Concerning the nu-merator, φ(z)2 is always positive, so that the sign of equation A-2 depends on the left-handexpression of the numerator. Because Φ is the normal cdf, we know that Φ ∈ [0, 1], whichimplies that 1− Φ is always positive. Likewise, φ, the normal pdf, is always positive.
The problem reduces to the sign of φ′(z). Because φ(z) = 1σ√
2πe−
12z2 , observe that
φ′(z) = − zσφ(z). Hence,
dΓ(z)
dz=− zσφ(z)[1− Φ(z)] + φ(z)2
[1− Φ(z)]2. (A-2)
Recall that zσ
= θcX−µσ2 . One must therefore envisage three situations.
1. θcX < µ. This relationship implies that − zσis positive. Hence, − z
σφ(z)[1 − φ(z)] > 0
and dΓ(z)/dz > 0.2. θcX = µ. This relationship implies that − z
σ= 0 is nil. Hence, − z
σφ(z)[1 − φ(z)] = 0
and dΓ(z)/dz > 0.3. θcX > µ. This relationship implies that − z
σis negative. Rewrite z
σφ(z)[1 − φ(z)] =
σ−1[−zφ(z) + zφ(z)]. Therefore, to prove that [−zφ(z) + zΦ(z)] > 0 is tantamountto proving that zΦ(z) > zφ(z). Observe that both φ and Φ are continuous functions.Hence, to verify that zΦ(z) > zφ(z) when z > 0, we �rst need to show that Φ(0) > φ(0)and second, that dΦ(z)/dz > dφ(z)/dz ∀ z ∈ <+.
• Because Φ and φ are the standard normal cdf and pdf, one knows that Φ(0) > φ(0)when z = 0.
• dΦ(z)/dz = φ(z) > 0. However dφ(z)/dz < 0 when z ∈ <+. This relationshipimplies that dΦ(z)/dz > dφ(z)/dz.
Therefore zσφ(z)[1− φ(z)] > 0.
The above implies that the numerator φ′(z)[1−φ(z)]+φ(z)2 is always positive. Therefore,φ(z1)
1−Φ(z1)> φ(z2)
1−Φ(z2)∀ z1 > z2. �
Appendix B: A Firm-Level TFP Index for International Comparisons
The original Good et al. (1997) (GNS) methodology index is based on the existence ofa hypothetical reference �rm for each industry that has the arithmetic mean values of logoutput, log input, and input cost shares for the �rms belonging to that industry in each year.Each �rm's output and inputs are measured relative to this reference �rm. The reference�rms are then chain-linked over time. Hence, the index measures the TFP of each �rm inyear t relative to that of the reference �rm in the initial year (t = 0).
21

Let θkit and θkrt be (the log of) TFP for �rm i and the reference �rm r, respectively,operating in year t in industry k. The GNS index de�nes the TFP index for �rm i operatingin industry k in year t as follows:
θkit − θkr0 '(
lnY kit − lnY
k
rt
)+
t∑τ=1
(lnY
k
rτ − lnYk
rτ−1
)−
∑j∈{K,L,M}
1
2
(skijt + s̄krjt
) (ln jkit − ln j
k
rt
)
+t∑
τ=1
∑j∈{K,L,M}
1
2
(s̄krjτ + s̄krjτ−1
) (ln j
k
rτ − ln jk
rτ−1
), (B-1)
where lnY kit , ln jkit, and s
kijt are the log output, the log input of factor j, and the cost share
of factor j, respectively for �rm i in industry k. lnYk
rt, ln jk
rt, and s̄krjt are the same variables
for the reference �rm r and are equal to the arithmetic mean of the corresponding variableover all �rms operating in industry k in year t.
The �rst term of the �rst line indicates the deviation of �rm i's output from the outputof the reference �rm in year t. The second term represents the cumulative change in theoutput of the reference �rm from year 0 to year t. The same operations are applied to eachinput j in the second and the third lines, weighted by the average of the cost shares.
We extend the GNS index to international �rm-level comparisons using a common refer-ence �rm to compile the relative TFP indices for �rms belonging to di�erent countries. Tostart with, suppose that all of the relevant �rm-level variables are expressed in common unitsirrespective of the country. Let us then focus on one industry and two countries: France(FR) and Japan (JP ). De�ne France as the country of reference. Discarding the industrysubscript k for simplicity of notation, the individual relative TFP indices for Japan can becomputed using the following equation adapted from equation (B-1):
θJPit − θFRr0 '(
lnY JPit − lnY
FR
rt
)+
t∑τ=1
(lnY
FR
rτ − lnYFR
rτ−1
)−
∑j∈{K,L,M}
1
2
(sJPijt + s̄FRrjt
) (ln jJPit − ln j
FR
rt
)
+t∑
τ=1
∑j∈{K,L,M}
1
2
(s̄FRrjτ + s̄FRrjτ−1
) (ln j
FR
rτ − ln jFR
rτ−1
), (B-2)
where lnY JPit , ln jJPit , and sJPijt are de�ned as previously but are now speci�c to Japan. lnY
FR
rt ,
ln jFR
rt , and s̄FRrjt are the same variables for the French reference �rm operating in year t and
equal to the arithmetic mean of the corresponding variable over all French �rms operating
22

in year t. Note that we do not need to merge �rm-level datasets between two countries; weneed to exchange the information on the French and Japanese reference �rms. We can thenestablish a �rm-level comparison between two countries while adhering to the con�dentialityrestriction.
Appendix C: KS Tests under Con�dentiality Restriction
Let GFR and GJP denote the cumulative distribution functions of the productivity levelcorresponding to the French and Japanese �rms for a given industry. The �rst-order stochas-tic dominance of GJP with respect to GFR is de�ned as GJP (θ)−GFR(θ) ≤ 0 uniformly inθ ∈ <+, with strict inequality for some θ. The two-sided KS statistic tests the hypothesisthat both distributions are identical and the null and alternative hypotheses can be expressedas follows:
H0 : GJP (θ)−GFR(θ) = 0 ∀ θ ∈ <+
H1 : GJP (θ)−GFR(θ) 6= 0 for some θ ∈ <+. (C-1)
In contrast, the one-sided KS test of the dominance of GJP (θ) with respect to GFR(θ) canbe formulated as follows:
H0 : GJP (θ)−GFR(θ) = 0 ∀ θ ∈ <+
H1 : GJP (θ)−GFR(θ) < 0 for some θ ∈ <+. (C-2)
Let θi denote the productivity of �rm i. Let nFR and nJP be the number of French andJapanese �rms in the empirical distributions of GJP and GFR, respectively. Let N denotethe total number of French and Japanese �rms (N = nFR + nJP ). The KS statistic for theone-sided and two-sided tests is given by the following:
KS1 =
√nFR · nJP
Nmax
1≤i≤N|GJP (θi)−GFR(θi)| (C-3)
and
KS2 =
√nFR · nJP
Nmax
1≤i≤N
{GJP (θi)−GFR(θi)
}, (C-4)
respectively. The acceptance of the null hypothesis in equation (C-3) implies that the distri-bution of GJP dominates GFR. To establish the stochastic dominance of the distribution ofGJP with respect to GFR requires the rejection of the null hypothesis in the two-sided testin equation (C-4), but not the rejection of the null hypothesis in equation (C-3).
Note that in equations (C-3) and (C-4), the maximum distance between GFR(θi) andGJP (θi) and the number of �rms nFR and nJP is required for both the French and Japanesesamples. The computation of this maximum distance would necessitate that both samplesbe merged to compute it. However, to apply the KS tests to allow international �rm-levelTFP comparisons is not possible because merging the �rm-level TFP series is not an option,
23

again because of the con�dentiality restrictions. The con�dentiality of the �rm-level datasetsimposes restrictions on the production of tables, data series, or summary statistics in such away that the identi�cation of individual �rms is made impossible.
Among various rules, the principal restriction implies that any cell within a producedtable must ensure the anonymity of the individual �rms. To compute the maximum distance,our choice is to use (nFR/5)-tiles and (nJP/5)-tiles to approximate the cumulative densityfunction G(θ) for France and Japan, respectively, while obtaining (nFR · nFR)/N from thereal number of �rms.
Appendix D: Data
Main variables for the TFP computation
Output is de�ned as total nominal sales de�ated using the industry-level gross outputprice indices drawn respectively from INSEE for France and from the Japan Industrial Pro-ductivity (JIP) 2009 database for Japan.25
Labour input is obtained by multiplying the number of employees by the average hoursworked by industry. Industry-level worked hours data are drawn from the EU-KLEMSdataset of the GGDC for France and from the JIP 2009 database for Japan.26 Note thatin France, a large drop in hours worked occurred from 1999 onwards because of the 35-hour/week policy: worked hours fell from 38.39 in 1999 to 36.87 in 2000.
The variables for intermediate goods consumption are available both in the EAE andin the BSJBSA surveys. In both surveys, intermediate inputs are de�ned as operating cost(= sales cost + administrative cost) − (wage payments + depreciation cost). The inputsare de�ated using the industry price indices for intermediate inputs published by INSEE forFrance and by the JIP 2009 database for Japan.
The capital stocks are computed from investments and book values of tangible assetsfollowing the traditional perpetual inventory method (industry subscript k and country su-perscript c are discarded to simplify the notation):
Kit = Kit−1(1− δt−1) + Iit/pIt, (D-1)
where Kit is the capital stock for �rm i operating in year t; δt−1 is the depreciation rate inyear t− 1; Iit is the investment of �rm i in year t;27 and pIt is the investment goods de�atorfor industry k.28 Both the investment price indices and the depreciation rates are availableat the two-digit industrial classi�cation level. They are drawn from the JIP 2009 database
25The JIP database has been compiled as a part of a research project by the Research Institute of Economy,Trade, and Industry (RIETI) and Hitotsubashi University. For more details about the JIP database, seeFukao, Hamagata, Inui, Ito, Kwon, Makino, Miyagawa, Nakanishi, and Tokui (2007).
26The concordance between the industry-level EU-KLEMS database and the �rm-level EAE database isperformed through the ISIC codes. The concordance tables are available upon request.
27Investment data are not available in the BSJBSA. We thus use the di�erence in nominal tangible assetsbetween two consecutive years as a proxy for the nominal investment.
28If �rm i's investment was missing in year t, we consider �rm i as having made no investment: Iit = 0.
24

for Japan and from the INSEE series for France. The investment �ows are traced back to1994 for the incumbent �rms and back to the entry of the �rm into our dataset for the �rmsthat entered our dataset after 1994.
The cost of intermediate inputs is de�ned as the nominal cost of intermediate inputswhile that of labour is the wage payments. To compute the user cost of capital (i.e., therental price of capital) in country c, we use the familiar cost-of-capital equation given byJorgenson and Griliches (1967) (industry subscript k and country superscript c are discardedto simplify the notation):29
pKt = pIt−1p̃Kt + δtpIt − [pIt − pIt−1]. (D-2)
This formula shows that the rental price of capital pKt is determined by the nominal rate ofreturn (p̃Kt), the rate of economic depreciation and the capital gains. The capital revaluationterm can be derived from investment price indices. To minimize the impact of sometimesvolatile annual changes, three-period annual moving averages are used. The nominal ratesof return are yields on 10-year government bonds of France and Japan.
Some discussions on the comparability of the data
Industry classi�cation
To build a common industry classi�cation between the French and Japanese datasets,we had to overcome two di�culties. First, the nomenclatures of the industry codes in thetwo �rm-level surveys, namely the BSJBSA and the EAE, are not the same. Second, withineach country, the nomenclatures of the industry codes in the industry level databases do notalways concord with the nomenclatures of the industry codes in the �rm-level databases.To overcome these di�culties, we built di�erent concordance tables across di�erent industryclassi�cations. These concordance tables are available upon request. They are all reportedin the working paper version of our research (Bellone, Kiyota, Matsuura, Musso, and Nesta,2013).
De�nition of the primary �rm-level variables
To establish the �rm-level nominal input and output series, we make a number of sim-plifying assumptions. First, we assign multi-product �rms and/or �rms that shift industriesto only one industry code, which is de�ned as the code in which the �rm has the highestaverage sales over the period of observation. Second, in each country c(∈ {FR, JP}), wede�ne �rm output Y c
it as nominal sales divided by the industry gross output price de�atorpct . The inputs consist of labour, capital, and intermediate inputs. Labour Lcit is obtained bymultiplying the number of employees in the �rm by the average hours worked in the industry.The real capital stock Kc
it is computed from tangible assets and investments based on the
29Ideally, this equation should be augmented to take into account business income tax. However, astaxation regimes di�er across France and Japan, we prefer, as in Inklaar and Timmer (2008), to rely on asimpler common formula abstracting from taxation
25

perpetual inventory method. The intermediate inputs M cit are real intermediate inputs and
are de�ned as nominal intermediate inputs de�ated by the industry input price de�ator pcMt.Firm-level data on exports are available both in the BSJBSA and in the EAE surveys.
However, the export variable has some country speci�cities. In Japan, one problem is thatthe de�nition of exports in the BSJBSA changed in 1997. Before 1997, exports included salesby foreign branches (indirect exports). After 1997, exports are de�ned as exports from theparent �rm (direct exports). Total (direct plus indirect) exports are also available between1997 and 1999. For consistency, this paper focuses on direct exports. Exports before 1997 areadjusted by multiplying the �gure by the ratio of direct exports to total exports. The ratioof direct exports is de�ned as the industry-average ratio of direct exports to total exportsbetween 1997 and 1999.
Purchasing power parity (PPP)
To convert the input and output series in France and Japan into common units, weuse the industry-speci�c PPP series from the GGDC Productivity Level Database, whichprovides comparisons of output, inputs, and productivity at a detailed industry level for a setof 30 OECD countries.30 In the GGDC database, both the French and Japanese PPP seriesare expressed relative to the United States. On this basis, we derive the French�Japaneseindustry-speci�c PPP series as follows.
Our very �rst choice is simply that the burden of the PPP conversion should be on onlyone country, France in our case, so that the other country (i.e., Japan) can compute its TFPindices in an independent fashion. The conversion occurs as follows. Let Xϕ
it be input K, L,andM or output Y of any �rm i at time t, expressed in the local currency ϕ. Discarding thesubscripts i and t for simplicity of notation, the conversion into US$ PPP occurs as follows:
X$ =Xϕ
PPPXϕ→$
. (D-3)
Knowing that PPPX$→ϕ = [PPPX
ϕ→$]−1, the conversion of XAC into XU implies that weexpress AC in US$ PPP �rst and then express X$ in U as follows:
XU,FR =XAC,FR/PPPX
AC→$
PPPX$→U
= XAC,FR ×PPPX
U→$
PPPX
AC→$
, (D-4)
where FR represents French �rms. Variable XU,FR is the nominal value of X in U, to whichthe national industry-speci�c de�ator is then applied. Note that whether we compute theconversion before or after de�ating the series makes no di�erence to the �nal result.
The GGDC PPP series provide information on the purchasing power parities for Y , K,and M , but they do not provide series for investment. However, Inklaar and Timmer (2008)
30See Inklaar and Timmer (2008) for a comprehensive description of the database and of the methodologyfollowed to construct the PPP series.
26

provided guidance. Noting that PPPKϕ→$, the purchasing power parity for capital K between
currency ϕ and US dollars, we know that:
PPPK
AC→$= PPP I
AC→$× pKFR/p
IFR
pKUS/pIUS
, (D-5)
where pKFR denotes the user cost of capital in France, and pKUS denotes the user cost of capitalin the United States (Inklaar and Timmer, 2008, p. 35). Similarly, pIFR and pIUS denote thecurrent investment price in France and in the United States, respectively. Noting that forour base year 1997, pIFR and pIUS are set equal to unity, we express the investment PPP asa function of capital PPP as follows:
PPP I
AC→$= PPPK
AC→$× pKUSpKFR
. (D-6)
Based on all of the above, the conversion of the investment series IAC into IU is:
IU,FR = IAC,FR ×PPP I
U→$
PPP I
AC→$
= IAC,FR ×PPPK
U→$
PPPK
AC→$
× pKJPpKFR
, (D-7)
where pKJP represents the user cost of capital in Japan. Based on this new series of invest-ments, we compute capital stock K using the permanent inventory method.
Using the industry-speci�c PPP series provided by the GGDC, based on the industryclassi�cation common to both Japan and France, Equation (B-2) can be computed for eachdataset separately. This calculation produces comparable relative TFP indices for eachindividual �rm belonging to the same industry in France and in Japan.
27

Table1:
Japan�France
Produ
ctivityGaps,Firm-levelDatabases,2006
JPFR
JP/F
RIndu
stry
NMean
St.dev.
NMean
St.dev.
RelativeTFP
Textiles
173
1.39
0.133
303
0.66
0.144
2.12
Clothing
158
1.34
0.173
314
0.72
0.162
1.85
Manufacture
ofwood
870.81
0.090
191
1.26
0.109
0.64
Pulpandpaper
268
1.13
0.093
267
0.94
0.101
1.20
Printingandpu
blishing
539
0.99
0.149
474
1.07
0.198
0.92
Chemical
products
640
1.01
0.148
659
1.28
0.176
0.79
Rub
berandplastic
535
0.55
0.097
696
1.65
0.129
0.33
Non-m
etallic
mineral
products
322
0.79
0.155
322
1.29
0.174
0.61
Basicmetal
products
508
1.05
0.147
260
0.96
0.106
1.09
Fabricated
metal
products
626
1.01
0.136
1010
1.04
0.119
0.97
Machinery
andequipm
ent
966
1.11
0.124
908
1.11
0.144
1.00
Machinery
foro�
ceandservices
891.55
0.118
201.09
0.138
1.43
Electricmachinery
andapparatus
699
1.46
0.170
484
1.15
0.176
1.27
Com
mun
icationequipm
entandrelatedproducts
461.61
0.118
891.57
0.180
1.03
Medical
precisionandopticalinstruments
356
1.41
0.151
336
1.09
0.263
1.30
Motor
vehicles
614
1.38
0.097
270
0.74
0.139
1.87
Other
transportation
equipm
ent
153
1.35
0.122
160
0.70
0.193
1.92
Furnitureandothermanufacturing
265
1.03
0.179
365
1.27
0.142
0.81
Notes:Thistablepresents
theunweightedmeanof
thedistribu
tionsof
�rm
TFPforeach
country.
TFPismeasuredin
logarithms.
Source:Authors'ow
ncalculations.
28

Table2:
France�Japan
TFPCom
parisons:Indu
stry-LevelDataVersusFirm-LevelData.
BenchmarkYear1997
EUKLEMSindu
stries
EU-K
LEMSclassi�cation
FJclassi�cation
JP/F
RGGDC
JP/F
ROur
team
Textiles;textile
products;leatherandfootwear
17t19
1t2
1.13
2.25
Woodandproducts
ofwoodandcork
203
0.75
0.67
Pulp;
paper;paperproducts.printing
andpu
blishing
21t22
4t5
1.00
1.11
Chemicalsandchem
ical
products
246
0.80
0.74
Rub
berandplastics
products
257
0.50
0.31
Non-m
etallic
mineral
products
269t10
0.75
0.56
Basicmetalsandfabricated
metal
products
27t28
80.95
1.00
Machinery.nec
2911
0.99
0.97
Transport
equipm
ent
34t35
16t17
1.28
1.84
Electricalandopticalequipm
ent
30t33
13t15
1.19
1.41
Manufacturing
nec;recycling
36t37
180.78
0.76
Notes:
�nec�
means
�not
elsewhere
classi�ed.�
The
GGDC
series
are
sourced
from
http://w
ww.ggdc.net/databases/levels.htm
.�JP/F
ROur
team
�series
are
based
onourow
n(�rm
-level)TFP
compu
tations.
Speci�cally,column4reportstheratioof
theunweightedmeans
oftheJapanese
andtheFrench
�rms'
TFPdistribu
tionscompu
tedforthebenchm
arkyear
1997,respectively.Those
ratios
are�rst
compu
tedat
thelevelof
our18
FJindu
stries
andthen
aggregated
into
the11
EU-K
LEMSindu
stries
asunweightedmeans.
Source:Authors'ow
ncalculations.
29

Table3:
Exp
orters
andNon-Exp
orters,France
andJapan,
byIndu
stry,1994�2006
Exp
ortparticipation
Exp
ortintensity
JPFR
JPFR
JPFR
Indu
stry
NN
Per
cent
Per
cent
Mean
Mean
Allmanufacturing
100744
102004
27.5
84.6
11.5
26.4
Textiles
3148
5810
13.1
85.6
9.0
30.6
Clothing
6743
6743
6.9
72.9
7.7
22.4
Manufacture
ofwood
1345
2557
5.7
71.1
0.6
22.8
Pulpandpaper
3728
3977
7.3
89.1
13.8
22.9
Printingandpu
blishing
6948
6604
6.4
71.4
5.8
9.3
Chemical
products
8576
8904
45.0
94.0
7.3
32.3
Rub
berandplastic
6339
8538
22.9
83.9
6.3
19.2
Non-m
etallic
mineral
products
5127
4565
18.5
75.5
7.8
26.1
Basicmetal
products
6721
3652
23.6
92.5
7.3
35.4
Fabricated
metal
products
8786
13083
18.8
84.2
5.9
18.5
Machinery
andequipm
ent
12349
13260
44.8
86.9
13.1
33.5
Machinery
foro�
ceandservices
1430
423
34.9
97.3
16.4
47.9
Electricmachinery
andapparatus
12186
6696
34.8
85.8
15.6
30.4
Com
mun
icationequipm
entandproducts
2148
1394
31.1
73.2
18.4
30.7
Medical
precisionandopticalinstruments
4716
4522
51.8
92.2
14.3
34.6
Motor
vehicles
8217
3483
24.8
90.5
8.3
28.6
Other
transportation
equipm
ent
1979
2087
31.7
87.3
23.9
33.9
Furnitureandothermanufacturing
3712
5706
27.8
92.3
15.2
22.2
Source:Authors'owncalculations.Exp
ortparticipationisthepercentage
ofexporting�rmsover
theperiod
ofobserva-
tion.Exp
ortintensityiscompu
tedas
themeanof
theratioof
exportsover
salesforexporting�rmsonly.
30

Table 4: TFP Export Premium, by Size Class, 1994�2006
France JapanExport Export
N premium N premiumβ β
Size class (p-value) (p-value)All manufacturing �rms 99 963 0.0138 100 744 0.056
0.000 0.000SMEs (50�249) 75 850 0.0103 71 452 0.038
0.000 0.000Intermediate (250�499) 13 232 -0.0003 14 919 0.031
0.398 0.000Large (+500) 10 881 0.0050 14 373 0.026
0.280 0.000
Notes: β is the estimated regression coe�cient from an OLS -regression of log (TFP) ona dummy variable for exporting �rms, controlling for a full set of the interaction terms ofindustry dummies and year dummies. The regression is �rst computed on the entire set ofmanufacturing �rms in each country, and then separately on each subset of �rms belongingto a speci�c size class.
Source: Authors' own calculations.
31

Table5:
Produ
ctivityLevelDi�erencesbetweenFrench
andJapanese
Firmsby
Indu
stry
andby
Exp
ortStatus
All�rms
Exp
orters
Non-exp
orters
JPFR
TFP
JPFR
TFP
JPFR
TFP
Mean
Mean
Di�erence
Mean
Mean
Di�erence
Mean
Mean
Di�erence
Allmanufacuring
1.04
1.02
0.02***
1.07
1.02
0.05***
1.02
1.01
0.01***
Textiles
1.31
0.59
0.72***
1.37
0.59
0.78***
1.30
0.57
0.72***
Clothing
1.23
0.61
0.62***
1.34
0.61
0.73***
1.22
0.60
0.62***
Manufacture
ofwood
0.78
1.19
−0.41**
0.80
1.18
−0.38***
0.77
1.20
−0.42***
Pulpandpaper
1.08
0.90
0.18***
1.11
0.89
0.22***
1.07
0.91
0.17***
Printingandpu
blishing
0.96
1.00
−0.04***
1.01
1.00
0.00
0.96
1.00
−0.04***
Chemical
products
0.90
1.19
−0.29***
0.93
1.19
−0.27***
0.87
1.16
−0.29***
Rub
berandplastic
0.49
1.58
−1.09***
0.52
1.58
−1.06***
0.48
1.56
−1.09***
Non-m
etallic
mineral
products
0.72
1.27
−0.55***
0.76
1.27
−0.51***
0.71
1.25
−0.55***
Basicmetal
products
1.02
0.94
0.08***
1.05
0.94
0.10***
1.01
0.93
0.07***
Fabricated
metal
products
0.95
1.04
−0.09***
0.97
1.04
−0.07***
0.94
1.03
−0.09***
Machinery
andequipm
ent
1.00
1.04
−0.04***
1.02
1.04
−0.01***
0.97
1.02
−0.05***
Machinery
foro�
ceandservices
1.38
0.88
0.51***
1.45
0.88
0.57***
1.35
0.85
0.50***
Electricmachinery
andapparatus
1.27
0.94
0.33***
1.31
0.94
0.37***
1.24
0.91
0.33***
Com
mun
icationequipm
entandrelatedproducts
1.28
1.17
0.12***
1.34
1.17
0.17***
1.25
1.15
0.11***
Medical
precisionandopticalinstruments
1.26
0.93
0.33***
1.28
0.93
0.35***
1.23
0.91
0.32***
Motor
vehicles
1.32
0.68
0.64***
1.35
0.68
0.67***
1.30
0.62
0.68***
Other
transportation
equipm
ent
1.23
0.68
0.55***
1.28
0.69
0.59***
1.21
0.64
0.57***
Furnitureandothermanufacturing
0.89
1.17
−0.27***
0.95
1.17
−0.22***
0.87
1.10
−0.23***
Notes:In
this
table,
wereport
thedi�erences
betweenthemeanTFP
levels
(inlogarithms)
ofJapanese
andFrench
�rms.
Positivevalues
indicate
that
Japanese
�rmsoutperform
theirFrench
counterparts.***and**
indicate
statistical
signi�canceat
the1and5percent
levels,respectively.
Source:Authors'ow
ncalculations.
32

Table6:
Kolmogorov�SmirnovTestforStochasticDom
inance
ofG(JP)over
G(FR)
All�rms
Exp
orters
Non-exp
orters
Critical
Critical
Critical
Distance
probability
Distance
probability
Distance
probability
Allmanufacturing
−0.
081
0.000
−0.
199
0.000
−0.
079
0.000
Textiles
−0.
981
0.000
−1.
000
0.000
−0.
960
0.000
Clothing
−0.
922
0.000
−0.
989
0.000
−0.
896
0.000
Manufacture
ofwood
0.975
0.000
0.989
0.000
0.977
0.000
Pulpandpaper
−0.
715
0.000
−0.
788
0.000
−0.
708
0.000
Printingandpu
blishing
0.077
0.000
−0.
105
0.000
0.068
0.000
Chemical
products
0.749
0.000
0.727
0.000
0.698
0.000
Rub
berandplastic
0.999
0.000
0.999
0.000
0.998
0.000
Non-m
etallic
mineral
products
0.963
0.000
0.938
0.000
0.981
0.000
Basicmetal
products
−0.347
0.000
−0.436
0.000
−0.361
0.000
Fabricated
metal
products
0.309
0.000
0.239
0.000
0.325
0.000
Machinery
andequipm
ent
0.137
0.000
0.067
0.000
0.181
0.000
Machinery
foro�
ceandservices
−0.874
0.000
−0.935
0.000
−0.989
0.000
Electricmachinery
andapparatus
−0.669
0.000
−0.740
0.000
−0.685
0.000
Com
mun
icationequipm
entandrelatedproducts
−0.369
0.000
−0.481
0.000
−0.362
0.000
Medical
precisionandopticalinstruments
−0.703
0.000
−0.742
0.000
−0.674
0.000
Motor
vehicles
−0.986
0.000
−0.996
0.000
−0.972
0.000
Other
transportation
equipm
ent
−0.931
0.000
−0.968
0.000
−0.920
0.000
Furnitureandothermanufacturing
0.718
0.000
0.639
0.000
0.631
0.000
Notes:Negativedistance
impliesthe�rst-order
stochastic
dominance
ofG(JP)withrespectto
G(FR),
sothat
the
distribu
tion
ofJapanese
�rmsliesto
therightof
thedistribu
tion
ofFrench
�rms.
Source:Authors'ow
ncalculations.
33

Table7:
Produ
ctivityDi�erencesby
Exp
ortDestination
forAllManufacturing
Firms
JPFR
TFP
Mean
Mean
Di�erence
All�rms
1.038
1.022
0.016***
Exp
orters
ToNorth
America
1.090
1.043
0.047***
ToEurope
1.094
1.030
0.064***
ToAsia
1.074
1.035
0.039***
Notes:Exp
orters
inthistablearerestricted
tothose�rmsthat
export
tospeci�cdestinations.***indicatesstatistical
signi�canceat
the1percent
level.
Asiainclud
esBangladesh,
China,HongKong,
India,
Macao,Mongolia,Pakistan,
SouthKorea,T
aiwan,SriLanka,and
ASE
ANcountries.Europeinclud
esEU(28)
countries,Iceland,Norway,Switzerland,
Turkey,
form
erSoviet
Union
countries,andform
erYugoslavian
countries.
North
Americaiscomposedof
Canadaand
theUnitedStates.
Source:Authors'ow
ncalculations.
34

𝐸(𝜃2| 𝜃2 > θcX,2 )
𝐸(𝜃2) 𝐸(𝜃1)
𝐸(𝜃1| 𝜃1 > θcX,1 )
θcX,1 θcX,2
Figure 1: Productivity Gaps as a Function of Export Threshold Value, dashed line = Country 1, solidline=Country 2
35
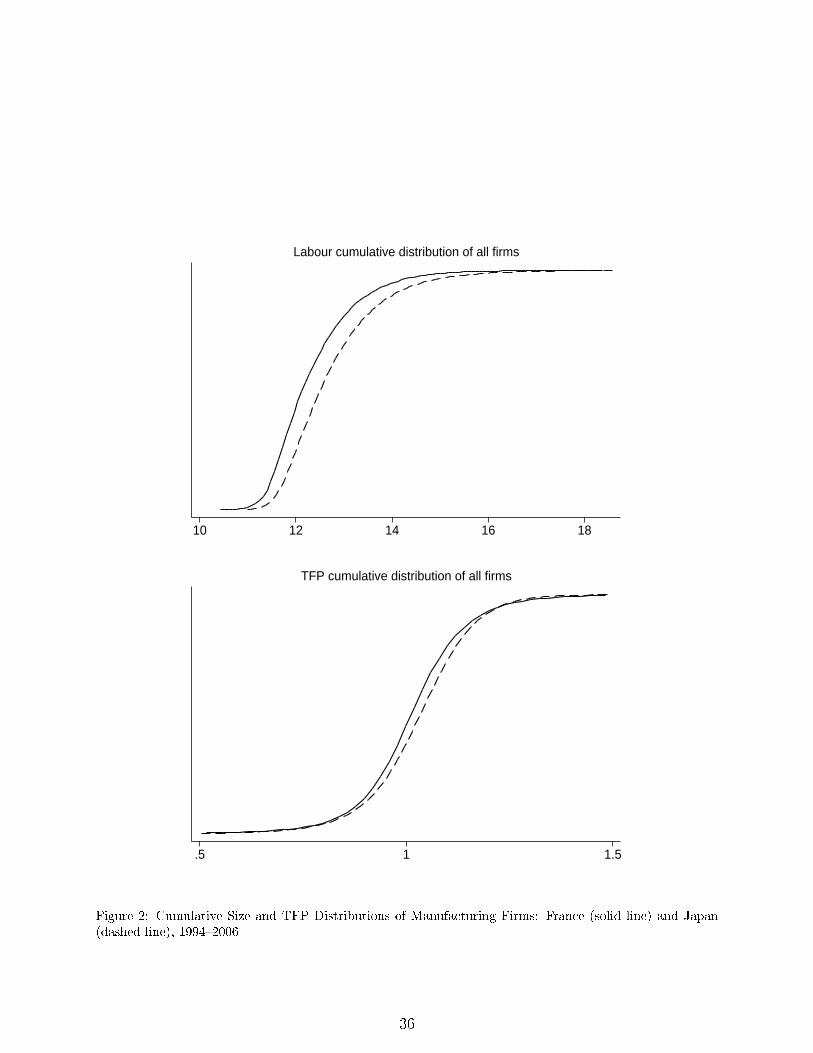
10 12 14 16 18
Labour cumulative distribution of all firms
.5 1 1.5
TFP cumulative distribution of all firms
Figure 2: Cumulative Size and TFP Distributions of Manufacturing Firms: France (solid line) and Japan(dashed line), 1994�2006
36

.5 1 1.5
TFP cumulative distribution of exporting firms
.5 1 1.5
TFP cumulative distribution of non exporting firms
Figure 3: Cumulative TFP Distributions of Manufacturing Firms by Export Status: France (solid line) andJapan (dashed line), 1994�2006
37

DOCUMENTS DE TRAVAIL GREDEG PARUS EN 2012GREDEG Working Papers Released in 2012
2012-01 Frédéric Marty Les clauses environnementales dans les marchés publics : perspectives économiques2012-02 Christophe Charlier Distrust and Barriers to International Trade in Food Products: An Analysis of the US- Poultry Dispute2012-03 Gérard Mondello The Equivalence of Strict Liability and Negligence Rule: A Trompe-l’Œil Perspective2012-04 Agnès Festré & Pierre Garrouste Somebody May Scold You! A Dictator Experiment2012-05 Dorian Jullien & Nicolas Vallois A Probabilistic Ghost in the Experimental Machine2012-06 Gérard Mondello Ambiguity, Agency Relationships, and Adverse Selection2012-07 Flora Bellone, Kozo Kiyota, Toshiyuki Matsuura, Patrick Musso & Lionel Nesta International Productivity Gaps and the Export Status of Firms: Evidence from France and Japan