International patterns of union membershipblnchflr/papers/MA-DOCS_350052_1.pdf · I thank John...
36
International patterns of union membership David G. Blanchflower Bruce V. Rauner '78 Professor of Economics Dartmouth College and NBER Email: [email protected] Website: www.dartmouth.edu/~blnchflr Forthcoming British Journal of Industrial Relations , March 2007 Tuesday, November 28, 2006 I thank John Addison, Alex Bryson, John DiNardo, Rafael Gomez, Morley Gunderson, Al Gustman, David Howell, Richard Freeman, Geraint Johnes, Tom Lemieux, Craig Riddell, Andrew Oswald, John Pencavel, Craig Riddell, Herb Schuetze, Claus Schnabel and Doug Staiger for help with the data and helpful comments and suggestions. All errors are mine.
Transcript of International patterns of union membershipblnchflr/papers/MA-DOCS_350052_1.pdf · I thank John...

International patterns of union membership
David G. Blanchflower
Bruce V. Rauner '78 Professor of EconomicsDartmouth College and NBER
Email: [email protected]: www.dartmouth.edu/~blnchflr
Forthcoming British Journal of Industrial Relations, March 2007
Tuesday, November 28, 2006
I thank John Addison, Alex Bryson, John DiNardo, Rafael Gomez, Morley Gunderson, AlGustman, David Howell, Richard Freeman, Geraint Johnes, Tom Lemieux, Craig Riddell,Andrew Oswald, John Pencavel, Craig Riddell, Herb Schuetze, Claus Schnabel and Doug Staigerfor help with the data and helpful comments and suggestions. All errors are mine.

Abstract
This paper examines changes in unionization that have occurred over the lastdecade or so using individual level micro data on many countries, with particularemphasis on the UK, the US and Canada. I document an empirical regularity nothitherto identified, namely the probability of being unionized follows an invertedU-shaped pattern in age, maximizing in the mid to late 40s in thirty-four of thethirty-eight countries I study. I consider the question of why union membershipseems to follow a similar inverted U-shape pattern in age across countries withsuch diverse industrial relations systems. I find evidence that this arises in partbecause of cohort effects, but even when cohort effects are removed a U-shaperemains.

1
This paper examines changes in unionization that have occurred over the last decade or so usingindividual level micro data on twenty-seven of the thirty OECD countries, with particularemphasis on Canada, the United Kingdom and the United States. Micro-data are also used tomodel union membership in a further eleven non-OECD countries.
The characteristics of union members show many similarities across countries. Density rates aregenerally higher for men than for women, and in the public sector than in the private sector. Forthe UK and the US I find the probability of being a union member is higher for blacks thanwhites and higher for full-timers than part-timers. Most striking of all, the probability of being aunion member follows an inverted U-shaped pattern in age, maximizing in Canada, the US andthe UK in the mid to late 40s. This inverted U-shaped pattern is repeated in a further thirty-onecountries, the unweighted average of the age maximum of all thirty-four countries being 48. Theonly countries I did not find evidence that density had an inverted U-shape in age are thePhilippines, Cyprus, Latvia and Brazil.
First, I examine changes in unionization across countries and document recent changes. Then Iuse rich micro-data for the UK, Canada and the US to estimate the probability of unionmembership. I examine these three countries first because the data sets are comparable, covermany years and are large. I then present similar analyses for many countries from theInternational Social Survey Programme (ISSP) and the European Social Survey (ESS) and theEurobarometers of 1988-1994 and 2001 (EB). I find evidence of an inverted U-shape in age inthirty-four countries - Australia; Austria; Bangladesh; Belgium; Bulgaria; Canada; Chile; CzechRepublic; Denmark; Estonia; Finland; France; Germany; Greece; Hungary; Ireland; Israel;Japan; Italy; Luxembourg; Mexico; Netherlands; New Zealand; Norway; Poland; Portugal;Russia; the Slovak Republic; Slovenia; Spain; Sweden; Switzerland; the UK and the US.Finally, I consider the question of why the probability of union membership follows an invertedU-shape in age across so many countries with diverse industrial relations systems. However, thefact that the result is so widespread across such a diverse group of countries, suggests that itsexplanation is unlikely to be driven by country-specific institutional features. There is evidencefrom the US and the UK that there are strong cohort effects at work, but even when cohorteffects are removed an inverted U-shape remains.
1. Characteristics of union membersOver the last three decades or so there have been a series of global changes that have weakenedthe power of unions (Pencavel, 2005). Product markets have become more competitive and thecomposition of employment has also shifted from highly unionized to traditionally non-unionsectors and workers. Younger workers have shown less interest in belonging to unions than theirparents and their grandparents (Blanden and Machin, 2003). Labor markets have also becomeincreasingly internationalized, as trade has been liberalized, immigration increased, and capitalmarkets taken on a more global structure. A major slowdown in world economic growth andproductivity and increased inflation following the 1970s oil shocks, created adverse labor marketsituations in most countries. Unemployment rates soared, particularly in Europe; unemploymentconsistent with given levels of vacancies rose; real wages fell for blue-collar workers,particularly in the US, and unions in several countries took real wage cuts in the 1980s in orderto stimulate employment. An important exception is the UK, where substantial real wage gains

2
were experienced across the wage distribution through the 1980s and 1990s. Katz, Loveman andBlanchflower (1995) provide a discussion.
Labor laws in many countries have also become much less union friendly than they were in thepast. Blanchflower and Freeman (1994) provide a discussion of the impact of the Thatcherreforms on the British labor market and for more recent evaluations see the various chapters inBlundell, Card and Freeman (2003). For instance, over the last two decades New Zealand hasexperienced economic liberalization, welfare cuts and the restructuring of the industrial relationssystem by eliminating national awards and removing compulsory unionism. Union density fellas a consequence. In other countries, such as the US, there has been an increase in overtemployer hostility toward unions as measured by increases in violations of labor laws (Kleiner,2002).
For all of these reasons one would expect to see unions in retreat across the globe (Blanchflowerand Freeman, 1994). Table 1, does show that unions have been in decline in most of the majorOECD countries for the period 1970-2003. For example, using data from the final column of thetable, Australia (-27), Austria (-27) and New Zealand (-33) all experienced declines of more thantwenty percentage points, with percentage point declines from 1970-2003 in parentheses.However, there are several examples of countries over the same period that had increases inunion density rates (e.g. Belgium (+13); Denmark (+10); Finland (+23) and Sweden (+10). Thestory is different, however, if we confine ourselves to the last decade or so. If we examinecolumns 7 and 8 of Table 1 for the periods 1993-1998 and 1998-2003 it is apparent that, with theexception of Belgium, which had a very small increase, union density rates in the remainingnineteen countries were lower in 2003 than they were in both 1993 and 1998. Not a singleOECD country experienced rising union density between 1998 and 2003. In addition, three ofthe four countries that had big increases over the period 1970-2003 experienced declines indensity in the most recent two periods (Denmark; Finland and Sweden). There is considerableevidence that unions over the last ten years have been in retreat in most major countries. Thereis some evidence, then, that unionization rates across countries have started to converge.
Despite considerable differences in time series paths of union density rates and in the level ofdensity, there are many similarities in the characteristics of union members across countries interms of the industry where they work, their race, gender and whether they are employed in thepublic or private sectors. As we will see in further detail below, what is particularly notable isthat the probability of an individual being a union member follows an inverted U-shapemaximizing around age 50 in all OECD countries.
We start with a comparison of Canada, the US and the UK where the micro-data available areparticularly detailed. Table 2 provides details of the characteristics of union members in thethree countries in 2004 (2005 for the US). Despite considerable differences in the levels of uniondensity in the three countries there are many similarities in the characteristics of union membersand in the sectors in which union workers are employed. Union density is currently 28.8% in theUK compared with 12.8% in the US and 30.7% in Canada. In all three countries the rates bygender are little different, while the membership of blacks is higher than that of whites in the UKand the US. This is not true of other racial groups – in the UK Indians, Pakistanis andBangladeshis ('Asians') have relatively low union density rates, as do Hispanics in the US. The

3
young are less likely to be members of unions in all three countries. Membership rates inmanufacturing and construction are lower than average in the UK, but higher than average in theUS. Public sector unionism is higher than in the private sector in all three countries although thedifference is greater in the UK and Canada than it is in the US.
Trends in union density have diverged between the public and private sectors in the US, the UK,Canada and elsewhere. (See for the UK, 1948-1979 from Bain and Price (1983b) Table 5 andGrainger and Holt, Department of Trade and Industry, April 2005www.dti.gov.uk/er/emar/tradeunion_membership2004.pdf. For the US the data are downloadableat www.unionstats.com. For Canada, see Lipset and Meltz (2004)). Workers in the publicsector are members of unions while private sector workers are less inclined to be so. In the US,private density has fallen steadily in almost every year since 1960, while in Canada and the UK ithas fallen since the early 1990s. The story in the public sector is very different. In the case of theUS, public sector density reached its highest level of 40.2% in 1976 and then has remained moreor less steady in the mid thirties since then. In the UK, public sector density has also fallen sincethe early 1990s (1993=64.4% compared with 58.4% in 2004), whereas public sector density inCanada has actually increased (1990=64.6% compared with 70.6% in 2005). At the time ofwriting the UK and Canada had density rates in the private sector of around 17%, more thandouble the US rate of 8%. Public sector density rates in the UK and Canada (58.8% and 70.6%)were also higher than the rate in the US (36.5%).
Visser (2003, Table 11.8) reported union density estimates for a number of countries, whichconfirm that the much higher rate in the public sector is very general across OECD countries(below). His, somewhat older, estimates for the UK, the US and Canada are very close to thosereported in Table 2. The difference is especially stark in Switzerland, Poland and Canada.
Private PublicAustralia (1998) 24 55Austria (1998) 30 69Canada (2000) 18 70Denmark (1997) 65 86Finland (1989) 65 86France (1993) 4 25Germany (1997) 22 56Great Britain (1999) 19 60Israel (1997) 25 50Italy (1997) 36 43Japan (1995) 22 68Netherlands (1997) 19 45Norway (1995) 44 79Poland (1999) 10 80Spain (1997) 15 32Sweden (1997) 77 93Switzerland (1988) 22 71US (1999) 9 37

4
To determine whether a randomly selected individual is a member of a union, or not, it is clearlycrucial to know whether he or she works in the public sector. It also turns out that knowing theirage is crucial.
Table 2 makes it clear that union density rates rise with age, with relatively low rates whenyoung in all three countries with the highest rates around age 50. After age 50 unionmembership rates subsequently decline. Density rates are especially low for those under the ageof 20 in all three countries. In the case of Canada, Morissette et al (2005) show that unionizationrates for the age group 55-64 became lower than workers ages 45-54 only from the end of the1980s. (Source: Survey of Work History, 1981; Labour Market Activity Survey, 1986 and 1989;Labour Force Survey, 1998 and 2004). The inverse U-shaped pattern appears to be a relativelynew phenomenon in Canada, although the reasons for this are uncertain. Their reported uniondensity rates are presented below.
Age 1981 1986 1989 1998 200417-24 26.4 17.1 18.4 11.9 13.625-34 39.8 36.4 34.7 25.0 26.135-44 42.0 43.3 42.9 35.8 32.845-54 41.7 43.4 44.6 42.8 41.255-64 41.9 43.8 41.6 38.4 38.2
It is apparent that there are other similarities between Canada, the US and the UK in thecharacteristics of union members, who are disproportionately male, older and employed in thepublic sector. Union density is highest in all three countries among the most educated. There area number of differences though; density is higher in construction than it is in the private sectorand overall in the US and Canada, but below it in the UK. Professional occupations have aconsiderably higher probability of being unionized in the UK than in the other two countries.Males have a higher probability of being unionized in the US, but there is little difference bygender in the UK and Canada. We now turn to model econometrically micro-data on unionmembers in Canada, the UK, the US and elsewhere to further explore such differences in thecharacteristics of union members.
2. Econometric AnalysesWhat are the characteristics of individuals who belong to a trade union? The union membershipdecision has generally been modeled by economists under a demand and supply framework. Thedemand for unionization on the part of workers (Schnabel, 2003), Ud, is written as follows
Ud=d(c, D, z, s, t)
where c is the cost of membership, D is the union wage gap, z are non-pecuniary benefits such asbetter working conditions, s is the cost of social welfare benefits and t is the individual's taste forunionism. The higher is the wage gap, non-pecuniary benefits and the greater the taste forunions and the lower are alternative benefits the greater the demand for unions. The supply ofunion Us is written where
Us=s(p, g)

5
and p is the cost of providing union services and g in the supply function stands for union goals,such as maximizing membership. Assuming market clearing the equilibrium level of unionismU= Ud=Us. In reduced form then U=f(t, D, z, s, t, p, g), which is what is generally estimatedempirically. Since most of these factors cannot be measured they are often substituted by proxyvariables such as personal characteristics, industry and location that are likely to impactunionism.
The starting point for the empirical analysis will be a comparison of the determinants of unionmembership in the UK, the US and Canada using several large individual level micro-data fileswith broadly similar sets of control variables. I then move on to examine data from the threecross country data files that have the same information available in a further thirty-five countries.In each case I conduct country level analysis. Details of the data files used in this analysis areprovided in the data appendix.
2.1. United KingdomA number of papers have modeled the determinants of union membership in the UK usingmicro-data at the level of the individual. Papers include Stewart (1983); Bain and Elias (1985);Booth (1986); Payne (1989); Green (1990, 1992); Cregan (1991), Elias (1996); Blandon andMachin (2003) and Machin (2004). There is evidence that the probability of membership ishigher amongst men, is positively related to age or experience and in some cases is concave inage. There is also some evidence of positive non-white effects and negative education effects.For a discussion see Riley (1997) and Schnabel (2003). Note that in the UK union membershipis an individual decision; hence union members are employed at workplaces which are coveredby collective agreements or which recognize unions for bargaining. However, in contrast to theUS, for example, union members are also employed at 'non-union' workplaces.
Table 3 reports the results of estimating dprobit models of union membership for the UK. Probitanalysis is performed here using the dprobit command in the statistical program STATA 9.0 SE.Dprobit reports the marginal effect, that is the change in the probability for an infinitesimalchange in each independent, continuous variable and by default, reports the discrete change inthe probability for dummy variables. The sample is restricted to workers only. The dependentvariable is set to one if the individual is a union member, zero otherwise. In all equations thefollowing controls are included - age and its square, gender, race dummies, qualificationdummies, industry dummies, region of residence dummies and a full-time dummy. A time trend(1993=0) is included in columns 1-3 rather than year dummies to determine the ceteris paribusannual rate of decline. Columns 2 and 5 restrict the samples to the private sector while columns3 and 6 restrict it to the public sector. Column 3 adds 5 further dummies to distinguish the typeof public sector organization, with Central Government the excluded category: such data are notavailable in the GHS. For brevity the coefficients and t-statistics on only higher degree andbachelor's degree are reported compared to the excluded category 'no qualifications', although afull set of education variables are included.
The main findings are as follows.

6
Men are significantly more likely to be members than women. This contrasts with the resultsobtained in Machin, who finds "by 2001 there is no gender gap in union membership" (2004,p. 430) even though the male variable in his Table 2 has a (small) positive coefficient and a t-statistic of 1.75.i There are no gender effects in the public sector in either time period.ii
Blacks have a higher probability of being unionized than whites.
Overall schooling and qualifications are related positively to membership in the public sector,but negatively in the private sector and the differences are big. Individuals with a first degreehave a 3.4 percentage point lower probability of being a union member than a workerwithout formal qualifications in the private sector, but a 16 percentage point higherprobability in the public sector. This was not apparent in 1983.
The probability of being a union member rises with age and reaches a maximum in the late40s (48 using the LFS and 46 from the GHS). When a set of eleven age dummies, eachcovering five years (e.g. 20-24) are included the function maximizes a little higher in the agecategory 50-54. There was no evidence to suggest that higher order terms in age weresignificant.
The maximum of the age function has moved up slightly over time from 46 in 1983 to 48 in1993-2003.
Union density has declined by nearly half a percentage point a year holding constantcharacteristics.
There remains a large public sector differential of more than 40 percentage points.
Full-timers have higher density rates than part-timers
The broad patterns observed in the data using the LFS from 1993-2004 are similar to thoseobserved using a much smaller data file from the GHS for 1983.
2.2. United StatesI now turn to estimating dprobit models of union membership in the US using data from the CPSMerged Outgoing Rotation Group (MORG) Files of 1984-1991 and separately for 1992-2004 todetermine the extent to which the unionized workforce in the two countries is comparable. I usedata from the earlier period as background; union data first become available in the MORGs in1984. Information is available on the union status of approximately 1.6 million workers in thefirst period and over two million in the later period. Even though data are available for 2003 and2004 I report separate estimates for 1992-2002 and 2003-4 because of changes in the industrycode, which went from one based on the SIC to NAICS, which make comparisons difficult. Thedependent variable is set to one if the individual is a union member, zero otherwise. It isnecessary to change the schooling measure in the later period because the BLS switched from aschooling measure to a more credential based indicator. In all equations age and its square, full-time status dummy, race dummies, a gender dummy plus controls to distinguish whether theindividual worked in the public or private sector as well as state and industry are included.

7
Controls are as similar as I can make them to the controls used in the UK above. Examples ofpapers for the United States that model the probability of union membership using micro datainclude Antos et al (1980) and Hirsch and Berger (1984).
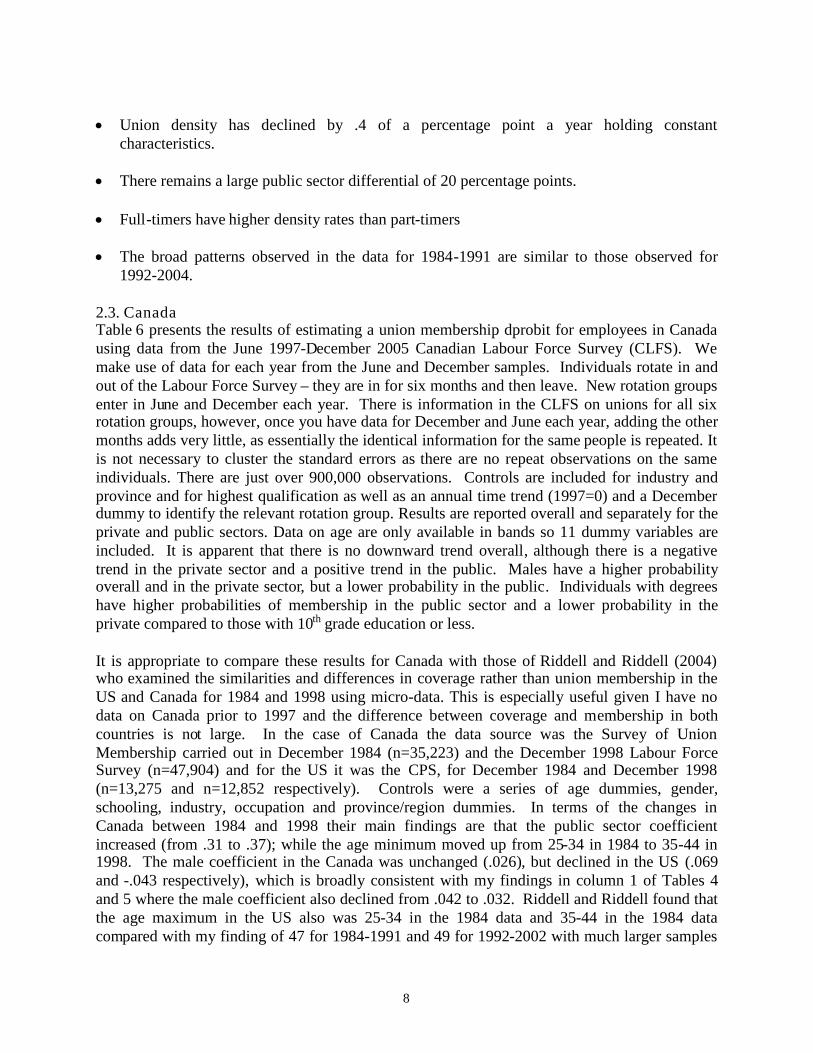
Table 4 for the period 1984-1991 includes years of schooling as the education control. Table 5for the subsequent period includes 15 highest qualification controls; the decision to split the datain two in 1992 arises because of changes in the education question in the CPS in that year.Separate results are presented for the periods 1992-2002 and then for 2003-2004 because ofchanges in the industry classification. In Table 3 the coefficients on the four highest educationcategories compared with workers with <1st grade education are reported – once again theremaining dummies were included, but results are not reported. Tables 4 and 5 for the USsuggest that the decline in union density has slowed (from 0.36 percentage points per annum inthe first period to 0.18). It is also apparent that the broad patterns are similar – by race, gender,full-time/part-time and by education. The main difference between the two tables is that in thefirst period the trend in public sector density is insignificant, but in the second period it turnsdown. The results reported here are broadly consistent with those of Bender (1997) who usedindividual level data from the 1972 and 1987 May CPS files to estimate separate unionmembership equations for each of these years using a variety of estimation techniques.However, in contrast to the results reported here his sample was restricted to manufacturing only.He found some declines in the gender and age/experience terms over time, but overall relativelyfew significant differences between the estimated coefficients over time. The results werebroadly similar whichever estimation method was used. Changing socio-demographiccharacteristics did not have a large effect on the decline in density, which is consistent with theresults reported here. Bender's central finding is that gains in educational levels, changingoccupations, and reductions in the economies of scale of union organizing activity appear to haveplayed a much more important role. For brevity only a few selected qualifications and statedummies are reported.
Men are more likely to be members than women in both the private and public sectors, bybetween 3 and 4 percentage points.
Blacks have a higher probability of being unionized than whites.
Overall schooling and qualifications are related positively to membership in the public sector,but negatively in the private sector.
The probability of being a union member rises with age and reaches a maximum in the late40s (47 for 1984-1991, 49 from 1992-2002 and 48 for 2003/4). There was no evidence tosuggest that higher order terms in age were significant. When a set of eleven age dummies,each covering five years (e.g. ages 20-24) are included, the function maximizes in the agecategory 50-54.
As in the UK, the maximum of the age function has moved up slightly over time from 47 forthe period 1979-1991, to 49 for the period 1992-2002 (48 for 2003/4). The age maximum inthe US is higher in the private sector than in the public sector, whereas it is the same in thetwo sectors in the UK.
8
Union density has declined by .4 of a percentage point a year holding constantcharacteristics.
There remains a large public sector differential of 20 percentage points.
Full-timers have higher density rates than part-timers
The broad patterns observed in the data for 1984-1991 are similar to those observed for1992-2004.
2.3. CanadaTable 6 presents the results of estimating a union membership dprobit for employees in Canadausing data from the June 1997-December 2005 Canadian Labour Force Survey (CLFS). Wemake use of data for each year from the June and December samples. Individuals rotate in andout of the Labour Force Survey – they are in for six months and then leave. New rotation groupsenter in June and December each year. There is information in the CLFS on unions for all sixrotation groups, however, once you have data for December and June each year, adding the othermonths adds very little, as essentially the identical information for the same people is repeated. Itis not necessary to cluster the standard errors as there are no repeat observations on the sameindividuals. There are just over 900,000 observations. Controls are included for industry andprovince and for highest qualification as well as an annual time trend (1997=0) and a Decemberdummy to identify the relevant rotation group. Results are reported overall and separately for theprivate and public sectors. Data on age are only available in bands so 11 dummy variables areincluded. It is apparent that there is no downward trend overall, although there is a negativetrend in the private sector and a positive trend in the public. Males have a higher probabilityoverall and in the private sector, but a lower probability in the public. Individuals with degreeshave higher probabilities of membership in the public sector and a lower probability in theprivate compared to those with 10th grade education or less.
It is appropriate to compare these results for Canada with those of Riddell and Riddell (2004)who examined the similarities and differences in coverage rather than union membership in theUS and Canada for 1984 and 1998 using micro-data. This is especially useful given I have nodata on Canada prior to 1997 and the difference between coverage and membership in bothcountries is not large. In the case of Canada the data source was the Survey of UnionMembership carried out in December 1984 (n=35,223) and the December 1998 Labour ForceSurvey (n=47,904) and for the US it was the CPS, for December 1984 and December 1998(n=13,275 and n=12,852 respectively). Controls were a series of age dummies, gender,schooling, industry, occupation and province/region dummies. In terms of the changes inCanada between 1984 and 1998 their main findings are that the public sector coefficientincreased (from .31 to .37); while the age minimum moved up from 25-34 in 1984 to 35-44 in1998. The male coefficient in the Canada was unchanged (.026), but declined in the US (.069and -.043 respectively), which is broadly consistent with my findings in column 1 of Tables 4and 5 where the male coefficient also declined from .042 to .032. Riddell and Riddell found thatthe age maximum in the US also was 25-34 in the 1984 data and 35-44 in the 1984 datacompared with my finding of 47 for 1984-1991 and 49 for 1992-2002 with much larger samples

9
in Tables 4 and 5. The main differences in the controls used for the US is that I included fiftystate dummies while Riddell and Riddell (2004) included 11 occupation dummies and 8 regiondummies and fewer industry and education controls.
It is apparent that in all three countries using the most recent data available that, ceteris paribus,
1) males have higher probabilities than females,2) private sector workers have lower probabilities of being members than public sector workers,3) more educated workers have higher probabilities of being a union member in the public sectorand lower probabilities in the private sector,4) full-timers have a higher probability than part-timers,5) middle aged workers have the highest probability of joining a union. There is some evidencethat this maximum has risen over time as unionization rates have declined.
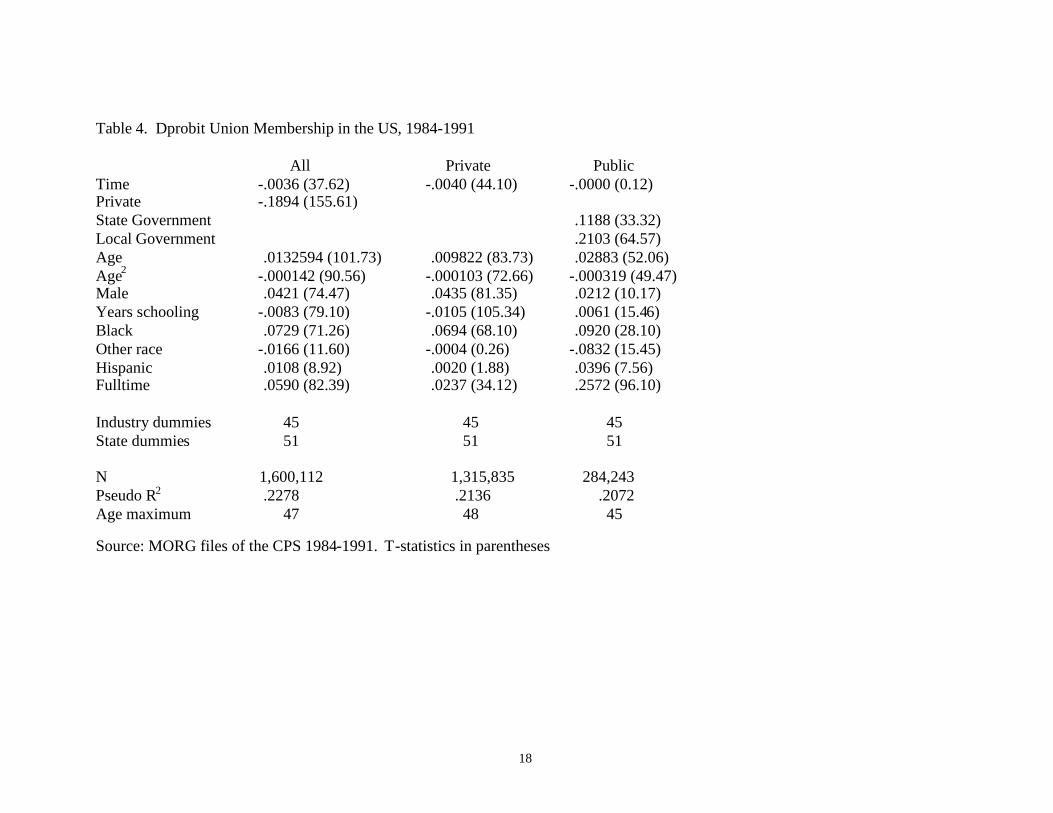
2.4. Other countries.Is the inverted U-shaped pattern in these data for the UK, Canada and the US repeated in othercountries? I explore this issue by using micro data at the level of the individual from threesurvey series. The data series are 1) International Social Survey Programme (ISSP) for 2000-2002 (n=48,194), 2) The European Social Surveys of 2002 and 2004 (ESS) (n=33,116), 3)Eurobarometer surveys from 1988-1994 and 2001 (n=247,883). Details of the surveys areprovided in the data appendix. Separate dprobit union membership equations for each countryare estimated with other controls including gender and education and year dummies ifappropriate and age and its square. Table 7 reports age maxima for each country in turn wherethe reported numbers are solved out from the positive age terms and the negative age squaredterms if they are significant. Union density is an inverted U-shape in age at least once for thirty-four countries (including Canada, the UK and the US) out of the thirty-eight countries for whichI have data. There was no evidence of an inverted U-shape for Latvia, the Philippines, Brazil orCyprus using the ISSP data. The country with the lowest age maximum at 27 is Bangladesh andthe one with the highest at 64 is Hungary. The unweighted average across these countries is 48,which is consistent with the evidence found for the US and the UK obtained above where it waspossible to also include the two age terms. Sample sizes are somewhat smaller in the ISSP andthe ESS than in the Eurobarometers, where the most consistent evidence is found. In particular itappears that membership is related to age in an inverse U-shape maximizing in the late forties,no matter what the level of union density prevailing in the country or whether it is corporatist ornot.
I also explored the extent to which the other patterns identified above were replicated in othercountries and the evidence was much more mixed than that for the U-shape in age, presumablyin part driven by the relatively small sample sizes. For example, in the case of the equationsused to estimate the age maxima in column 1 of table 7 (results not reported), twelve out ofthirty-one countries had significant and negative male coefficients (Austria; Bangladesh; Canada;Denmark; France; West Germany; Great Britain; Ireland; Netherlands; Spain; Switzerland andthe United States) while four had significant negative coefficients (Finland; Russia, Slovenia andSweden) with the remainder insignificant. In the case of the ESS equations used in column 2 ofTable 7 to estimate age maxima, eleven out of twenty-two countries had positive and significantmale effects (Austria; Belgium; Germany; Greece; Ireland; Italy; Luxembourg; Netherlands;

10
Portugal; Spain and Switzerland) while three had significant negative effects (Finland, Sloveniaand Sweden) while the remaining eight had insignificant male coefficients. These three countriesalso had significant negative male coefficients in the ESS equations. Results were even weakerfor private sector and schooling variables in both data sets with more than half of coefficients oneach of these variables being insignificantly different from zero. Interestingly the ISSP equationsconfirmed the findings for the UK, the US and Canada of an inverse U-shape in age, positivemale effects and negative private sector effects.
3. DiscussionThe paper reports on the declining levels of union density in many countries both inside andoutside the OECD that have occurred in most countries in recent years. It was noted that inmany countries unions had been more successful in the public sector than in the private: publicsector densities in many countries were more than twenty percentage points higher. Evidencewas also found that males had higher probabilities of being union members in the majority ofcountries examined, although there was some evidence that females had higher probabilities inthe public sector. Similarly, some evidence was found suggesting that education had a positiveimpact in the public sector and a negative impact in the private.
The most consistent and novel result in the paper is the finding that union membership followsan inverted U-shape in age across many countries with different density levels and trends andtypes of bargaining. We have micro-data at the level of the individual on twenty-seven out of thethirty members of the OECD and find an inverted U-shape in age in at least one of our data setsfor all twenty-seven.iii The only exceptions are Turkey, Korea and Iceland where I have no data.I also have the same inverse U-shaped result for Bangladesh, Chile, Bulgaria, Estonia, Israel,Norway and Russia. The only countries we do not find the result for are based on small samplesfrom four poorer countries - Cyprus; Brazil; Latvia and the Philippines.
The obvious question to ask is why would union membership follow a path that maximizes ataround age 50 for so many countries? Given the finding that the pattern operates widely itremains unlikely that the results are going to be driven by country specific factors. It is wellknown that unions compress differentials, which has the consequence that younger unionworkers are frequently paid below the values of their marginal value product (MVP) while olderunion workers are paid more than their MVP (Lazear, 1979). This gives an incentive toemployers to replace older (union) workers with younger (union) workers or non-union workerswhose pay more likely approximates their MVP. The mechanisms by which this is achieved islikely to vary across countries, but with the same ultimate purpose. A number of possibilitiessuggest themselves.
a) One plausible answer would be that there are simply cohort effects at work here. Table 7addresses that question for the United States for the period 1983-2002, the longest periodavailable, and pooling together 20 MORG CPS files with just over 3.4 million data points. Dueto the size of the data file we only include gender and private sector dummies, while in columns3 and 4 an additional 50 state dummies are included. Eleven age dummies are included in thefirst column with a maximum probability at age group 55-59. There are no controls for timehere. Adding cohort dummies for decade of birth suggests there are cohort effects – theprobabilities of being a union member for the cohort born in the 1980s compared to someone

11
(me) born in the 1950s, is two percentage points lower. There is still evidence of an inverted U-shape with a maximum in the age group 35-39, but now the higher ages have significantlynegative coefficients. Adding state dummies reduces slightly the size of the coefficients on thecohort dummies.
Table 8 presents the results of checking for cohort effects in a more detailed way for the US forthe period 1983-2002. Results are presented with and without birth cohort dummies withoutstate dummies in the first two columns and with them in the final two. It is interesting to see thecoefficients on the decade of birth becoming more negative with the younger cohorts. Theresults are stable to the inclusion of state dummies. Including these cohort effects reduces thesize of the coefficients on the age dummies and reduces age when the highest probability occurs– in column 3 it goes from 55-59 to 35-39. Using the same CPS data for the US I estimated aunion dprobit that included controls for gender, three race dummies, a private sector dummyalong with a separate dummy for each year of age. The coefficients on these are plotted inFigure 1 as the higher line. The lower three lines report the results of adding a further 90 yearsof birth cohort dummies, overall and for men and women separately. There is still an invertedU-shape in age, which is lower and somewhat flatter than without the cohort effects. There is anobvious peak for men and then a decline after the mid 30s, whereas for women the functionpeaks at around thirty and remains more or less flat until age 60. Figure 2 plots the coefficientson the year of birth dummies for men and women combined only. It shows a steady decline inthe probability of union membership for those born between 1930 and approximately 1965 andthen a flat path after that.
There are cohort effects in union membership in the US. Union membership in the US increasedfrom 1935-1950, was fairly flat from 1950-1975, and then declined steadily. One of the reasonsthat the flow has stabilized since the 1965 birth cohort, who were aged twenty five in 1990, isthat there are large outflows from union membership as the big cohorts retire. Further, birthcohort size was shrinking from 1960 as the baby boom was ending, so even a steady cohorteffect means shrinking numbers. Removing the cohort effects, however, does not remove theinverted U-shape in age, although it does flatten it somewhat.
There are also cohort effects in union membership in the UK. A similar exercise was conductedfor the UK using the LFS, but with a considerably shorter time run (1992-2004). The picture ofthe age dummies, with and without cohort dummies, was similar to that reported here for the US,but the birth dummies showed a steady downward path. Results are reported in Figures 3 and 4.Once the cohort dummies are included the age paths are much flatter than without them andflatter than seen in Figure 1 for the US, although flatter in the forties, but there is a clear turndown after approximately age fifty. Lack of suitable data prevents us from doing a similarexercise in other countries. Younger cohorts are clearly less willing to join unions than oldercohorts were. These findings contrast with those of Disney et al (1998) who examinedretrospective data from the mid-1970s using Family and Working Lives Survey of 1994-5. Theyfound "there is no evidence in the data of an age effect on union membership in any systematicmanner across all cohorts" (p.1).
b) The inverted U-shape pattern in union membership reflects a broader life-cycle pattern.iv Thebenefits of being a union member are generally greater for younger workers than older workers.

12
For example, the union wage differential is usually higher for younger workers than for olderworkers (Blanchflower and Bryson, 2003, 2004). The age/earnings profile rises at first and thenflattens off as individuals age, especially for blue-collar workers. In part this arises because ofreduced hours, especially overtime and may be related to declining health.
Interestingly there is also growing literature suggesting that there is a U-shape in age for anumber of other variables. In cross-sections, even after correcting for potentially confoundinginfluences, there is now known to be a well-determined convex link between reported wellbeingand age. Blanchflower and Oswald (2006a) for example found for the US and for France,Belgium, Netherlands, West Germany, Italy, Luxembourg, Ireland, Great Britain, Greece, Spainand Portugal, that happiness is U-shaped in age, minimizing in the mid to late forties and notexplained by cohort effects. Conversely, mental health, stress, unhappiness and depressionseems to follow an inverted U-shape which also maximizes in the late forties (Blanchflower andOswald, 2006b). What causes the U-shaped curve in human well-being, and the regularity of itsmathematical shape in different parts of the industrialized world, is not currently wellunderstood. Blanchflower and Oswald (2006b) argue that one possible explanation is thatindividuals learn in mid-life to adapt psychologically to their own strengths and weaknesses, andthus are able to quell infeasible aspirations. Another is that cheerful people live systematicallylonger than the miserable, in ways and for reasons not currently appreciated, and that the well-being U-shape in age traces out in part a selection effect. A third is that some sort of comparisonprocess is at work: people have seen school-friends die and come eventually to value theirblessings during the remaining years of life.
c) Union members quit their jobs from their late forties and move to non-union jobs in otherorganizations. This appears to be a possibility especially for workers in the US public sectorwho are covered by defined benefit pension plans. Members of the NYPD and other unionizedpolice departments around the country are able to retire after twenty years of service withgenerous retirement packages, which include retiree health care benefits. In the case of theNYPD, for example, the pension multiple is derived based on the single highest year of earningsincluding overtime. As overtime is often determined by seniority the last year of service usuallycarries with it a lot of overtime, which then raises dramatically the amount of the pension. Theindividual rules of the pension plans determine when this pension can be drawn without penalty.As an extreme example, most police departments do not pay Social Security for their members –although most sheriffs departments and corrections departments do - and hence there is anincentive for retiring union members to move to jobs that do pay Social Security, some of whichwill be non-union.
It may well be attractive to retire from General Motors in Michigan at age fifty on a sizablepension and then even move, say, to the Right-To-Work states of Nevada, Arizona or Florida,which have seen large net in-migration in recent decades, and work in a non-union job at lowerpay. Working at a golf course in the winter sun is attractive to some, including the author, whenthe temperature hits minus 15 Fahrenheit in the frigid North-East!
Unions sometimes are prepared to acquiesce with reductions in employment where older workersget laid off first and get retirement benefits or extended unemployment or disability benefits.While a disproportionate share of workers who are laid-off do not get other jobs the ones who do

13
may not be able to obtain union jobs. Consistent with this, Bertola, Blau and Kahn (2005), in astudy of seventeen OECD countries, find that greater unionization lowers the relativeemployment of older workers. As a referee has noted, however, this may be a relevantexplanation for Anglo-Saxon countries with their clear distinctions between union and non-unionjobs, but is unlikely to be a convincing explanation for Central European or Nordic countries.
d) Union members lose their jobs and become unemployed. Carruth and Disney (1988) chartedthe dramatic drop in employment and the rise in unemployment in the UK between 1979 and1982 and the interesting coincidence of a decline in union membership of 2 million over thesame time period. There is reason to believe that many of the union workers who becameunemployed in the early eighties became long-term unemployed. In the US the existence oftemporary layoffs in the union sector helps explain the absence of union members from theemployee count, but this does not help us across countries as this phenomenon does not generallyexist outside the US.
e) Union members quit their jobs and are promoted to managerial jobs in their own organization,or elsewhere, which are non-union. In both the private and the public sector this phenomenoncan operate; for example in most police forces in the US promotion to the levels of Sergeant andLieutenant do not usually involve a change in union status, but more likely to a different union.Promotion to Captain, Commander and beyond involves a move from one side of the bargainingtable to the other. Chiefs of police and plant managers, at least in the United States, aregenerally not union members.
f) Union workers are disproportionately employed in older workplaces many of which are intraditional industries that have been subject to increased competition. When downsizing or plantclosings occur union members lose their jobs and are unable to replace them with comparableunion jobs. Manufacturing employment has declined in most OECD countries. In the USbetween 1973 and 2004 manufacturing employment fell from 20.1 million to 15.8 million; uniondensity declined from 38.9% to 12.9%. The number of union members actually fell by 5.8million - more than the total decline in manufacturing employment over that period; from 7.8million members in 1973 to 2.0 million in 2004 (Source: www.unionstats.com). In the USGeneral Social Survey both union and non-union workers were asked "how easy would it be foryou to find a job with another employer with approximately the same income and fringe benefitsyou now have?". Three options were given – very easy, somewhat easy and not easy at all.Pooling the years 1977-2004, to ensure a reasonable sample size, the percent saying 'not easy atall' was 37.4% in the non-union sector and 56.3% in the union sector (n=8,666).
g) Older union workers increasingly free ride as they age. They enjoy union benefits, but stoppaying their union dues. This is likely to be of particular importance in France where densityrates are in single digits, but coverage close to complete. Evidence in Bryson (2006b) suggeststhat this is unlikely to be important in both Britain and New Zealand as free-riding in unionizedworkplaces appears to be higher amongst the young and lowest among the longest tenured.However, it is higher among managers in both countries than non-managers. It is less of an issuein the US where unionization occurs at the level of the workplace and coverage is little higherthan membership.

14
h) Older and younger workers have less 'need' for unions than prime age workers. There is someevidence that the support for unions among union members declines with age for Europeancountries, such as in Bryson and Freeman (2006) for the UK and the US and, in Lipset and Meltz(2004), for the US and Canada. As noted above, this may likely arise because of the smallerunion wage gaps available for older workers. Less 'need' for unions could also be because ofhigher employment protection for older workers provided by law or labor courts.
i) The most productive union members quit because the seniority/wage compression rule reducestheir potential earnings. Rising wage inequality implies that the most productive union membersare the ones that have the most to gain from quitting their union jobs and moving to non-unionjobs in the right hand tail of the wage distribution. Another possibility is that such able unionworkers set up in business themselves. Self-employment rates are well known across countriesto be higher among older workers (Blanchflower, 2000, 2005).
j) More highly unionized industries may have a higher proportion of older workers because thebenefits brought by unions reduce turnover. Moreover, many of the more highly unionizedindustries are old and declining and have relatively few entrants. Hence the direction ofcausation may run from unionization to age rather than from age to unionization (Bain and Price,1983a, pp. 22-23) and, as Richardson and Catlin point out, "may show more about the kind ofindustry that employs older workers than about the propensity of old workers to join unions"(1979, pp. 378-379).
It is unclear what are the relative weights of each of these factors across countries is as there hasbeen little prior work on these issues. The probability of union membership follows an inverseU-shape in age, with broadly similar maxima, across this diverse group of countries - Australia;Austria; Bangladesh; Belgium; Bulgaria; Canada; Chile; the Czech Republic; Denmark;Germany; Estonia; Finland; France; Greece; Hungary; Ireland; Israel; Italy; Japan; Luxembourg;Mexico; Netherlands; New Zealand; Norway; Poland; Portugal; Russia; the Slovak Republic;Slovenia; Spain; Sweden; Switzerland; the UK and the US. The likely reason for it arisesbecause older union workers are paid above the values of their marginal products; employersthus have incentives to replace them. The mechanisms by which this is done will likely varyacross countries.

15
Table 1. Union density rate changes, 1970-2003
1970 1990 1993 1998 2003 1970-03 1993-98 1998-03percentage point changes
Australia 50 41 38 28 23 -27.3 -9.5 -5.2Austria 63 47 43 38 35* -27.4 -4.8 -3.0Belgium 42 54 55 55 55* +13.3 +0.4 0.0Canada 32 33 33 29 28 -3.2 -4.3 -0.1Denmark 60 75 77 76 70 +10.1 -1.7 -5.2Finland 51 73 81 78 74 +22.8 -2.7 -3.9France 22 10 10 8 8 -13.4 -1.6 +0.3Germany 32 31 32 26 23 -9.4 -5.9 -3.3Ireland 53 51 48 42 35 -17.9 -6.2 -6.2Italy 37 39 39 36 34 -3.3 -3.5 -2.0Japan 35 25 24 23 20 -15.4 -1.8 -2.8Korea 13 18 15 12 11 -1.4 -2.4 -0.9Netherlands 37 24 26 25 22 -14.2 -1.4 -2.2New Zealand 55 51 35 22 22* -33.1 -12.2 -0.2Norway 57 59 58 56 53 -3.5 -2.5 -2.2Spain 13 18 16 16 n/a -2.6 -3.3Switzerland 29 24 23 22 18** -11.1 -1.2 -3.9UK 45 39 36 30 29 -15.5 -6.0 -0.8USA 24 16 15 13 12 -11.1 -1.7 -1.0
Source: Visser (2006) *=2002, **=2001

16
Table 2. Union membership rates by characteristics, 2004/5
UK (2004) USA (2005) Canada (2005)All 28.8 12.5 29.8
Males 28.5 13.8 29.8Females 29.1 11.1 29.8
White 29.0 12.2Asian 23.5 11.4Black 32.5 15.1Hispanic 10.1
Degree or equivalent 37.7 14.8 33.4A-level or equivalent 26.4 14.3 26.7No qualifications 21.1 7.7 28.1
Age 16-19 4.3 2.9 9.7Age 20-24 13.1 5.4 14.6Age 25-29 22.4 9.4 24.4Age 30-34 27.1 11.7 28.8Age 35-39 30.9 13.3 30.0Age 40-44 34.5 14.1 33.5Age 45-49 38.9 16.1 38.6Age 50-54 39.7 18.2 42.2Age 55-59 36.0 17.9 40.0Age 60-64 27.8 15.1 32.7Age 65-69 9.6 7.9 16.2Age >=70 5.9 6.9 12.1
Private 17.2 9.0 17.4Public 58.8 37.2 71.4
Manufacturing 24.6 12.9 30.0Construction 16.7 14.7 30.9
Managers 18.6 13.1 8.1Professional occupations 48.6 18.2 14.6Skilled trades 26.0 19.4 38.0
Source: UK - Grainger and Holt (2005). USA - Union members in 2005, BLS, UDDL 06-99www.bls.gov/news.release/pdf/union2. For Canada Labour Force Survey December 2005 andfor the rates by age UK Labour Force Survey Fall 2004 and for the US MORG 2004 all weighted(own calculations).

17
Table 3. Dprobit union membership, UK: 1993-2004 and 1983LFS 1993-2004 GHS 1983
All Private Public All Private PublicTime -.0047 (28.09) -.0030 (19.64) -.0056 (14.29)Private -.3941 (192.30) -.5101 (28.71)Nationalized industry .0556 (5.76)Local Government .0954 (22.35)Universities -.0549 (8.15)National Health Service .0304 (5.18)Other Government -.2617 (29.62)Age .022166 (75.47) .015543 (61.30) .03729 (48.75) .02765 (9.53) .02206 (7.39) .02573 (6.72)Age2 -.000231 (65.75) -.000163 (53.67) -.000387 (42.73) -.00030 (8.61) -.00024 (6.58) -.00029 (6.31)Male .0247 (18.29) .0343 (27.71) .0018 (0.60) .0310 (2.02) .0432 (2.61) .0001 (0.01)Black .0326 (6.43) .0386 (7.46) -.0160 (1.64) .2658 (4.27) .2645 (3.27) .1472 (2.86)Asian -.0326 (8.67) -.0171 (5.12) -.0839 (8.58) .0425 (0.82) .0384 (0.71) .0126 (0.17)Chinese -.1134 (9.91) -.0776 (7.28) -.1641 (5.55)Other Race -.0408 (7.10) -.0321 (5.89) -.0504 (3.95) -.0834 (1.13) -.1050 (1.35) -.0346 (0.37)Full-time .1167 (83.25) .0500 (36.08) .2590 (83.71) .2663 (15.29) .2037 (10.76) .2416 (10.74)Higher degree .0860 (25.67) +.0139 (4.01) +.1818 (31.52) -.0030 (0.11) -.1166 (1.47) .0495 (0.87)First degree .0347 (14.03) -.0242 (11.09) +.1559 (30.07) -.1274 (4.73) -.1971 (6.63) -.0065 (0.23)
Industry dummies 61 61 61 9 9 9Residence dummies 22 22 22 11 11 11Education dummies 40 40 40 19 19 19N 710,567 538,305 172,106 9,075 5,872 3,202Pseudo R2 .2250 .1304 .1331 .2600 .1679 .1652Age maximum 48 48 48 46 46 44
Notes: excluded categories are white, no qualifications and central govt. T-statistics in parenthesesSource: Labour Force Surveys, 1993-2004 and 1983 General Household Survey
18
Table 4. Dprobit Union Membership in the US, 1984-1991
All Private PublicTime -.0036 (37.62) -.0040 (44.10) -.0000 (0.12)Private -.1894 (155.61)State Government .1188 (33.32)Local Government .2103 (64.57)Age .0132594 (101.73) .009822 (83.73) .02883 (52.06)Age2 -.000142 (90.56) -.000103 (72.66) -.000319 (49.47)Male .0421 (74.47) .0435 (81.35) .0212 (10.17)Years schooling -.0083 (79.10) -.0105 (105.34) .0061 (15.46)Black .0729 (71.26) .0694 (68.10) .0920 (28.10)Other race -.0166 (11.60) -.0004 (0.26) -.0832 (15.45)Hispanic .0108 (8.92) .0020 (1.88) .0396 (7.56)Fulltime .0590 (82.39) .0237 (34.12) .2572 (96.10)
Industry dummies 45 45 45State dummies 51 51 51
N 1,600,112 1,315,835 284,243Pseudo R2 .2278 .2136 .2072Age maximum 47 48 45
Source: MORG files of the CPS 1984-1991. T-statistics in parentheses

19
Table 5. Dprobit Union Membership in the US, 1992-2002 and 2003/4
All Private Public All Private Public1992-2002 1992-2002 1992-2002 2003-2004 2003-2004 2003-2004
Time/2004 dummy -.0018 (26.98) -.0018 (30.40) -.0007 (2.56) -.0016 (1.92) -.0012 (1.73) -.0041 (0.97)Private -.1926 (183.27) -.1727 (78.55)State Govt. .0960 (28.30) .1099 (12.52)Local Govt. .1759 (55.38) .1924 (22.89)Age .010518 (96.97) .00697 (75.44) .0327 (61.98) .0084 (40.58) .00495 (29.43) .0330 (28.11)Age2 -.000108 (84.45) -.000068 (62.15) -.00036 (58.90) -.000087 (36.25) -.00005 (24.62) -.00004 (27.2)Male .0329 (69.73) .0318 (74.60) .0359 (17.81) .0250 (27.03) .0224 (27.58) .0446 (9.77)Black .0508 (61.21) .0472 (60.12) .0613 (19.68) .0304 (18.64) .0278 (18.89) .0470 (6.36)American Indian -.0347 (18.14) -.0007 (0.34) -.1616 (22.15) -.0228 (6.20) .0049 (1.19) -.1318 (7.89)Asian -.0111 (9.39) .0012 (1.08) -.0721 (12.66) -.0064 (2.93) .0042 (2.15) -.0753 (6.18)Hispanic .0137 (15.10) .0121 (15.50) .0252 (5.76) .0018 (1.11) .0017 (1.24) .0080 (0.83)Fulltime .0152 (29.81) .0023 (4.78) .0957 (44.38) .0380 (16.64) .0257 (12.02) .0890 (9.71)
First degree .0238 (3.75) -.0120 (2.77) .4284 (7.46) .0057 (0.53) -.0124 (1.73) .2970 (2.41)Master’s degree .0411 (8.16) -.0206 (5.12) .2197 (3.66) .0172 (1.48) -.0192 (2.98) .3455 (2.75)Professional degree -.0272 (4.91) -.0251 (6.04) .2197 (3.66) -.0277 (2.98) -.0176 (2.52) .0908 (0.73)Higher degree -.0411 (8.16) -.0352 (9.37) .2294 (3.82) -.0334 (3.84) -.0238 (3.70) .1305 (1.04)
Industry dummies 45 45 45 90 90 90State dummies 50 50 50 50 50 50Schooling dummies 15 15 15 15 15 15
N 1,811,934 1,501,651 310,269 343,504 284,398 58,469Pseudo R2 .2373 .1878 .1938 .2658 .2052 .1932Age maximum 49 51 46 48 51 46
Source: ORG files of the CPS, 1992-2002Notes: Excluded category Federal Government, Maine, <1st grade education and white. T-statistics in parentheses

20
Table 6. Union density equations for Canada, 1997-2005.
All Private PublicAge 20-24 .0520 (15.56) .0370 (14.54) .1606 (20.23)Age 25-29 .1508 (43.62) .0818 (30.11) .2670 (43.15)Age 30-34 .1933 (56.17) .1086 (39.49) .2935 (49.52)Age 35-39 .2179 (64.53) .1327 (48.57) .3092 (51.09)Age 40-44 .2394 (71.52) .1559 (56.60) .3234 (52.02)Age 45-49 .2615 (76.90) .1845 (63.90) .3274 (52.31)Age 50-54 .2693 (76.79) .1957 (64.03) .3182 (52.30)Age 55-59 .2472 (65.28) .1823 (54.69) .2798 (47.77)Age 60-64 .2079 (44.82) .1466 (35.93) .2527 (40.07)Age 65-69 .0123 (1.47) .0111 (1.56) .1650 (12.83)Age >=70 -.0421 (3.21) -.0065 (0.58) .1026 (4.76)
Time -.00008 (0.38) -.0010 (5.98) .0028 (7.48)Male .0577 (49.00) .0675 (66.94) -.0214 (10.12)Some secondary .0281 (8.76) .0144 (5.97) .0855 (10.43)Grades 11-13 .0365 (11.81) .0195 (8.32) .1175 (15.49)Some post secondary .0044 (1.31) .0054 (2.08) .0739 (9.05)Post secondary .0322 (10.84) .0103 (4.58) .1456 (18.64)Bachelor's degree -.0301 (9.42) -.0654 (27.48) .1146 (14.88)Postgraduate degree -.0978 (29.26) -.0848 (28.47) .0224 (2.72)December .0024 (2.29) .0023 (2.57) -.0022 (1.15)Private -.4657 (223.92)
Industry dummies 18 18 18Province dummies 9 9 9
N 905,566 676,647 228,919Pseudo R2 .2701 .1373 .0685
Source: Canadian Labour Force Surveys, June 1997-December 2005. T-statistics in parentheses

21
Table 7. Age maximum in union density equations by country(1) (2) (3) Average
All 47 49 47 48Australia 43 43Austria 44 * 44Bangladesh 27 27Belgium 37 37 38 38Bulgaria 46 46Canada 45 45Chile 50 50Czech Republic 53 50 52Denmark 46 46 46 46Estonia 45 45Finland 45 45 45France 65 * 53 59Germany 48 48Germany-East 41 44 43Germany-West 43 43 43
Great Britain 44 53 47 48Greece 54 46 50Hungary 64 64Ireland 44 47 44 45Israel 51 60 56Japan 36 36Italy * 51 51Luxembourg 53 47 50Mexico 51 51Netherlands * * 53 53New Zealand 50 50Norway 50 55 54 53Poland 45 48 47Portugal 59 56 50 55Russia 55 55Slovak Republic 57 57Slovenia 44 50 47Spain 45 * 45 45Sweden 47 45 46Switzerland 46 43 45United States 44 44Unweighted Average 48
Notes: *=insignificantly different from zero (t<1.90). Estimates obtained from the coefficients on age ad age squareand solving fir the maximum in a separate equation for each country.Source: column 1 ISSP 2000-2002; column 2 European Social Survey 2002 & 2004. Column 3 EurobarometerTrend File, 1988-1994 & 2001 using the following surveys - 1988 (30); 1989 (31, 31a, 32a); 1990 (33, 34.0, 34.1);1991 (35.0, 35.1, 36); 1992 (37.0, 37.1, 38.0); 1993 (39.0, 39.1, 40); 1994 (41.0, 41.1) and 2001 (56.1) withEurobarometer numbers in parentheses

22
Table 8. Union density equations and cohort effects for the US, 1983-2002.
(1) (2) (3) (4)Age 20-24 .0845 (54.82) .0713 (45.31) .0841 (55.71) .0720 (46.73)Age 25-29 .1544 (97.40) .1182 (71.16) .1540 (98.49) .1193 (72.95)Age 30-34 .1920 (118.76) .1343 (77.36) .1912 (119.53) .1351 (78.97)Age 35-39 .2168 (131.47) .1362 (76.13) .2155 (131.92) .1367 (77.58)Age 40-44 .2384 (140.89) .1355 (73.01) .2365 (140.89) .1357 (74.26)Age 45-49 .2586 (147.41) .1346 (69.75) .2556 (146.63) .1341 (70.61)Age 50-54 .2684 (147.26) .1235 (61.32) .2656 (146.49) .1240 (62.53)Age 55-59 .2721 (142.34) .1050 (49.83) .2675 (140.75) .1054 (50.90)Age 60-64 .2358 (114.18) .0591 (26.79) .2287 (111.84) .0595 (27.63)Age 65-69 .1009 (39.54) -.0355 (15.24) .0940 (37.70) -.0326 (14.55)Age >=70 .0274 (9.39) -.0761 (28.49) .0234 (8.29) -.0708 (27.69)Male .0755 (199.40) .0745 (197.48) .0734 (201.59) .0725 (199.70)Private sector -.2382 (429.53) -.2364 (427.47) -.2472 (441.99) -.2452 (439.88)Born 1900-1909 -.0368 (1.02) -.0315 (0.89)Born 1910-1919 -.0308 (0.85) -.0271 (0.77)Born 1920-1929 -.0230 (0.62) -.0215 (0.60)Born 1930-1939 -.0460 (1.30) -.0411 (1.20)Born 1940-1949 -.0643 (1.83) -.0578 (1.69)Born 1950-1959 -.0887 (2.53) -.0803 (2.35)Born 1960-1969 -.1136 (3.42) -.1045 (3.25)Born 1970-1979 -.1142 (4.05) -.1045 (3.83)Born 1980-1989 -.1097 (4.51) -.0998 (4.24)
State dummies (50) No No Yes Yes
N 3,429,407 3,429,407 3,429,407 3,429,407Pseudo R2 .1011 .1044 .1449 .1480
Source: MORG files of the CPS, 1983-2002

23
Figure 1. Variation of US union membership probabilities by age
-0.05
0
0.05
0.1
0.15
0.2
0.25
0.3
0.35
16 21 26 31 36 41 46 51 56 61
Age
Pro
bab
ility
of
unio
nm
em
ber
ship
no cohortcohortcohort malecohort female

24
Figure 2. Cohort effects on union density, USA
-0.13
-0.125
-0.12
-0.115
-0.11
-0.105
-0.1
-0.095
-0.09
-0.085
-0.081930 1935 1940 1945 1950 1955 1960 1965 1970 1975 1980
Year of birth
pro
bab
ility
of
bei
nga
unio
nm
em
ber

25
Figure 3. Variation of UK union membership probabilities by age
0
0.05
0.1
0.15
0.2
0.25
0.3
0.35
0.4
0.45
0.5
16 21 26 31 36 41 46 51 56 61
Age
pro
bab
ility
ofu
nio
nm
emb
ers
hip
no cohortcohortcohort malecohort female

26
Figure 4. Cohort effects on union density, UK
-0.2
-0.15
-0.1
-0.05
00 10 20 30 40 50 60
Age
Pro
bab
ility
of
uni
on
mem
ber
ship
27
Data Appendix
1) UK
a) General Household Survey (GHS) -- with equivalent data on individuals available for thesingle year of 1983. Although the GHS is a time series of cross-sections, 1983 is the earliestyear when union status is reported. Sample size for the 1983 GHS is just over 9,000 employees.
b) Labor Force Survey every year since 1993. Union data are only reported in one of the fourquarterly sweeps of the survey – in the Autumn (September, October and November), of eachyear. Here data from the 1993-2004 surveys are pooled, generating a sample size of just under711,000 employees.
2) United States
Merged Outgoing Rotation Group files of the Current Population Survey, 1984-2002For details see http://www.nber.org/data/cps_index.html
3) CanadaLabour Force Surveys, June 1997-December 2005
4) International Social Surveys, 2000-2002For details see www.issp.org/homepage.htm
5) The European Social Surveys of 2002 and 2004 (ESS) (n=33,116)For details see www.europeansocialsurvey.org
6) Eurobarometer surveys from 1988-1994 and 2001 (n=247,883).For details see www.gesis.org/en/dtat_service/eurobarometer/index.htm.

28
ReferencesAntos, J.R., Chandler. M. and W. Mellow (1980), 'Sex differences in union membership',
Industrial and Labor Relations Review, 33(2), pp. 162-169.
Bain, G. and P. Elias (1985), 'Trade union membership in Great Britain: an individual level
analysis', British Journal of Industrial Relations, 23, pp. 71–92.
Bain, G. and R. Price (1983a), 'Union growth: dimension, determinants and destiny', in G. Bain
(ed.), Industrial Relations in Britain. Oxford: Blackwell, pp. 3–34.
Bain, G. and R. Price (1983b), 'Union growth in Britain: retrospect and prospect', British Journal
of Industrial Relations, 2(1), March, pp. 46-68.
Bender, K. A., (1997), 'The changing determinants of U.S. unionism: an analysis using worker-
level data', Journal of Labor Research, 18(3), Summer, pp. 403-423.
Bertola, G., F.D. Blau and L.M. Kahn (2005), 'Labor market institutions and demographic
employment patterns', working paper.
Blanchflower, D.G. (2000), 'Self-employment in OECD countries', Labour Economics, 7,
September 2000, pp. 471-505.
Blanchflower, D.G. (2004), 'Self-employment: more may not be better,' Swedish Economic
Policy Review, vol. 11(2), Fall 2004, pp. 15-74.

29
Blanchflower, D.G. and A. Bryson (2003), 'Changes over time in union relative wage effects in
the UK and the US revisited,' in John T. Addison and C. Schnabel, eds. International Handbook
of Trade Unions. Cheltenham, UK, Edward Elgar, pp. 197–245.
Blanchflower, D.G. and A. Bryson (2004), 'What effect do unions have on wages now and would
Freeman and Medoff be surprised?', Journal of Labor Research, XXV(3), Summer, pp. 383-
414.
Blanchflower, D.G and R. B. Freeman (1992), 'Unionism in the U.S. and other advanced OECD
Countries,' Industrial Relations, 31, Winter, 156–79; reprinted in Michael Bognanno and Morris
M. Kleiner eds., Labor Market Institutions and the Future Role of Unions, Oxford: Blackwell,
1992, pp. 56–79.
Blanchflower, D.G and R.B. Freeman (1994), 'Did the Thatcher reforms change British labour
market performance?', in R. Barrell (Ed.), The UK Labour Market. Comparative Aspects and
Institutional Developments, Cambridge University Press.
Blanchflower, D.G. and A. J. Oswald (2006a), 'Is wellbeing U-shaped over the life cycle?',
Dartmouth College Working Paper.
Blanchflower, D.G. and A. J. Oswald (2006b), 'Psychological distress GHQ-N6 is quadratic in
age and shaped by childhood adversities: evidence for Sixteen Countries', Dartmouth College
Working Paper.

30
Blanden, J and S. Machin (2003), 'Cross-generation correlations of union status for young people
in Britain', British Journal of Industrial Relations, September, 41(3), pp. 391-415.
Blundell, R., D. Card and R. Freeman. (2004), Seeking a Premier League Economy, edited by,
NBER and University of Chicago Press.
Booth, A. (1986), 'Estimating the probability of trade union membership: a study of men and
women in Britain', Economica, 53, pp. 41–61.
Bryson, A, (2006), Union free-riding in Britain and New Zealand, Centre for Economic
Performance, Discussion Paper No 713, January 2006, London School of Economics.
Bryson, A, and R.B. Freeman (2006), 'Worker needs and voice in the US and the UK', NBER
WP #12310, Cambridge, MA.
Bureau of Labour Statistics (2005), 'Union members in 2005', UDDL 06-99 downloadable at
www.bls.gov/news.release/pdf/union2.
Disney, R., A. Gosling, S. Machin and J. McCrae (1998), 'The dynamics of union membership in
Britain. A study using the Family and Working Lives Survey', Department of Trade and
Industry Working Paper #3.

31
Elias, P. (1996), 'Growth and decline in trade union membership in Great Britain: evidence from
work histories', in Trade Unionism in Recession, edited by D. Gallie, R. Penn and M. Rose,
Oxford University Press, Oxford.
Grainger, H. and T. Holt (2005), 'Trade union membership, 2004', Department of Trade and
Industry, April. Downloadable at www.dti.gov.uk/er/emar/tradeunion_membership2004.pdf
Green, F. (1990), 'Trade union availability and trade union membership in Britain', The
Manchester School, LVIII(4), December, pp. 378-394.
Green, F. (1992), 'Recent trends in British trade union density: how much of a compositional
effect?', British Journal of Industrial Relations, 30: 445–58.
Hirsch, B.T. and M. Berger (1984), 'Union membership determination and industry
characteristics', Southern Economic Journal, 50, pp. 665-679.
International Labour Organisation (2005), Trade union membership database, Bureau of
Statistics, Geneva, Switzerland
Kleiner, M. M. (2002), 'Intensity of management resistance: understanding the decline of
unionization in the private sector', Journal of Labor Research, 22(3), pp519-540.

32
Lazear, E. (1979), 'Why is there mandatory retirement?', Journal of Political Economy, 87(6),
December, pp. 1261-1284.
Lipset, S.M. and N.H. Meltz (2004), The Paradox of American Unionism. Why Americans Like
Unions More Than Canadians But Join Much Less, Cornell University Press.
Machin, S. (2004), 'Factors of convergence and divergence in union membership', British
Journal of Industrial Relations, 42(3), September, pp. 423-428.
Morissette, R., G. Schellenberg and A. Johnson (2005), 'Diverging trends in unionization',
perspectives on labour and income, 6(4), April, Statistics Canada, pp. 5-12.
Payne, J. (1989), 'Trade union membership and activism among young people in Great Britain',
British Journal of Industrial Relations, 25(2), pp. 267-274.
Pencavel, J. (2005), 'Unionism viewed internationally', Journal of Labor Research, XXVI(1),
Summer, pp. 65-97.
Richardson, R. and S. Catlin (1979), 'Trade union density and collective agreement patterns in
Britain', British Journal of Industrial Relations, 17, pp. 376-385.

33
Riddell, C. and W.C. Riddell (2004), 'Changing patterns of unionization: the North American
experience', in Unions in the 21st Century edited by Anil Verma and Thomas A. Kochan.
London: Palgrave Macmillan, pp. 146-164 (with Chris Riddell)
Riley, N. (1997), 'Determinants of union membership: a review', Labour, 11, pp. 265–301.
Schnabel, C. (2003), in J. Addison and C. Schnabel (eds.), 'Determinants of trade union
membership', The International Handbook of Trade Unions, Cheltenham: Edward Elgar, pp. 13-
43.
Schnabel, C. and J. Wagner (2003), 'Determinants of union membership in 18 EU countries:
evidence from micro data', IZA DP # 1464, Institute for the Study of Labor, University of Bonn,
Germany
Visser, J. (2003), 'Unions and unionism around the world', in J. Addison and C. Schnabel (eds.),
The International Handbook of Trade Unions, Cheltenham: Edward Elgar, pp. 366-413.
Visser, J. (2006), 'Union membership statistics in 24 countries', Monthly Labor Review, January,
pp. 38-49.

34
Endnotes
i I understand from private communication with Steve Machin that the lack of a genderdifferential in his paper arises because, for comparison purposes, that in Machin (2004) heexcluded a public sector dummy because it is unavailable in the NTS. That appears to accountfor the difference between our two papers; in the LFS in any year, adding a public sectordummy, or detailed industry controls, produces a significant and positive male differential.
ii Note that in 2004, 65% of all workers in the public sector were female compared with 41% inthe private sector (Heap, 2005). Total employment in 2005 in the UK was 28,713,000, made upof 22,867 in private employment and 5,846, or 20.4%, in public sector employment, down from23.1% in 1992 (Hicks, 2005, Table 1).
iii The thirty members of the OECD are Australia; Austria; Belgium; Canada; the CzechRepublic; Denmark; Finland; France; Germany; Greece; Hungary; Iceland; Ireland; Italy; Japan;Korea; Luxembourg; Mexico; Netherlands; New Zealand; Norway; Poland; Portugal; SlovakRepublic; Spain; Sweden; Switzerland; Turkey; United Kingdom and the United States.
iv Thanks Francis Green for this point.