International Journal of Research and Revie · at Yayasan Pendidikan Islam, Miftahussalam, Medan...
19
International Journal of Research & Review (www.ijrrjournal.com) 111 Vol.6; Issue: 2; February 2019 International Journal of Research and Review www.ijrrjournal.com E-ISSN: 2349-9788; P-ISSN: 2454-2237 Research Paper Implementation of Total Quality Management and Interpersonal Communication in Achieving Student Satisfaction through Service Quality at Yayasan Pendidikan Islam, Miftahussalam, Medan Henny Purnama Dewi 1 , Prihatin Lumbanraja 2 , Rahim Matondang 2 1 Postgraduate Students, 2 Postgraduate Lecturer, Department of Management, Faculty of Economics and Business at University of North Sumatera, Indonesia Corresponding Author: Henny Purnama Dewi ABSTRACT In the education sector, educational institution is required to increase its quality in meeting student satisfaction in order to realize educated human beings who have high qualified life skill. Control system is one of the weaknesses in educational institutions in Indonesia which causes the decrease in student satisfaction with service quality. Therefore, sustainable increase in quality should be emphasized. The objective of the research was to optimize student satisfaction through one of the strategies of focusing on the increase in quality by implementing Total Quality Management (TQM), supported by good Interpersonal Communication (IC) between teachers and students in order to achieve maximum service quality. The samples were 100 Grade XII Senior High School students of Yayasan Pendidikan Islam, Miftahussalam, Medan, taken by using non-probability sampling with purposive sampling technique. Second order Structural Equation model was used as the basic analysis and Partial Least Square with Smart PLS 3.0 method were used for the analysis. The result of the research showed that Total Quality Management and Interpersonal Communication had positive and significant effects on student satisfaction, either directly or through service quality mediation Keywords: Total Quality Management, Interpersonal Communication, Service Quality, Student Satisfaction INTRODUCTION The control system is one of the weaknesses in educational institutions in Indonesia. This weakness causes student satisfaction (quality satisfaction) on the quality of services provided by educational institutions is unstable or even declining, one of which has an impact on the decline in interest of students to attend the educational institution. To overcome this we need a strategy that focuses on continuous quality improvement. One of the strategies is the implementation of integrated quality management (TQM) supported by good Interpersonal Communication (IC) in order to achieve student satisfaction through maximum service quality. In its implementation, the assessment of student satisfaction of an educational institution is not simple, because it requires various requirements, variables, indicators and the elements that affect it. According to Sopiatin (2010) that student satisfaction is effected by intrinsic factors and extrinsic factors. Intrinsic factors themselves are factors from within students that can lead to satisfaction, among others; high achievement, expectations and talents of students. Whereas, extrinsic factors themselves are from outside the students themselves, among others; teacher teaching
Transcript of International Journal of Research and Revie · at Yayasan Pendidikan Islam, Miftahussalam, Medan...

International Journal of Research & Review (www.ijrrjournal.com) 111 Vol.6; Issue: 2; February 2019
International Journal of Research and Review www.ijrrjournal.com E-ISSN: 2349-9788; P-ISSN: 2454-2237
Research Paper
Implementation of Total Quality Management and Interpersonal
Communication in Achieving Student Satisfaction through Service Quality
at Yayasan Pendidikan Islam, Miftahussalam, Medan
Henny Purnama Dewi1, Prihatin Lumbanraja2, Rahim Matondang 2
1Postgraduate Students, 2Postgraduate Lecturer,
Department of Management, Faculty of Economics and Business at University of North Sumatera, Indonesia
Corresponding Author: Henny Purnama Dewi
ABSTRACT
In the education sector, educational institution is required to increase its quality in meeting student
satisfaction in order to realize educated human beings who have high qualified life skill. Control
system is one of the weaknesses in educational institutions in Indonesia which causes the decrease in student satisfaction with service quality. Therefore, sustainable increase in quality should be
emphasized. The objective of the research was to optimize student satisfaction through one of the
strategies of focusing on the increase in quality by implementing Total Quality Management (TQM),
supported by good Interpersonal Communication (IC) between teachers and students in order to achieve maximum service quality. The samples were 100 Grade XII Senior High School students of
Yayasan Pendidikan Islam, Miftahussalam, Medan, taken by using non-probability sampling with
purposive sampling technique. Second order Structural Equation model was used as the basic analysis and Partial Least Square with Smart PLS 3.0 method were used for the analysis. The result of the
research showed that Total Quality Management and Interpersonal Communication had positive and
significant effects on student satisfaction, either directly or through service quality mediation
Keywords: Total Quality Management, Interpersonal Communication, Service Quality, Student
Satisfaction
INTRODUCTION
The control system is one of the
weaknesses in educational institutions in
Indonesia. This weakness causes student
satisfaction (quality satisfaction) on the
quality of services provided by educational
institutions is unstable or even declining,
one of which has an impact on the decline in
interest of students to attend the educational
institution.
To overcome this we need a strategy
that focuses on continuous quality
improvement. One of the strategies is the
implementation of integrated quality
management (TQM) supported by good
Interpersonal Communication (IC) in order
to achieve student satisfaction through
maximum service quality.
In its implementation, the
assessment of student satisfaction of an
educational institution is not simple,
because it requires various requirements,
variables, indicators and the elements that
affect it. According to Sopiatin (2010) that
student satisfaction is effected by intrinsic
factors and extrinsic factors. Intrinsic factors
themselves are factors from within students
that can lead to satisfaction, among others;
high achievement, expectations and talents
of students. Whereas, extrinsic factors
themselves are from outside the students
themselves, among others; teacher teaching

Henny Purnama Dewi et.al. Implementation of Total Quality Management and Interpersonal Communication in
Achieving Student Satisfaction through Service Quality at Yayasan Pendidikan Islam, Miftahussalam, Medan
International Journal of Research & Review (www.ijrrjournal.com) 112 Vol.6; Issue: 2; February 2019
quality, school culture, facilities and
infrastructure in schools and the school
climate.
Yayasan Pendidikan Islam,
Miftahussalam, Medan, is one of the
educational institutions, is a non-profit
waqaf foundation motive that is trying to
continue to grow. It has six levels of
education, namely Early Madrasah, Middle
School (SMP), Madrasah Tsanawiyah
(MTs), High School (SMA), Vocational
High School (SMK), and Madrasah Aliyah
(MA) with 140 staff and teachers and the
number of students is 1940 students
School facilities and infrastructure
are factors that strongly support student
satisfaction of an educational institution,
one of which is adequate classrooms that
have capacity in accordance with the
number of existing students. Based on data
obtained from government regulations in
accordance with Article 24 of
Permendikbud Number 17 of 2017
concerning the number of standards of
students in one class (study group) or in one
class are as follows:
Table 1.1. Minister of Education and Culture Number 17 of
2017
Educational
level
Minimum number of
students / class
Maximum number of
students / class
SD 20 28
SMP/MTS 20 32
SMA/MA 20 36
SMK 15 36
Source: Minister of Education and Culture Regulation Number 17
of 2017
Increasing student satisfaction can
continue to be pursued through quality
improvements in all aspects of the
organization on an ongoing basis. Not only
physical quality, but also total management
quality through improving the quality of
service to these educational service
providers. Total Quality Management
(TQM) according to Gaspersz (in Tjiptono,
2016) is a way of increasing continuous
performance (continuous performance
improvement) at each level of operation or
process, in each functional area of an
organization, by using all human resources
and available capital.
Based on literature from several
previous studies, in addition to the
implementation of TQM there are other
factors that effects the achievement of
student satisfaction, one of which is a well-
established Interpersonal Communication
(IC). De Vito (2013) defines Interpersonal
Communication (IC) as verbal and
nonverbal interactions between two (or
sometimes more than two) people who are
interdependent. According to philosopher
expert Michael Buber in Wood (2018)
Interpersonal Communication is the highest
form of communication in human
interaction because in it humans are
psychologically bound together, mutually
reinforcing and respecting differences.
In interpersonal communication the
most important thing is not the intensity of
communication but how the communication
is interwoven. In order for communication
to work well, there needs to be supporting
factors. Rachmat (2008) mentions there are
several factors that foster interpersonal
relationships including trust, supportive
attitude, and openness.
Philosophically, the role of
communication will tie everything together.
Starting from the foundation to the roof of a
TQM building, all elements are bound by a
mixture of binding elements in the form of
communication. Communication acts as a
link between all TQM elements.
Communication means a shared
understanding of one or a group of ideas
between the sender and recipient of
information. Successful TQM requires
communication with, and / or between, all
members of the organization, as well as
customers.
All elements in an organization must
maintain the openness of the flow of
communication where all employees can
send and receive all information about TQM
processes accurately to customers (Setiadi,
2017). In this study, TQM is considered to
be supported through good Interpersonal
Communication (IC) between employees
and teachers with students as customers in
order to increase student satisfaction

Henny Purnama Dewi et.al. Implementation of Total Quality Management and Interpersonal Communication in
Achieving Student Satisfaction through Service Quality at Yayasan Pendidikan Islam, Miftahussalam, Medan
International Journal of Research & Review (www.ijrrjournal.com) 113 Vol.6; Issue: 2; February 2019
through maximum service quality so that the
educational institution is more advanced and
can compete with other educational
institutions.
Hypothesis
The formulation of the problem in this study
is:
1. Total Quality Management has a
significant effect on service quality at
the Yayasan Pendidikan Islam,
Miftahussalam, Medan?
2. Interpersonal communication has a
significant effect on service quality at
the Yayasan Pendidikan Islam,
Miftahussalam, Medan?
3. Total Quality Management has a
significant effect on student satisfaction
at the Yayasan Pendidikan Islam,
Miftahussalam, Medan?
4. Interpersonal Communication has a
significant effect on student satisfaction
at the Yayasan Pendidikan Islam,
Miftahussalam, Medan?
5. Service Quality have a significant effect
on student satisfaction at the Yayasan
Pendidikan Islam, Miftahussalam,
Medan?
6. Total Quality Management has a
significant effect on student satisfaction
through service quality at the Yayasan
Pendidikan Islam, Miftahussalam,
Medan?
7. Interpersonal Communication has a
significant effect on student satisfaction
through service quality at the Yayasan
Pendidikan Islam, Miftahussalam,
Medan?
MATERIALS AND METHODS
Method of Collecting Data
This type of research is quantitative
descriptive research that is research that
aims to describe the facts and the
characteristics of a particular population or
area systematically, factually, and
thoroughly. Quantitative descriptive
research is a study that aims to describe or
to describe the characteristics
(characteristics) of a situation or object of
researchers.
While the nature of this research is
explanatory research, namely research that
intends to explain the position of the
variables studied and the relationship
between one variable and another.
Explanation of the position of these
variables is done through testing hypotheses
(Sugiyono, 2012).
The population of this study was
high school / equivalent class XII students
consisting of high school students (SMA),
Computer Information Technology
Vocational High School (Vocational High
School) and Madrasah Aliyah (MA) at
YPIM which amounted to 140 students.
This population was chosen based on the
consideration that high school students of
class XII were the most mature students in
terms of age and the longest felt the quality
of education services at YPIM so that they
were expected to provide the best answers
to the questionnaires given.
The sampling technique in this study
is non probability sampling using purposive
sampling. Purposive sampling is sampling
that is based on certain considerations
including the characteristics or
characteristics of a population that has been
previously known (Sinulingga, 2016)
Table 3.1. Jumlah Populasi
No. Unit The number of
students
1 SMA 42
2 SMK 62
3 ALIYAH 36
Number of students who meet the criteria 140
Source: Data processed (2018)
The 140 populations that meet the
criteria through sampling techniques with
purposive sampling. In this study the
method used to determine the number of
samples is using tables of Isaac and
Michael. From Isaac and Michael's table for
the total population that meets the criteria as
many as 140 people at the level of error
(significant level) of 5%, in this study the
number of samples was 100 people (table
attached).
The number of 100 samples is a quota that
must be fulfilled from the SMA, SMK and
MA units, then the sample is taken by

Henny Purnama Dewi et.al. Implementation of Total Quality Management and Interpersonal Communication in
Achieving Student Satisfaction through Service Quality at Yayasan Pendidikan Islam, Miftahussalam, Medan
International Journal of Research & Review (www.ijrrjournal.com) 114 Vol.6; Issue: 2; February 2019
cluster proportional sampling technique.
Quota data from each education unit to meet
100 samples from all units can be seen in
Table 3.2:
Table 3.2 Number of Sample Criteria
No. Unit Number of Samples
1 SMA 42/140 x 100 = 30
2 SMK 62/140 x 100 = 44
3 ALIYAH 36/140 x 100 = 26
Total 100
Source: Data processed (2018
RESULTS AND DISCUSSION
First Model Analysis
The first model or initial model proposed in
the study is carried out by using all
indicators in each construct. The first model
was analyzed using the basic reference in
the model figure 4.10.
Figure 4.10 First Model Framework
Figure 4.10 shows a second order
analysis performed on each research
variable. This is done to see the suitability
of each indicator in each dimension which is
a reference for the decline of the research
indicators. if the indicators of each
dimension are reliable and precisely
measure each dimension, then research can
be more accurate in predicting relationships
between variables that occur.
In constructs that are reflective,
testing reliability indicators is done by using
factor loading. each indicator measured the
loading factor value in each construct. The
value of the loading factor is expected to
reach more than 0.6. However, in
exploratory studies, values of more than 0.4
have been considered adequate (Hulland,
1999). The value of loading factors from
each indicator towards each construct is
measured using an algorithm in the Smart
PLS program. The results of the algorithm
in the first model are presented in Figure
4.11.
Henny Purnama Dewi et.al. Implementation of Total Quality Management and Interpersonal Communication in
Achieving Student Satisfaction through Service Quality at Yayasan Pendidikan Islam, Miftahussalam, Medan
International Journal of Research & Review (www.ijrrjournal.com) 115 Vol.6; Issue: 2; February 2019
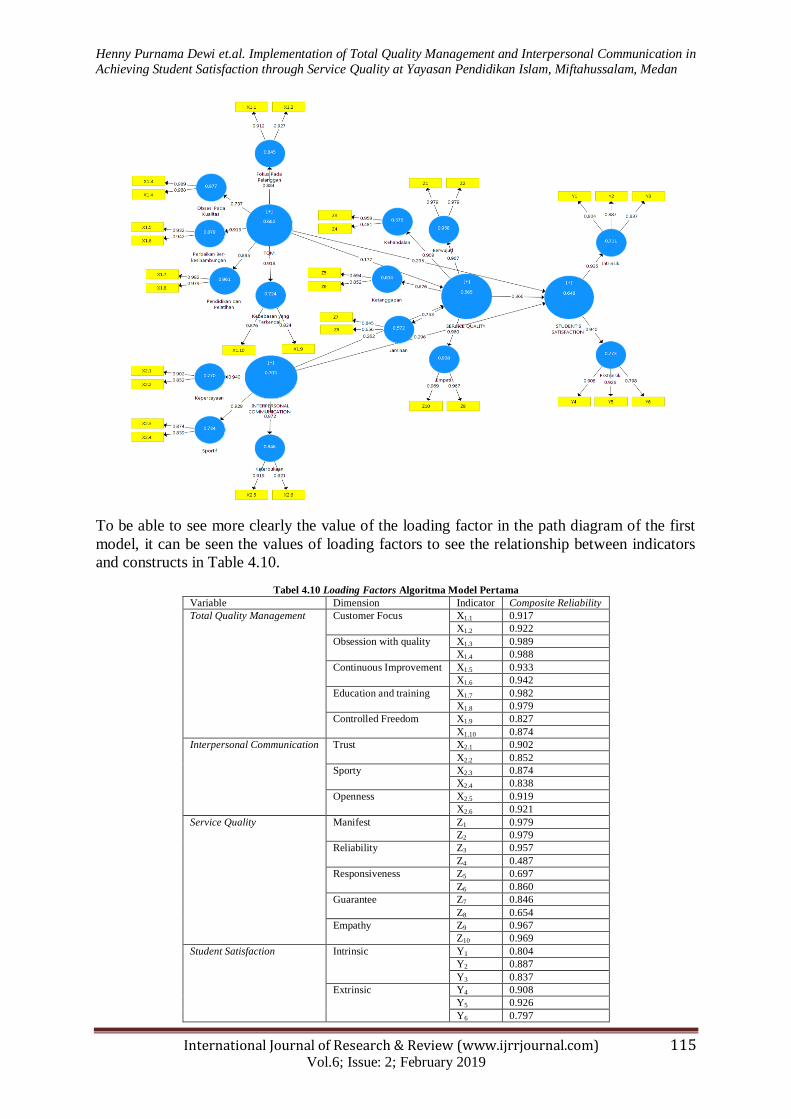
To be able to see more clearly the value of the loading factor in the path diagram of the first
model, it can be seen the values of loading factors to see the relationship between indicators
and constructs in Table 4.10.
Tabel 4.10 Loading Factors Algoritma Model Pertama
Variable Dimension Indicator Composite Reliability
Total Quality Management Customer Focus X1.1 0.917
X1.2 0.922
Obsession with quality X1.3 0.989
X1.4 0.988
Continuous Improvement X1.5 0.933
X1.6 0.942
Education and training X1.7 0.982
X1.8 0.979
Controlled Freedom X1.9 0.827
X1.10 0.874
Interpersonal Communication Trust X2.1 0.902
X2.2 0.852
Sporty X2.3 0.874
X2.4 0.838
Openness X2.5 0.919
X2.6 0.921
Service Quality Manifest Z1 0.979
Z2 0.979
Reliability Z3 0.957
Z4 0.487
Responsiveness Z5 0.697
Z6 0.860
Guarantee Z7 0.846
Z8 0.654
Empathy Z9 0.967
Z10 0.969
Student Satisfaction Intrinsic Y1 0.804
Y2 0.887
Y3 0.837
Extrinsic Y4 0.908
Y5 0.926
Y6 0.797

Henny Purnama Dewi et.al. Implementation of Total Quality Management and Interpersonal Communication in
Achieving Student Satisfaction through Service Quality at Yayasan Pendidikan Islam, Miftahussalam, Medan
International Journal of Research & Review (www.ijrrjournal.com) 116 Vol.6; Issue: 2; February 2019
According to Ghozali (2012) an indicator is
considered valid if it has a correlation value
above 0.70. However, loading 0.50 to 0.60
is still acceptable by looking at the output
correlation between the indicator and the
construct. In Table 4.10 there is only one
invalid indicator, that is, the Z4 indicator
which has a loading factor value below 0.5
which is equal to 0.487 so that this indicator
must later be excluded from the model.
Final Model Analysis
In accordance with the results
obtained in the analysis of the first model
algorithm, the final model proposed is to
issue indicators that do not meet the
assessment criteria for the outer model,
which is <0.6. The second model analysis is
based on the final model framework as
shown in Figure 4.16.
Figure 4.16 Second Model Loading Factors
For more details the value of loading factors in the second model can be seen in Table 4.11.
Table 4.11 Final Factor Loading Factors
Variable Dimension Indicator Composite Reliability
Total Quality Management Customer Focus X1.1 0.912
X1.2 0.927
Obsession with quality X1.3 0.989
X1.4 0.988
Continuous Improvement X1.5 0.932
X1.6 0.942
Education and training X1.7 0.982
X1.8 0.979
Controlled Freedom X1.9 0.824
X1.10 0.876

Henny Purnama Dewi et.al. Implementation of Total Quality Management and Interpersonal Communication in
Achieving Student Satisfaction through Service Quality at Yayasan Pendidikan Islam, Miftahussalam, Medan
International Journal of Research & Review (www.ijrrjournal.com) 117 Vol.6; Issue: 2; February 2019
Table 4.11: To be continued…
Interpersonal Communication Trust X2.1 0.902
X2.2 0.852
Sporty X2.3 0.874
X2.4 0.838
Openness X2.5 0.919
X2.6 0.921
Service Quality Manifest Z1 0.979
Z2 0.979
Reliability Z3 1.000
Responsiveness
Z5 0.684
Z6 0.859
Guarantee
Z7 0.840
Z8 0.662
Empathy
Z9 0.969
Z10 0.968
Student Satisfaction
Intrinsic
Y1 0.804
Y2 0.887
Y3 0.837
Extrinsic Y4 0.908
Y5 0.926
Y6 0.798
The value of loading factors from each
construct above has a factor load value
greater than 0.6. Because all indicators have
met the indicator reliability criteria for each
construct, the outer model analysis can be
continued by looking at the internal
consistency reliability of each construct.
Internal consistency reliability assessment is
performed on each construct. The composite
reliability value of each construct is
expected to be at least 0.7. However, in
exploratory studies the composite composite
value of ≥ 0.6 is acceptable (Bagozzi and
Yi, 1998). The results of the SmartPLS
algorithm in the composite reliability of
each construct are presented in the
following Table 4.12:
Table 4.12 Final Composite Reliability Model
Variable Dimension Composite
Reliability
Total Quality
Management
Customer Focus 0.916
Obsession with quality 0.988
Continuous Improvement 0.935
education and training 0.980
Controlled Freedom 0.840
Interpersonal
Communication
Trust 0.870
Sporty 0.846
Openness 0.917
Service Quality Manifest 0.979
Reliability 1.000
Responsiveness 0.750
Guarantee 0.725
Empathy 0.968
Student Satisfaction Extrinsic 0.910
Intrinsic 0.881
Table 4.10 above shows that each construct
has met the reliability assessment criteria of
the outer model with a reliability composite
value >0.70. Thus the analysis of the outer
model continues to the validity stage of the
outer model.
The outer model validity is done by using
convergent validity and discriminant
validity. Evaluation of convergent validity is
done by looking at the value of Average
Variance Extacted (AVE) in each construct.
Hair et al. (2014) states that the value of
AVE for each good construct is at least 0.5.
The results of the SmartPLS Algorithm on
the AVE value can be seen in Table 4.13.
Table 4.13 Average Variance Extracted Final Model
Variable Dimension Average
Variance
Extacted (AVE)
Total Quality
Management
Customer Focus 0.845
Obsession with quality 0.977
Continuous Improvement 0.879
education and training 0.961
Controlled Freedom 0.724
Interpersonal
Communication
Trust 0.724
Sporty 0.734
Openness 0.846
Service Quality Manifest 0.958
Reliability 1.000
Responsiveness 0.603
Guarantee 0.572
Empathy 0.938
Student
Satisfaction
Extrinsic 0.773
Intrinsic 0.711
Table 4.13 shows that the AVE value of
each dimension construct in the final model
has reached >0.5. Thus, the proposed
structural equation model meets convergent
validity criteria.
Discriminant validity assessment is done by
two methods, namely by using a comparison
between the correlation of each construct to
Henny Purnama Dewi et.al. Implementation of Total Quality Management and Interpersonal Communication in
Achieving Student Satisfaction through Service Quality at Yayasan Pendidikan Islam, Miftahussalam, Medan
International Journal of Research & Review (www.ijrrjournal.com) 118 Vol.6; Issue: 2; February 2019
the root of the AVE based on Fornell Lacker
criteria or by comparing loading factors
with cross loading of each indicator (Hair et
al., 2014). AVE root values can be seen in
Table 4.14 below:
Table 4.14 Root Value of the Final Variance Extracted (AVE)
Model
Variable Dimension Average
Variance
Extacted
(AVE)
Root
AVE
Total Quality
Management
Customer Focus 0.845 0.920
Obsession with quality 0.977 0.988
Continuous Improvement 0.879 0.937
education and training 0.961 0.980
Controlled Freedom 0.724 0.851
Interpersonal
Communication
Trust 0.724 0.851
Sporty 0.734 0.857
Openness 0.846 0.920
Service Quality Manifest 0.958 0.979
Reliability 1.000 1.000
Responsiveness 0.603 0.777
Guarantee 0.572 0.757
Empathy 0.938 0.938
Student
Satisfaction
Extrinsic 0.773 0.879
Intrinsic 0.711 0.843
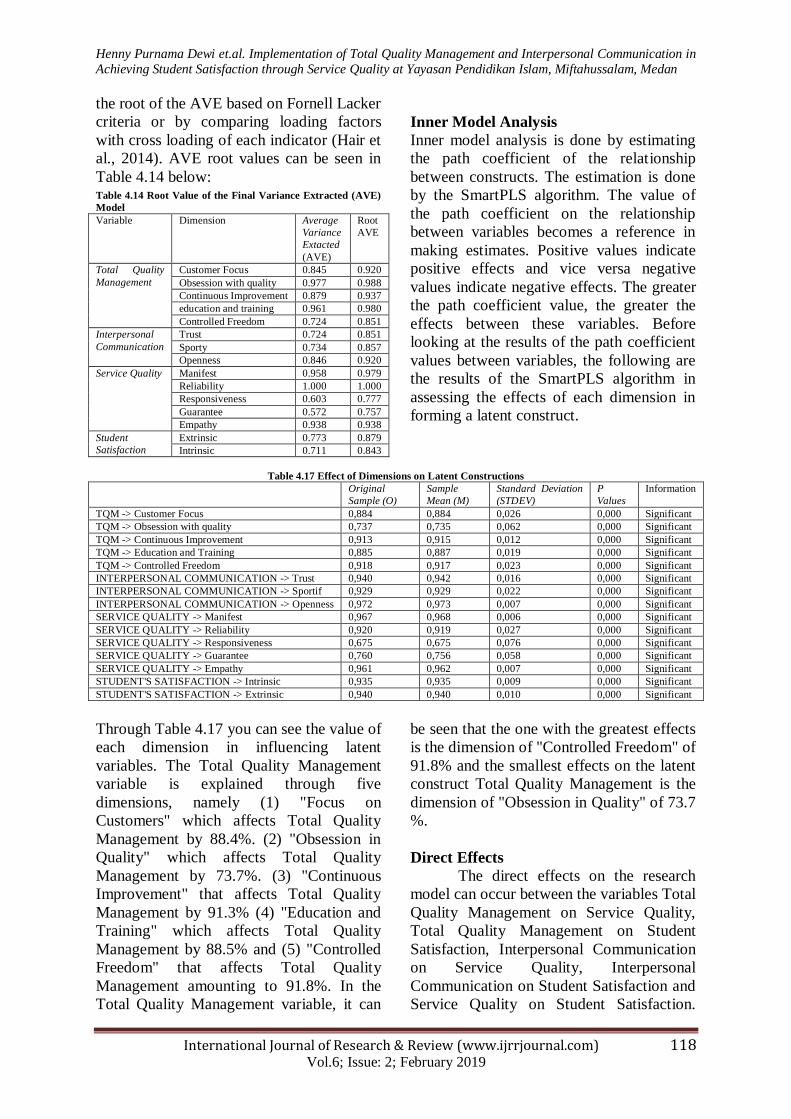
Inner Model Analysis
Inner model analysis is done by estimating
the path coefficient of the relationship
between constructs. The estimation is done
by the SmartPLS algorithm. The value of
the path coefficient on the relationship
between variables becomes a reference in
making estimates. Positive values indicate
positive effects and vice versa negative
values indicate negative effects. The greater
the path coefficient value, the greater the
effects between these variables. Before
looking at the results of the path coefficient
values between variables, the following are
the results of the SmartPLS algorithm in
assessing the effects of each dimension in
forming a latent construct.
Table 4.17 Effect of Dimensions on Latent Constructions
Original
Sample (O)
Sample
Mean (M)
Standard Deviation
(STDEV)
P
Values
Information
TQM -> Customer Focus 0,884 0,884 0,026 0,000 Significant
TQM -> Obsession with quality 0,737 0,735 0,062 0,000 Significant
TQM -> Continuous Improvement 0,913 0,915 0,012 0,000 Significant
TQM -> Education and Training 0,885 0,887 0,019 0,000 Significant
TQM -> Controlled Freedom 0,918 0,917 0,023 0,000 Significant
INTERPERSONAL COMMUNICATION -> Trust 0,940 0,942 0,016 0,000 Significant
INTERPERSONAL COMMUNICATION -> Sportif 0,929 0,929 0,022 0,000 Significant
INTERPERSONAL COMMUNICATION -> Openness 0,972 0,973 0,007 0,000 Significant
SERVICE QUALITY -> Manifest 0,967 0,968 0,006 0,000 Significant
SERVICE QUALITY -> Reliability 0,920 0,919 0,027 0,000 Significant
SERVICE QUALITY -> Responsiveness 0,675 0,675 0,076 0,000 Significant
SERVICE QUALITY -> Guarantee 0,760 0,756 0,058 0,000 Significant
SERVICE QUALITY -> Empathy 0,961 0,962 0,007 0,000 Significant
STUDENT'S SATISFACTION -> Intrinsic 0,935 0,935 0,009 0,000 Significant
STUDENT'S SATISFACTION -> Extrinsic 0,940 0,940 0,010 0,000 Significant
Through Table 4.17 you can see the value of
each dimension in influencing latent
variables. The Total Quality Management
variable is explained through five
dimensions, namely (1) "Focus on
Customers" which affects Total Quality
Management by 88.4%. (2) "Obsession in
Quality" which affects Total Quality
Management by 73.7%. (3) "Continuous
Improvement" that affects Total Quality
Management by 91.3% (4) "Education and
Training" which affects Total Quality
Management by 88.5% and (5) "Controlled
Freedom" that affects Total Quality
Management amounting to 91.8%. In the
Total Quality Management variable, it can
be seen that the one with the greatest effects
is the dimension of "Controlled Freedom" of
91.8% and the smallest effects on the latent
construct Total Quality Management is the
dimension of "Obsession in Quality" of 73.7
%.
Direct Effects
The direct effects on the research
model can occur between the variables Total
Quality Management on Service Quality,
Total Quality Management on Student
Satisfaction, Interpersonal Communication
on Service Quality, Interpersonal
Communication on Student Satisfaction and
Service Quality on Student Satisfaction.

Henny Purnama Dewi et.al. Implementation of Total Quality Management and Interpersonal Communication in
Achieving Student Satisfaction through Service Quality at Yayasan Pendidikan Islam, Miftahussalam, Medan
International Journal of Research & Review (www.ijrrjournal.com) 119 Vol.6; Issue: 2; February 2019
Direct effects between research variables
can be seen through the path coefficient on
the structural model. The results of the
algorithm above can be summarized in the
form of Table 4.18.
Table 4.18 Direct Variable Effects of Research
Direct Effects Between Variables Path Coefficient P Values Information
TQM -> Service Quality 0.183 0.014 Significant
Interpersonal Communication -> Service Quality 0.257 0.004 Significant
TQM -> Student Satisfaction 0.294 0.000 Significant
Interpersonal Communication -> Student Satisfaction 0.300 0.000 Significant
Service Quality -> Student Satisfaction 0.357 0.000 Significant
Table 4.17 shows that in forming good
service quality, Total Quality Management
and Interpersonal Communication each have
positive effects. The magnitude of the
effects of Interpersonal Communication is
greater than the effect of Total Quality
Management (0.257> 0.183). Whereas in
shaping student satisfaction, Total Quality
Management, Interpersonal Communication
and Service Quality also have a positive
effects. The biggest effects on student
satisfaction is Service Quality of 0.357, the
second largest effects is Interpersonal
Communication with an effects of 0.300 on
student satisfaction and the last Total
Quality Management has an effect of 0.924
on student satisfaction.
Indirect Effects
Indirect effects are the magnitude of effects
through mediating variables. The amount of
indirect effects in this study can be seen
through the SemPLS algorithm summarized
in Table 4.19.
Table 4.19 Indirect Effects Through Service Quality
Direct Effects Between Variables Indirect Effect P Values Information
Total Quality Management -> Student Satisfaction 0.065 0.032 Significant
Interpersonal Communication -> Student satisfaction 0.092 0.017 Significant
Table 4.19 shows that the magnitude of the
indirect effect of the Total Quality
Management variable on Student
Satisfaction through Service Quality is
0.065 and the magnitude of the indirect
effect of the Interpersonal Communication
variable on Student satisfaction through
Service Quality is 0.092.
Total Effects
Total effects are the sum of direct effects
and indirect effects. The total effect of the
independent variables on the dependent
variable with the effect of mediating
variables can be calculated and summarized
in Table 4.20.
Table 4.20 Effect of Total Variables Through Service Quality
The results of processing the total effect of
independent variables on the dependent
variable through mediating variables
processed by the SemPLS algorithm can be
explained in Table 4.20. It can be seen that
the Total Effect value of Total Quality
Management for Student Satisfaction
through Service Quality is 0.359. This value
is the result of the sum of the direct and
indirect effects of the influence of each of
these variables in Table 4.12 and Table 4.13
before.
While the Total Effect value of
Interpersonal Communication towards
Student Satisfaction through Service Quality
is 0.392, the value is also the result of the
sum of the direct and indirect effects of the
influence of each variable in Table 4.12 and
Table 4.13 before.
Total Effect Between Variables Direct Effects Indirect Effects Total Effect
Total Quality Management -> Student Satisfaction 0.294 0.065 0.359
Interpersonal Communication -> Student Satisfaction 0.300 0.092 0.392

Henny Purnama Dewi et.al. Implementation of Total Quality Management and Interpersonal Communication in
Achieving Student Satisfaction through Service Quality at Yayasan Pendidikan Islam, Miftahussalam, Medan
International Journal of Research & Review (www.ijrrjournal.com) 120 Vol.6; Issue: 2; February 2019
Determination Coefficient (R Square)
Analysis of the coefficient of determination
is done to see the magnitude of the variance
that can be explained by the independent
variable on the dependent variable. The
greater the coefficient of determination, the
greater the variance in the dependent
variable that can be explained by the
independent variable. Because the number
of indicators for each construct varies in
number, the analysis of the coefficient of
determination is done by looking at the
value in the adjusted R-square. The adjusted
R-square value is obtained by calculation of
SmartPLS and shown in Figure 4.17.
Figure 4.17 Adjusted R Square Final Model
Figure 4.17 shows the adjusted R-square
value for each influence between variables.
these values are summarized in the
following Table 4.21:
Table 4.21R-Square Final Model
Variable R-Square Adjusted r-Square
Service Quality 0.130 0.112
Student Satisfaction 0.484 0.468
Through Table 4.21, it can be seen that the
influence of the Total Quality Management
and Interpersonal Communication variables
together in forming Service Quality is
11.2%, while the remaining 88.8% is
explained by other variables outside of this
study. While the influence of the Total
Quality Management variable, Interpersonal
Communication variables and Service
Quality variables together in forming
Student Satisfaction variables is 46.8%,
while the remaining 53.2% is explained by
other variables outside of this study.
Hypothesis Testing
The hypothesis proposed in the study will
be tested statistically using the bootstrap
method on SmartPLS. The bootstrap method
is used to calculate the significance of path
coefficient obtained in the inner model
where the t-statistic value must be greater
than the t-table value.
Figure 4.18 Bootstrap Model
0.112 0.468
2.196
3.774
2.681
3.784
3.981

Henny Purnama Dewi et.al. Implementation of Total Quality Management and Interpersonal Communication in
Achieving Student Satisfaction through Service Quality at Yayasan Pendidikan Islam, Miftahussalam, Medan
International Journal of Research & Review (www.ijrrjournal.com) 121 Vol.6; Issue: 2; February 2019
Figure 4.18 shows that the influence of each
variable according to the hypothesis
proposed is positive and significant so that
all hypotheses can be accepted.
The biggest value of t-statistics in this
bootstrap model is found on the effect of
service quality on student satisfaction with a
t-statistic value of 3.981. The effect of
interpersonal communication on student
satisfaction has a t-statistic value of 3.784.
For the influence of Total Quality
Management on student satisfaction has a t-
statistic value of 3.774. The effect of
interpersonal communication on service
quality has a t-statistic value of 2.681.
While the smallest t-statistic value is in the
effect of Total Quality Management on
service quality, namely the t-statistic value
of 2.196. Comparison of values from the
results of the hypothesis test of this study
can be seen in Table 4.22.
Table 4.22 Hypothesis testing
No Hipotesis Original
Sample (O)
T Statistics
(|O/STDEV|)
P Values Information
H1 Total Quality Management has a positive and significant effect
on service quality
0.183 2.196 0.014 Accepted
H2 Interpersonal Communication has a positive and significant
effect on service quality
0.257 2.681 0.004 Accepted
H3 Total Quality Management has a positive and significant effect
on student satisfaction
0.294 3.774 0.000 Accepted
H4 Interpersonal Communication has a positive and significant
effect on student satisfaction
0.300 3.784 0.000 Accepted
H5 Service quality has a positive and significant effect on student
satisfaction
0.357 3.981 0.000 Accepted
H6 Total Quality Management has a positive and significant effect
on student satisfaction through service quality
0.065 1.859 0.032 Accepted
H7 Interpersonal Communication has a positive and significant
effect on student satisfaction through service quality
0.092 2.136 0.017 Accepted
DISCUSSION OF RESEARCH
RESULTS
Total Quality Management for Service
Quality
Total Quality Management (TQM) is
indeed a basic process and philosophy that
will succeed if applied simultaneously at all
levels in the organization. The application
of TQM does not require new equipment or
management systems, but rather a
commitment or awareness to make a
cultural change that is oriented towards
improving quality and improving the whole
process continuously, thoroughly, and
continuously. TQM can indeed be applied in
any organization and is no exception. With
regard to the way it is applied, in what areas
of the philosophy are applied, and how to
overcome the obstacles and barriers that
hinder this application to educational
organizations, implementation that takes a
long time will not be felt. In addition, if
followed correctly, success will be on
hands, both individuals and organizations.
The Total Quality Management
variable in this study was measured through
five dimensions, namely, customer focus,
obsession with quality, continuous
improvement, education and training and
controlled freedom (Goetsch et al., 2010) in
which each dimension consisted of two
indicators. In the Total Quality Management
variable, it can be seen that the one that
gives the most influence is the dimension of
"controlled freedom" and the smallest one
influences the latent constructs Total
Quality Management is the dimension of
"Obsession in Quality".
This construct the highest adjusted R
square value is also found in the controlled
dimensions of freedom. The higher the R
square value the better the model predicts
the proposed research model (Jogiyanto,
2015). This is supported by the results of
respondents' answers to the controlled
dimensions of freedom which are
represented by two indicators, namely: (1)
advice of students who help improve quality

Henny Purnama Dewi et.al. Implementation of Total Quality Management and Interpersonal Communication in
Achieving Student Satisfaction through Service Quality at Yayasan Pendidikan Islam, Miftahussalam, Medan
International Journal of Research & Review (www.ijrrjournal.com) 122 Vol.6; Issue: 2; February 2019
(2) management accepts criticism of
constructing both indicators including
agreeable categories which means students
agree that criticisms and suggestions
delivered by students able to help improve
quality at YPIM.
The direct effect of the Total Quality
Management variable on the Service
Quality variable is 18.3%. Based on the
results of hypothesis testing, Total Quality
Management has a positive and significant
effect on service quality with a t-count value
greater than t-table and a value of p values
smaller than 0.05. The results of this test
prove that the first hypothesis (H1) is
accepted. The results of this study are in line
with the results of research by Hutomo and
Ratih (2015) which states that there is a
positive and significant effect of Total
Quality Management (TQM) on service
quality at SD Al-Ghifari Plus Bandung.
The results of this study are also
supported by Gupta et al. (2005) obtained
results that when TQM is applied in the
service sector, it will create better service
quality, through programs to shape
employee behavior. This research has also
shown that the perception of customer
service quality is based on the difference
between actual service experience and what
they expect.
Interpersonal Communication for Service
Quality
Interpersonal Communication
variables in this study are measured through
three dimensions including trust, supportive
attitude, and openness (Rachmat, 2008)
where each dimension is measured using
two indicator items. In the Interpersonal
Communication variable, it can be seen that
the one that gives the most influence is the
dimension of "Openness" and the smallest
one influences the latent constructs of
Interpersonal Communication is the
dimension of "Trust". In this construct the
highest adjusted R square value is also
found in the dimension of openness. This
supports the theory from Devito (2013)
which states that one dimension to measure
interpersonal communication is openness.
Although the highest adjusted R square
value is in the dimension of openness, the
average respondent disagrees with the two
questionnaire statements, namely (1) the
teacher is able to communicate openly (2)
the teacher is willing to exchange ideas.
This means that students consider teachers
and students to be less able to communicate
openly and are less able to be invited to
exchange ideas because between students
and teachers each lack psychological
attachment.
The quality of openness refers to at
least three aspects of interpersonal
communication. First, effective
interpersonal communicators must be open
to the people they are interacting with.
There must be a willingness to disclose
information that is usually hidden, provided
that this self-disclosure is appropriate. The
second aspect of openness refers to the
willingness of communicators to react
honestly to the stimulus that comes. People
who are silent, not critical, and unresponsive
are generally participants of boring
conversation.
When the service process carried out
by teachers and employees of students
occurs service interaction through
communication contacts. Employees and
teachers must be able to create good
communication contacts with students
because good communication contacts are
one of the factors that determine students'
satisfaction or failure with the services
provided.
The direct effect of Interpersonal
Communication variables on Service
Quality variables is 25.7%. Based on the
results of hypothesis testing, Interpersonal
Communication has a positive and
significant effect on service quality with a t-
count value greater than t-table and p value
values that are smaller than 0.05. The results
of this test prove that the second hypothesis
(H2) is accepted. The results of this test are
in line with the results of Fletcher's (1999)
study, which in his research proved that the

Henny Purnama Dewi et.al. Implementation of Total Quality Management and Interpersonal Communication in
Achieving Student Satisfaction through Service Quality at Yayasan Pendidikan Islam, Miftahussalam, Medan
International Journal of Research & Review (www.ijrrjournal.com) 123 Vol.6; Issue: 2; February 2019
performance and quality of service in an
organization can be considered as a direct
result of how effectively a communication
system is structured and managed.
Total Quality Management for Student
Satisfaction
The TQM approach, quality is
determined by the customer. Therefore, only
by understanding the process and customers
can the organization realize and appreciate
the meaning of quality. All management
efforts in TQM are directed at one main
goal, namely the creation of customer
satisfaction. Whatever management does is
useless if it ultimately does not result in an
increase in customer satisfaction.
Student Satisfaction variables in this
study were measured using two dimensions
namely, intrinsic and extrinsic. Each
dimension is measured using three
indicators. The intrinsic dimension includes
the abilities, expectations and talents of
students, while the extrinsic dimensions
include the quality of teaching teachers,
facilities and school atmosphere. In the
Student Satisfaction variable it can be seen
that the "Extrinsic" dimension has a greater
influence on the Student Satisfaction
variable than the "Intrinsic" dimension.
The construct of student satisfaction,
the highest adjusted R square value is found
in the extrinsic dimension. Extrinsic
dimensions are explained by three
indicators, namely: (1) the quality of
teaching professional teachers, who have a
mean score disagree (2) complete laboratory
facilities, who have mean values disagree
(3) school atmosphere that supports students
to focus, who have mean value disagrees.
Although the highest adjusted R square
value is in the extrinsic dimension, it turns
out that students' perceptions of satisfaction
in terms of extrinsic dimensions have a total
perception of disagree. This shows that
students are not satisfied with the quality of
teaching teachers, incomplete laboratory
facilities and uncomfortable school
atmosphere and make them less focused in
doing teaching and learning.
The direct effect of the Total Quality
Management variable on the Student
Satisfaction variable is 29.4%. This
relationship between Total Quality
Management and customer satisfaction is in
line with Nasution's (2015) statement that
by increasing the application of TQM as a
way to improve quality, this is done to
obtain customer satisfaction.
Based on the results of hypothesis testing,
Total Quality Management has a positive
and significant effect on Student
Satisfaction with a t-count value greater
than t-table and a value of p values smaller
than 0.05. The results of this test prove that
the third hypothesis (H3) is accepted. The
results of this study are in line with the
results of the study of Florentina and Lauw
(2014) which states that the increase in
Total Quality Management has a positive
and significant effect on the satisfaction of
Accounting Department students of the
Faculty of Economics, one of the University
in Bandung.
Interpersonal Communication to Student
Satisfaction Establishing interpersonal
communication is a very helpful way to
establish good relationships with customers
in order to provide the best quality service
that ultimately can create customer
satisfaction and loyalty. Kotler and Amtrong
in Weningtyas (2012) state that consumers
will feel more satisfaction in the technique
of interacting with others and have the
ability to perceive socially to be able to read
the feelings, attitudes and beliefs of
consumers. Interacting techniques and the
ability to read feelings, attitudes and beliefs
can be created through good interpersonal
communication between employees and
consumers / customers in this study,
especially between teachers and students.
In this study the direct effect of the
Interpersonal Communication variable on
the Student Satisfaction variable was 30%.
Based on the results of hypothesis testing,
Interpersonal Communication has a positive
and significant effect on Student

Henny Purnama Dewi et.al. Implementation of Total Quality Management and Interpersonal Communication in
Achieving Student Satisfaction through Service Quality at Yayasan Pendidikan Islam, Miftahussalam, Medan
International Journal of Research & Review (www.ijrrjournal.com) 124 Vol.6; Issue: 2; February 2019
Satisfaction with a t-count value greater
than t-table and a value of p values smaller
than 0.05. The results of this test prove that
the fourth hypothesis (H4) is accepted.
The results of this study are in line
with the results of the study of Novia (2016)
which states that there is a very significant
effect between interpersonal communication
on customer satisfaction at Bank Rakyat
Indonesia (BRI) in Balikpapan's Pandan
Wangi Branch. This means that the higher
the interpersonal communication obtained,
the higher the level of satisfaction. This
statement is also supported by research
conducted by Putra (2009) that good
interpersonal communication can play a role
in an image and the level of customer
satisfaction which in turn becomes a driver
of consumer willingness with the company.
Service Quality for Student Satisfaction
Student satisfaction is closely related
to the quality of school services. Student
satisfaction is the response of students'
feelings to the experience gained (reality) in
school with their expectations, and students
will feel satisfied if what is received is a
match between expectations and
experiences gained by students. Quality
schools are schools that have the quality of
education servants who are able to provide
satisfaction to students.
Service quality variables are
measured using five dimensions, namely,
tangible, reliability, responsiveness,
assurance and empathy. Each dimension is
measured using two questions. In this
Service Quality variable, it can be seen that
the one that has the greatest influence is on
the "Tangible" dimension and the smallest
one that gives effect to the Service Quality
latent construct is the "Responsibility"
dimension.
This construct the highest adjusted R
square value is found in the Tangible
dimension. Respondents' answers to the
questionnaire were seen for the tangible
dimension represented through two
indicators, namely: (1) the availability of
supporting technology that has an average
value (2) agreeing (2) a comfortable
learning room that has a mean score agreed .
This shows that although the highest
adjusted R square value is in the Tangible
dimension but through comfortable class
indicators, it turns out that students disagree
with the statement but the average student
agrees with the availability of technology
supporting teaching and learning activities
at school.
The direct effect of the Service
Quality variable on the Student Satisfaction
variable in this study was 35.7%. To be able
to create satisfied consumers, company
management must know the things that lead
to the creation of student satisfaction, one of
which is by continuing to strive to improve
service quality.
The influence of the Total Quality
Management and Interpersonal
Communication variables together in
forming Service Quality is 11.2%, while the
remaining 88.8% is explained by other
variables outside of this study. Based on the
results of hypothesis testing, Service Quality
has a positive and significant effect on
Student Satisfaction with t-count values
greater than t-table and p value values less
than 0.05. This statement proves that the
fifth hypothesis (H5) is accepted.
The results of this study are in line
with the results of the research by Yuniarti
(2014) which states that service quality has
a positive and significant effect on student
satisfaction in the Extension Program of the
Faculty of Economics, Jambi University.
This means that the better the quality of
service provided by the Extension Program
of the Faculty of Economics, University of
Jambi, the more students feel satisfied with
the service.
Total Quality Management for Student
Satisfaction Through Service Quality
To produce quality products and
services, the best companies need
continuous efforts to improve human
capabilities, processes, and the environment.
The right way to continually improve the
capabilities of these components is by

Henny Purnama Dewi et.al. Implementation of Total Quality Management and Interpersonal Communication in
Achieving Student Satisfaction through Service Quality at Yayasan Pendidikan Islam, Miftahussalam, Medan
International Journal of Research & Review (www.ijrrjournal.com) 125 Vol.6; Issue: 2; February 2019
implementing Total Quality Management
which will ultimately create customer
satisfaction and loyalty.
From this study, the results of the
Total Quality Management variable indirect
effect on the Student Satisfaction variable
after going through the Service Quality
variable is 6.5% and based on the results of
hypothesis testing, Total Quality
Management has a positive and significant
effect on Student Satisfaction with Service
Quality as an intervening variable with t-
count values greater than t-table and p
values smaller than 0.05. This statement
proves that the sixth hypothesis (H6) is
accepted.
The results of this study are back in
line with the results of research by Hutomo
and Ratih (2015) which showed the results
that Total Quality Management had a
positive and significant effect on Service
Quality and customer satisfaction.
Interpersonal Communication for
Student Satisfaction Through Service
Quality
Consumer satisfaction is influenced
by several driving factors, such as
interpersonal communication and service
quality. At the time of the customer service
process, at that time there was an interaction
between the waiter and the customer. This
interaction must be able to occur through
good interpersonal communication so as to
create customer satisfaction which
ultimately can maintain customer loyalty
(Weningtyas, 2012).
This study the indirect effect of the
Interpersonal Communication variable on
the Student Satisfaction variable after going
through the Service Quality variable was
9.2%. Based on the results of hypothesis
testing, Interpersonal Communication has a
positive and significant effect on student
satisfaction with service quality as a
mediating variable with a t-count value
greater than t-table and a p value of less
than 0.05, this statement proves that the
seventh hypothesis (H7) received.
The results of this study are in line
with the results of the research of
Weningtyas (2012) which proved that the
hypothesis which reads there is a positive
influence on interpersonal communication
and service quality on customer satisfaction
is acceptable. That is, the higher the
interpersonal communication skills and the
quality of services provided by employees,
the higher consumer satisfaction.
Conversely, the lower the interpersonal
communication skills and the quality of
services provided by employees, the lower
the customer satisfaction.
This study the total influence of the
Total Quality Management variables,
Interpersonal Communication variables and
Service Quality variables together formed a
Student Satisfaction variable of 46.8%,
while the remaining 53.2% was explained
by other variables outside of this study.
CONCLUSION
Based on the results of the research and
discussion in the previous chapter, a number
of things can be concluded as follows:
1. Total Quality Management has a
positive and significant effect on service
quality.
2. Interpersonal Communication has a
positive and significant effect on service
quality.
3. Total Quality Management has a
positive and significant effect on
Student Satisfaction.
4. Interpersonal Communication has a
positive and significant effect on
Student Satisfaction.
5. Service Quality has a positive and
significant effect on Student
Satisfaction.
6. Total Quality Management has a
positive and significant effect on
Student Satisfaction through service
quality.
7. Interpersonal Communication has a
positive and significant effect on student
satisfaction with service quality.

Henny Purnama Dewi et.al. Implementation of Total Quality Management and Interpersonal Communication in
Achieving Student Satisfaction through Service Quality at Yayasan Pendidikan Islam, Miftahussalam, Medan
International Journal of Research & Review (www.ijrrjournal.com) 126 Vol.6; Issue: 2; February 2019
Recommendation Based on the research that has been done, the
suggestions from researchers are:
1. Further research is expected to expand the
research population, namely by increasing the
number of respondents by conducting research
in larger educational institutions.
2. Further research is expected to further
evaluate the questions in the questionnaire in
order to be able to accurately represent the
variables to be measured.
3. Further research is expected to be able to find
other indicators as a measure of the variables
to be measured.
4. Further research is expected to add to other
variables, both independent and dependent
variables, and it is expected that further
researchers can find other variables that can be
used as intervening variables or moderating
variables to find out variables that can
strengthen or weaken the dependent variable.
REFERENCES
Abdillah, Willy dan Jogiyanto. 2015. Partial
Least Square (PLS) Alternatif Structural
Equation Modeling (SEM) dalam Penelitian Bisnis. Ed.1. Yogyakarta: ANDI.
Abdullah, Taman, Sukirno, Annisa Ratna Sari,
Ngadirin Setiawan dan Adeng Pustikaningsih.
2013. Analisis Kualitas Pelayanan Terhadap
Kepuasan Mahasiswa Pada Fakultas Ekonomi
Universitas Negeri Yogyakarta. Jurnal Nominal /
Volume II Nomor I / Tahun 2013.
Agustina, Vina dan Yoestini. 2012. “Analisis
Pengaruh Kualitas Pelayanan, Kepuasan
Pelanggan, Dan Nilai Pelanggan Dalam
Meningkatkan Loyalitas Pelanggan Joglosemar Bus (Studi Pada Wilayah Semarang Town
Office)”. Diponegoro Journal Of Management.
Volume 1, Nomor 1, Tahun 2012, Halaman 1-
11.
Allen, R.S, Kilmann, R.H. 2001. "The Role Of
The Reward System For A TQM Based
Strategy". Journal of Organizational Change
Management, Vol. 14 No 2, pp. 110-131.
Amalia, Ria. 2016. Pengaruh Total Quality
Management (TQM) Terhadap Kepuasan
Pelanggan Pada Matahari Department Store di Plaza Mulia Samarinda. eJournal Administrasi
Bisnis, Volume 4, Nomor 3.
Ana, Hidayati, Achmad Fudholi, dan Sumarni.
2014. Analisis Kepuasan Mahasiswa Terhadap
Kualitas Pelayanan Tenaga Administratif Di
Fakultas Farmasi Universitas Ahmad Dahlan
Yogyakarta. Pharmaçiana, Vol. 4, No. 1, 2014 :
59-64.
Andre, Florentina dan Lauw Tjun Tjun. 2014.
Pengaruh Total Quality Management (TQM)
Terhadap Kualitas Pelayanan dan Kepuasan
Konsumen di Jurusan Akuntansi Fakultas
Ekonomi Salah Satu Universitas di Bandung.
Jurnal Akuntansi, 6 (1). pp. 47-83. ISSN 2085-
8698.
Ardianto. 2016. Pengaruh Komunikasi Positif
dalam Keluarga dan Komunikasi Interpersonal Guru terhadap Perilaku Asertif Siswa. Journal of
Islamic Education Policy, Vol. 1, No. 2, 82-98.
Arikunto, Suharsimi. 2007. Manajemen
Penelitian, Cetakan Kesembilan, Jakarta, Rineka
Cipta.
Asmal, Mira. 2012. Pelatihan Komunikasi
Interpersonal Untuk Meningkatkan Kualitas
Layanan Pada Perawat Rumah Sakit Umum.
Jurnal Intervensi Psikologi, Vol. 4 No. 2.
Aw, Suranto. 2011. Komunikasi Interpersonal.
Yogyakarta: Graha Ilmu.
Bagozzi, Richard P dan Youjae Yi. "On The
Evaluation of Structural Equation Models".
Journal of The Academy Marketing Science
16:74-21 doi : 10.1007/BF02723327.
Basu Swastha dan Irawan, 2010, Manajemen
Pemasaran Modern, Penerbit Liberty,
Yogyakarta.
Bergquist, T. and Ramsing, K. (1999).
"Measuring Performance After Meeting Award
Criteria". Quality Progress 32(9): 66-72.
Cangara, Hafied. 2011. Pengantar ilmu komunikasi. Jakarta: PT Raja Grafindo. Persada.
Chin, Wayne W., dan Peter R. Newsteed. 1999.
Structural Equation Modeling Analysis With
Small Samples Using Partial Least Square,
http://www.researchgate.net/publication/
242370645
Clifford, Margaret M., dan Elaine Walster. 1973.
"The Effect of Physical Attractiveness on
Teacher Expectations". Sociology of education.
46 : 248-11 doi : 10.2307/2112099.
Danim, Sudarwan. 2010. Profesionalisme dan Etika Profesi Guru. Cetakan I: Bandung,
Alfabeta.
Denhard, Janet V, and Denhard, Robert B. 2003.
The New Public Service: Serving, Not Steering.
Armonk, N.Y: M.E. Sharpe.
Devito, Joseph A. 2013. Komunikasi Antar
Manusia. Pamulang-Tangerang Selatan: Karisma
Publishing Group.
Efendi, Januar. 2016. Pengaruh Kualitas
Pelayanan Terhadap Kepuasan Pelanggan Pada
JNE Cabang Bandung, DeReMa Jurnal
Manajemen Vol. 11 No. 2.
Ermawati, Erli. Indriyati. 2011. Hubungan
Antara Konsep Diri Dengan Perilaku Konsumtif
Pada Remaja Di SMP N 1 Piyungan. Vol 2. No
1.
Eskildson, L. 1994. "Improving The Odds of
Total Quality Management's Success". Quality
Progress. Vol. 27. No. 4. PP 61-63.

Henny Purnama Dewi et.al. Implementation of Total Quality Management and Interpersonal Communication in
Achieving Student Satisfaction through Service Quality at Yayasan Pendidikan Islam, Miftahussalam, Medan
International Journal of Research & Review (www.ijrrjournal.com) 127 Vol.6; Issue: 2; February 2019
Fadli, Rozaq. 2012. Hubungan Komunikasi
Interpersonal Antara Guru dan Siswa Dengan
Keaktifan Belajar Siswa Kelas XI Program
Keahlian Teknik Otomotif di SMK
Muhammadiyah 4 klaten Tengah Tahun Ajaran
2012/2013. Jurnal Skripsi. Repository UNY.
Fletcher, Melani. 1999. "The Effect Of Internal
Communication, Leadership and Team
Performance on Successfull Srvice Quality
Implementation : A South African Perspective".
Team Performance Management: An
International Journal. Vol. 5 Issue: 5, pp.150-
163.
Frymier, Ann Bainbridge. 1994. "The Use of
Affinity-Seeking in Producing Liking and
Larning in the classroom". Journal of Applied
Communication Research. 22 (2) : 87-19, doi : 10.1080/00909889409365391.
Garakhani, Davood. 2013. "Total Quality
Management And Organizational Performance”.
American Journal of Industrial Engineering.
Vol. 1, No. 3. Hal. 46-50.
Ghozali, I. Latan, H. 2012. Partial Least Square
: Konsep, Teknik dan Aplikasi. SmartPLS 2.0
M3. Semarang: Badan Penerbit Universitas
Diponegoro. Istijanto.
Ghozali, Imam. 2012. Aplikasi Analisis
Multivariate dengan Program IBM SPSS 19, Cetakan V. Semarang : Badan Penerbit
Universitas Diponegoro.
Goetsch, D.L. & Davis, S. 2010. Quality
Management For Organizational Excellence:
Introduction to Total Quality. NJ: Printice Hall
International, Inc.
Goni, Marvin. 2016. Peranan Komunikasi
Organisasi Dalam Peningkatan Kualitas
Pelayanan, Di Kecamatan Mapanget Kota
Manado. Volume 5, No. 3.
Gultom, Dedek. k, Paham, Ginting, Beby dan
KF. Sembiring. 2014. Pengaruh Bauran Pemasaran Jasa Dan Kualitas Pelayanan
Terhadap Kepuasan Mahasiswa Program Studi
Manajemen Fakultas Ekonomi Universitas
Muhammadiyah Sumatera Utara. Jurnal
Manajemen & Bisnis Vol 14.
Hair, Joseph F., et.al.2010. Multivariate Data
Analysis. 7th Edition. New York
Hair, Joseph F.Jr, G Thomas M Hult, Cristian
M. Ringle dan Marko Sartsted. 2014. A Primer
on Partial Least Squares Structural Equation
Modeling (PLS-SEM).
Hardianti, Novia. 2016. Pengaruh Komunikasi
Interpersonal dan Mutu Pelayanan Terhadap
Kepuasan Nasabah Bank Rakyat Indonesia
Cabang Pandan Wangi
Balikpapan. Psikoborneo, 2016, 4 (2) : 276 -
285. ISSN 2477-2674, ejournal.psikologi.fisip-
unmul.ac.id.
Haryono, Budi. How to Manage Costumer
Voice. Yogyakarta : ANDI, 2013), Ed. I, hlm. 5.
Helmita. 2016. Pengaruh Persepsi Kualitas
Pelayanan Dan Komunikasi Terhadap Kepuasan
Mahasiswa di Biro Kemahasiswaan IBI
Darmajaya. Jurnal Manajemen Magister, Vol. 02. No.02.
Hendricks, K.B. and Singhal, V.R. 1997. "Does
Implementing An Effective TQM Program
Actually Improve Operating Performance:
Empirical Evidence From Firms That Have Won
Quality Awards". Management Science, Vol. 44
No. 9, pp. 1258-74.
Herjanto, Eddy.2008. Manajemen Operasi Edisi
Ketiga, Jakarta: Grasindo.
Hidayati, Ana, Achmad Fudholi, dan Sumarni.
2014. “Analisis Kepuasan Mahasiswa Terhadap Kualitas Pelayanan Tenaga Administratif Di
Fakultas Farmasi Universitas Ahmad Dahlan
Yogyakarta”. Pharmaçiana, Vol. 4, No. 1, 2014 :
59-64.
https://www.panduandapodik.id/2017/07/aturan-
jumlah-siswa-dan-rombel-sekolah.html.
Hulland, J. 1999. "Use of Partial Least Squares
(PLS) in Strategic Management Research: A
Review of Four Recent Studies". Strategic
Management Journal 20 (2): 195-204.
Husain, Umar. 2005. Manajemen Riset dan Perilaku Konsumen. PT. Gramedia.
Ismunawan. 2010. Penerapan Penilaian Kinerja
dan Sistem Pengukuran. Jurnal Graduasi. Vol.
24.
Jantes. 2014. Pengaruh Kinerja Kepala Sekolah
Dan Pemanfaatan Sarana Prasarana Terhadap
Produktivitas.
Jasuri. 2014. Total Quality Management (TQM)
Pada Lembaga Pendidikan Islam.
Kotler dan Keller. 2013. Manajemen Pemasaran.
Edisi 13. Jilid 1. Erlangga, Jakarta.
Kotler, Philip, dan Armstrong, Gery. 2012.
Prinsip-Prinsip Pemasaran. Edisi Tiga Belas,
Jilid Pertama, Erlangga, Jakarta.
Kurnianingsih, Retno dan Nur Indriantoro. 2001.
Pengaruh Sistem Pengukuran Kinerja dan
Sistem Penghargaan Terhadap Keefektifan
Penerapan Teknik Total Quality Management
Studi Empiris pada Perusahaan Manufaktur di
Indonesia.Vol.4, No.1.
Manik, Ester dan Iwan Sidharta. 2017. "The
Impact Of Academic Service Quality On Student Satisfaction". MPRA Munich
Personal RePEc Archive. Paper No. 80878.
Mauludin, Hanif. 2010. Marketing Research:
Panduan Bagi Manajer, Pimpinan Perusahaan
Organisasi. Jakarta: Elex Media Komputindo.
Minarti, Sri. 2011. Manajemen Sekolah,
Jogjakarta: Ar-Ruzz Media.
Mishra, Patanjali dan Asha Pandey. 2013.
"Barriers In Implementing Total Quality

Henny Purnama Dewi et.al. Implementation of Total Quality Management and Interpersonal Communication in
Achieving Student Satisfaction through Service Quality at Yayasan Pendidikan Islam, Miftahussalam, Medan
International Journal of Research & Review (www.ijrrjournal.com) 128 Vol.6; Issue: 2; February 2019
Management In higher Education". Management
Science. Volume-1, Online Issue-1.
Mulyana, Deddy. Ilmu Komunikasi: Suatu
Pengantar. Cetakan ke 18. Bandung: PT. Remaja
Rosdakarya, 2014.
Mulyasa. 2011. Manajemen dan Kepemimpinan Kepala Sekolah, Penerbit Bumi Akasara
JakartaPress.
Munizu, Musran. 2010. Praktik Total Quality
Management dan Pengaruhnya Terhadap Kinerja
Karyawan (Studi Pada PT. Telkom Tbk, Cabang
Makasar). Jurnal Manajemen dan
Kewirausahaan. Vol. 12, No. 2, Hal. 185 -194
(JMK-2010-12-2).
Munizu, Musran. 2010. Praktik Total Quality
Management dan Pengaruhnya Terhadap Kinerja
Karyawan (Studi Pada PT. Telkom Tbk, Cabang Makasar). Jurnal Manajemen dan
Kewirausahaan. Vol. 12, No. 2, Hal. 185-194
(JMK-2010-12-2).
Nasution, M.N. 2014. Kepemimpinan Mutu
Kepala Sekolah Dalam Peningkatan Mutu
Pendidikan. Volume 12, no. 2.
Nasution, Nur 2015. Manajemen Mutu Terpadu,
Thirteenth Edition, Jakarta: Ghalia Indonesia.
Nawawi, Hadari. 2003. Manajemen Strategik
Organisasi Non Profit Bidang Pemerintahan
dengan Ilustrasi di Bidang Pendidikan. Yogyakarta. Gadjah Mada University Press.
Nawawi, Hadari. 2012. Metode Penelitian
Bidang Sosial. Yogyakarta: Gajah Mada
University Press.
Neyestani, Benham. 2017. "Principles And
Contributions of Total Quality Management
Gurus on Business Quality Imrovement". MPRA
Paper No. 77282.
Nurgiyantoro, Burhan dkk .2004. Statistik
Terapan untuk Penelitian Ilmu-ilmu Sosial.
Yogyakarta. Gadjah Mada University Press.
Nyoman, I Rinala, I Made Yudana dan I
Nyoman Natajaya. 2013.” Pengaruh Kualitas
Pelayanan Akademik Terhadap Kepuasan Dan
Loyalitas Mahasiswa Pada Sekolah Tinggi
Pariwisata Nusa Dua Bali”. E-Journal Program
Pascasarjana Universitas Pendidikan Ganesha.
Volume 4 Tahun 2013.
Primiani, C. Novi. 2005. Total Quality
Management Dan Service Quality Dalam
Organisasi Pendidikan Tinggi. Cakrawala
Pendidikan, Th. XXIV, No. 2.
Przasnyski, Z.H and Tai, L.S. 1999. "Stock Market Reaction to Malcolm Baldridge National
Quality Award Announcement : Does Quality
Pay?". Journal of Total Quality Management.
Vol. 10. No.3.
Pujawan, I Nyoman. 2010. Supply chain
management. Edisi Kedua. Surabaya : Guna
Widya.
Purwanto, Djoko. 2011. Komunikasi Bisnis.
Edisi 4. Erlangga. Jakarta. Pusat: Jakarta.
Putra, Adi. 2009. Pengaruh Kualitas Pelayanan
Terhadap Kinerja Kerelasian Nasabah. Jurnal
Ekonomi Bisnis Tahun 14 Nomor 2.
Putra, I.W.J.A. 2009. Pengaruh Kualitas Pelayanan terhadap kinerja dan Kerelasian
Nasabah. Jurnal Ekonomi Bisnis, 14(2), 151-
160.
Rafiq, Muhammad dan Aswi. 2015. Analisis
Dampak Penerapan Manajamen Mutu Iso
9001:2008 Terhadap Kualitas Pelayanan
Akademik Perguruan Tinggi Di Bandar
Lampung. Jurnal Bisnis Darmajaya, Vol.01.
No.02, Juli.
Rahman, Taufiqur. 2012. Paradoks Manajemen
Mutu = Standarisasi Pendidikan Di Indonesia. Vol.4. no.2.
Rakhmat, Jalaludin. (2008). Psikologi
Komunikasi (Edisi Revisi). Bandung: PT.
Remaja Rosdakarya.
Redmond, 2008. "Quality In Higher Education
:The Contributing of Edward Deming's
Principles". International Journal of
Educational Management. Vol 22. Issue : 5. PP
432-441
Resmini, Wayan. 2010. Pembinaan Kemampuan
Profesional Guru Melalui Kelompok Kerja Guru (KKG).GaneCSwara, Vol. 4, No. 1, hlm. 59-62.
Rinala I Nyoman, I Made Yudana, I Nyoman
Natajaya. 2013."Pengaruh Kualitas Pelayanan
Akademik Terhadap Kepuasan Dan Loyalitas
Mahasiswa Pada Sekolah Tinggi Pariwisata
Nusa Dua Bali”. E-Journal Program
Pascasarjana Universitas Pendidikan Ganesha.
Volume 4 Tahun 2013.
Salim, Syahrum. 2007. Metodologi Penelitian
Kuantitatif. Bandung, Cipta Pustaka Media.
Sallis, Edward. 2012. Total Quality Management In Education (alih bahasa Ahmad Ali Riyadi).
Jogjakarta :IRCiSoD.
Setiadi, Ign. Dadut. 2017. Hubungan
Interpersonal Communication Dalam
Implementasi TQM.Tribun Jateng 17 Mei 2017,
hal. 2.
Sinulingga, Sukaria. 2016. Metode Penelitian.
Edisi 3. Medan. USU Press.
Sopiatin, Popi. (2010). Manajemen Belajar
Berbasis Kepuasan Siswa. Cilegon: Ghalia
Indonesia.
Sugiyono. 2012. Metode Penelitian Kuantitatif Kualitatif dan R&D. Bandung : Alfabeta.
Sukardi. 2008. Metodologi Penelitian
Pendidikan : Kompetensi dan Praktiknya.
Jakarta.
Sungkono, Joko. 2013. Resampling Bootstrap
Pada R. Jurnal Magistra No. 84 Th. XXV. ISSN
0215-9511.
Henny Purnama Dewi et.al. Implementation of Total Quality Management and Interpersonal Communication in
Achieving Student Satisfaction through Service Quality at Yayasan Pendidikan Islam, Miftahussalam, Medan
International Journal of Research & Review (www.ijrrjournal.com) 129 Vol.6; Issue: 2; February 2019
Sutrisno, Edi. 2011. Manajemen Sumber Daya
Manusia. Jakarta: Kencana.
Syafaruddin. 2008. Efektivitas Kebijakan
Pendidikan. Jakarta: Rineka Cipta.
T. Wood, Julia. 2018. Komunikasi Interpersonal
Komunikasi Keseharian. Edisi Enam. Jakarta. Salemba Humanika.
Terziovski, M., dan Samson, D. 1999. "The Link
Between Total Quality Management Practice
and Organizational Performance". International
Journal of Quality & Reliability Management
16(3):hal. 1-11.
Tjiptono, Chandra, et al,. 2016. Service, Quality
dan Satisfaction. Yogyakarta : Andi offset.
Tjiptono, Fandy dan Diana Anastasia. 2009.
Total quality management. Yogyakarta: Gadjah
Mada University Press.
Tjiptono, Fandy dan Gregorious Chandra.
(2012). Pemasaran Strategik. Yogyakarta: Andi
Offset.
Tri, Hutomo dan Ratih Hendayani. 2015.
Implementasi Total Quality Management (TQM)
Dan Pengaruhnya Terhadap Kepuasan
Konsumen Dan Service Quality. ISSN : 2089 -
3477. Volume 4 No. 2.
Udiutomo, Purwa. (2011). Analisa Tingkat
Kepuasan Siswa Terhadap Layanan Program
Smart Ekselensia Indonesia Tahun 2011. Jurnal Pendidik Dompet Dhuafa (Edisi I). Halaman 7.
Umiarso dan Imam Gojali. 2010. Manajemen
Mutu Sekolah di Era Otonomi Pendidikan.
Jogjakarta: IRCiSoD.
Usman, Husaini. 2001. Peran Baru Administrasi
Pendidikan dari Sistem Sentralistik Menuju
Sistem Desentralistik. Jurnal Ilmu Pendidikan.
Jili8, No.1.
Usman, Husaini. 2013. Manajemen: Teori,
Praktik dan Riset Pendidikan, Penerbit Bumi
Aksara.
Usmara. 2003. Strategi Baru Manajemen
Pemasaran. Yogyakarta: Amoro Book.
Weningtyas dan Suseno. 2012. Pengaruh
Komunikasi Interpersonal Dan Kualitas
Pelayanan Terhadap Kepuasan Konsumen.
Jurnal Psikologika. Vol.17 No. 1
Wijaya, Toni. (2011). Manajemen Kualitas Jasa.
Jakarta: Indeks.
Wijaya, David. 2008. "Implementasi Manajemen
Mutu Terpadu Dalam Penyelenggaraan
Pendidikan di Sekolah". Jurnal Pendidikan -
No.10,Tahun ke-7, Juni 2008,
(http://bpkpenabur.or.id).
Wijaya, David. 2012. Pemasaran Jasa
Pendidikan. Penerbit Salemba Empat, Jakarta
Yudianto, Agus dan Juni Trisnowati. 2014.
"Pengaruh Kualitas Pelayanan Terhadap Kepuasan Siswa Di SMA Negeri Kerjo
Kabupaten Karanganyar". Jurnal Pendidikan.
Vol 12, No 2.
Yuniarti, Yenny. 2014. "Pengaruh Kualitas
Pelayanan terhadap Kepuasan Mahasiswa
Program Ekstensi Fakultas Ekonomi Universitas
Jambi". Trikonomika. Volume 13, No. 1, Juni
2014, Hal. 49–61 ISSN 1411-514X / ISSN
2355-7737.
Yuwono, Rendy. 2017, Pengaruh Penerapan
Total Quality Management dan Sistem Penghargaan Terhadap Peningkatan
Produktivitas. Jurnal Ilmu dan Riset Akuntansi.
Volume 6, no. 4.
Zahroh, Aminatul. 2014. Total Quality
Management: Teori dan Praktik Untuk
Mendongkrak Mutu Pendidikan. Ar-Buzz
Media.Yogyakarta.
******
How to cite this article: Dewi HP, Lumbanraja P, Matondang R. Implementation of total quality
management and interpersonal communication in achieving student satisfaction through service quality at
Yayasan Pendidikan Islam, Miftahussalam, Medan. International Journal of Research and Review. 2019;
6(2):111-129.