INTERNATIONAL JOURNAL OF PHARMACEUTICAL … 995.pdf · Preformulation study of paracetamol...
33
Research Article CODEN: IJPRNK ISSN: 2277-8713 Hemant Vyas, IJPRBS, 2015; Volume 4(3): 415-447 IJPRBS Available Online at www.ijprbs.com 415 AN OPTIMIZATION OF FOAM GRANULATION PROCESS FOR PREPARATION OF PARACETEMOL TABLETS AS MODEL DRUG HEMANT VYAS, B. P. NAGORI, R. ISHRANI, M. P. SINGH Dept of Pharmaceutics, Lachoo Memorial College of Science & Technology, Pharmacy Wing, Jodhpur, Rajasthan. Accepted Date: 23/06/2015; Published Date: 27/06/2015 Abstract: The aim of this study was to compare conventional wet granulation technique with novel foam granulation technique. In conventional wet granulation method the binder solution either sprayed or poured on the powder bed. This may cause of over wetting. The spraying of binder solution requires spray nozzles. Selection of spray nozzle, distance between nozzle and powder mix, binder solution spray rate are some critical factors which may cause of variations in granulation process. Recently an innovative technology for adding the binder to powder mix is under investigation. This novel technique involves addition of binder in the form of foam to the powder mix. The critical issue in the foam granulation is the quality of foam which is assessed based on- foam quality, foam stability, specific penetration time and nucleation ratio. In this dissertation work four semi synthetic cellulosic polymers (HPMC, HEC, HPC and sod. CMC) were used to generate the foam. The prepared foam batches were evaluated for foam quality, foam stability, specific penetration time and nucleation ratio. The preference was given to foam stability and foam quality for selection of foam batches. The 3% w/v HPMC, 4% w/v HEC, 3%w/v HPC and 1% sod. CMC batches were selected for preparation of granules and tablets. The prepared granules were evaluated for carr’s index, hausner’s ratio, angle of repose, moisture content, drying time and size distribution. The flow properties of granules of wet granulation batch, A, B, and C were excellent while the flow properties of batch D, E and F were good. The larger sized granules (1195 and >1680 μm) were prepared when wet granulation was used in comparison to foam granulation. This implies that more energy and time would be requiring reducing the size of larger granules. The foam granulation batches showed significantly less drying time and moisture content than the wet granulation batch. It means that the foam granulation method requires less processing time than wet granulation batch due to less drying time. The tablets were prepared using wet granulation and foam granulation methods. The optimized batch C was used for comparison. The tablets prepared using wet granulation and foam granulation were evaluated for weight variation, thickness, hardness, drug content, disintegration time and dissolution. The tablets prepared using both techniques showed acceptable characteristics. The tablets of both batches were subjected to accelerated stability testing. The tablets of both batches showed good stability. Keywords: Foam Granulation, Paracetemol, Model Drug INTERNATIONAL JOURNAL OF PHARMACEUTICAL RESEARCH AND BIO-SCIENCE PAPER-QR CODE Corresponding Author: MR. HEMANT VYAS Access Online On: www.ijprbs.com How to Cite This Article: Hemant Vyas, IJPRBS, 2015; Volume 4(3): 415-447
Transcript of INTERNATIONAL JOURNAL OF PHARMACEUTICAL … 995.pdf · Preformulation study of paracetamol...

Research Article CODEN: IJPRNK ISSN: 2277-8713 Hemant Vyas, IJPRBS, 2015; Volume 4(3): 415-447 IJPRBS
Available Online at www.ijprbs.com 415
AN OPTIMIZATION OF FOAM GRANULATION PROCESS FOR PREPARATION OF PARACETEMOL TABLETS AS MODEL DRUG
HEMANT VYAS, B. P. NAGORI, R. ISHRANI, M. P. SINGH
Dept of Pharmaceutics, Lachoo Memorial College of Science & Technology, Pharmacy Wing, Jodhpur, Rajasthan.
Accepted Date: 23/06/2015; Published Date: 27/06/2015
Abstract: The aim of this study was to compare conventional wet granulation technique with novel foam granulation technique. In conventional wet granulation method the binder solution either sprayed or poured on the powder bed. This may cause of over wetting. The spraying of binder solution requires spray nozzles. Selection of spray nozzle, distance between nozzle and powder mix, binder solution spray rate are some critical factors which may cause of variations in granulation process. Recently an innovative technology for adding the binder to powder mix is under investigation. This novel technique involves addition of binder in the form of foam to the powder mix. The critical issue in the foam granulation is the quality of foam which is assessed based on- foam quality, foam stability, specific penetration time and nucleation ratio. In this dissertation work four semi synthetic cellulosic polymers (HPMC, HEC, HPC and sod. CMC) were used to generate the foam. The prepared foam batches were evaluated for foam quality, foam stability, specific penetration time and nucleation ratio. The preference was given to foam stability and foam quality for selection of foam batches. The 3% w/v HPMC, 4% w/v HEC, 3%w/v HPC and 1% sod. CMC batches were selected for preparation of granules and tablets. The prepared granules were evaluated for carr’s index, hausner’s ratio, angle of repose, moisture content, drying time and size distribution. The flow properties of granules of wet granulation batch, A, B, and C were excellent while the flow properties of batch D, E and F were good. The larger sized granules (1195 and >1680 µm) were prepared when wet granulation was used in comparison to foam granulation. This implies that more energy and time would be requiring reducing the size of larger granules. The foam granulation batches showed significantly less drying time and moisture content than the wet granulation batch. It means that the foam granulation method requires less processing time than wet granulation batch due to less drying time. The tablets were prepared using wet granulation and foam granulation methods. The optimized batch C was used for comparison. The tablets prepared using wet granulation and foam granulation were evaluated for weight variation, thickness, hardness, drug content, disintegration time and dissolution. The tablets prepared using both techniques showed acceptable characteristics. The tablets of both batches were subjected to accelerated stability testing. The tablets of both batches showed good stability.
Keywords: Foam Granulation, Paracetemol, Model Drug
INTERNATIONAL JOURNAL OF
PHARMACEUTICAL RESEARCH AND BIO-SCIENCE
PAPER-QR CODE
Corresponding Author: MR. HEMANT VYAS
Access Online On:
www.ijprbs.com
How to Cite This Article:
Hemant Vyas, IJPRBS, 2015; Volume 4(3): 415-447
Research Article CODEN: IJPRNK ISSN: 2277-8713 Hemant Vyas, IJPRBS, 2015; Volume 4(3): 415-447 IJPRBS
Available Online at www.ijprbs.com 416
INTRODUCTION
Granulation
Granulation is a vital unit operation in the production of pharmaceutical oral dosage forms.
Granulation is a particle design process that involves collecting of particles together by creating
bonds between them. Bonds are formed by compression or by using a binding agent1.
Granulation techniques
Several granulation techniques have been developed which include:
A. Conventional methods
i. Dry granulation
ii. Wet granulation
a. High-shear wet granulation
b. Low-shear wet granulation
B. Novel/advanced methods
i Moisture activated dry granulation
ii Thermal adhesion granulation
iii Pneumatic dry granulation
iv Melt/thermoplastic granulation
v Fluidized bed granulation
vi Extrusion - Spheronization granulation
vii Spray drying granulation
viii Freeze granulation
ix Steam granulation
x Foam binder granulation
Research Article CODEN: IJPRNK ISSN: 2277-8713 Hemant Vyas, IJPRBS, 2015; Volume 4(3): 415-447 IJPRBS
Available Online at www.ijprbs.com 417
MATERIALS
Detail of drug (paracetamol)
Drug Name Supp. /Mfg. By Batch No. Mfg. Date Exp. Date
Paracetamol Workhardt Research Centtre, Aurangabad
1000369 Nov 2011 Oct 2015
Chemicals / Reagents used
All the chemicals used were of IP/AR or equivalent grade.
S. No. Name Manufacturer/Supplier
1. Potassium di hydrogen phosphate
Loba Chemie Pvt. Ltd., Mumbai
2. Sodium hydroxide Loba Chemie Pvt. Ltd.,Mumbai
3 HPMC E15 plv Qualigens Fine Chemicals Pvt. Ltd., Mumbai
4. HEC S.D. Fine Chemical Ltd., Mumbai
5. Sod. CMC Ases Chemical Works, Jodhpur
6 HPC Workhardt Research Centtre, Aurangabad
7. Microcrystalline cellulose Qualigens Fine Chemicals Pvt. Ltd., Mumbai
8. Sodium lauryal sulphate S.D. Fine Chemical Ltd., Mumbai
9. Lactose S.D. Fine Chemical Ltd., Mumbai
10 Deionised water In house laboratory.
Preformulation study of paracetamol
Solubility determination
Solubility was determined by using shake flask method. In this paracetamol was added in
surplus to medium phosphate buffer pH 6.8 and shaken for 6 hrs. The saturation was confirmed
by observation of the presence of un-dissolved paracetamol. After filtration of the slurry a

Research Article CODEN: IJPRNK ISSN: 2277-8713 Hemant Vyas, IJPRBS, 2015; Volume 4(3): 415-447 IJPRBS
Available Online at www.ijprbs.com 418
sample for analysis was taken. Sample was analyzed by using U.V. spectrophotometer. The
solubility of paracetamol is shown in Table-3.
Table-3 Solubility of paracetamol
Medium/Solvent Solubility
(mg/ml)
Volume of the medium required to dissolve single dose (200mg)
of paracetamol
(ml)
Parts of solvent required for 1 part of paracetamol
Phosphate buffer PH 6.8
42.6 4.68 23.47
RESULTS AND DISCUSSION
Solubility is determined for selection of appropriate solvent for formulation development, for
selection of dissolution medium having acidic or alkaline pH or for extraction of drug for drug
content estimation. Solubility of paracetamol was determined in phosphate buffer pH 6.8 and it
was found that volume of phosphate buffer pH 6.8 required to dissolve the dose of
paracetamol in one tablet is 4.68ml. This implies that phosphate buffer pH 6.8 can very well be
used as dissolution medium and also for drug content determination. Further as per Indian
Pharmacopoeia, paracetamol was found to be- soluble i.e. 1 part of paracetamol dissolved in
10-100ml parts (23.47 parts) of solvent (Appendix Table-A1).
5.1.2. Melting point
Melting point of paracetamol was carried out by capillary method using the melting point
apparatus. The observed and reported melting point of paracetamol are given below in Table-4
Table-4 Melting point of paracetamol
Drug Name Reported melting point
(ºC)
Observed melting point (ºC)
Paracetamol 170 C 168C
Research Article CODEN: IJPRNK ISSN: 2277-8713 Hemant Vyas, IJPRBS, 2015; Volume 4(3): 415-447 IJPRBS
Available Online at www.ijprbs.com 419
RESULTS AND DISCUSSION
Melting point determination is used to assess purity of drug sample. As the observed melting
point of paracetamol is found to be 2oC less than the reported melting point, so it can be
concluded that drug sample contains some impurities.
5.1.3. Preparation of standard curve of paracetamol
a. Determination of wavelength of maximum absorbance for paracetamol
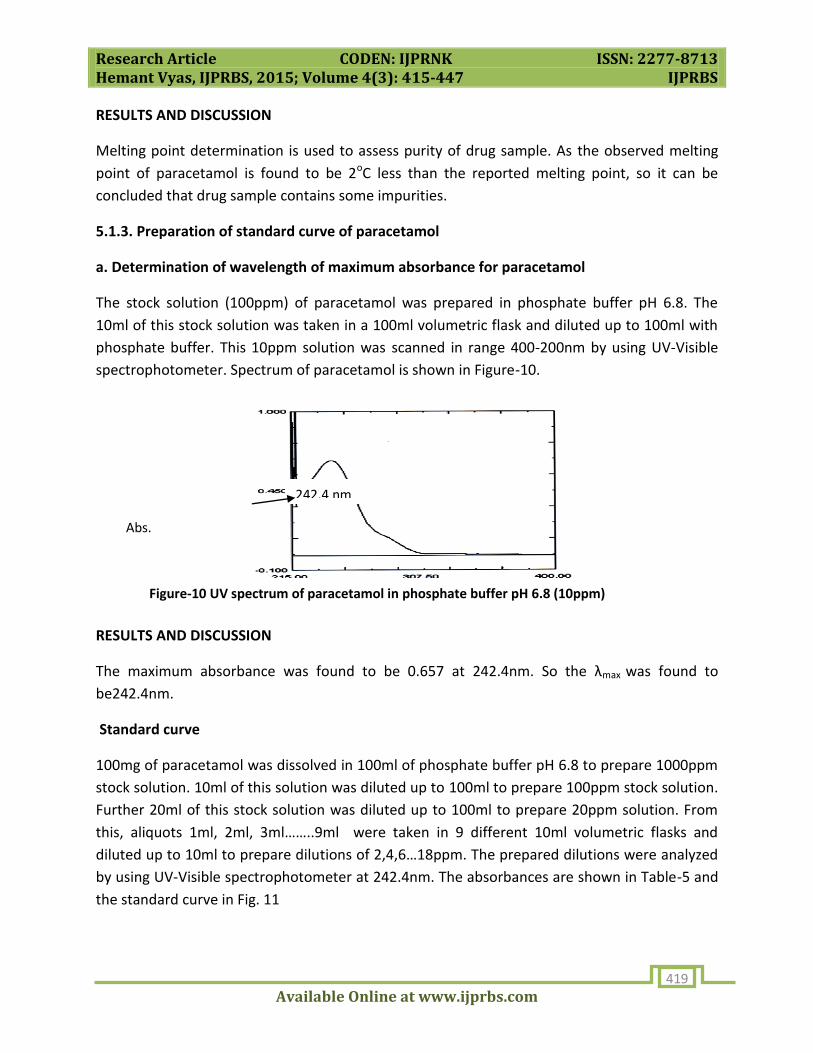
The stock solution (100ppm) of paracetamol was prepared in phosphate buffer pH 6.8. The
10ml of this stock solution was taken in a 100ml volumetric flask and diluted up to 100ml with
phosphate buffer. This 10ppm solution was scanned in range 400-200nm by using UV-Visible
spectrophotometer. Spectrum of paracetamol is shown in Figure-10.
RESULTS AND DISCUSSION
The maximum absorbance was found to be 0.657 at 242.4nm. So the λmax was found to
be242.4nm.
Standard curve
100mg of paracetamol was dissolved in 100ml of phosphate buffer pH 6.8 to prepare 1000ppm
stock solution. 10ml of this solution was diluted up to 100ml to prepare 100ppm stock solution.
Further 20ml of this stock solution was diluted up to 100ml to prepare 20ppm solution. From
this, aliquots 1ml, 2ml, 3ml……..9ml were taken in 9 different 10ml volumetric flasks and
diluted up to 10ml to prepare dilutions of 2,4,6…18ppm. The prepared dilutions were analyzed
by using UV-Visible spectrophotometer at 242.4nm. The absorbances are shown in Table-5 and
the standard curve in Fig. 11
Abs.
Figure-10 UV spectrum of paracetamol in phosphate buffer pH 6.8 (10ppm)
242.4 nm

Research Article CODEN: IJPRNK ISSN: 2277-8713 Hemant Vyas, IJPRBS, 2015; Volume 4(3): 415-447 IJPRBS
Available Online at www.ijprbs.com 420
Table-5 Data for standard curve of paracetamol in phosphate buffer pH 6.8
S. no. Concentration (µg/ml)
Absorbance
A1 A2 A3 Absorbance
1. 2 0.138 0.1378 0.1378 0.1379
2. 4 0.2491 0.2492 0.2493 0.2492
3. 6 0.3876 0.3877 0.3875 0.3876
4. 8 0.5073 0.5071 0.5071 0.5072
5. 10 0.634 0.6343 0.6342 0.6342
6. 12 0.7527 0.753 0.7532 0.753
7. 14 0.8776 0.8767 0.8764 0.8769
8. 16 0.9983 0.9982 0.9981 0.9982
9. 18 1.1283 1.1285 1.1277 1.1282
Figure-11 Standard curve of paracetamol in phosphate buffer pH 6.8
RESULT AND DISCUSSION
The calibration curve of drug showed linearity in concentration range of 2-18µg/ml, since the
regression co-efficient (r2) was 0.999 and the equation in terms of, y= mx + c
Absorbance = slope * concentration + intercept
Was, y = 0.062x + 0.008
0
0.2
0.4
0.6
0.8
1
1.2
0 5 10 15 20
Concentration of Paracetamol (µg/ml)
Ab
s.

Research Article CODEN: IJPRNK ISSN: 2277-8713 Hemant Vyas, IJPRBS, 2015; Volume 4(3): 415-447 IJPRBS
Available Online at www.ijprbs.com 421
∴ Concentration = (Absorbance) – 0.008 / 0.062
(At λmax = 242.4 nm)
5.2 Generation of foam and its optimization
5.2.1 Foam generation process
Foam was prepared by using Silverson mixer. 100ml of distilled water was taken in a 250ml of
beaker, and 1gm of sodium lauryl sulphate was added. The mixer was operated at medium
speeds for five minutes after that the stabilizer (HPMC/ HEC/ HPC/ sod. CMC), in different
amount was (1%/2%/3%/4%) added. The mixer was further operated for 25 minutes. The
prepared foam batches with different polymers are shown in Table-6.
Table-6 Foam batches prepared with different polymers
P o l y m e r s (% w/w)
Batches
A B C D A 1 A 2 A 3 A 4 B 1 B 2 B 3 B 4 C 1 C 2 C 3 C 4 D 1 D 2 D 3 D 4
HEC 1 2 3 4 _ _ _ _ _ _ _ _ _ _ _ _ HPMC _ _ _ _ 1 2 3 4 _ _ _ _ _ _ _ _ HPC _ _ _ _ _ _ _ _ 1 2 3 4 _ _ _ _ Sod. CMC _ _ _ _ _ _ _ _ _ _ _ _ 1 2 3 4 Sodium lauryl sulphate
1 1 1 1 1 1 1 1 1 1 1 1 1 1 1 1
Water(qs) 100 ml for each batch
5.2.2. Evaluation of foam batches
i. Foam stability
The foam stability was studied by filling the foam in a 10ml measuring cylinder. The water
drained at different time periods was determined. The stability profile of foam is shown in
Table-7. The water drained at different time intervals for 3% HPMC batch is depicted in Figure-
12.

Research Article CODEN: IJPRNK ISSN: 2277-8713 Hemant Vyas, IJPRBS, 2015; Volume 4(3): 415-447 IJPRBS
Available Online at www.ijprbs.com 422
Table-7 Stability profile of foam batches
Batches Volume of drained water at different time intervals (ml)
5 min. 15min. 25min. 35min. 45min.
HPMC 1% 0.4 0.5 0.5 0.6 0.6
2% 0.1 0.3 0.5 0.5 0.5 3% 0.0 0.3 0.5 0.7 0.8 4% 0.0 0.1 0.2 0.4 0.5
HEC 1% 0.1 0.1 0.1 0.1 0.1 2% 0.2 0.5 0.5 0.5 0.6 3% 0.2 0.5 0.5 0.6 0.6 4% 0.2 0.8 1.1 1.2 1.3
HPC 1% 0.3 0.4 0.5 0.5 0.5 2% 0.3 0.3 0.4 0.4 0.4 3% 0.8 0.9 0.9 0.9 0.9 4% 0.5 0.7 0.8 0.8 0.8
Sod. CMC 1% 0.3 0.8 1.1 1.2 1.2 2% 0.0 0.1 0.2 0.3 0.4 3% 0.0 0.2 0.4 0.7 1.0 4% 0.0 0.0 0.0 0.0 0.1
Initial (0.0 ml) After 1 hr (8 ml) After 1:30 hr (10 ml)
Figure-12 Photograph depicting stability of foam (HPMC 3%w/v)

Research Article CODEN: IJPRNK ISSN: 2277-8713 Hemant Vyas, IJPRBS, 2015; Volume 4(3): 415-447 IJPRBS
Available Online at www.ijprbs.com 423
RESULTS AND DISCUSSION
The stability of foam is important during the transfer of foam from foam generator though a
pipe to the high shear granulator so the foam of good stability should be selected for this
purpose.
HPMC batches: Foam prepared using 4% HPMC showed the maximum stability while foam
prepared using 1% HPMC showed minimum stability.
HEC batches: Foam prepared using 1% HEC formed dry foam. Foam prepared using 2% HEC
formed the most stable foam while foam prepared using 4% HEC formed the least stable foams.
These foam released very high volume of liquid so can be used for granulation easily.
HPC batches: Foam prepared using 2% HPC formed the most stable foam while foam prepared
using 3% HPC formed the foam of least stability.
Sodium CMC batches: Foam prepared using 4% Sod. CMC formed the most stable foam while
foam prepared using 1% Sodium CMC formed the least stable foam.
ii. . Foam quality
The foam quality was determined by using modified Tan and Hapgood method. The 10ml of
foam was filled in a 50ml measuring cylinder. After 10 minutes the volume of drained water
was noted and the foam quality was determined by using following formula-
Vg
FQ =
Vg + VL
Where-
FQ = foam quality
Vg = volume of air
VL = volume of liquid drained

Research Article CODEN: IJPRNK ISSN: 2277-8713 Hemant Vyas, IJPRBS, 2015; Volume 4(3): 415-447 IJPRBS
Available Online at www.ijprbs.com 424
The foams of different quality are shown in Figure-13.
Foam of 88% quality Foam of 93% quality Foam of 95% quality
Figure-13 Photograph depicting foams of different quality
iii. Nucleation ratio
1gm foam was weighed in a Petridish; 1gm of lactose was weighed in a 100ml beaker. The foam
was added in small increments to the lactose powder until a wet mass was formed. The
Petridish was weighed again; the difference in initial and final weight was taken to determine
the used amount of foam.
Nucleation ratio= 1000mg of lactose/amount of foam used in mg
The nucleation of lactose is depicted in Figure-14
Figure-14 Nucleation during foam granulation
iii. Specific penetration time
Lactose was filled in a 10ml measuring cylinder up to 2ml by tapping the measuring cylinder
until there was no further change in volume. 1ml foam was filled in the same measuring
cylinder. The time required for the foam to penetrate the lactose bed up to 0.6ml was noted.
The foam quality, nucleation ratio, and specific penetration time are shown in Table-8

Research Article CODEN: IJPRNK ISSN: 2277-8713 Hemant Vyas, IJPRBS, 2015; Volume 4(3): 415-447 IJPRBS
Available Online at www.ijprbs.com 425
Table 8: Foam quality, nucleation ratio and specific penetration time of different foam
batches
*Data indicates mean± SD of triplicate data
RESULTS AND DISCUSSION
All the evaluation parameters (Table-8) were considered for selection of foam of optimum
performance. The priority was given to the stability data followed by % quality, nucleation ratio
and the specific penetration time. The foam stability was studied up to a period of 1 hr 30 min.
and the volume of binder solution drained at 45min.was taken as prime criteria for the
selection of the foam batch. The higher the volume drained by foam of appropriate quality
Parameters Batches
Foam Quality* (%)
Nucleation ratio*
Specific penetration time* (sec.)
Volume drained at 45 min. (ml)
HPMC 1% 96.0±0.20 4.098±0.01 300±5.00 0.6 2% 90.0±0.78 3.55±0.08 600±4.00 0.5 3% 95.7±0.71 2.46±0.05 72±8.00 0.8 4% 99.0±0.45 3.086±0.03 1500±12.00 0.5
HEC 1% 93.0±0.39 3.703±0.07 300±7.00 0.1 2% 95.0±0.37 4.184±0.11 516±11.00 0.6
3% 88.0±0.85 4.273±0.15 630±10.00 0.6 4% 88.0±0.54 4.854±0.12 506±4.00 1.3
Parameters Batches
Foam Quality* (%)
Nucleation ratio*
Specific penetration time* (sec.)
Volume drained at 45 min. (ml)
HPC 1% 92.0±0.65 3.184±0.09 68±4.00 0.5 2% 88.0±0.51 4.166±0.11 45±2.00 0.4 3% 93.0±0.29 3.412±0.13 50±3.00 0.9 4% 87.0±0.73 3.759±0.02 65±2.00 0.8
Sod. CMC 1% 86.0±0.24 4.580±0.04 55±5.00 1.2 2% 99.0±0.56 5.290±0.02 675±14.00 0.4 3% The 3% and 4% concentration did not form the foam.
4%

Research Article CODEN: IJPRNK ISSN: 2277-8713 Hemant Vyas, IJPRBS, 2015; Volume 4(3): 415-447 IJPRBS
Available Online at www.ijprbs.com 426
better is foam performance. Based on these four parameters the four foam batches were
optimized.
HPMC batches: Foam prepared using 3% HPMC resulted in maximum drained volume at 45min.
and the % quality of 95.7%.
HEC batches: Foam prepared using 4% HEC had 88% foam quality and 1.3ml drained volume at
45min.
HPC batches: Foam prepared using 3% HPC had 93% foam quality and 0.9ml drained volume at
45min.
Sod. CMC batches: Foam prepared using 1% Sod. CMC had 86% foam quality and 1.2ml drained
volume at 45min.
5.3. Preparation of paracetamol granules using foam granulation and wet granulation
techniques
The formulation composition used for preparation of paracetamol granules is presented in
Table-9
Table-9 Formulation composition of paracetamol tablets using wet and foam granulation
methods
Batch
Material
Wet A B C D E F
Paracetamol 80% 80% 80% 80% 80% 80% 80%
MCC 17% 17% 17% 17% 17% 17% 17%
HPMC (powder form)
3% 2% 2% - - - -
Lactose - 1% 1% 3% 3% 3% 3%
Water 6ml* - 5.4ml* - - - -
1% HPMC foam - 18ml* 1%w/w - - - -
3% HPMC foam - - - 15ml* - - -
4% HEC foam - - - - 14ml* - -

Research Article CODEN: IJPRNK ISSN: 2277-8713 Hemant Vyas, IJPRBS, 2015; Volume 4(3): 415-447 IJPRBS
Available Online at www.ijprbs.com 427
3% HPC foam - - - - - 21ml* -
1% Sod. CMC foam
- - - - - - 13ml*
* The volume of water/ foam used for granulation
5.3.1. Wet granulation process
All the ingredients were weighed accurately and transferred to the mortar. All the ingredients
were mixed by triturating. The water was added in small amounts to make the powder blend
wet. The wet mass was then passed through 10 mesh sieve to make granules. These granules
were dried at 600C. The dried granules were size reduced and passed through 22 mesh sieve to
achieve uniform size distribution.
5.3.2. Foam granulation process
Six foam granulation batches were prepared. Step batch method was used for the addition of
foam to the powder blend. In this method the foam in small amounts was added and the
granulation end point was observed visually for proper wetness. In the batch “A”, 2% HPMC
was added in dry form and then the foam of 1% HPMC was used to granulate the powder
blend. In batch “B”, 2% HPMC was added as dry form and then 1% HPMC foam was added and
then the water was used to granulate the blend. In batch “C”, 3% HPMC foam was used to
granulate the powder blend. In batch “D”, 4% HEC foam was used to granulate the powder
blend. In batch “E”, 3% HPC foam was used to granulate the powder blend. In batch “F”, 1%
Sod. CMC was used to granulate the powder blend.
5.4. Characterization of prepared paracetamol granules
5.4.1. Moisture content and drying time
The granules were weighed before drying, and then kept for drying in the hot air oven at 600C
for 30 minutes. After that the granules were weighed again. The difference between the initial
and final weights was taken to determine the moisture content. The drying time was also
determined. The moisture content and drying time are shown in Table-10

Research Article CODEN: IJPRNK ISSN: 2277-8713 Hemant Vyas, IJPRBS, 2015; Volume 4(3): 415-447 IJPRBS
Available Online at www.ijprbs.com 428
Table-10 Drying time and moisture content of prepared paracetamol granules
Batch Moisture content (%) Drying time (sec.)
Wet granulation 23.79 540 A 23.28 480 B 23.27 450 C 21.46 450 D 18.99 491 E 27.49 563 F 22.95 443
RESULT AND DISCUSSION
Moisture content: Batch “A” had 2.14% less moisture content than the wet granulation batch.
Batch “B”, “C”, “D”, and “F” had 2.18%, 9.79%, 20.17% and 3.53% less moisture content than
wet granulation batch respectively. Batch “E” had 15.55% more moisture content than the wet
granulation batch. The data for moisture content of granules prepared using wet granulation
and foam granulation (batch C) was analyzed using student’s-t-test. The granules prepared
using foam granulation were found to have significantly less (p≤0.05; df= 2; tstat = 82.37; tcrit
=2.92) moisture content than the granules prepared using wet granulation method (Fig. 15)
* Significantly (p≤0.05) less moisture content
Fig.-15 Comparative effect of method of granulation on moisture content
Drying time: Batch “A”, “B”, “C”, “D” and “F” required 11.11%, 16.66%, 16.66%, 9.07%, and
17.96% less drying time than the wet granulation batch. Batch “E” required 4.26% more drying
time than the wet granulation batch. The data for drying time of granules prepared using wet
granulation and foam granulation method was analyzed using student-t-test and there was a
significant (p≤0.05; tstat=63.64; tcrit=2.92) decrease in drying time for granules prepared using
foam granulation method (Fig. 16).
20
21
22
23
24
Wet Foam
Mois
ture
conte
nt
(%)
Method of granulation
*

Research Article CODEN: IJPRNK ISSN: 2277-8713 Hemant Vyas, IJPRBS, 2015; Volume 4(3): 415-447 IJPRBS
Available Online at www.ijprbs.com 429
* Significantly (p≤0.05) less drying time
Fig.-16 Comparative effect of method of granulation on drying time
5.4.2. Granule size distribution
The granules were passed through 10, 22, 30, 44, 60, 80 and 100 mesh sieves before sizing. The
granules retained on each sieve were weighed. A graph was plotted between the %w/w and
size in µm. The particle size distribution before and after sizing for the different batches is given
in Table-11 and 12 respectively and depicted graphically in Fig. 17 and 18 respectively.
Table-11 Granule size distribution before sizing
Mean mesh size(µm)
%w/w retained on each size range
wet A B C D E F 137.50 0.0 0.0 0.0 0.0 0.0 0.0 0.0 166 0.21 1.23 2.23 3.32 3.74 4.34 5.92 215.5 0.68 2.17 4.18 6.28 1.52 2.73 0.31 302.5 0.79 5.46 9.19 9.80 4.83 5.19 5.09 427 5.34 8.89 14.27 13.45 7.57 8.35 5.61 605 7.24 9.47 11.87 11.78 7.33 14.38 7.78 1195 70.75 66.80 56.08 52.69 68.15 60.19 65.96 1840 14.99 5.98 2.18 2.68 6.82 4.77 9.30 2000 0.0 0.0 0.0 0.0 0.0 0.0 0.0
Figure-17 Granule weight size distribution (before sizing)
400
450
500
550
Wet Foam
Dry
ing
tim
e (
sec.)
*
Method of granulation
-50
0
50
100
0 500 1000 1500 2000 2500
wet
A
B
C
Granule size (µm)
Dis
trib
uti
on(%
w/w
)
Research Article CODEN: IJPRNK ISSN: 2277-8713 Hemant Vyas, IJPRBS, 2015; Volume 4(3): 415-447 IJPRBS
Available Online at www.ijprbs.com 430
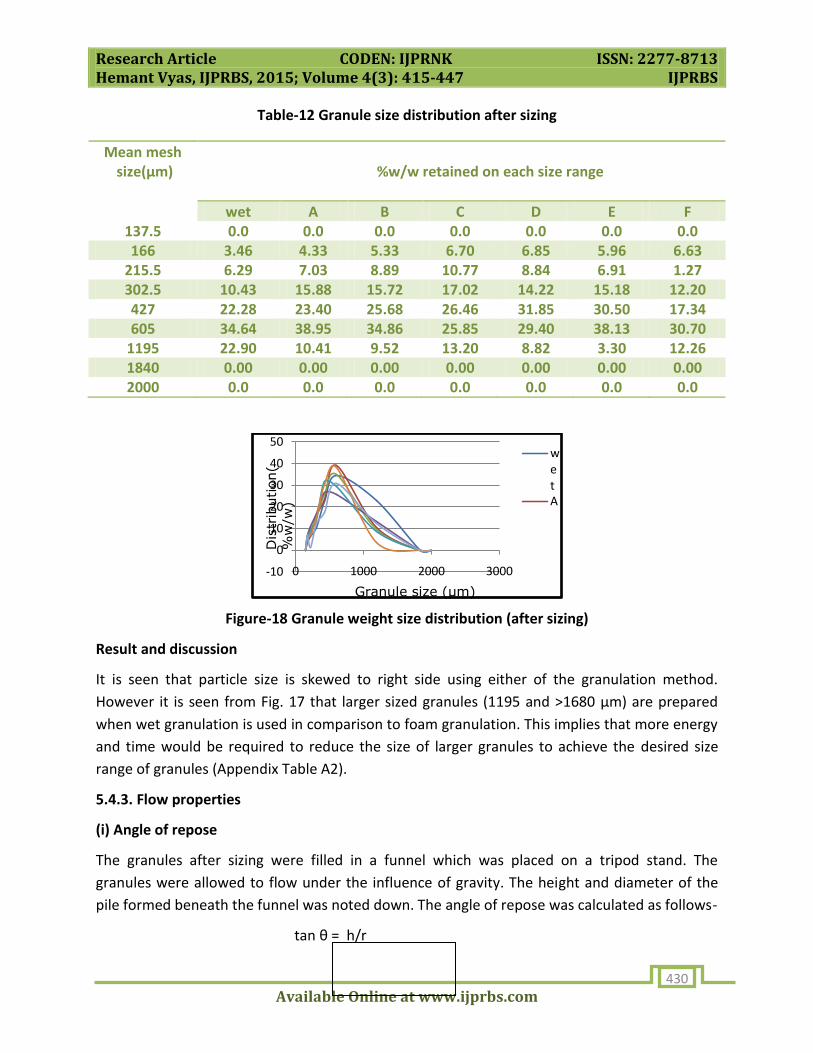
Table-12 Granule size distribution after sizing
Mean mesh size(µm)
%w/w retained on each size range
wet A B C D E F 137.5 0.0 0.0 0.0 0.0 0.0 0.0 0.0 166 3.46 4.33 5.33 6.70 6.85 5.96 6.63
215.5 6.29 7.03 8.89 10.77 8.84 6.91 1.27 302.5 10.43 15.88 15.72 17.02 14.22 15.18 12.20 427 22.28 23.40 25.68 26.46 31.85 30.50 17.34 605 34.64 38.95 34.86 25.85 29.40 38.13 30.70
1195 22.90 10.41 9.52 13.20 8.82 3.30 12.26 1840 0.00 0.00 0.00 0.00 0.00 0.00 0.00 2000 0.0 0.0 0.0 0.0 0.0 0.0 0.0
Figure-18 Granule weight size distribution (after sizing)
Result and discussion
It is seen that particle size is skewed to right side using either of the granulation method.
However it is seen from Fig. 17 that larger sized granules (1195 and >1680 µm) are prepared
when wet granulation is used in comparison to foam granulation. This implies that more energy
and time would be required to reduce the size of larger granules to achieve the desired size
range of granules (Appendix Table A2).
5.4.3. Flow properties
(i) Angle of repose
The granules after sizing were filled in a funnel which was placed on a tripod stand. The
granules were allowed to flow under the influence of gravity. The height and diameter of the
pile formed beneath the funnel was noted down. The angle of repose was calculated as follows-
tan θ = h/r
-10
0
10
20
30
40
50
0 1000 2000 3000
wetA
Dis
trib
ution(
%w
/w)
Granule size (µm)

Research Article CODEN: IJPRNK ISSN: 2277-8713 Hemant Vyas, IJPRBS, 2015; Volume 4(3): 415-447 IJPRBS
Available Online at www.ijprbs.com 431
θ = tan-1 h/r
Where-
h = height of pile in cm.
r = radius of the base of pile
(ii) Carr’s index (compressibility)
The granules of each batch were weighed and filled in a 50ml measuring cylinder. The volume
was noted down to determine bulk density.
The measuring cylinder was tapped 100 times by using tapped density apparatus. After 100
tapings the volume was again noted down to determine the tapped density. The
compressibility can be determined by using following formula-
Tapped density – Bulk density
Carr’s index = x 100
Tapped density
(iii) Hausner’s ratio
The Hausner’s ratioo was determined by using following formula-
Hausner’s ratio = Tapped density / Bulk density
The flow property parameters are shown in Table-13.
Table-13 Flow properties of prepared paracetamol granules
Factors Batch
Angle of repose* (%)
Carr’s index* (%) Hausner’s ratio
Wet 11.12±0.32 5.87±0.21 1.06±0.03 A 18.97±0.32 9.52±0.27 1.11±0.02 B 17.08±0.33 6.65±0.39 1.07±0.04 C 17.83±0.24 9.37±0.11 1.10±0.04 D 19.27±0.14 17.38±0.21 1.21±0.01 E 23.78±0.23 10.72±0.13 1.12±0.02 F 23.02±0.29 22.23±0.19 1.28±0.03
* Data indicates mean ± SD of triplicate determination
Results and discussion
The angle of repose varied from 11.120 to 23.780, the Carr’s index varied from 5.87 to 22.23 and
the Hausner’s ratio varied from 1.06 to 1.28. It was found that the flow properties of prepared

Research Article CODEN: IJPRNK ISSN: 2277-8713 Hemant Vyas, IJPRBS, 2015; Volume 4(3): 415-447 IJPRBS
Available Online at www.ijprbs.com 432
granules of Wet granulation batch, and batch “A”, “B”, “C”, were excellent while the flow
properties of batch “D”, “E”, and “F” were good (Appendix Table-A3-A5).
5.5. Preparation of paracetamol tablets and their evaluation
Preparation of paracetamol tablet batches
Seven tablet batches were prepared designated as wet granulation, A, B, C, D, E, and F. The
prepared granules using wet granulation and foam granulation methods were compressed
using tablet press. The prepared tablet batches were evaluated against the following
parameters.
5.5.1. Weight variation
Twenty tablets from each batch were selected and weighed individually. The average weight
was determined, and checked for criteria that no tablet deviates by more than 5% of average
tablet weight. The evaluation of weight variation test is shown in Table-14.
Table 14: Weight variation of prepared paracetamol tablets
Batch Avg. wt.*(gm)
Wet 249.1±4.5 A 248.2±3.7 B 249.4±4.1 C 247.6±3.2 D 248.8±5.2 E 246.3±4.8 F 249.8±5.2
* Data indicates mean ± SD of twenty tablets
RESULT AND DISCUSSION
The tablets weighing ≥250mg have the limit of ± 5% variation according to IP 2010. The tablets
evaluated showed the weight variation within limit, and had RSD of less than of 6% and thus
passed the test (Appendix table A6).
5.5.2. Drug content
20 tablets were weighed and powdered. The powder equivalent to 200mg of paracetamol was
taken in a 250ml volumetric flask. 50ml of 0.1M NaOH was added. 100ml of distilled water was
added in this and shaken for 15 min. The above solution was diluted up to 200ml. 10ml of this
stock solution was taken in a 100ml volumetric flask and diluted with distilled water up to
100ml. 10ml from this solution was taken in a 100ml volumetric flask. In this the 10ml of 0.1M
NaOH was added, and then diluted up to 100ml with distilled water.

Research Article CODEN: IJPRNK ISSN: 2277-8713 Hemant Vyas, IJPRBS, 2015; Volume 4(3): 415-447 IJPRBS
Available Online at www.ijprbs.com 433
The absorbance of this final solution was taken by using UV-Visible spectrophotometer at
257nm. The absorptivity (ε) was used 715. The drug content is presented in Table-15
Table 15: Drug Content of prepared paracetamol tablets
Batch Drug content*(%)
Wet granulation 102±0.76 A 99.61±0.71 B 101.48±0.62 C 97.81±0.42 D 96.24±0.57 E 98.67±0.86 F 99.78±0.92
* Data indicates mean ± SD of triplicate determination
RESULT AND DISCUSSION
The drug content of the all the selected formulations were found to be within the limits (±15%)
i.e 85-115% as per IP 2010.
5.5.3. Disintegration
The disintegration time of tablets (n = 6) was determined using disintegration test
apparatus in distilled water maintained at 37 ± 0.5 ºC. The All tablets were checked for criteria
that not any tablet should disintegrate within 15 min. The disintegration time of different
batches is shown in Table-16.
Table 16: Disintegration time of prepared paracetamol tablets
Batch Disintegration Time (min.)*
Wet granulation 27.0±1.29 A 28.0±1.98 B 28.0±2.36 C 28.0±1.16 D 26.0±1.25 E 29.0±2.49 F 27.0±1.47
*Data represent mean ± SD, n=6
RESULTS AND DISCUSSION
The disintegration time was studied by using disintegration apparatus (VEEGO-VDT-DV), the
disintegration time varied from 26 to 29 min. so none of the batches comply with the limit
specified in IP 2010.

Research Article CODEN: IJPRNK ISSN: 2277-8713 Hemant Vyas, IJPRBS, 2015; Volume 4(3): 415-447 IJPRBS
Available Online at www.ijprbs.com 434
5.5.4. Hardness and friability:
Friability of tablets (n =6) was determined by using a Roche friabilator. Hardness tester was
used to determine the hardness of tablet. The friability and hardness data are shown in Table-
17 and 18 respectively.
Table 17: Hardness of prepared paracetamol tablets
Batch Hardness (kg/cm2)*
Wet 4.6±0.4 A 4.5±0.4 B 4.5±0.2 C 4.5±0.6 D 4.5±0.8 E 4.4±0.4 F 4.6±0.4
*Data represent mean ± SD, n=6
RESULT AND DISCUSSION
The Hardness varied from 4.5 to 4.6 Kg/cm2. The hardness of all the tablet batches was found to
be within the specified limit (≤5Kg/cm2).
Table 18: Friability of prepared paracetamol tablets
Batch % Friability
Wet granulation 0.60 A 0.54 B 0.73 C 0.73 D 0.82 E 0.78 F 0.69
RESULT AND DISCUSSION
The %friability varied from 0.54 to 0.82. The %friability for all tablet batches was found to be
within the specified limit (≤1%).
5.5.5. Thickness
The thickness was measured by using the vernier calipers. The thickness was measured by
taking 6 readings of each tablet and then the average value was taken. The thickness data are
shown in Table-19.

Research Article CODEN: IJPRNK ISSN: 2277-8713 Hemant Vyas, IJPRBS, 2015; Volume 4(3): 415-447 IJPRBS
Available Online at www.ijprbs.com 435
Table 19: Thickness of prepared paracetamol tablets
Batch Thickness (cm.)*
Wet 0.35±0.1 A 0.35±0.2 B 0.36±0.1 C 0.36±0.2 D O.35±0.2 E 0.34±0.1 F 0.36±0.1
*Data represent mean ± SD, n=6
RESULT AND DISCUSSION
The thickness varied from 0.35 to 0.36 cm.
5.5.6. Dissolution
The dissolution study was performed by using USP type II dissolution apparatus. The
temperature was maintained at 37±20C. The speed of the paddles was kept at 50 rpm. The
dissolution was carried out in phosphate buffer PH 6.8. Samples (5ml) were collected
periodically and replaced with a fresh dissolution medium. After filtration through Whatmann
filter paper 41, concentration of Paracetemol in samples was determined
spectrophotometrically at 242.4 nm. The dissolution profile of all batches is shown in Table-20.
Table-20 Dissolution profile of prepared paracetamol tablets
Batch Amount dissolved (% cumulative)* at different time intervals
5 min. 10 min. 20 min. 30 min. 40 min. 50 min. 60 min. WET 11.46
±0.89 24.29 ±1.43
39.38 ±2.15
59.08 ±1.49
65.56 ±1.69
79.45 ±1.89
90.61 ±1.97
A 12.40 ±0.99
23.73 ±2.44
40.13 ±1.89
58.24 ±2.32
66.47 ±1.85
79.98 ±3.31
91.38 ±1.81
B 13.14 ±0.87
24.76 ±2.49
40.78 ±1.49
59.77 ±2.19
67.43 ±2.01
81.41 ±1.98
92.17 ±2.42
C 13.72 ±1.46
28.39 ±1.10
43.19 ±1.73
60.74 ±1.98
70.94 ±2.62
82.81 ±4.59
93.81 ±0.99
D 11.76 ±1.25
26.79 ±2.11
44.49 ±0.89
61.47 ±1.67
71.83 ±2.44
83.29 ±1.62
93.28 ±0.67
E 12.58 ±2.31
25.96 ±1.68
43.56 ±2.31
62.58 ±0.57
72.46 ±2.32
82.85 ±1.76
92.59 ±0.92
F 11.49 ±1.43
23.67 ±2.23
41.26 ±1.53
59.12 ±0.76
66.38 ±2.19
80.49 ±1.49
91.49 ±2.76
* Data represent mean ± SD, n=6

Research Article CODEN: IJPRNK ISSN: 2277-8713 Hemant Vyas, IJPRBS, 2015; Volume 4(3): 415-447 IJPRBS
Available Online at www.ijprbs.com 436
Figure-19 Dissolution profile of all batches
RESULT AND DISCUSSION
The % release was found to be 90.16% in case of wet granulation batch. The % release was
found to be 91.38%, 92.17%, 93.81%, 93.28%, 92.59% and 91.49% for “A”, “B”, “C”, “D”, “E”
and “F” (foam) batches respectively. The t-test was performed on % dissolved at 30 min. for
wet granulation batch and foam granulation batch “C”. It was found that there was no
significant (P≤0.05; df=2; tstat=0.6; tcrit=2.92) difference between both batches.
5.6 Stability study of selected optimized paracetamol tablets as per ICH Q1 stability testing
guideline
It is the responsibility of the manufacturers to see that the medicine reaches the consumer in
an active form. So the stability of pharmaceuticals is an important criterion. Stability of
medicinal products may be defined as the capability of a particular formulation in a specific
container to remain within its physical, chemical, microbial, therapeutic and toxicological
specification, i.e. stability of drug is its ability to resist detoriation. 90% of labeled potency is
generally recognized as the minimum acceptable potency level. Detoriation of drug may take
several forms arising from changes in physical, chemical and microbiological properties. The
changes may affect the therapeutic value of preparation or increase its toxicity.
Accelerated Stability Testing:
Since the period of stability testing can be as long as two years, it is time consuming and
expensive. Therefore, it is essential to devise a method that will help rapid prediction of long
term stability of drug. The accelerated stability testing is defined as the validated method by
which the product stability may be predicted by storage of the product under the conditions
that accelerate the change in defined and predictable manner. The stability study of prepared
paracetamol tablet batches (wet granulation and batch C) were carried out at
40/75(°C/RH) for one month. The effects of temperature, humidity and time on the physical
characteristics of the prepared tablet batches were evaluated for assessing the stability of the
prepared formulation. Protocol for accelerated stability testing is shown in Table 21.
0
20
40
60
80
100
0 20 40 60 80
WET
A
B
C
D
E
F
Time (min.)
%
Dis
solv
ed

Research Article CODEN: IJPRNK ISSN: 2277-8713 Hemant Vyas, IJPRBS, 2015; Volume 4(3): 415-447 IJPRBS
Available Online at www.ijprbs.com 437
Table 21: Protocol for accelerated stability testing of the developed paracetamol tablets
based on ICH Q1 Stability testing guideline
Procedure Among the formulations, formulation “C” showed minimum moisture content and
drying time and maximum release at t = 60 min. The formulation C was packed in amber
colored screw capped glass bottle and stored at 40±2°C and 75±5% RH for 4 weeks in stability
chamber. Samples were withdrawn at 7 day time interval and evaluated for hardness, friability,
disintegration time, drug content, and drug release. Physical stability data of the prepared
tablet batches of paracetamol is shown in Table 22 and 23 and in vitro release profile of
paracetamol from the prepared tablet batches during stability is shown in Table 24 and 25 and
Figure 20 and 21.
Table 22: Physical accelerated stability data of paracetamol tablets prepared using wet
granulation method
1 Objective To ensure whether the developed paracetamol tablet batches have adequate stability.
To predict shelf life of the developed paracetamol tablets.
2 Selection of batches Wet granulation batch and batch C (prepared using foam granulation) Number of batches-3 for each
3 Container-closure Glass bottle with screw cap 4 Specifications Parameter Acceptance
Criteria Test method
Hardness 4-5 Kg/cm2 Mosanto hardness tester
Friability ≤1% Roche friabilitor
Disintegration time 30 min. Disintegration time apparatus
In vitro drug release at 60 min.
>90% USP II apparatus
Weight uniformity ±5% Analytical balance
Drug content 100±15% U.V.spectrophotometer at 242.4 nm.
5 Testing frequency 5 samples at 0,1,2,3 and 4 week 6 Storage condition 40±2 °C and 75±5% RH
Quality attribute
Sampling interval
0 day 1st week 2nd week 3rd week 4th week Hardness (kg) 4.3±0.4 4.4±0.6 4.5±0.7 4.7±0.5 4.8±0.7 Friability (%) 0.65±0.16 0.65±0.22 0.62±0.18 0.62±0.13 0.61±0.14

Research Article CODEN: IJPRNK ISSN: 2277-8713 Hemant Vyas, IJPRBS, 2015; Volume 4(3): 415-447 IJPRBS
Available Online at www.ijprbs.com 438
Table 23: Physical accelerated stability data of paracetamol tablets prepared using foam
granulation method
Table 24: In vitro release of paracetamol from tablets prepared using wet granulation
subjected to accelerated stability storage conditions
Time (Min.)
Amount dissolved (% cumulative)* at different sampling intervals
0 1st week 2nd week 3rd week 4th week
5 11.29±0.23 11.27±0.52 11.14±0.18 12.61±0.26 10.54±0.22 10 24.34±0.45 24.33±0.19 23.89±0.27 23.66±0.55 22.76±0.26 20 39.35±0.16 39.43±0.63 38.49±0.36 38.12±0.52 38.76±0.54 30 59.12±0.32 59.16±0.26 58.76±0.29 57.94±0.78 57.73±0.52 40 65.59±0.25 65.46±0.53 64.21±0.56 64.26±0.49 63.71±0.86 50 78.54±0.45 78.47±0.43 77.29±0.25 76.54±0.26 76.89±0.73 60 91.28±0.27 91.39±0.67 91.11±0.27 90.16±0.19 90.36±0.93
* Data indicate mean±SD of triplicate determinations
Figure 20: In vitro release of paracetamol from the developed wet granulation batch stored
under accelerated stability conditions
0
20
40
60
80
100
0 20 40 60 80
0 week
4 week
Time (min.)
%
Dru
gre
leas
ed
Disintegration time (min.)
27±1.29 27±1.33 29±1.26 29±1.11 31±1.22
Quality attribute
Sampling interval
0 day 1st week 2nd week 3rd week 4th week Hardness (kg) 4.2±0.3 4.2±0.4 4.4±0.8 4.7±0.4 4.8±0.5 Friability (%) 0.75±0.18 0.75±0.21 0.73±0.12 0.70±0.17 0.68±0.14 Disintegration time (min.)
28±1.36 28±1.21 29±1.08 30±1.34 31±0.89

Research Article CODEN: IJPRNK ISSN: 2277-8713 Hemant Vyas, IJPRBS, 2015; Volume 4(3): 415-447 IJPRBS
Available Online at www.ijprbs.com 439
Table 25: In vitro release of paracetamol from tablets prepared using foam granulation
subjected to accelerated stability storage conditions
Time (Min.)
Amount dissolved (% cumulative)* at different sampling intervals
0 1st week 2nd week 3rd week 4th week 5 13.78±0.76 13.54±0.17 13.31±0.12 12.13±0.23 12.16±0.87 10 26.39±0.22 27.69±0.22 26.67±0.34 25.24±0.33 24.36±0.47 20 42.76±0.56 43.19±0.59 41.56±0.73 42.26±0.29 41.94±0.73 30 63.58±0.59 63.44±0.28 62.34±0.32 62.76±0.76 61.11±0.48 40 69.24±0.18 68.36±0.26 67.76±0.59 66.34±0.32 66.74±0.49 50 81.96±0.29 82.14±0.58 80.94±0.43 81.24±0.39 80.79±0.63 60 92.54±0.86 92.19±0.87 90.13±0.41 90.26±0.24 90.51±0.73
Figure 21: In vitro release profile of paracetamol from the developed foam granulation batch
C stored under accelerated stability conditions
As per ICH Q1 Stability Testing guideline, prediction of shelf life involves
analyzing data of a quantitative attribute that is expected to change with time (drug content)
and determination of the time at which the 95% one sided confidence limit for the mean curve
intersects the acceptance criterion (90% drug remaining). If analysis shows that the batch to
batch variability is small, it is advantageous to combine the data into one overall estimate. This
can be done by first applying appropriate statistical tests (e.g., p values for level of significance
of rejection of more than 0.25) to the slopes of the regression lines and zero time
intercepts for the individual batches. If it is inappropriate to combine data from several
batches, the overall shelf life should be based on the minimum time a batch can be expected to
remain within acceptance criteria. The nature of the degradation relationship will determine
whether the data should be transformed for linear regression analysis. Usually the relationship
can be represented by a linear function on logarithmic scale. Degradation of paracetamol in wet
granulation batch and batch C at 40±2°C and 75±5% RH is presented in Table 26 and 27 and
Figure 22 and 23.
0
20
40
60
80
100
0 20 40 60 80
0 Week
4 week
Time (min.)
% D
rug
rele
ase

Research Article CODEN: IJPRNK ISSN: 2277-8713 Hemant Vyas, IJPRBS, 2015; Volume 4(3): 415-447 IJPRBS
Available Online at www.ijprbs.com 440
Table 26: Chemical accelerated stability data of the paracetamol tablets prepared using wet
granulation method
Time (Weak) % drug remaining (Mean± S.D.)
Log % drug remaining (Mean± S.D.)
95%
UCI LCI 0 99.79±0.03 1.9991±0.000131 1.9994 1.9806 1 99.40±0.232881 1.9974±0.001017 1.9999 1.9779 2 98.72±0.133167 1.9944±0.000586 1.9958 1.9778 3 97.36±0.03 1.9883±0.000134 1.9887 1.9748 4 96.76±0.157162 1.9856±0.000705 1.9874 1.9755 Slope -0.115 -0.0005 -0.0005 -0.0005 Intercept 100 2.0 2.0 1.9999 r 0.963 0.963 0.892 0.985
Figure 22: First order degradation of paracetamol in tablets prepared using wet granulation
method at accelerated storage conditions
Table 27: Chemical accelerated stability data of paracetamol tablets prepared by foam
granulation method
Time (Weak) % drug remaining (Mean± S.D.)
Log % drug remaining (Mean± S.D.)
95%
UCI LCI 0 98.64±0.0305 1.9941±0.000134 1.9944 1.9937 1 98.38±0.0556 1.9929±0.00024 1.9935 1.9923 2 97.77±0.0611 1.9904±0.000271 1.9911 1.9897 3 96.69±0.02 1.9853±0.000089 1.9855 1.9851 4 95.87±0.0513 1.9817±0.000232 1.9823 1.9811 Slope -0.103 -0.0005 -0.0005 -0.0005 Intercept 98.92 1.99 1.9958 1.9949 r 0.952 0.952 0.939 0.961
1.93
1.94
1.95
1.96
1.97
1.98
1.99
2
2.01
0 10 20 30 40 50 60 70 80 90 100
Mean drug remaining
Time (days)
Log %
dru
g
rem
ain
ing

Research Article CODEN: IJPRNK ISSN: 2277-8713 Hemant Vyas, IJPRBS, 2015; Volume 4(3): 415-447 IJPRBS
Available Online at www.ijprbs.com 441
Figure 23: First order degradation of paracetamol in tablets of foam granulation batch C
stored under accelerated storage conditions
Bracket Method: Activation energy is usually estimated based on Arrhenius equation by
subjecting the product to stress conditions. However, when the activation energy is known, the
degradation rate at storage temperature may be predicted from data collected at only one
elevated/accelerated temperature. This practice is sometimes preferred in industry since it
reduces the size and time of accelerated stability tests. Experience indicates that some
pharmaceutical analytes have activation energy in the range of 10 - 20 kcal/mol, but it is
unlikely to have precise information about the activation energy of a certain product.
The bracket method is a straight forward application of the Arrhenius equation that can be
used if the value of the activation energy is known. Stability at recommended storage
temperature is calculated with a modified version of Arrhenius equation as:
Where,
Ea Energy of Activation 20 Kcal/mol
Ts Temperature at which shelf life is to be predicted 298K (273+250C) Te Temperature at which stability study was performed 313K (273+400C) te shelf life at Te (t90% drug remaining) 88 days for both
batches ts shelf life at Ts To be predicted
On substituting the values into the equation:
1.93
1.94
1.95
1.96
1.97
1.98
1.99
2
0 10 20 30 40 50 60 70 80 90 100
Mean drug remaining
Time (days)
Log %
dru
g
rem
ain
ing
ts = exp [Ea/0.00199 (1/Ts-1/Te)] te
ts = exp [20/0.00199 (1/298 - 1/313)] 88

Research Article CODEN: IJPRNK ISSN: 2277-8713 Hemant Vyas, IJPRBS, 2015; Volume 4(3): 415-447 IJPRBS
Available Online at www.ijprbs.com 442
= 443 days as 14 months for both batches
Q-Rule: The Q-Rule states that the degradation rate decreases by a constant factor when
temperature is lowered by certain degrees. The value of Q is typically set at 2, 3, or 4. This
factor is proportional to the temperature change as Qn, where n equals the temperature
change in °C divided by 10°C. Since 10°C is the baseline temperature, the Q-Rule is sometimes
referred to as Q10.
Where, t90 (T2) is the estimated shelf life at temperature T2, t90 (T1) is the given shelf life at given
temperature T1, and Δ T is the difference in the temperature (T2 –T1).
Note: the estimate of t90 (T2) is independent of the reaction order.
Setting on an intermediate value of Q = 3 and substituting the value in the equation:
t90(T2) = 88
3(25-40)/10
= 457 days as 15 months
This approach is more conservative when lower values of Q are used. Both Q-Rule and the
bracket methods are rough approximations of stability. They can be effectively used to plan
elevated temperature levels as well as the duration of testing in the accelerated stability testing
protocol.
Limitation of accelerated stability studies
Accelerated stability studies are valid only when the breakdown depends on temperature.
Accelerated stability studies are valid only the energy of activation is about 10 to 30 kcal /
mol.
The result obtained for one set of conditions for a preparation cannot be applied to other
preparation of same drug.
Stability prediction at elevated temperature is of little use when degradation is due to
diffusion, microbial contamination, and photo-chemical reaction.
t90 (T1)
t90 (T2) =
Q10(ΔT/10)

Research Article CODEN: IJPRNK ISSN: 2277-8713 Hemant Vyas, IJPRBS, 2015; Volume 4(3): 415-447 IJPRBS
Available Online at www.ijprbs.com 443
Stability studies are meaningless when the product loses its physical integrity at higher
temperature like coagulation of suspending agent, denaturation of proteins.
RESULT AND DISCUSSION:
Both selected formulations showed good physical stability, as there was no discoloration or any
significant physical changes after storage. Paracetamol degradation, result obtained showed log
linear profile, from which the degradation rate constant (k) was calculated from the slope. This
was found to be 1.15×10⁻³ (month-1) at 40°c for both batches. The shelf life at 250C was
determined by using Bracket Method and Q-Rule shown in Table 28.
Table 28: Conformance period and shelf life at 25°C of the developed paracetamol tablets by
wet granulation and foam granulation methods
t90% at 40°c t90%at 25°c
88 days Method Conformance period Shelf life Bracket Method 443 days =14.76 months 14 Months
Q-Rule 457 days = 15.23 months 15 months
Conformance period is the time period during which an active pharmaceutical ingredient (API)
or a finished pharmaceutical product (FPP) is expected to remain within approved shelf life
specification, provided that it is stored under the conditions defined on the container label.
The proposed shelf life, as estimated from the accelerated stability study, has to be backed up
by real time/long term stability testing as per ICH Q1 Stability Testing guidelines depending
upon World Climatic Zones (Appendix Table A7) under which a country is classified in which the
product is to be marketed.
CONCLUSION
The aim of this dissertation work was to study the effect of type of granulation (wet and foam
granulation) on the parameters of granules and the parameters of tablets. In this dissertation
work the different polymers (HPMC, HPC, Sod.CMC, and HEC) were used to generate the foams.
These generated foams were evaluated for foam quality, nucleation ratio, specific penetration
time, and foam stability. On the basis of these parameters the optimum foam batches were
selected. The preference was given to the foam stability and foam quality for selection of foam
batches. The effect of foam quality on the nucleation ratio and specific penetration time was
studied. The results of evaluation of foam of optimized batch prepared using 3% HPMC are
shown in Table-29.

Research Article CODEN: IJPRNK ISSN: 2277-8713 Hemant Vyas, IJPRBS, 2015; Volume 4(3): 415-447 IJPRBS
Available Online at www.ijprbs.com 444
Table-29 Evaluation parameters of optimized foam batch (3%w/v HPMC)
Foam quality (%)
Foam stability (ml.) Nucleation ratio Specific penetration time (sec.)
95.7 0.8 2.46 720
The optimized foam batch was used to prepare paracetamol granules. The granule parameters
were studied with respect to type of granulation.
Table-30 Comparative effect of method of granulation on the granule parameters
Method of granulation
Parameter
Angle of repose
Hausner’s ratio
Carr’s index (%) Moisture content
Drying time (sec.)
Wet granulation
11.12 1.06 5.87 23.79 540
Foam granulation
17.83 1.10 9.37 21.46* 450*
* = Significant difference (p≤0.05)
The moisture content and drying time were decreased significantly, so the foam granulation
process is able to decrease the processing time. Seven tablet batches were prepared. The tablet
batches were evaluated and the effect of method of granulation and polymer used to generate
foam was studied. On the evaluation of prepared paracetamol tablets, it was observed that
tablets prepared using either granulation method complied with all the quality control
parameters.
In foam granulation batches “C”, “D”, “E”, and “F” the effect of foam quality and nucleation
ratio on different parameters were studied. It was found that as the foam quality increases and
the nucleation ratio decreases the moisture content and drying time decreases.
Table-31 Comparison of different foam parameters between different foam granulation
batches
Parameters Batch
C D E F Foam quality 95.70 88.0 93 86
Nucleation ratio 2.46 4.854 3.412 4.580 Moisture content 21.46 18.99 27.49 22.95
Drying time 450 491 563 443

Research Article CODEN: IJPRNK ISSN: 2277-8713 Hemant Vyas, IJPRBS, 2015; Volume 4(3): 415-447 IJPRBS
Available Online at www.ijprbs.com 445
% of optimum sized particles
23.25 12.4 13.54 10.7
Thus it can be concluded that foam granulation can be used to prepare tablets complying with
pharmacopoeial specifications with decreased processing time in comparison to wet
granulation method.
Further the foam granulation method can be explored for development of low dose drugs such
as- propranolol, aceclofenac, and for moisture sensitive drugs such as- aspirin.
REFERENCES
1. www.dipharma.com/The_Granulation_Process_101.pdf, accessed on 04-13-2013.
2. Saikh A. A. M. et al., “A technical note on granulation technology: a way to optimize
granules”, “International Journal of Pharmaceutical Sciences and Research”, 2013, 4(1),55-67.
3. Sheth V. P. et al., “Steam granulation: Novel aspects in granulation techniques”, “Pharma
Science Monitor, An International Journal of Pharmaceutical Sciences”, 2012,3(3),
4. Kumar G. et al., “Direct compression: an overview”, “International Journal of Research and
Biomedical Sciences”, 2013,4(1)
5. Mallya S., “1-7 Manufacturing Basics and Issues: Solid Orals”, “PQP Assessment Training”,
“World Health Organisation”, January 18-21, 2012.
6. www.Paduaresearch.cab.unipd.it accessed on 04-16-2013.
7. Ahmed A. T. et al., “Formulation, evaluation and optimization of miconazole nitrate tablet
prepared by foam granulation technique”, “International Journal of Drug Delivery”,
2011,3(4),712-733.
8. Sheskey P. et al., “Use of novel foam granulation technique to incorporate low drug loading
into immediate release tablet formulation”, “American association of Pharmaceutical
Scientists”, Baltimore, Maryland, Nov. 7-9, 2004.
9. http://pharmatech.findpharma.com/madg accessed on 03-17-2013.
10. www.spray.com accessed on 08-15-2013.
11. www.swereaivf.se accessed on 04-14-2013.

Research Article CODEN: IJPRNK ISSN: 2277-8713 Hemant Vyas, IJPRBS, 2015; Volume 4(3): 415-447 IJPRBS
Available Online at www.ijprbs.com 446
12. Stuer M., Zhao Z. et al., “Freeze granulation: Powder processing for transparent alumina
applications”,” Journal of the European Ceramic Society”, 2899–2908, 2012.
13. Allamneni Y. et al., “Foam granulation technology as a new innovation in granulation of
pharmaceutical drugs: an overview”, “International Journal of Pharmaceutical Frontier
Research”, 2012, 2(2):68-69.
14. www.nsdl.niscair.res.in accessed on 07-13-2013.
15. Tylenol professional product information, McNeil Consumer Healthcare, 2010.
16. en.wikipeda.org/wiki/paracetamol accessed on 04-21-2013.
17. www.chemicalbook.com accessed on 04-22-2013.
18. en.wikipedia.org/wiki/Hydroxy propyl methyl cellulose accessed on 08-17-2013.
19. www.ronasgroup.com accessed on 08-19-2013.
20. en.wikipedia.org/wiki/Hydroxyethyl cellulose accessed on 06-12-2013.
21. http://en.wikipedia.org/hydroxypropylcellulose accessed on 08-13-2013.
22. http://en.wikipedia.org/sodiumcarboxy methyl cellulose accessed on 05-18-2013.
23. http://en.wikipedia.org/ Sodium+ dodecyl+ sulfate accessed on 06-02-2013.
24. Bahnassi z. et al., “Formulation and evaluation of fast dissolving tablets using foam
granulation techniques”, “Indo Global Journal of Pharmaceutical Sciences”, 2012, 2(4), 342-347.
25. www.nt.ntnu.no/users/skoge/prost/proceeding/aiche accessed on 04-09-2013.
26. Melvin X. L. et al., “Foam granulation: Liquid penetration or mechanical dispersion”,
“Chemical Engineering Science”, 2011, 66(21), 5204-5211.
27. Melvin X. L. et al., “Foam granulation: Binder dispersion and nucleation in mixer-
Granulators”, “Chemical Engineering Research and Design”, 2011, 89(5), 526-536.
28. Solanki K. H. et al., “Recent advances in granulation technology”, “International Journal of
Pharmaceutical Sciences Review and Research”, 2010, 5(3), 48-54.
29. Centor L. S., et al., “Evaluation of the physical and mechanical properties of high drug load
formulations: Wet granulation vs. novel foam granulation”, “Powder Technology”, 2009, 195(3),
15–24.
Research Article CODEN: IJPRNK ISSN: 2277-8713 Hemant Vyas, IJPRBS, 2015; Volume 4(3): 415-447 IJPRBS
Available Online at www.ijprbs.com 447
30. Sheskey P. et al., “Foam granulation technology: Impact of manufacturing variables on final
granule and tablet properties”, “American Association of Pharmaceutical Scientists”, Atlanta,
Georgia, Nov. 16-20, 2008.
31. Sheskey et al., “New foamed binder technology from dow improves granulation process”,
“Pharmaceutical Canada”, 2006.
32. Flores R. et al., “Advantages of foam granulation and process miniaturization for small
quantities of micronized drugs”, American Association of Pharmaceutical Scientists”, 2005.
33. Keary M. C. et al., “Preliminary report of the discovery of a new pharmaceutical granulation
process using foamed aqueous binders”, Drug Development and Industrial Pharmacy, 2004,
30(3), 831-845.


![Journal of Chemical and Pharmaceutical Research, 2016, … · 2020-07-10 · seeding on Paracetamol [28]. Swamivelmanickam et. al. studied the preformulation studies of Amoxicillin](https://static.fdocuments.net/doc/165x107/5fa6cb2637dabe625f264750/journal-of-chemical-and-pharmaceutical-research-2016-2020-07-10-seeding-on-paracetamol.jpg)