![International Journal of Fatigueunder question. Recently, this fatigue size effect was studied by Le et al. [13] for sandstone, a rock that is also quasibrittle. They realized that](https://static.fdocuments.net/doc/165x107/5e2a72a0bc36b82ffe2d5224/international-journal-of-under-question-recently-this-fatigue-size-effect-was.jpg)
International Journal of Fatigue - Northwestern … damage model for fatigue of quasibrittle...
13
Microplane damage model for fatigue of quasibrittle materials: Sub-critical crack growth, lifetime and residual strength Kedar Kirane a , Zdene ˇk P. Baz ˇant b,⇑ a Department of Mechanical Engineering, Northwestern University, 2145 Sheridan Road, Evanston, IL 60208 USA b Department of Civil and Environmental Engineering, Northwestern University, 2145 Sheridan Road, Evanston, IL 60208 USA article info Article history: Received 15 May 2014 Received in revised form 24 August 2014 Accepted 26 August 2014 Available online 16 September 2014 Keywords: Microplane model Quasibrittle Fatigue Paris law Size effect abstract In contrast to metals and fine grained ceramics, fatigue in concrete and other quasibrittle materials occurs in a large fracture process zone that is not negligible compared to the structure size. This causes the fatigue to be combined with triaxial softening damage whose localization is governed by a finite material characteristic length. A realistic model applicable to both has apparently not yet been developed and is the goal of this paper. Microplane model M7, shown previously to capture well the nonlinear tri- axial behavior of concrete under a great variety of loadings paths, is extended by incorporating a new law for hysteresis and fatigue degradation, which is formulated as a function of the length of the path of the inelastic volumetric strain in the strain space. The crack band model, whose band width represents a material characteristic length preventing spurious localization, is used to simulate propagation of the fatigue fracture process zone. Thus the fatigue crack with its wide and long process zone is simulated as a damage band of a finite width. For constant amplitude cycles, the model is shown to reproduce well, up to several thousands of cycles, the Paris law behavior with a high exponent previously identified for concrete and ceramics, but with a crack growth rate depending on the structure size. Good agreement with the crack growth histories and lifetimes previously measured on three-point bend beams of normal and high strength concretes is demonstrated. The calculated compliance evolution of the specimens also matches the previous experiments. The model can be applied to load cycles of varying amplitude, to residual strength under sudden overload and damage under nonproportional strain tensor variation. Application to size effect in fatigue is relegated to a follow-up paper, while a cycle-jump algorithm for extrapolation high-cycle fatigue with millions of cycles remains to be researched. Ó 2014 Elsevier Ltd. All rights reserved. 1. Introduction and objective Although extensive research results on the sub-critical fatigue crack growth in metals and ceramics have been accumulated they are not applicable to quasibrittle materials, for three reasons: (1) The modeling of fatigue is inseparable from the modeling of distributed triaxial softening damage, which is rather intri- cate for quasibrittle materials; (2) because of material heterogeneity, the size of the fracture process zone (FPZ) is not negligible compared to structural dimensions (see Fig. 1); and (3) the finiteness of FPZ size, representing the material charac- teristic length, engenders a structural size effect on the rate of fatigue fracture growth (the size effect will be addressed in a follow-up article). The size effect on the Paris law for fatigue fracture growth has been demonstrated in two previous studies and described on the basis of equivalent linear elastic fracture mechanics (LEFM) [1,2]. But no general model for combined fatigue and nonlinear triaxial softening damage appears to exist. The purpose of this paper is to develop such a model. The microplane model M7, which is a new and most advanced model for damage in concrete, with the broadest experimental verification, is adopted as the starting point. Quasibrittle materials are heterogenous materials with brittle constituents. They include concretes, as the archetypical case, fiber composites, tough ceramics, sea ice, rock, stiff soils, rigid foams, wood, coal, bone, various bio- and bio-inspired materials, etc. All brittle materials become quasibrittle on sufficiently small scale. Thus brittle materials in micrometer scale devices (MEMS) must be expected to exhibit quasibrittle fatigue behavior similar to the behavior of concrete on the scale of meters. The crack growth in brittle materials follows the Paris law [3], which reads, http://dx.doi.org/10.1016/j.ijfatigue.2014.08.012 0142-1123/Ó 2014 Elsevier Ltd. All rights reserved. ⇑ Corresponding author. Tel.: +1 847 491 4025; fax: +1 847 491 4011. E-mail address: [email protected] (Z.P. Baz ˇant). International Journal of Fatigue 70 (2015) 93–105 Contents lists available at ScienceDirect International Journal of Fatigue journal homepage: www.elsevier.com/locate/ijfatigue
Transcript of International Journal of Fatigue - Northwestern … damage model for fatigue of quasibrittle...
International Journal of Fatigue 70 (2015) 93–105
Contents lists available at ScienceDirect
International Journal of Fatigue
journal homepage: www.elsevier .com/locate / i j fa t igue
Microplane damage model for fatigue of quasibrittle materials:Sub-critical crack growth, lifetime and residual strength
http://dx.doi.org/10.1016/j.ijfatigue.2014.08.0120142-1123/� 2014 Elsevier Ltd. All rights reserved.
⇑ Corresponding author. Tel.: +1 847 491 4025; fax: +1 847 491 4011.E-mail address: [email protected] (Z.P. Bazant).
Kedar Kirane a, Zdenek P. Bazant b,⇑a Department of Mechanical Engineering, Northwestern University, 2145 Sheridan Road, Evanston, IL 60208 USAb Department of Civil and Environmental Engineering, Northwestern University, 2145 Sheridan Road, Evanston, IL 60208 USA
a r t i c l e i n f o a b s t r a c t
Article history:Received 15 May 2014Received in revised form 24 August 2014Accepted 26 August 2014Available online 16 September 2014
Keywords:Microplane modelQuasibrittleFatigueParis lawSize effect
In contrast to metals and fine grained ceramics, fatigue in concrete and other quasibrittle materialsoccurs in a large fracture process zone that is not negligible compared to the structure size. This causesthe fatigue to be combined with triaxial softening damage whose localization is governed by a finitematerial characteristic length. A realistic model applicable to both has apparently not yet been developedand is the goal of this paper. Microplane model M7, shown previously to capture well the nonlinear tri-axial behavior of concrete under a great variety of loadings paths, is extended by incorporating a new lawfor hysteresis and fatigue degradation, which is formulated as a function of the length of the path of theinelastic volumetric strain in the strain space. The crack band model, whose band width represents amaterial characteristic length preventing spurious localization, is used to simulate propagation of thefatigue fracture process zone. Thus the fatigue crack with its wide and long process zone is simulatedas a damage band of a finite width. For constant amplitude cycles, the model is shown to reproduce well,up to several thousands of cycles, the Paris law behavior with a high exponent previously identified forconcrete and ceramics, but with a crack growth rate depending on the structure size. Good agreementwith the crack growth histories and lifetimes previously measured on three-point bend beams of normaland high strength concretes is demonstrated. The calculated compliance evolution of the specimens alsomatches the previous experiments. The model can be applied to load cycles of varying amplitude, toresidual strength under sudden overload and damage under nonproportional strain tensor variation.Application to size effect in fatigue is relegated to a follow-up paper, while a cycle-jump algorithm forextrapolation high-cycle fatigue with millions of cycles remains to be researched.
� 2014 Elsevier Ltd. All rights reserved.
1. Introduction and objective The size effect on the Paris law for fatigue fracture growth has
Although extensive research results on the sub-critical fatiguecrack growth in metals and ceramics have been accumulated theyare not applicable to quasibrittle materials, for three reasons:
(1) The modeling of fatigue is inseparable from the modeling ofdistributed triaxial softening damage, which is rather intri-cate for quasibrittle materials;
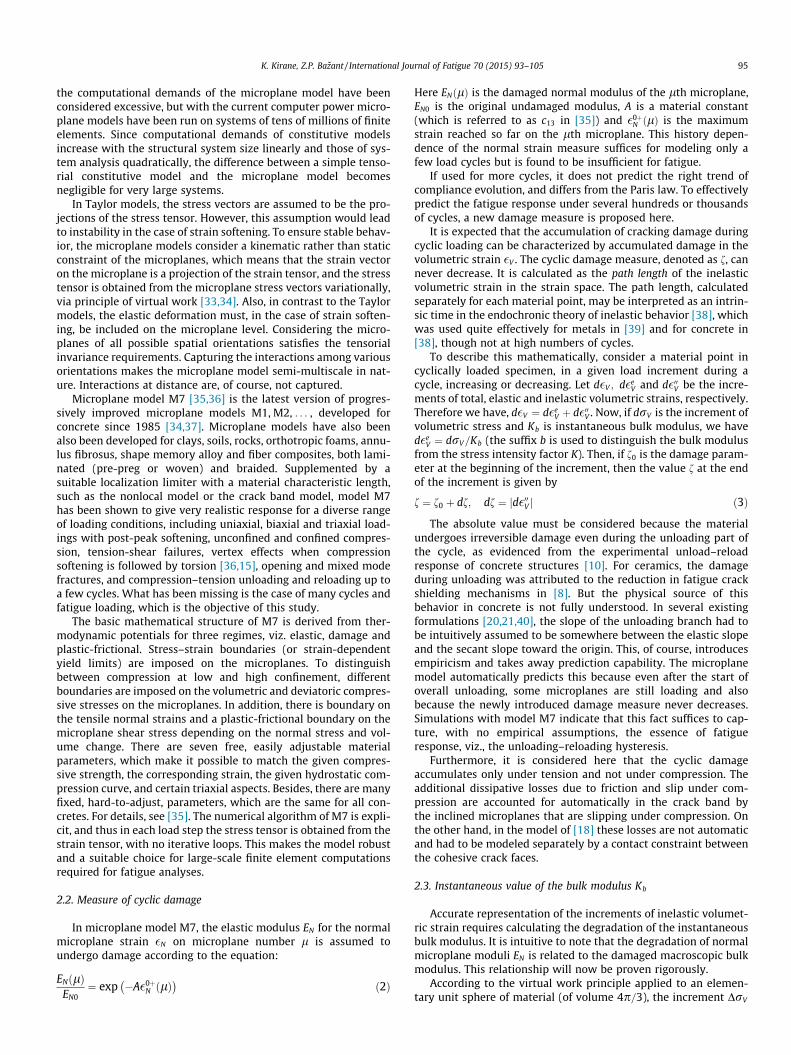
(2) because of material heterogeneity, the size of the fractureprocess zone (FPZ) is not negligible compared to structuraldimensions (see Fig. 1); and
(3) the finiteness of FPZ size, representing the material charac-teristic length, engenders a structural size effect on the rateof fatigue fracture growth (the size effect will be addressedin a follow-up article).
been demonstrated in two previous studies and described on thebasis of equivalent linear elastic fracture mechanics (LEFM) [1,2].But no general model for combined fatigue and nonlineartriaxial softening damage appears to exist. The purpose of thispaper is to develop such a model. The microplane model M7, whichis a new and most advanced model for damage in concrete, withthe broadest experimental verification, is adopted as the startingpoint.
Quasibrittle materials are heterogenous materials with brittleconstituents. They include concretes, as the archetypical case, fibercomposites, tough ceramics, sea ice, rock, stiff soils, rigid foams,wood, coal, bone, various bio- and bio-inspired materials, etc. Allbrittle materials become quasibrittle on sufficiently small scale.Thus brittle materials in micrometer scale devices (MEMS) mustbe expected to exhibit quasibrittle fatigue behavior similar to thebehavior of concrete on the scale of meters.
The crack growth in brittle materials follows the Paris law [3],which reads,
Brittle Ductile Quasibrittle
Cyclic FPZ
Monotonic FPZ
Fig. 1. Shape of nonlinear zone and fracture process zones [34] (L = linear zone, F = Fracture process zone, N = nonlinear zone).
94 K. Kirane, Z.P. Bazant / International Journal of Fatigue 70 (2015) 93–105
dadN¼ CðDKÞm ð1Þ
where C and m are empirical constants depending on factors such asthe environment, and load ratio [4]. The Paris law has been shownto apply also to concrete if the structure size is kept constant [1,2],and under this constraint it probably applies to all quasibrittlematerials. The Paris law exponent m is typically between 2 and 4for metals, while for concrete and ceramics it is about 10–50[1,2,5,6]. Unlike metals, concrete exhibits a size effect on the crackgrowth rate [1,2], and so do rocks [7]. The microstructural fatiguemechanism, which is well known for metals [8,9], is not yet wellunderstood for concrete but is sure to be quite different. Its under-standing will be helped by the FPZ analysis which follows.
Fracture in concrete is characterized by distributed post-peaksoftening damage within a FPZ whose size is not negligiblecompared to structural dimensions [10]. The difference fromembrittled metals is that the FPZ that travels forward with thefatigue crack growth is large. For metals, the FPZ is of micrometersize, and thus is negligible for specimens of centimeter size or lar-ger. Therefore, interactions between triaxial damage and fatiguecrack growth are insignificant. Not so, however, for quasi-brittlematerials. The load cycles produce residual stresses in the cyclicFPZ, which is expected to be smaller than the monotonic FPZ butstill large enough for such interactions. Under stable subcriticalcrack growth, the fatigue crack grows while interacting with pro-gressive damage in the advancing FPZ. In the final stage, as theeffective stress intensity factor of the equivalent LEFM crackincreases, the crack advance accelerates and leads to stability loss,i.e., failure. The FPZ undergoing softening damage in concrete hasbeen modeled by the cohesive crack model, in which the full FPZwidth is lumped into an interface between two opposite crack facesand the softening damage is described by a traction-separation law[11–13]. In this approach, however, the tensorial behavior of theFPZ is not captured and the minimum possible spacing of parallelnon-localizing cracks is not enforced.
To capture full tensorial behavior in the FPZ, including the effectof normal stresses parallel to the crack plane, one may use thecrack band model (see [14], with implementation in [15] for acommercial code and arbitrary constitutive law). In this model,the inelastic softening damage is smeared within a crack band ofa finite reference width that is a material property. The band widthcan be changed by adjusting the steepness of post-peak softeningso as to maintain the same energy dissipation (although this isnot what is done here, in order to minimize the approximationerror associated with changing the crack band width). The refer-ence band width serves as a material characteristic length repre-senting a localization limiter, which prevents spurious meshsensitivity of results [16]. For a very thin crack band, the cohesivecrack model can be approximated closely. Another advantage ofthe crack band model is that it can simulate the width of the
FPZ, and consequently it can represent with correct spacing a sys-tem of parallel cracks when they do not localize, as in the presenceof reinforcing bars or for some thermal stress distributions.
1.1. Previous studies of cohesive and constitutive models for fatigue
To predict the fatigue crack growth, the unload–reload hystere-sis of the material must be captured realistically. Especially, thedeformation increment over a cycle must be predicted correctly.The hysteresis was simulated by a number of researchers usingthe cohesive crack model.
In [17], the uniaxial cohesive stress–strain curve was adjusteddownward after each cycle by an amount corresponding to theenergy dissipated in the cycle. Another model [18] introduced ahysteretic cohesive law with different incremental stiffnessesdepending on whether the cohesive surface opens or closes. Thismodel was able to reproduce fatigue crack growth of Paris-lawtype and also some deviations from this law including short crackgrowth and the retarding effect of sudden overload in metals. In[19], an extension of this model with development of residual ten-sile stresses in the FPZ was shown to simulate fatigue crack growthunder cyclic compression. In [20], a cohesive zone model withpolynomial expressions for loading and unloading paths was pro-posed. Other similar approaches included the models by Horii[21], Bahn and Su [22], Bazant and Planas [10] and the continuousfunction model by Hordjik and Reinhardt [23]. Some studies alsoproposed for fatigue continuum damage models which, however,were based on rather simple or simplified tensorial damagebehavior [24–27].
None of the aforementioned models are able to predict the Parislaw exponent or the size effect. They all aim to describe the fatiguecrack growth as a separate phenomenon and cannot realisticallymodel concrete damage and failure in general situations wherefatigue may be combined with general nonlinear triaxial behaviorof concrete. To develop such a model is the objective of this article.
2. Formulation of constitutive model for fatigue damage
2.1. Overview of microplane model M7
Similar to Taylor models for polycrystalline metals [28–31], thebasic idea of the microplane constitutive models, due to Taylor[32], is to express the constitutive law not in terms of tensorsbut in terms of the stress and strain vectors acting on generic planeof arbitrary orientation within the material, which is called themicroplane. The use of vectors is conceptually simpler. It makespossible a semi-intuitive use of physical concepts such as frictionalslip, microcrack opening and compression splitting (in the classicaltensorial approach, the internal friction, for example, is repre-sented by a relation between the first and second invariants eventhough it occurs only on planes of distinct orientation). Initially
K. Kirane, Z.P. Bazant / International Journal of Fatigue 70 (2015) 93–105 95
the computational demands of the microplane model have beenconsidered excessive, but with the current computer power micro-plane models have been run on systems of tens of millions of finiteelements. Since computational demands of constitutive modelsincrease with the structural system size linearly and those of sys-tem analysis quadratically, the difference between a simple tenso-rial constitutive model and the microplane model becomesnegligible for very large systems.
In Taylor models, the stress vectors are assumed to be the pro-jections of the stress tensor. However, this assumption would leadto instability in the case of strain softening. To ensure stable behav-ior, the microplane models consider a kinematic rather than staticconstraint of the microplanes, which means that the strain vectoron the microplane is a projection of the strain tensor, and the stresstensor is obtained from the microplane stress vectors variationally,via principle of virtual work [33,34]. Also, in contrast to the Taylormodels, the elastic deformation must, in the case of strain soften-ing, be included on the microplane level. Considering the micro-planes of all possible spatial orientations satisfies the tensorialinvariance requirements. Capturing the interactions among variousorientations makes the microplane model semi-multiscale in nat-ure. Interactions at distance are, of course, not captured.
Microplane model M7 [35,36] is the latest version of progres-sively improved microplane models M1, M2, . . . , developed forconcrete since 1985 [34,37]. Microplane models have also beenalso been developed for clays, soils, rocks, orthotropic foams, annu-lus fibrosus, shape memory alloy and fiber composites, both lami-nated (pre-preg or woven) and braided. Supplemented by asuitable localization limiter with a material characteristic length,such as the nonlocal model or the crack band model, model M7has been shown to give very realistic response for a diverse rangeof loading conditions, including uniaxial, biaxial and triaxial load-ings with post-peak softening, unconfined and confined compres-sion, tension-shear failures, vertex effects when compressionsoftening is followed by torsion [36,15], opening and mixed modefractures, and compression–tension unloading and reloading up toa few cycles. What has been missing is the case of many cycles andfatigue loading, which is the objective of this study.
The basic mathematical structure of M7 is derived from ther-modynamic potentials for three regimes, viz. elastic, damage andplastic-frictional. Stress–strain boundaries (or strain-dependentyield limits) are imposed on the microplanes. To distinguishbetween compression at low and high confinement, differentboundaries are imposed on the volumetric and deviatoric compres-sive stresses on the microplanes. In addition, there is boundary onthe tensile normal strains and a plastic-frictional boundary on themicroplane shear stress depending on the normal stress and vol-ume change. There are seven free, easily adjustable materialparameters, which make it possible to match the given compres-sive strength, the corresponding strain, the given hydrostatic com-pression curve, and certain triaxial aspects. Besides, there are manyfixed, hard-to-adjust, parameters, which are the same for all con-cretes. For details, see [35]. The numerical algorithm of M7 is expli-cit, and thus in each load step the stress tensor is obtained from thestrain tensor, with no iterative loops. This makes the model robustand a suitable choice for large-scale finite element computationsrequired for fatigue analyses.
2.2. Measure of cyclic damage
In microplane model M7, the elastic modulus EN for the normalmicroplane strain �N on microplane number l is assumed toundergo damage according to the equation:
ENðlÞEN0
¼ exp �A�0þN ðlÞ
� �ð2Þ
Here ENðlÞ is the damaged normal modulus of the lth microplane,EN0 is the original undamaged modulus, A is a material constant(which is referred to as c13 in [35]) and �0þ
N ðlÞ is the maximumstrain reached so far on the lth microplane. This history depen-dence of the normal strain measure suffices for modeling only afew load cycles but is found to be insufficient for fatigue.
If used for more cycles, it does not predict the right trend ofcompliance evolution, and differs from the Paris law. To effectivelypredict the fatigue response under several hundreds or thousandsof cycles, a new damage measure is proposed here.
It is expected that the accumulation of cracking damage duringcyclic loading can be characterized by accumulated damage in thevolumetric strain �V . The cyclic damage measure, denoted as f, cannever decrease. It is calculated as the path length of the inelasticvolumetric strain in the strain space. The path length, calculatedseparately for each material point, may be interpreted as an intrin-sic time in the endochronic theory of inelastic behavior [38], whichwas used quite effectively for metals in [39] and for concrete in[38], though not at high numbers of cycles.
To describe this mathematically, consider a material point incyclically loaded specimen, in a given load increment during acycle, increasing or decreasing. Let d�V ; d�e
V and d�00V be the incre-ments of total, elastic and inelastic volumetric strains, respectively.Therefore we have, d�V ¼ d�e
V þ d�00V . Now, if drV is the increment ofvolumetric stress and Kb is instantaneous bulk modulus, we haved�e
V ¼ drV=Kb (the suffix b is used to distinguish the bulk modulusfrom the stress intensity factor K). Then, if f0 is the damage param-eter at the beginning of the increment, then the value f at the endof the increment is given by
f ¼ f0 þ df; df ¼ jd�00V j ð3Þ
The absolute value must be considered because the materialundergoes irreversible damage even during the unloading part ofthe cycle, as evidenced from the experimental unload–reloadresponse of concrete structures [10]. For ceramics, the damageduring unloading was attributed to the reduction in fatigue crackshielding mechanisms in [8]. But the physical source of thisbehavior in concrete is not fully understood. In several existingformulations [20,21,40], the slope of the unloading branch had tobe intuitively assumed to be somewhere between the elastic slopeand the secant slope toward the origin. This, of course, introducesempiricism and takes away prediction capability. The microplanemodel automatically predicts this because even after the start ofoverall unloading, some microplanes are still loading and alsobecause the newly introduced damage measure never decreases.Simulations with model M7 indicate that this fact suffices to cap-ture, with no empirical assumptions, the essence of fatigueresponse, viz., the unloading–reloading hysteresis.
Furthermore, it is considered here that the cyclic damageaccumulates only under tension and not under compression. Theadditional dissipative losses due to friction and slip under com-pression are accounted for automatically in the crack band bythe inclined microplanes that are slipping under compression. Onthe other hand, in the model of [18] these losses are not automaticand had to be modeled separately by a contact constraint betweenthe cohesive crack faces.
2.3. Instantaneous value of the bulk modulus Kb
Accurate representation of the increments of inelastic volumet-ric strain requires calculating the degradation of the instantaneousbulk modulus. It is intuitive to note that the degradation of normalmicroplane moduli EN is related to the damaged macroscopic bulkmodulus. This relationship will now be proven rigorously.
According to the virtual work principle applied to an elemen-tary unit sphere of material (of volume 4p=3), the increment DrV
96 K. Kirane, Z.P. Bazant / International Journal of Fatigue 70 (2015) 93–105
of volumetric stress rV is in equilibrium with the increments DrN
of microplane normal stresses rN if and only if2P3
DrVdij ¼Z
XDrNNijdX ð4Þ
where Nij ¼ ninj (components of N ¼ n� n), n are the Cartesiancomponents of normal microplane unit vector n of unit hemispheresurface X (for detail see [35]). Since DrV ¼ 3KbD�V and DrN ¼END�N , we have
3KbD�Vdij ¼3
2p
ZX
END�NNijdX ð5Þ
This expression is non-zero only when i ¼ j, and since Nii ¼ nini ¼ 1and dii ¼ 3, we get,
3KbD�V ¼1
2p
ZX
END�NdX ð6Þ
Now, D�V ¼ 13 D�kldkl and D�N ¼ D�klNkl, and so
Kbdkl �1
2p
ZX
ENNkldX� �
D�kl ¼ 0 ð7Þ
This is a variational equation that must hold for any D�kl, and so theterm in the parenthesis must vanish. So,
Kbdkl ¼1
2p
ZX
ENNkldX ð8Þ
Again, the above expression is non-zero only if k ¼ l. SinceNkk ¼ nknk ¼ 1, we finally obtain the instantaneous value of bulkmodulus:
Kb ¼1
6p
ZX
ENdX ð9Þ
As a check, note that if EN is the same for all the microplanes, whichis the case for purely elastic case, Eq. (9) reduces toKb ¼ EN=6pð Þ
RX dX ¼ EN=3 because
RX dX ¼ 2p, i.e., over the surface
of a unit hemisphere. To evaluate this integral in a finite elementprogram, one may use the optimal Gaussian numerical integrationformula for a spherical surface, which reads:
Kb ¼23
XNl
l¼1
wlENðlÞ ð10Þ
where Nl is the number of microplanes; and ENðlÞ and wl are thenormal modulus values and weights for microplanes with unitnormals nl specified by the Gaussian integration formula [34].
2.4. Material softening law
The next step is to characterize the material stiffness degrada-tion as a function of the accumulated damage. To achieve a modelapplicable to both cyclic crack growth and general nonlineartriaxial softening behavior, microplane model M7 needs to beextended to cyclic loading in a way that would not affect theprevious calibration of M7 by triaxial data. Let the damage stateof the material on a generic microplane be characterized bydamage parameter x ¼ EN=EN0 such that x ¼ 1 in the undamagedstate and x ¼ 0 in the fully damaged state. The existing softeninglaw given by Eq. (2) can be rewritten as
x ¼ exp �A�0þN
� �ð11Þ
Now, let xcyc be the material softening damage due to cyclic load-ing. characterized as xcyc ¼ f ðfÞ where function f ðfÞ needs to befound so as to simulate the Paris law for fatigue crack growth. Sowe generalize the last equation as,
x ¼ exp �A�0þN
� �xcyc ¼ expð�A�0þ
N Þf ðfÞ ð12Þ
To obtain the dependence of x on the path length f, one mayuse an analogy with the Paris law, in which the rate of fatigue crackgrowth da=dN continuously increases in proportion to a power ofDK. Accordingly, the following continuously increasing rate ofdamage accumulation is introduced:
dxcyc
df¼ �sfp ð13Þ
Here s and p are material parameters and the negative sign impliesa decrease in xcyc with an increase in f. It should be noted that therate of damage accumulation is defined with respect to f, the inter-nal time, and not the actual time or the cycle number. Thus theformulation is free from any explicit dependence on the cyclenumber, which is important when the cycles are non-periodic, withvariable amplitudes and shapes. Now, we integrate the above powerlaw, which gives
xcyc ¼ �Z
sfpdf ¼ �C � sfpþ1
pþ 1ð14Þ
where �C is the integration constant. It is evident, that the value of �Cis equal to unity, since when f ¼ 0; xcyc ¼ 1. Therefore we have,
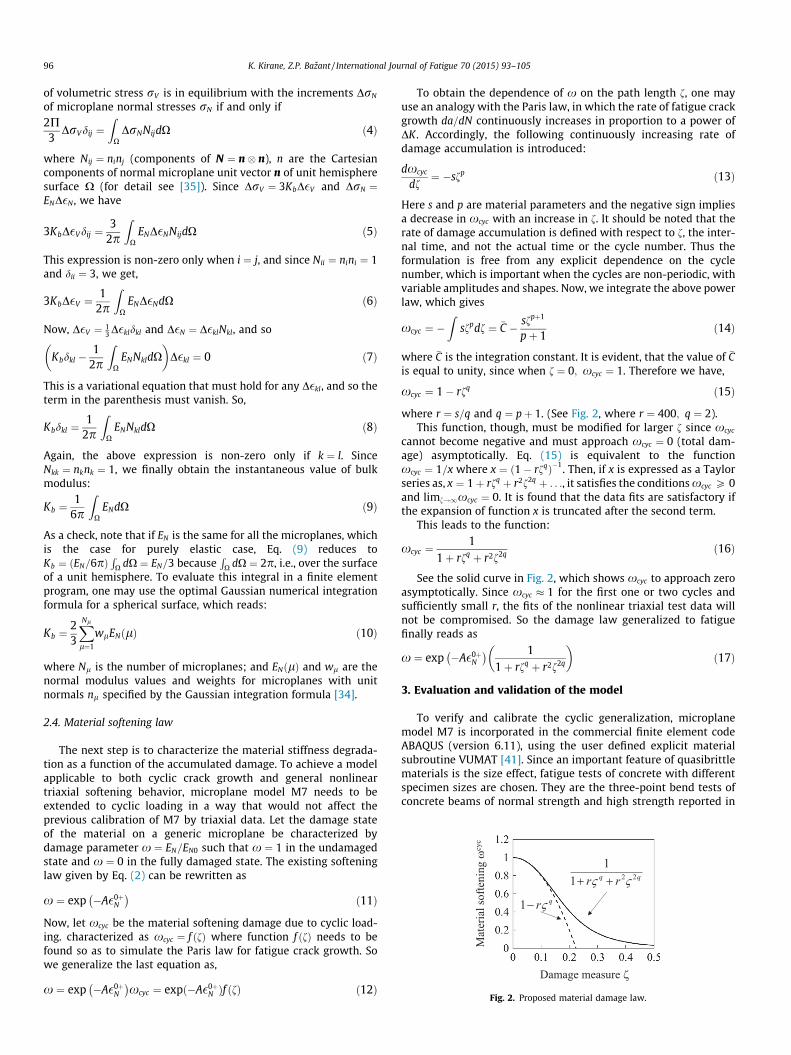
xcyc ¼ 1� rfq ð15Þ
where r ¼ s=q and q ¼ pþ 1. (See Fig. 2, where r ¼ 400; q ¼ 2).This function, though, must be modified for larger f since xcyc
cannot become negative and must approach xcyc ¼ 0 (total dam-age) asymptotically. Eq. (15) is equivalent to the functionxcyc ¼ 1=x where x ¼ ð1� rfqÞ�1. Then, if x is expressed as a Taylorseries as, x ¼ 1þ rfq þ r2f2q þ . . ., it satisfies the conditions xcyc P 0and limf!1xcyc ¼ 0. It is found that the data fits are satisfactory ifthe expansion of function x is truncated after the second term.
This leads to the function:
xcyc ¼1
1þ rfq þ r2f2q ð16Þ
See the solid curve in Fig. 2, which shows xcyc to approach zeroasymptotically. Since xcyc � 1 for the first one or two cycles andsufficiently small r, the fits of the nonlinear triaxial test data willnot be compromised. So the damage law generalized to fatiguefinally reads as
x ¼ exp �A�0þN
� � 11þ rfq þ r2f2q
� �ð17Þ
3. Evaluation and validation of the model
To verify and calibrate the cyclic generalization, microplanemodel M7 is incorporated in the commercial finite element codeABAQUS (version 6.11), using the user defined explicit materialsubroutine VUMAT [41]. Since an important feature of quasibrittlematerials is the size effect, fatigue tests of concrete with differentspecimen sizes are chosen. They are the three-point bend tests ofconcrete beams of normal strength and high strength reported in
Fig. 2. Proposed material damage law.
P
S=2.5D
a0=D/6D
b
Time [sec]
P/P p
eak
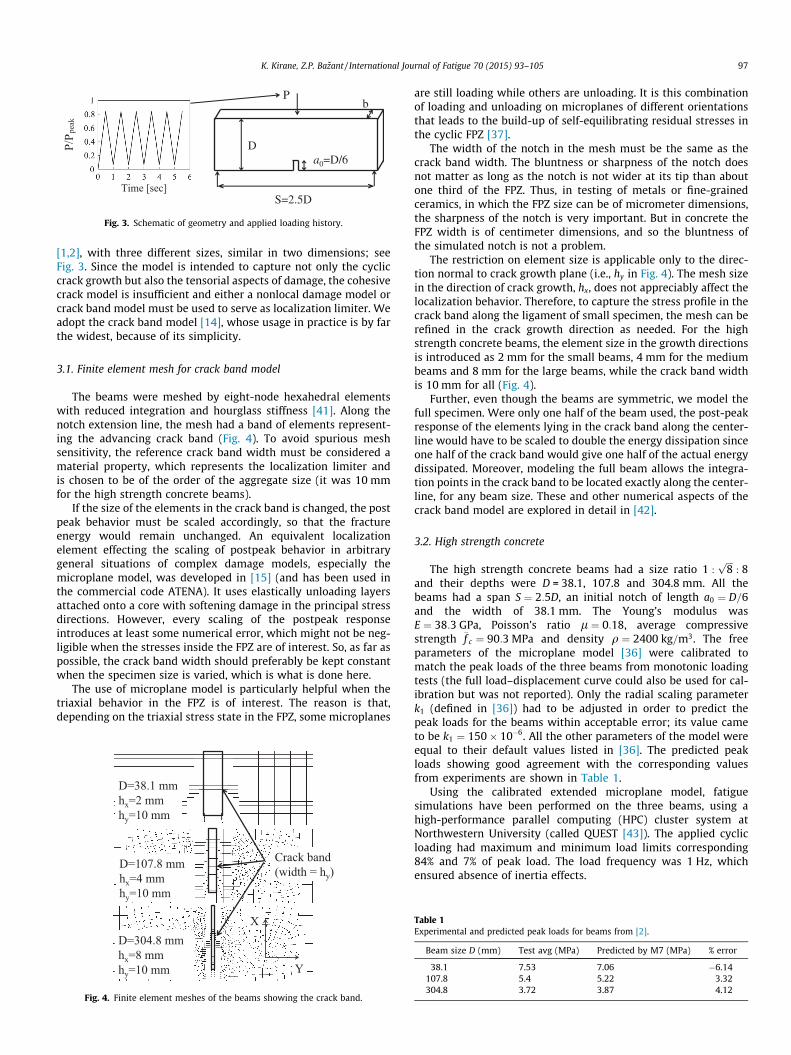
Fig. 3. Schematic of geometry and applied loading history.
K. Kirane, Z.P. Bazant / International Journal of Fatigue 70 (2015) 93–105 97
[1,2], with three different sizes, similar in two dimensions; seeFig. 3. Since the model is intended to capture not only the cycliccrack growth but also the tensorial aspects of damage, the cohesivecrack model is insufficient and either a nonlocal damage model orcrack band model must be used to serve as localization limiter. Weadopt the crack band model [14], whose usage in practice is by farthe widest, because of its simplicity.
3.1. Finite element mesh for crack band model
The beams were meshed by eight-node hexahedral elementswith reduced integration and hourglass stiffness [41]. Along thenotch extension line, the mesh had a band of elements represent-ing the advancing crack band (Fig. 4). To avoid spurious meshsensitivity, the reference crack band width must be considered amaterial property, which represents the localization limiter andis chosen to be of the order of the aggregate size (it was 10 mmfor the high strength concrete beams).
If the size of the elements in the crack band is changed, the postpeak behavior must be scaled accordingly, so that the fractureenergy would remain unchanged. An equivalent localizationelement effecting the scaling of postpeak behavior in arbitrarygeneral situations of complex damage models, especially themicroplane model, was developed in [15] (and has been used inthe commercial code ATENA). It uses elastically unloading layersattached onto a core with softening damage in the principal stressdirections. However, every scaling of the postpeak responseintroduces at least some numerical error, which might not be neg-ligible when the stresses inside the FPZ are of interest. So, as far aspossible, the crack band width should preferably be kept constantwhen the specimen size is varied, which is what is done here.
The use of microplane model is particularly helpful when thetriaxial behavior in the FPZ is of interest. The reason is that,depending on the triaxial stress state in the FPZ, some microplanes
D=38.1 mmhx=2 mm hy=10 mm
D=107.8 mmhx=4 mmhy=10 mm
D=304.8 mmhx=8 mmhy=10 mm
Crack band (width = hy)
X
Y
Fig. 4. Finite element meshes of the beams showing the crack band.
are still loading while others are unloading. It is this combinationof loading and unloading on microplanes of different orientationsthat leads to the build-up of self-equilibrating residual stresses inthe cyclic FPZ [37].
The width of the notch in the mesh must be the same as thecrack band width. The bluntness or sharpness of the notch doesnot matter as long as the notch is not wider at its tip than aboutone third of the FPZ. Thus, in testing of metals or fine-grainedceramics, in which the FPZ size can be of micrometer dimensions,the sharpness of the notch is very important. But in concrete theFPZ width is of centimeter dimensions, and so the bluntness ofthe simulated notch is not a problem.
The restriction on element size is applicable only to the direc-tion normal to crack growth plane (i.e., hy in Fig. 4). The mesh sizein the direction of crack growth, hx, does not appreciably affect thelocalization behavior. Therefore, to capture the stress profile in thecrack band along the ligament of small specimen, the mesh can berefined in the crack growth direction as needed. For the highstrength concrete beams, the element size in the growth directionsis introduced as 2 mm for the small beams, 4 mm for the mediumbeams and 8 mm for the large beams, while the crack band widthis 10 mm for all (Fig. 4).
Further, even though the beams are symmetric, we model thefull specimen. Were only one half of the beam used, the post-peakresponse of the elements lying in the crack band along the center-line would have to be scaled to double the energy dissipation sinceone half of the crack band would give one half of the actual energydissipated. Moreover, modeling the full beam allows the integra-tion points in the crack band to be located exactly along the center-line, for any beam size. These and other numerical aspects of thecrack band model are explored in detail in [42].
3.2. High strength concrete
The high strength concrete beams had a size ratio 1 :ffiffiffi8p
: 8and their depths were D = 38.1, 107.8 and 304.8 mm. All thebeams had a span S ¼ 2:5D, an initial notch of length a0 ¼ D=6and the width of 38.1 mm. The Young’s modulus wasE ¼ 38:3 GPa, Poisson’s ratio l ¼ 0:18, average compressivestrength �f c ¼ 90:3 MPa and density q ¼ 2400 kg=m3. The freeparameters of the microplane model [36] were calibrated tomatch the peak loads of the three beams from monotonic loadingtests (the full load–displacement curve could also be used for cal-ibration but was not reported). Only the radial scaling parameterk1 (defined in [36]) had to be adjusted in order to predict thepeak loads for the beams within acceptable error; its value cameto be k1 ¼ 150� 10�6. All the other parameters of the model wereequal to their default values listed in [36]. The predicted peakloads showing good agreement with the corresponding valuesfrom experiments are shown in Table 1.
Using the calibrated extended microplane model, fatiguesimulations have been performed on the three beams, using ahigh-performance parallel computing (HPC) cluster system atNorthwestern University (called QUEST [43]). The applied cyclicloading had maximum and minimum load limits corresponding84% and 7% of peak load. The load frequency was 1 Hz, whichensured absence of inertia effects.
Table 1Experimental and predicted peak loads for beams from [2].
Beam size D (mm) Test avg (MPa) Predicted by M7 (MPa) % error
38.1 7.53 7.06 �6.14107.8 5.4 5.22 3.32304.8 3.72 3.87 4.12
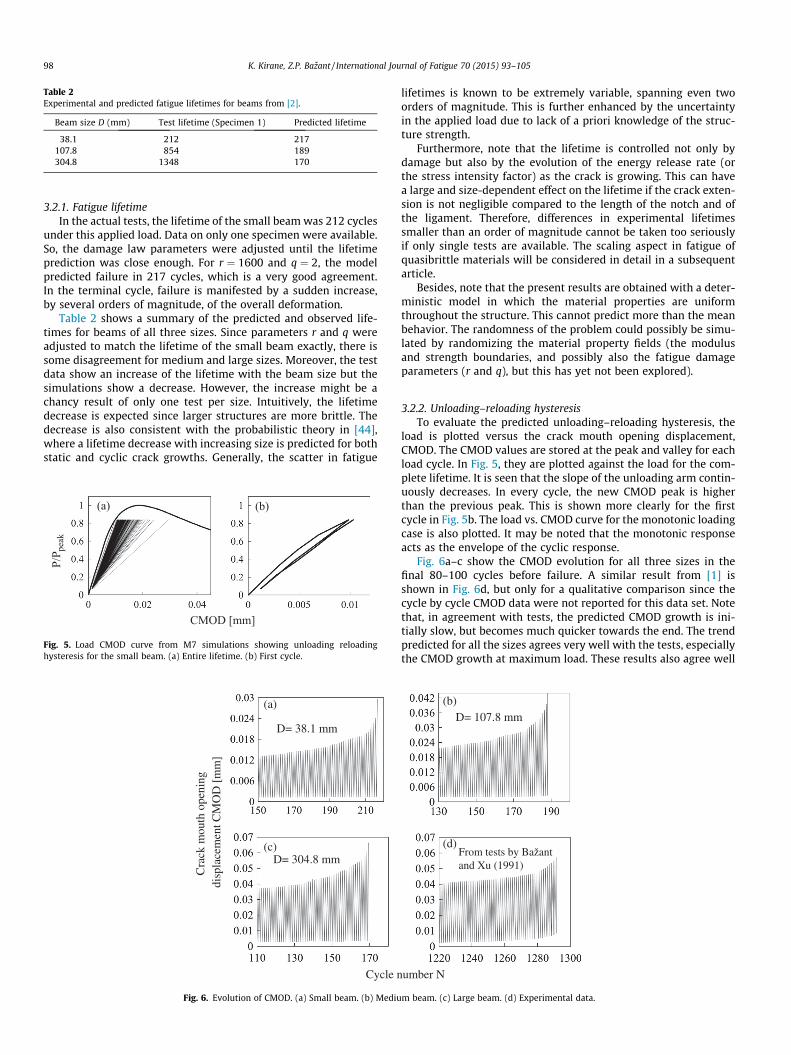
Table 2Experimental and predicted fatigue lifetimes for beams from [2].
Beam size D (mm) Test lifetime (Specimen 1) Predicted lifetime
38.1 212 217107.8 854 189304.8 1348 170
98 K. Kirane, Z.P. Bazant / International Journal of Fatigue 70 (2015) 93–105
3.2.1. Fatigue lifetimeIn the actual tests, the lifetime of the small beam was 212 cycles
under this applied load. Data on only one specimen were available.So, the damage law parameters were adjusted until the lifetimeprediction was close enough. For r ¼ 1600 and q ¼ 2, the modelpredicted failure in 217 cycles, which is a very good agreement.In the terminal cycle, failure is manifested by a sudden increase,by several orders of magnitude, of the overall deformation.
Table 2 shows a summary of the predicted and observed life-times for beams of all three sizes. Since parameters r and q wereadjusted to match the lifetime of the small beam exactly, there issome disagreement for medium and large sizes. Moreover, the testdata show an increase of the lifetime with the beam size but thesimulations show a decrease. However, the increase might be achancy result of only one test per size. Intuitively, the lifetimedecrease is expected since larger structures are more brittle. Thedecrease is also consistent with the probabilistic theory in [44],where a lifetime decrease with increasing size is predicted for bothstatic and cyclic crack growths. Generally, the scatter in fatigue
CMOD [mm]
P/P p
eak
(a) (b)
Fig. 5. Load CMOD curve from M7 simulations showing unloading reloadinghysteresis for the small beam. (a) Entire lifetime. (b) First cycle.
Cycle n
Cra
ck m
outh
ope
ning
di
spla
cem
ent C
MO
D [
mm
]
D= 38.1 mm
D= 304.8 mm(c)
(a)
Fig. 6. Evolution of CMOD. (a) Small beam. (b) Mediu
lifetimes is known to be extremely variable, spanning even twoorders of magnitude. This is further enhanced by the uncertaintyin the applied load due to lack of a priori knowledge of the struc-ture strength.
Furthermore, note that the lifetime is controlled not only bydamage but also by the evolution of the energy release rate (orthe stress intensity factor) as the crack is growing. This can havea large and size-dependent effect on the lifetime if the crack exten-sion is not negligible compared to the length of the notch and ofthe ligament. Therefore, differences in experimental lifetimessmaller than an order of magnitude cannot be taken too seriouslyif only single tests are available. The scaling aspect in fatigue ofquasibrittle materials will be considered in detail in a subsequentarticle.
Besides, note that the present results are obtained with a deter-ministic model in which the material properties are uniformthroughout the structure. This cannot predict more than the meanbehavior. The randomness of the problem could possibly be simu-lated by randomizing the material property fields (the modulusand strength boundaries, and possibly also the fatigue damageparameters (r and q), but this has yet not been explored).
3.2.2. Unloading–reloading hysteresisTo evaluate the predicted unloading–reloading hysteresis, the
load is plotted versus the crack mouth opening displacement,CMOD. The CMOD values are stored at the peak and valley for eachload cycle. In Fig. 5, they are plotted against the load for the com-plete lifetime. It is seen that the slope of the unloading arm contin-uously decreases. In every cycle, the new CMOD peak is higherthan the previous peak. This is shown more clearly for the firstcycle in Fig. 5b. The load vs. CMOD curve for the monotonic loadingcase is also plotted. It may be noted that the monotonic responseacts as the envelope of the cyclic response.
Fig. 6a–c show the CMOD evolution for all three sizes in thefinal 80–100 cycles before failure. A similar result from [1] isshown in Fig. 6d, but only for a qualitative comparison since thecycle by cycle CMOD data were not reported for this data set. Notethat, in agreement with tests, the predicted CMOD growth is ini-tially slow, but becomes much quicker towards the end. The trendpredicted for all the sizes agrees very well with the tests, especiallythe CMOD growth at maximum load. These results also agree well
umber N
D= 107.8 mm
From tests by Bažant and Xu (1991)
(d)
(b)
m beam. (c) Large beam. (d) Experimental data.

Cycle 1 Cycle 100 Cycle 217
S22 MPa
Fig. 7. Various stages of predicted cyclic FPZ.
Distance from notch tip [mm]
Stre
ss S
22[M
Pa] Cycle 217
Cycle 100Cycle 1
Fig. 8. Evolution of the predicted stress profile in the cyclic FPZ.
K. Kirane, Z.P. Bazant / International Journal of Fatigue 70 (2015) 93–105 99
with other experiments [17,23] and verify that the model describeswell the essential features of fatigue.
3.2.3. Sub-critical fatigue crack propagationFig. 7a–c show three stages of the cyclic FPZ in the simulation of
the small beam, viz. the formation, detachment and propagation.The FPZ is visualized via a contour plot of the stress in the y-direc-tion or S22 (normal to the notch direction) at maximum load incycles 1, 100 and 217. The corresponding stress profile in the crackband at maximum load in these cycles is shown in Fig. 8. The FPZ isseen to develop around the notch tip in the first cycle itself. Whenthe maximum load is reached, the maximum stress is actually at asmall distance away from the notch tip (not at the tip), indicatingthat some softening has already taken place in this region.
With continued cycling, the near tip region softens further,thereby causing a slow increase in the compliance of the structure.This continues until about the 100th cycle, at which point there issufficient local softening so as to cause the stress peak to moveaway from the tip. In Fig. 7b this is seen as the detachment andmovement of the FPZ away from the tip, essentially implyingsub-critical growth of the fatigue crack. The term ‘sub-critical’ indi-cates that crack growth occurs at stress intensity factors (KI) thatare smaller than the critical KIC for monotonic loading. For struc-tures of positive geometry, which is the present case, crack growth
(a)
Fig. 9. Evolution of (a) damage measure f (b) deg
causes KI for increase. More and more elements in the crack bandcontinue to undergo softening and the FPZ moves farther awayfrom the notch tip. Finally, once the FPZ has moved by a criticaldistance at which KI has grown to its critical value KIC (Fig. 7c), sta-bility is lost and the structure fails dynamically. In this particularsimulation, this occurred during the 217th cycle.
For further explanation, the damage variable f and the degree ofcyclic damage xcyc are plotted in Fig. 9a and b against the cyclenumber, for the first four elements in the crack band. The elementsare labeled 1 through 4, with element 1 being the closest to thenotch tip. Although the applied load is cyclic, the damage measuref increases continuously, as the damage accumulates during bothloading and unloading. In any given cycle, the value of f in element1 is the highest, progressively decreasing as the crack growth. Thetrend of the FPZ growth and damage evolution is similar beams ofall sizes.
3.2.4. Sub-critical fatigue crack lengthFor quasibrittle fracture in concrete type materials, the material
heterogeneity and the diffuse character of microcracking at thecrack front make optical or acoustical determination of the effec-tive crack length impossible. The linear elastic fracture mechanics(LEFM) is inapplicable and one must use the equivalent LEFMapproximation [10], in which the effective crack length consideredas a ¼ a0 þ cf , where a0 is the length of the traction free crack; cf isapproximately equal to half the FPZ length and is defined preciselyby specimen stiffness (an exact ratio of cf to Irwin’s characteristiclength l0 is derived in [45]). The effective length of the growingcrack is thus measured indirectly by the compliance method, inboth experiment and calibration.
The CMOD compliance values CCMOD are defined as theunloading slopes on the load vs. CMOD plot. For various values ofthe notch length a0, the CMOD compliance is calculated by simu-lating one loading cycle at a very low maximum load. Then, a cubicpolynomial is obtained by regression, to relate CCMOD and a0. Thisprocess is repeated for each beam size.
To determine evolution of the sub-critical fatigue crack length,first the CCMOD is calculated in each cycle as the inverse slope ofthe unloading segment of the load-CMOD curve (Fig. 5). When
(b)
ree of material softening due to cycling xcyc:

Cycle number N
Nor
mal
ized
cra
ck le
ngth
α
From tests by Bazant and Schell, 1993
(a) (b)
Fig. 10. Evolution of normalized crack length. (a) Predicted (all 3 beams). (b) Typical curves from experiments.
100 K. Kirane, Z.P. Bazant / International Journal of Fatigue 70 (2015) 93–105
substituted into the previously fitted calibration polynomial, thiscompliance provides the effective crack length in that cycle. Thecrack length normalized by the structure size D is denoted as aand is plotted in Fig. 10a vs. the cycle number N, for all threebeams. For comparison, the typical curves from the experimentsare shown in Fig. 10b [2]. Again, the predicted trend of crackgrowth agrees quite well with the test data. It is seen that the crackgrowth is slow initially, and then becomes more and more rapidtowards final failure. The point at which the rate of crack growthsuddenly curves upwards also corresponds to when the FPZdetaches from the notch tip. These plots further verify the predic-tive capabilities of the model.
3.3. Normal strength concrete
Similar simulation results were obtained for the tests of normalstrength concrete beams reported in [1]. These beams had a sizeratio of 1 : 2 : 4. (See Fig. 3) and the sizes D of the small, mediumand large beams were 38.1, 76.2 and 152.4 mm, respectively. Allthe beams had a span S ¼ 2:5D and width of 38.1 mm. The initialnotch depth was a0 ¼ D=6. The finite element mesh was similarto that shown in Fig. 4 for high strength concrete beams. The crackband width was considered as 10 mm, which is approximatelyequal to the maximum aggregate size. The Young’s modulus wasE ¼ 27:12 GPa, Poisson’s ratio l ¼ 0:18, mean compressionstrength �f c ¼ 32:8 MPa, and density q ¼ 2400 kg=m3.
To match the monotonic loading response within acceptableerror, only the radial scaling parameter k1 had to be adjusted(k1 ¼ 140� 10�6). All the other parameters of the model wereequal to their default values listed in [36].
The calibrated monotonic response of all three beams iscompared against the experimental data in Fig. 11, which shows
Small
Medium
Large
CMOD [mm]
Loa
d [N
]
Fig. 11. Comparison of monotonic response of beams from [1] predicted by M7with experiments.
good agreement. The calibrated model was then used to performsimulations of fatigue crack growth on the beams with maximumand minimum loads equal to 80% and 0% of the monotonic peakload, as used in the tests. The frequency in simulations was 1 Hz,which was slightly higher in actual tests, but was still sufficientlylow to allow quasi-static calculations. The relevant damage lawparameters were r ¼ 750 and q ¼ 2:5. These were optimized soas to obtain both the right lifetime and the right crack growth rate.
Table 3 shows the predicted and observed lifetimes for thebeams of all three sizes and, again, the predictions agree withthe data. Here, the experimentally observed lifetimes show almostno size effect, but the simulations consistently predict decreasinglifetime with increasing size.
The normalized effective crack length a was determined foreach size by means of the compliance calibration method, asdescribed before. Fig. 12 shows a comparison of the predictedand experimentally obtained values of a plotted against the cyclenumber N for all three beams. The figure shows the agreement tobe quite satisfactory. Consistent with previous results, the pre-dicted and observed crack growth rates are slow initially, but rap-idly accelerate towards the end. The acceleration is not only amaterial property but is caused mainly by the growth of effectiveKI as the crack extends. These comparisons indicate that the sub-critical fatigue crack growth in both normal and high strength con-crete is predicted by the model realistically.
4. Paris law
The Paris law [3], Eq. (1), originally established empirically andrecently justified theoretically (based on probabilistic nano-mechanical arguments [44]), is the most widely used relation forfatigue crack growth. A complete Paris law plot extends beyondthe power-law range and typically has the sigmoidal shape shownin [4]. Thus the initial and final parts of the simulated plots lieoutside the Paris’ power-law regime. The initial part represents avery slow crack growth, below the threshold of power law, andthe final part represents accelerating growth toward failure. Thecentral linear part of the plot represents the Paris’ power law. Con-crete and some other other quasi-brittle materials such as toughceramics are known to have a high Paris law exponent, about10–50. A physical justification for this high value was providedusing atomistic arguments and multi-scale transitions in [44].
Table 3Experimental and predicted fatigue lifetimes for beams from [1].
Beam size D(mm)
Test lifetime(Specimen 1)
Test lifetime(Specimen 2)
Predictedlifetime
38.1 974 939 84876.2 850 1286 768
152.4 882 1083 755
Cycle number N
Nor
mal
ized
cra
ck le
ngth
α
(a) (b)
(c)
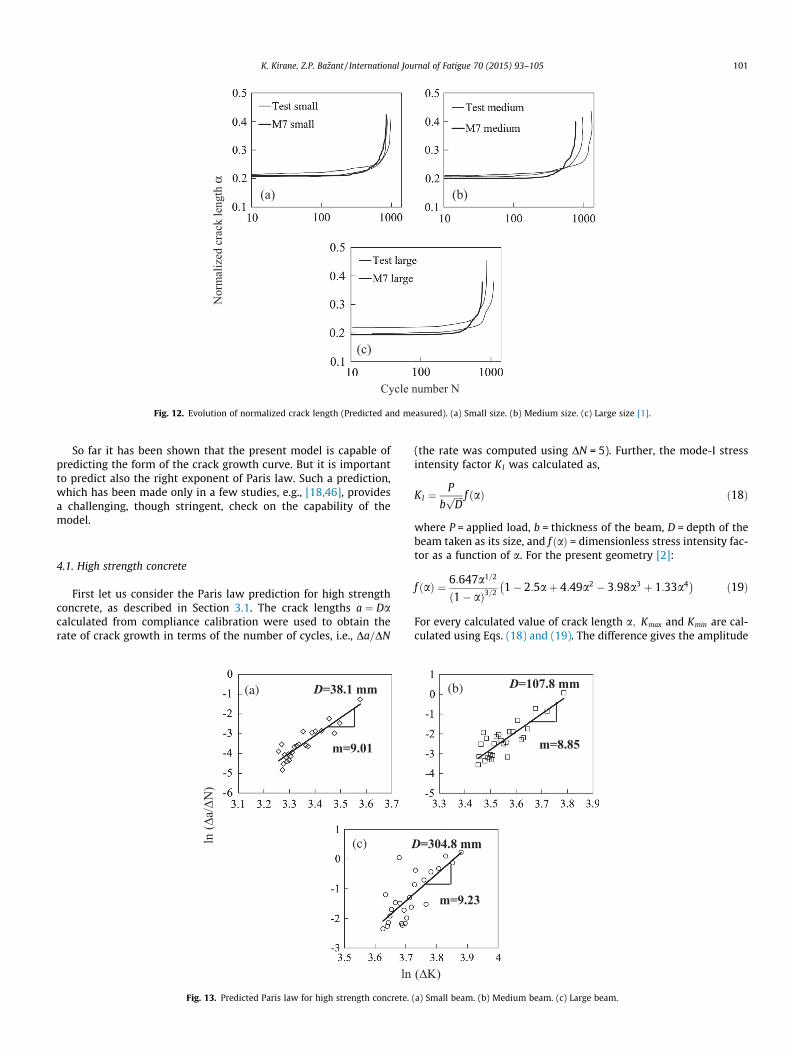
Fig. 12. Evolution of normalized crack length (Predicted and measured). (a) Small size. (b) Medium size. (c) Large size [1].
K. Kirane, Z.P. Bazant / International Journal of Fatigue 70 (2015) 93–105 101
So far it has been shown that the present model is capable ofpredicting the form of the crack growth curve. But it is importantto predict also the right exponent of Paris law. Such a prediction,which has been made only in a few studies, e.g., [18,46], providesa challenging, though stringent, check on the capability of themodel.
4.1. High strength concrete
First let us consider the Paris law prediction for high strengthconcrete, as described in Section 3.1. The crack lengths a ¼ Dacalculated from compliance calibration were used to obtain therate of crack growth in terms of the number of cycles, i.e., Da=DN
(a)
(c)
Fig. 13. Predicted Paris law for high strength concrete.
(the rate was computed using DN = 5). Further, the mode-I stressintensity factor KI was calculated as,
KI ¼P
bffiffiffiffiDp f ðaÞ ð18Þ
where P = applied load, b = thickness of the beam, D = depth of thebeam taken as its size, and f ðaÞ = dimensionless stress intensity fac-tor as a function of a. For the present geometry [2]:
f ðaÞ ¼ 6:647a1=2
ð1� aÞ3=2 1� 2:5aþ 4:49a2 � 3:98a3 þ 1:33a4� �ð19Þ
For every calculated value of crack length a; Kmax and Kmin are cal-culated using Eqs. (18) and (19). The difference gives the amplitude
(b)
(a) Small beam. (b) Medium beam. (c) Large beam.

Table 4Experimental and predicted Paris law parameters for beams from [2].
Beam ln C m
Test M7 Test M7
Small �33.67 �33.78 8.44 9.01Medium �35.61 �34.4 8.57 8.85Large �36.7 �34.82 9.61 9.23
Table 5Experimental and predicted Paris law exponent for beams from [1].
Beam size Test M7
Small 11.78 9.84Medium 9.97 10.05Large 9.27 10.18
102 K. Kirane, Z.P. Bazant / International Journal of Fatigue 70 (2015) 93–105
DK , and is plotted on a log–log plot, against Da=DN in Fig. 13a forthe small beam of high strength concrete (from Section 3.1).
The resulting plot resembles a typical Paris law plot includingthe initial slow crack growth regime followed by a regime of stablecrack growth (shown by small diamonds). When the amplitude,DK , reaches the critical value (KIC), the third regime begins. Thecrack grows dynamically which is manifested in the model ascollapse. The points for the dynamic growth are not a materialproperty and thus are not included in the plot.
As seen, a straight line, whose slope is the Paris exponent m, isfitted only through the stable crack growth regime (or the Parisregime), since the final acceleration is not a material property.Here, the calculations yield m ¼ 9:01. The tests of this beamyielded m ¼ 8:44. This is a relatively good agreement, which sug-gests that Eq. (16) is realistic. Obviously, the present model is ableto capture the high exponents m typical of quasibrittle materials.
By a similar calculation, the Paris law exponent is predicted forthe medium and large size beams, as shown in Fig. 13b and c. Thepredicted and experimental values of ln C and m from the individ-ual best fits are shown in Table 4 for all three beam sizes. As seen,the m values match the data well. The average m-value from theexperiments is 8.60 while from the simulations it is 9.03.
The agreement in the Paris law coefficient C is also good,especially for the small-size beam. This is no surprise, since the life-time calibration was performed on that beam. The reason why thepredicted C values are lower than the experimental values for themedium- and large-size beams must be that the predicted lifetimeswere correspondingly shorter. Nevertheless, the trend of scaling inC is consistent. The large scatter in experimental fatigue lifetimes
(a)
(c)
Fig. 14. Predicted Paris law for normal strength concrete
also causes scatter in the value of C. By contrast, the more importantparameter, exponent m, is relatively unaffected by the scatter.
4.2. Normal strength concrete
Although similar tests of normal strength concrete have beencarried out [1], only the number of cycles to failure and the mea-sured slope of the Paris law plot, giving exponent m, can be usedfrom these tests since an error in copying the formula for KI fromthe literature has been detected. Accordingly, the Paris law plotsare generated for all three normal strength concrete beams, fromthe simulations discussed in Section 3.2.
The damage law parameters are r ¼ 750 and q ¼ 2:5 (thisoptimum value of q differs from the optimum found for highstrength concrete, which was 2.0). The optimum value of r had tobe also adjusted, to match the observed number of cycles to failure.The Paris law exponent is obtained for each beam separately byfitting the linear segments of the data plots in Fig. 14. The valuesare shown in Table 5. The average exponent predicted from themodel is m ¼ 10:02, which is close to the experimental value of10.60 and serves as another validation of the model. It is thusdemonstrated that, with adjusted parameters, the proposed modelpredicts well the rate of sub-critical fatigue crack growth for bothnormal and high strength concrete.
4.3. Sensitivity to damage law parameters
The Paris law exponent and fatigue lifetime were seen todepend on parameters r and q. Furthermore they also depend onparameter A in Eq. (17), which coincides with one basic parameterof the microplane model and is a material property that must be
(b)
. (a) Small beam. (b) Medium beam. (c) Large beam.
(a) (b)
(c)
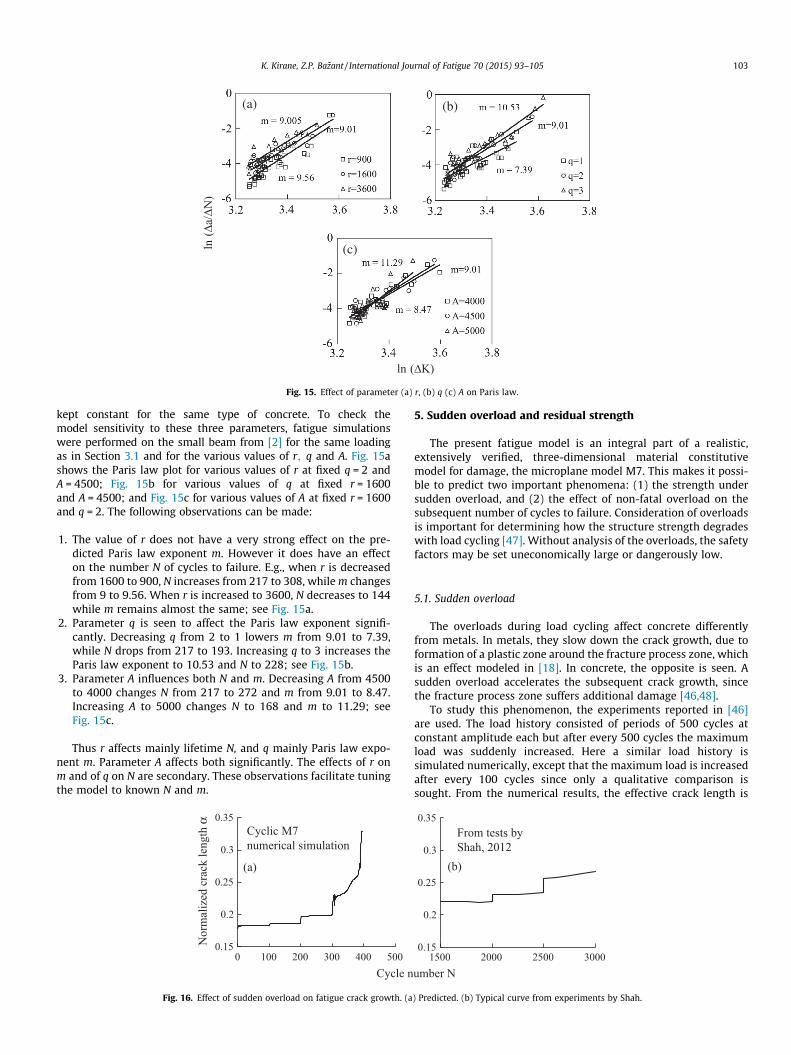
Fig. 15. Effect of parameter (a) r, (b) q (c) A on Paris law.
K. Kirane, Z.P. Bazant / International Journal of Fatigue 70 (2015) 93–105 103
kept constant for the same type of concrete. To check themodel sensitivity to these three parameters, fatigue simulationswere performed on the small beam from [2] for the same loadingas in Section 3.1 and for the various values of r; q and A. Fig. 15ashows the Paris law plot for various values of r at fixed q = 2 andA = 4500; Fig. 15b for various values of q at fixed r = 1600and A = 4500; and Fig. 15c for various values of A at fixed r = 1600and q = 2. The following observations can be made:
1. The value of r does not have a very strong effect on the pre-dicted Paris law exponent m. However it does have an effecton the number N of cycles to failure. E.g., when r is decreasedfrom 1600 to 900, N increases from 217 to 308, while m changesfrom 9 to 9.56. When r is increased to 3600, N decreases to 144while m remains almost the same; see Fig. 15a.
2. Parameter q is seen to affect the Paris law exponent signifi-cantly. Decreasing q from 2 to 1 lowers m from 9.01 to 7.39,while N drops from 217 to 193. Increasing q to 3 increases theParis law exponent to 10.53 and N to 228; see Fig. 15b.
3. Parameter A influences both N and m. Decreasing A from 4500to 4000 changes N from 217 to 272 and m from 9.01 to 8.47.Increasing A to 5000 changes N to 168 and m to 11.29; seeFig. 15c.
Thus r affects mainly lifetime N, and q mainly Paris law expo-nent m. Parameter A affects both significantly. The effects of r onm and of q on N are secondary. These observations facilitate tuningthe model to known N and m.
0.15
0.2
0.25
0.3
0.35
0 100 200 300 400 500Cycle n
Nor
mal
ized
cra
ck le
ngth
α
(a)
Cyclic M7 numerical simulation
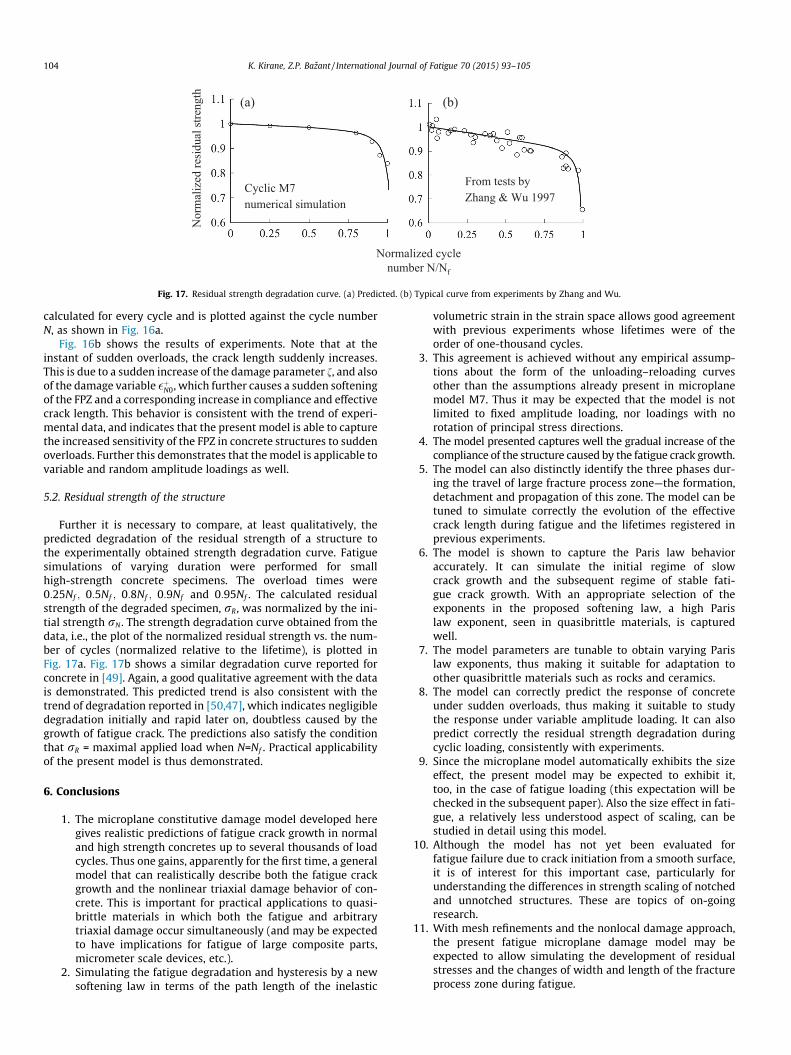
Fig. 16. Effect of sudden overload on fatigue crack growth. (a
5. Sudden overload and residual strength
The present fatigue model is an integral part of a realistic,extensively verified, three-dimensional material constitutivemodel for damage, the microplane model M7. This makes it possi-ble to predict two important phenomena: (1) the strength undersudden overload, and (2) the effect of non-fatal overload on thesubsequent number of cycles to failure. Consideration of overloadsis important for determining how the structure strength degradeswith load cycling [47]. Without analysis of the overloads, the safetyfactors may be set uneconomically large or dangerously low.
5.1. Sudden overload
The overloads during load cycling affect concrete differentlyfrom metals. In metals, they slow down the crack growth, due toformation of a plastic zone around the fracture process zone, whichis an effect modeled in [18]. In concrete, the opposite is seen. Asudden overload accelerates the subsequent crack growth, sincethe fracture process zone suffers additional damage [46,48].
To study this phenomenon, the experiments reported in [46]are used. The load history consisted of periods of 500 cycles atconstant amplitude each but after every 500 cycles the maximumload was suddenly increased. Here a similar load history issimulated numerically, except that the maximum load is increasedafter every 100 cycles since only a qualitative comparison issought. From the numerical results, the effective crack length is
0.15
0.2
0.25
0.3
0.35
1500 2000 2500 3000umber N
From tests by Shah, 2012
(b)
) Predicted. (b) Typical curve from experiments by Shah.
Normalized cycle number N/Nf
Nor
mal
ized
resi
dual
stre
ngth
From tests by Zhang & Wu 1997
(b)
Cyclic M7 numerical simulation
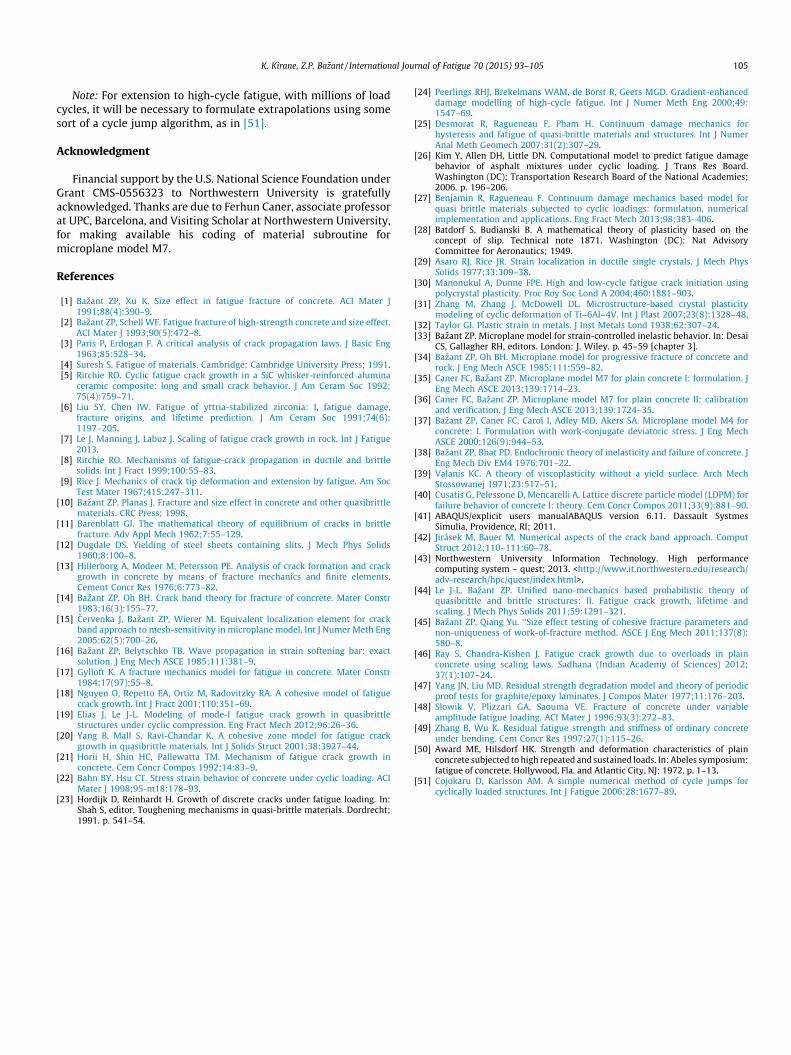
(a)
Fig. 17. Residual strength degradation curve. (a) Predicted. (b) Typical curve from experiments by Zhang and Wu.
104 K. Kirane, Z.P. Bazant / International Journal of Fatigue 70 (2015) 93–105
calculated for every cycle and is plotted against the cycle numberN, as shown in Fig. 16a.
Fig. 16b shows the results of experiments. Note that at theinstant of sudden overloads, the crack length suddenly increases.This is due to a sudden increase of the damage parameter f, and alsoof the damage variable �þN0, which further causes a sudden softeningof the FPZ and a corresponding increase in compliance and effectivecrack length. This behavior is consistent with the trend of experi-mental data, and indicates that the present model is able to capturethe increased sensitivity of the FPZ in concrete structures to suddenoverloads. Further this demonstrates that the model is applicable tovariable and random amplitude loadings as well.
5.2. Residual strength of the structure
Further it is necessary to compare, at least qualitatively, thepredicted degradation of the residual strength of a structure tothe experimentally obtained strength degradation curve. Fatiguesimulations of varying duration were performed for smallhigh-strength concrete specimens. The overload times were0:25Nf ; 0:5Nf ; 0:8Nf ; 0:9Nf and 0:95Nf . The calculated residualstrength of the degraded specimen, rR, was normalized by the ini-tial strength rN . The strength degradation curve obtained from thedata, i.e., the plot of the normalized residual strength vs. the num-ber of cycles (normalized relative to the lifetime), is plotted inFig. 17a. Fig. 17b shows a similar degradation curve reported forconcrete in [49]. Again, a good qualitative agreement with the datais demonstrated. This predicted trend is also consistent with thetrend of degradation reported in [50,47], which indicates negligibledegradation initially and rapid later on, doubtless caused by thegrowth of fatigue crack. The predictions also satisfy the conditionthat rR = maximal applied load when N=Nf . Practical applicabilityof the present model is thus demonstrated.
6. Conclusions
1. The microplane constitutive damage model developed heregives realistic predictions of fatigue crack growth in normaland high strength concretes up to several thousands of loadcycles. Thus one gains, apparently for the first time, a generalmodel that can realistically describe both the fatigue crackgrowth and the nonlinear triaxial damage behavior of con-crete. This is important for practical applications to quasi-brittle materials in which both the fatigue and arbitrarytriaxial damage occur simultaneously (and may be expectedto have implications for fatigue of large composite parts,micrometer scale devices, etc.).
2. Simulating the fatigue degradation and hysteresis by a newsoftening law in terms of the path length of the inelastic
volumetric strain in the strain space allows good agreementwith previous experiments whose lifetimes were of theorder of one-thousand cycles.
3. This agreement is achieved without any empirical assump-tions about the form of the unloading–reloading curvesother than the assumptions already present in microplanemodel M7. Thus it may be expected that the model is notlimited to fixed amplitude loading, nor loadings with norotation of principal stress directions.
4. The model presented captures well the gradual increase of thecompliance of the structure caused by the fatigue crack growth.
5. The model can also distinctly identify the three phases dur-ing the travel of large fracture process zone—the formation,detachment and propagation of this zone. The model can betuned to simulate correctly the evolution of the effectivecrack length during fatigue and the lifetimes registered inprevious experiments.
6. The model is shown to capture the Paris law behavioraccurately. It can simulate the initial regime of slowcrack growth and the subsequent regime of stable fati-gue crack growth. With an appropriate selection of theexponents in the proposed softening law, a high Parislaw exponent, seen in quasibrittle materials, is capturedwell.
7. The model parameters are tunable to obtain varying Parislaw exponents, thus making it suitable for adaptation toother quasibrittle materials such as rocks and ceramics.
8. The model can correctly predict the response of concreteunder sudden overloads, thus making it suitable to studythe response under variable amplitude loading. It can alsopredict correctly the residual strength degradation duringcyclic loading, consistently with experiments.
9. Since the microplane model automatically exhibits the sizeeffect, the present model may be expected to exhibit it,too, in the case of fatigue loading (this expectation will bechecked in the subsequent paper). Also the size effect in fati-gue, a relatively less understood aspect of scaling, can bestudied in detail using this model.
10. Although the model has not yet been evaluated forfatigue failure due to crack initiation from a smooth surface,it is of interest for this important case, particularly forunderstanding the differences in strength scaling of notchedand unnotched structures. These are topics of on-goingresearch.
11. With mesh refinements and the nonlocal damage approach,the present fatigue microplane damage model may beexpected to allow simulating the development of residualstresses and the changes of width and length of the fractureprocess zone during fatigue.
K. Kirane, Z.P. Bazant / International Journal of Fatigue 70 (2015) 93–105 105
Note: For extension to high-cycle fatigue, with millions of loadcycles, it will be necessary to formulate extrapolations using somesort of a cycle jump algorithm, as in [51].
Acknowledgment
Financial support by the U.S. National Science Foundation underGrant CMS-0556323 to Northwestern University is gratefullyacknowledged. Thanks are due to Ferhun Caner, associate professorat UPC, Barcelona, and Visiting Scholar at Northwestern University,for making available his coding of material subroutine formicroplane model M7.
References
[1] Bazant ZP, Xu K. Size effect in fatigue fracture of concrete. ACI Mater J1991;88(4):390–9.
[2] Bazant ZP, Schell WF. Fatigue fracture of high-strength concrete and size effect.ACI Mater J 1993;90(5):472–8.
[3] Paris P, Erdogan F. A critical analysis of crack propagation laws. J Basic Eng1963;85:528–34.
[4] Suresh S. Fatigue of materials. Cambridge: Cambridge University Press; 1991.[5] Ritchie RO. Cyclic fatigue crack growth in a SiC whisker-reinforced alumina
ceramic composite: long and small crack behavior. J Am Ceram Soc 1992;75(4):759–71.
[6] Liu SY, Chen IW. Fatigue of yttria-stabilized zirconia: I, fatigue damage,fracture origins, and lifetime prediction. J Am Ceram Soc 1991;74(6):1197–205.
[7] Le J, Manning J, Labuz J. Scaling of fatigue crack growth in rock. Int J Fatigue2013.
[8] Ritchie RO. Mechanisms of fatigue-crack propagation in ductile and brittlesolids. Int J Fract 1999;100:55–83.
[9] Rice J. Mechanics of crack tip deformation and extension by fatigue. Am SocTest Mater 1967;415:247–311.
[10] Bazant ZP, Planas J. Fracture and size effect in concrete and other quasibrittlematerials. CRC Press; 1998.
[11] Barenblatt GI. The mathematical theory of equilibrium of cracks in brittlefracture. Adv Appl Mech 1962;7:55–129.
[12] Dugdale DS. Yielding of steel sheets containing slits. J Mech Phys Solids1960;8:100–8.
[13] Hillerborg A, Modeer M, Petersson PE. Analysis of crack formation and crackgrowth in concrete by means of fracture mechanics and finite elements.Cement Concr Res 1976;6:773–82.
[14] Bazant ZP, Oh BH. Crack band theory for fracture of concrete. Mater Constr1983;16(3):155–77.
[15] Cervenka J, Bazant ZP, Wierer M. Equivalent localization element for crackband approach to mesh-sensitivity in microplane model. Int J Numer Meth Eng2005;62(5):700–26.
[16] Bazant ZP, Belytschko TB. Wave propagation in strain softening bar: exactsolution. J Eng Mech ASCE 1985;111:381–9.
[17] Gylloft K. A fracture mechanics model for fatigue in concrete. Mater Constr1984;17(97):55–8.
[18] Nguyen O, Repetto EA, Ortiz M, Radovitzky RA. A cohesive model of fatiguecrack growth. Int J Fract 2001;110:351–69.
[19] Elias J, Le J-L. Modeling of mode-I fatigue crack growth in quasibrittlestructures under cyclic compression. Eng Fract Mech 2012;96:26–36.
[20] Yang B, Mall S, Ravi-Chandar K. A cohesive zone model for fatigue crackgrowth in quasibrittle materials. Int J Solids Struct 2001;38:3927–44.
[21] Horii H, Shin HC, Pallewatta TM. Mechanism of fatigue crack growth inconcrete. Cem Concr Compos 1992;14:83–9.
[22] Bahn BY, Hsu CT. Stress strain behavior of concrete under cyclic loading. ACIMater J 1998;95-m18:178–93.
[23] Hordijk D, Reinhardt H. Growth of discrete cracks under fatigue loading. In:Shah S, editor. Toughening mechanisms in quasi-brittle materials. Dordrecht;1991. p. 541–54.
[24] Peerlings RHJ, Brekelmans WAM, de Borst R, Geers MGD. Gradient-enhanceddamage modelling of high-cycle fatigue. Int J Numer Meth Eng 2000;49:1547–69.
[25] Desmorat R, Ragueneau F, Pham H. Continuum damage mechanics forhysteresis and fatigue of quasi-brittle materials and structures. Int J NumerAnal Meth Geomech 2007;31(2):307–29.
[26] Kim Y, Allen DH, Little DN. Computational model to predict fatigue damagebehavior of asphalt mixtures under cyclic loading. J Trans Res Board.Washington (DC): Transportation Research Board of the National Academies;2006. p. 196–206.
[27] Benjamin R, Ragueneau F. Continuum damage mechanics based model forquasi brittle materials subjected to cyclic loadings: formulation, numericalimplementation and applications. Eng Fract Mech 2013;98:383–406.
[28] Batdorf S, Budianski B. A mathematical theory of plasticity based on theconcept of slip. Technical note 1871. Washington (DC): Nat AdvisoryCommittee for Aeronautics; 1949.
[29] Asaro RJ, Rice JR. Strain localization in ductile single crystals. J Mech PhysSolids 1977;33:309–38.
[30] Manonukul A, Dunne FPE. High and low-cycle fatigue crack initiation usingpolycrystal plasticity. Proc Roy Soc Lond A 2004;460:1881–903.
[31] Zhang M, Zhang J, McDowell DL. Microstructure-based crystal plasticitymodeling of cyclic deformation of Ti–6Al–4V. Int J Plast 2007;23(8):1328–48.
[32] Taylor GI. Plastic strain in metals. J Inst Metals Lond 1938;62:307–24.[33] Bazant ZP. Microplane model for strain-controlled inelastic behavior. In: Desai
CS, Gallagher RH, editors. London: J. Wiley. p. 45–59 [chapter 3].[34] Bazant ZP, Oh BH. Microplane model for progressive fracture of concrete and
rock. J Eng Mech ASCE 1985;111:559–82.[35] Caner FC, Bazant ZP. Microplane model M7 for plain concrete I: formulation. J
Eng Mech ASCE 2013;139:1714–23.[36] Caner FC, Bazant ZP. Microplane model M7 for plain concrete II: calibration
and verification. J Eng Mech ASCE 2013;139:1724–35.[37] Bazant ZP, Caner FC, Carol I, Adley MD, Akers SA. Microplane model M4 for
concrete: I. Formulation with work-conjugate deviatoric stress. J Eng MechASCE 2000;126(9):944–53.
[38] Bazant ZP, Bhat PD. Endochronic theory of inelasticity and failure of concrete. JEng Mech Div EM4 1976:701–22.
[39] Valanis KC. A theory of viscoplasticity without a yield surface. Arch MechStossowanej 1971;23:517–51.
[40] Cusatis G, Pelessone D, Mencarelli A. Lattice discrete particle model (LDPM) forfailure behavior of concrete I: theory. Cem Concr Compos 2011;33(9):881–90.
[41] ABAQUS/explicit users manualABAQUS version 6.11. Dassault SystmesSimulia, Providence, RI; 2011.
[42] Jirásek M, Bauer M. Numerical aspects of the crack band approach. ComputStruct 2012;110–111:60–78.
[43] Northwestern University Information Technology. High performancecomputing system – quest; 2013. <http://www.it.northwestern.edu/research/adv-research/hpc/quest/index.html>.
[44] Le J-L, Bazant ZP. Unified nano-mechanics based probabilistic theory ofquasibrittle and brittle structures: II. Fatigue crack growth, lifetime andscaling. J Mech Phys Solids 2011;59:1291–321.
[45] Bazant ZP, Qiang Yu. ‘‘Size effect testing of cohesive fracture parameters andnon-uniqueness of work-of-fracture method. ASCE J Eng Mech 2011;137(8):580–8.
[46] Ray S, Chandra-Kishen J. Fatigue crack growth due to overloads in plainconcrete using scaling laws. Sadhana (Indian Academy of Sciences) 2012;37(1):107–24.
[47] Yang JN, Liu MD. Residual strength degradation model and theory of periodicproof tests for graphite/epoxy laminates. J Compos Mater 1977;11:176–203.
[48] Slowik V, Plizzari GA, Saouma VE. Fracture of concrete under variableamplitude fatigue loading. ACI Mater J 1996;93(3):272–83.
[49] Zhang B, Wu K. Residual fatigue strength and stiffness of ordinary concreteunder bending. Cem Concr Res 1997;27(1):115–26.
[50] Award ME, Hilsdorf HK. Strength and deformation characteristics of plainconcrete subjected to high repeated and sustained loads. In: Abeles symposium:fatigue of concrete, Hollywood, Fla. and Atlantic City, NJ; 1972. p. 1–13.
[51] Cojokaru D, Karlsson AM. A simple numerical method of cycle jumps forcyclically loaded structures. Int J Fatigue 2006;28:1677–89.