International Journal of Exploring Emerging Trends in ... · PDF filetechniques for providing...
15
International Journal of Exploring Emerging Trends in Engineering (IJEETE) Vol. 04, Issue 06, NOV-DEC, 2017 Pg. 280 – 294 WWW.IJEETE.COM ISSN – 2394-0573 All Rights Reserved © 2017 IJEETE Page 280 COMPARATIVE ANALYSIS OF TWO DIFFERENT LOAD FLOW ITERATIVE TECHNIQUES USING AYEDE 330/132KV SUBSTATION AS CASE STUDY Adu, Michael Rotimi The Federal University of Technology, Akure School of Engineering and Engineering Technology Department of Electrical and Electronics Engineering [email protected] or [email protected] Cell Phone: +2348060352786 Abstract Load flow is an important tool used by power engineers for planning, to determine the best operation for a power system and exchange of power between utility companies. In order to have an efficient operating power system, it is necessary to determine which method is suitable and efficient for the system’s load flow analysis. This paper presents analysis of the load flow problem in power system planning studies. The numerical methods: Gauss-Seidel and Newton-Raphson were compared for a load flow analysis solution. Simulation is carried out using Matlab for test case of Ayede 330/132kV substation Ibadan Oyo-State. Ayede 330/132KV substation feeds seven different 132/33KV substations such as Ayede, Ibadan North, Ijebu ode, Iseyin, Iwo, Jericho, Sagamu substation. The simulation results were compared for number of iteration, computational time, tolerance value and convergence. The compared results show that Newton-Raphson is the most reliable method because it has the least number of iteration and converges faster. Keywords Load Flow, Bus, Newton-Raphson, Gauss-Seidel, Voltage Magnitude, Voltage Angle, Active Power, Reactive Power, Iteration, Convergence 1. Introduction Load-flow analysis is performed to determine the steady-state operation of an electric power system. It calculates the voltage drop on each feeder, the voltage at each bus, real power flow, reactive power flow and the power flow in feeder circuits. It determines if system voltage remain within specified limits under various contingency conditions and whether equipment such as transformers and conductors are overloaded; used to identify the need for additional generation, capacitive, or inductive VAR support or the placement of capacitors and/or reactors to maintain
Transcript of International Journal of Exploring Emerging Trends in ... · PDF filetechniques for providing...

International Journal of Exploring Emerging Trends in Engineering (IJEETE)
Vol. 04, Issue 06, NOV-DEC, 2017 Pg. 280 – 294 WWW.IJEETE.COM
ISSN – 2394-0573 All Rights Reserved © 2017 IJEETE Page 280
COMPARATIVE ANALYSIS OF TWO DIFFERENT LOAD FLOW ITERATIVE
TECHNIQUES USING AYEDE 330/132KV SUBSTATION AS CASE STUDY
Adu, Michael Rotimi
The Federal University of Technology, Akure
School of Engineering and Engineering Technology
Department of Electrical and Electronics Engineering
[email protected] or [email protected]
Cell Phone: +2348060352786
Abstract
Load flow is an important tool used by power engineers for planning, to determine the best
operation for a power system and exchange of power between utility companies. In order to have
an efficient operating power system, it is necessary to determine which method is suitable and
efficient for the system’s load flow analysis. This paper presents analysis of the load flow problem
in power system planning studies. The numerical methods: Gauss-Seidel and Newton-Raphson
were compared for a load flow analysis solution. Simulation is carried out using Matlab for test
case of Ayede 330/132kV substation Ibadan Oyo-State. Ayede 330/132KV substation feeds seven
different 132/33KV substations such as Ayede, Ibadan North, Ijebu ode, Iseyin, Iwo, Jericho,
Sagamu substation. The simulation results were compared for number of iteration, computational
time, tolerance value and convergence. The compared results show that Newton-Raphson is the
most reliable method because it has the least number of iteration and converges faster.
Keywords
Load Flow, Bus, Newton-Raphson, Gauss-Seidel, Voltage Magnitude, Voltage Angle, Active
Power, Reactive Power, Iteration, Convergence
1. Introduction
Load-flow analysis is performed to determine the steady-state operation of an electric
power system. It calculates the voltage drop on each feeder, the voltage at each bus, real power
flow, reactive power flow and the power flow in feeder circuits. It determines if system voltage
remain within specified limits under various contingency conditions and whether equipment such
as transformers and conductors are overloaded; used to identify the need for additional generation,
capacitive, or inductive VAR support or the placement of capacitors and/or reactors to maintain

International Journal of Exploring Emerging Trends in Engineering (IJEETE)
Vol. 04, Issue 06, NOV-DEC, 2017 Pg. 280 – 294 WWW.IJEETE.COM
ISSN – 2394-0573 All Rights Reserved © 2017 IJEETE Page 281
system voltages within specified limits, losses in each branch and total system power losses are
also calculated necessary for planning, economic scheduling and control of an existing system as
well as planning its future expansion.
Load flow study also consists of system network calculations to determine the performance
of the lines. These calculations are possible only when the real and reactive power flows, bus
voltages and system phase angles are known. In most utility systems, complete system study is
undertaken at regular intervals to complete this analysis, there are methods of mathematical
calculations which consist of numerous steps depending on the size of the system; the node-voltage
method is the most suitable form for many power system analyses. The formulation of the network
equations in the nodal admittance form results in complex linear simultaneous algebraic equations
in terms of node currents. When node currents are specified, the set of linear equations can be
solved for the node voltages. This process is difficult and takes a lot of times to perform by hand.
The objective of this report is to show the comparison between two load flow analysis methods
and determine the best that will help the analysis become easier. The economic load dispatch plays
an important role in the operation of power system and several traditional approaches are normally
used to provide solution to the problems but recently soft computing techniques have received
more attention and are used in a number of successful and practical applications. Iterative
techniques for providing solution to load flow problems are Gauss-Seidel method and Newton-
Raphson method, therefore there is need to determine which of the iterative technique is faster and
more reliable in order to have the best result for load flow analysis.
Moreso, through the load flow studies we can obtain the voltage magnitudes and angles at
each bus in the steady state. This is rather important as the magnitudes of the bus voltages are
required to be held within a specified limit. Once the bus voltage magnitudes and their angles are
computed using the load flow, the real and the reactive power flow through each line can be
computed. Also based on the difference between power flow in sending and receiving ends, the
losses in a particular line can also be computed. Furthermore, from the line flows we can also
determine the overload and loading conditions. The steady state power and reactive power supplied
by a bus in a power network are expressed in terms of non linear algebraic equations. This would
therefore require iterative steps for solving these equations. In this project two of the load flow
methods was used but the major advantages of Newton-Raphson method over Gauss-Seidel

International Journal of Exploring Emerging Trends in Engineering (IJEETE)
Vol. 04, Issue 06, NOV-DEC, 2017 Pg. 280 – 294 WWW.IJEETE.COM
ISSN – 2394-0573 All Rights Reserved © 2017 IJEETE Page 282
method are: it converges faster, the number of iterations are independent of the size of the system
and computation time per iteration is more unlike Gauss-Seidel method whose rate of convergence
is slower, computation time per iteration is less and the number of iterations required for
convergence increases with size of the buses.
2. Classification of Buses
A bus is defined as a node at which one or many lines, loads and generators are connected.
In a power system each node or bus is associated with four quantities such as magnitude of voltage
(/V/), phase angle of voltage (δ), active or real (P) and reactive power (Q). In load flow problem
two out of these four quantities are specified and the remaining two are required to be determined
by the solution of the equation. Depending on the quantities that have been specified, the buses are
classified into three categories. For load flow studies it is assumed that the loads are constant and
they are defined by their real and reactive power consumption. The main objective of the load flow
is to find the voltage magnitude of each bus and its angle when the power generated and load is
pre-specified. To facilitate this we classify the different buses of the power system.
The following are the classification of Bus:
2.1 Load bus (P-Q Bus)
A load bus is defined as any bus of the system for which the real and reactive power is specified.
Load buses may contain generators with specified real and reactive power outputs, However, it is
often convenient to designate any bus with specified injected complex power as a load complex
power S=P+JQ taken from or injected into the system. Such nodes may also include links to other
systems. At these load nodes, the voltage magnitude (/V/) and phase angle (𝛿) must be calculated.
2.2 Generator Bus (P-V Bus)
Any bus for which the voltage magnitude and the injected real power are specified is classified as
a voltage controlled (P-V) bus. The injected reactive power is a variable (with specified upper and
lower bounds) in power flow analysis and a P-V bus must have a variable source of reactive power
such as a generator.
2.3 Slack (swing) bus
Usually this bus is numbered 1 for the load flow studies. This bus sets the angular reference for all
the other buses. Since it is the angle difference between two voltage sources that indicates the real
and reactive power flow between them, the particular angle of the slack is not important. However
it sets the reference against which angles of all the other bus voltages are measured. For this reason

International Journal of Exploring Emerging Trends in Engineering (IJEETE)
Vol. 04, Issue 06, NOV-DEC, 2017 Pg. 280 – 294 WWW.IJEETE.COM
ISSN – 2394-0573 All Rights Reserved © 2017 IJEETE Page 283
the angle of this bus is usually chosen as 0°. Furthermore, it is assumed that the voltage of this bus
is known. This node acts as the reference node and is commonly chosen to have a phase angle
𝛿=0°. Generally the following features are given to slack bus. The real and reactive power is
unknown, the bus selected as the slack bus must have a source of both real and reactive power,
since the injected power at this bus must ” swing” to take up the “slack” in the solution. The
behavior of the solution is often influenced by the bus chosen.
3. Formulation of Power Flow Study
According to Gauss-Seidel and Newton-Raphson methods the power flow equations are
non-linear thus cannot be solved analytically. A numerical iterative algorithm is required to solve
such equations. A standard procedure is as follows; create a bus admittance matrix Y bus for the
power system, make an initial estimate for the voltage (both magnitude and phase angle) at each
bus in the system, substitute in the power flow equations and determine the deviations from the
solution, update the estimated voltages based on some commonly known numerical algorithm and
repeat the process until the deviations from the solution are minimal.
3.1 Bus Admittance Matrix
The first step is to number all the nodes of the system from 0 to n. Node 0 is the reference node
(or ground node), replace all generators by equivalent current sources in parallel with admittance
whenever possible and replace all lines, transformers, loads to equivalent admittances whenever
possible. The bus admittance matrix Y is then as follows: sum of admittances connected to node
iiy=i and yij=y ji=-sum of admittances connected from node i to node j. The current vector is next
found from the sources connected to nodes 0 to n. If no source is connected, the injected current
would be 0.The resulting equations are called the node-voltage equations and are given the “bus”
subscript in power studies.
A power flow study is a steady-state analysis whose target is to determine the voltages,
currents, real and reactive power flows in a system under a given load conditions. The basic
equation for power-flow analysis is derived from the nodal analysis equations for the power
system:
𝐼 = 𝑌𝑉 (1)
Where, 𝐼 is the bus current, 𝑌 is the bus admittance matrix and 𝑉 is the vector of bus voltages.
International Journal of Exploring Emerging Trends in Engineering (IJEETE)
Vol. 04, Issue 06, NOV-DEC, 2017 Pg. 280 – 294 WWW.IJEETE.COM
ISSN – 2394-0573 All Rights Reserved © 2017 IJEETE Page 284
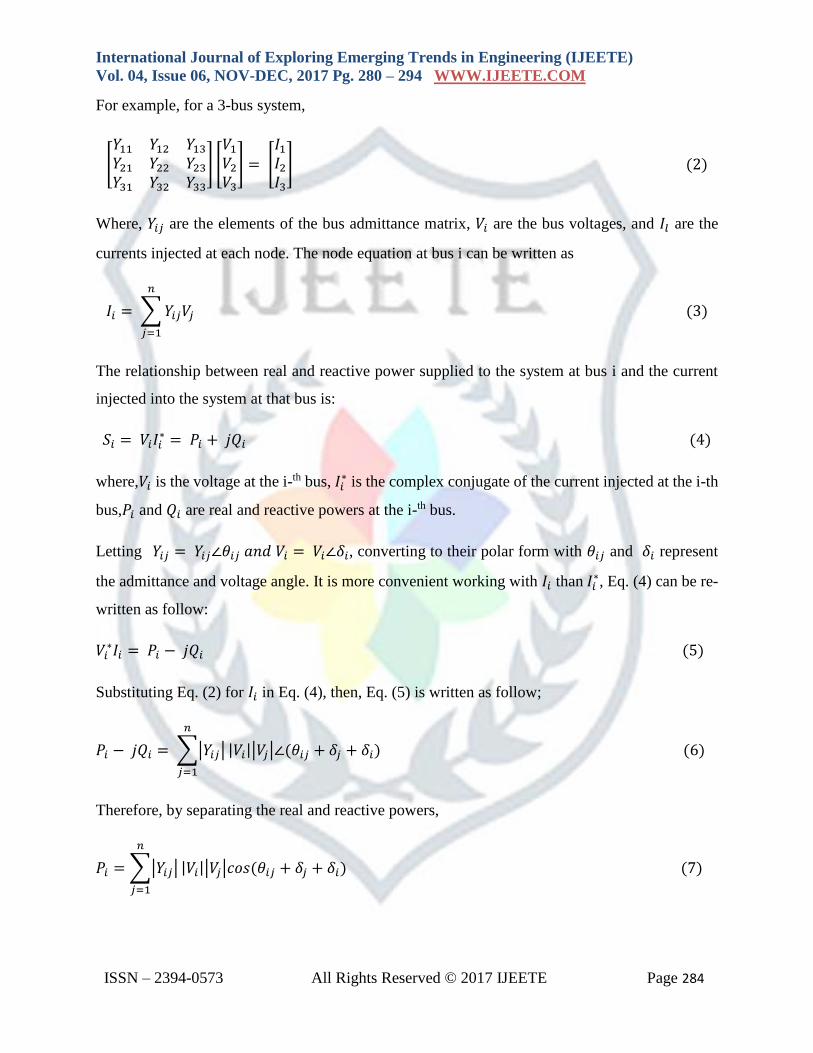
For example, for a 3-bus system,
[𝑌11 𝑌12 𝑌13
𝑌21 𝑌22 𝑌23
𝑌31 𝑌32 𝑌33
] [𝑉1
𝑉2
𝑉3
] = [𝐼1
𝐼2
𝐼3
] (2)
Where, 𝑌𝑖𝑗 are the elements of the bus admittance matrix, 𝑉𝑖 are the bus voltages, and 𝐼𝑙 are the
currents injected at each node. The node equation at bus i can be written as
𝐼𝑖 = ∑ 𝑌𝑖𝑗𝑉𝑗
𝑛
𝑗=1
(3)
The relationship between real and reactive power supplied to the system at bus i and the current
injected into the system at that bus is:
𝑆𝑖 = 𝑉𝑖𝐼𝑖∗ = 𝑃𝑖 + 𝑗𝑄𝑖 (4)
where,𝑉𝑖 is the voltage at the i-th bus, 𝐼𝑖∗ is the complex conjugate of the current injected at the i-th
bus,𝑃𝑖 and 𝑄𝑖 are real and reactive powers at the i-th bus.
Letting 𝑌𝑖𝑗 = 𝑌𝑖𝑗∠𝜃𝑖𝑗 𝑎𝑛𝑑 𝑉𝑖 = 𝑉𝑖∠𝛿𝑖, converting to their polar form with 𝜃𝑖𝑗 and 𝛿𝑖 represent
the admittance and voltage angle. It is more convenient working with 𝐼𝑖 than 𝐼𝑖∗, Eq. (4) can be re-
written as follow:
𝑉𝑖∗𝐼𝑖 = 𝑃𝑖 − 𝑗𝑄𝑖 (5)
Substituting Eq. (2) for 𝐼𝑖 in Eq. (4), then, Eq. (5) is written as follow;
𝑃𝑖 − 𝑗𝑄𝑖 = ∑|𝑌𝑖𝑗|
𝑛
𝑗=1
|𝑉𝑖||𝑉𝑗|∠(𝜃𝑖𝑗 + 𝛿𝑗 + 𝛿𝑖) (6)
Therefore, by separating the real and reactive powers,
𝑃𝑖 = ∑|𝑌𝑖𝑗|
𝑛
𝑗=1
|𝑉𝑖||𝑉𝑗|𝑐𝑜𝑠(𝜃𝑖𝑗 + 𝛿𝑗 + 𝛿𝑖) (7)

International Journal of Exploring Emerging Trends in Engineering (IJEETE)
Vol. 04, Issue 06, NOV-DEC, 2017 Pg. 280 – 294 WWW.IJEETE.COM
ISSN – 2394-0573 All Rights Reserved © 2017 IJEETE Page 285
𝑄𝑖 = − ∑|𝑌𝑖𝑗|
𝑛
𝑗=1
|𝑉𝑖||𝑉𝑗|sin (𝜃𝑖𝑗 + 𝛿𝑗 − 𝛿𝑖) (8)
There are 4 variables that are associated with each bus: P, Q, V, δ. Meanwhile, there are two power
flow equations associated with each bus. In a power flow study, two of the four variables are
defined and the other two are unknown. That way, we have the same number of equations as the
number of unknown. The known and unknown variables depend on the type of bus.
From (Saadat, 2002) equation (7) and (8) constitute a set of nonlinear algebraic equations in terms of the
independent variables, voltage magnitude in per unit, and phase angle in radians. We have two equations
for each load bus, which is given by (7) and (8) and one equation for each voltage controlled bus, which is
(8). The Jacobian matrix gives the linearized relationship between small changes in voltage angle ∆𝜕𝑖(𝑘)
and voltage magnitude ∆|𝑉𝑖(𝑘)
| with the small changes in real and reactive power ∆|𝑃𝑖(𝑘)
| and∆|𝑄𝑖(𝑘)
|.
Element of the Jacobian matrix are the partial derivatives of (7) and (8) evaluated at ∆𝜕𝑖(𝑘)
and∆|𝑉𝑖(𝑘)
|. In
a short form, it can be written as it can be written as
[∆𝑃∆𝑄
]=[𝐽1 𝐽2
𝐽3 𝐽4] [
∆𝛿∆|𝑉|
] (9)
For voltage-controlled buses, the voltage magnitude is known.
The diagonal and the off-diagonal element and of 𝐽1 are
𝜕𝑃𝑖
𝜕𝛿𝑖=∑ |𝑉𝑖||𝑗≠𝑖 𝑉𝑗||𝑌𝑖𝑗|𝑆𝑖𝑛(𝜃𝑖𝑗 − 𝛿𝑖 + 𝛿𝑗) (10)
𝜕𝑃𝑖
𝜕𝛿𝑗=−|𝑉𝑖||𝑉𝑗||𝑌𝑖𝑗|𝑆𝑖𝑛(𝜃𝑖𝑗 − 𝛿𝑖 + 𝛿𝑗) 𝑗 ≠ 𝑖 (11)
The diagonal and the off-diagonal element and of 𝐽2 are
𝜕𝑃𝑖
𝜕|𝑉𝑖|=2 |𝑉𝑖||𝑌𝑖𝑗|𝐶𝑜𝑠𝜃𝑖𝑖 + ∑ |𝑉𝑗𝑗≠𝑖 ||𝑌𝑖𝑗|𝐶𝑜𝑠(𝜃𝑖𝑗 − 𝛿𝑖 + 𝛿𝑗) (12)
𝜕𝑃𝑖
𝜕|𝑉𝑗 |=|𝑉𝑗||𝑌𝑖𝑗|𝐶𝑜𝑠(𝜃𝑖𝑗 − 𝛿𝑖 + 𝛿𝑗) 𝑗 ≠ 𝑖 (13)
The diagonal and the off-diagonal element and of 𝐽3 are
𝜕𝑄𝑖
𝜕𝛿𝑖=∑ |𝑉𝑖||𝑗≠𝑖 𝑉𝑗||𝑌𝑖𝑗|𝐶𝑜𝑠(𝜃𝑖𝑗 − 𝛿𝑖 + 𝛿𝑗) (14)
𝜕𝑄𝑖
𝜕𝛿𝑗=−|𝑉𝑖||𝑉𝑗||𝑌𝑖𝑗|𝐶𝑜𝑠(𝜃𝑖𝑗 − 𝛿𝑖 + 𝛿𝑗) 𝑗 ≠ 𝑖 (15)
The diagonal and the off-diagonal element and of 𝐽4 are

International Journal of Exploring Emerging Trends in Engineering (IJEETE)
Vol. 04, Issue 06, NOV-DEC, 2017 Pg. 280 – 294 WWW.IJEETE.COM
ISSN – 2394-0573 All Rights Reserved © 2017 IJEETE Page 286
𝜕𝑄𝑖
𝜕|𝑉𝑖|=−2 |𝑉𝑖||𝑌𝑖𝑗|𝑆𝑖𝑛𝜃𝑖𝑖 − ∑ |𝑉𝑗𝑗≠𝑖 ||𝑌𝑖𝑗|𝑆𝑖𝑛(𝜃𝑖𝑗 − 𝛿𝑖 + 𝛿𝑗) (16)
𝜕𝑄𝑖
𝜕|𝑉𝑗 |=−|𝑉𝑗||𝑌𝑖𝑗|𝑆𝑖𝑛(𝜃𝑖𝑗 − 𝛿𝑖 + 𝛿𝑗) 𝑗 ≠ 𝑖 (17)
The term ∆|𝑃𝑖(𝑘)
| and ∆|𝑄𝑖(𝑘)
| are the difference between the scheduled and the calculated values,
known as the power residuals, given by
∆𝑃𝑖(𝑘)
= 𝑃𝑖𝑠𝑐ℎ − 𝑃𝑖
(𝑘) (18)
∆𝑄𝑖(𝑘)
= 𝑄𝑖𝑠𝑐ℎ − 𝑄𝑖
(𝑘) (19)
The new estimates for bus voltages are
𝛿𝑖(𝑘+1)
= 𝛿𝑖𝑠𝑐ℎ + ∆𝛿𝑖
(𝑘) (20)
|∆𝑉𝑖(𝑘+1)
|= |𝑉𝑖(𝑘)
| + ∆|𝑉𝑖(𝑘)
| (21)
The procedure for power flow solution by the Newton-Raphson method is as follows: For load
buses, where 𝑃𝑖(𝑠𝑐ℎ)
and 𝑄𝑖(𝑠𝑐ℎ)
are specified, voltage magnitudes and phase angles are set equal to
the slack bus values, or 1.0 and 0.0, i.e., |𝑉𝑖(0)
|=1.0 and 𝛿𝑖(0)
=0.0. For voltage regulated buses,
where |𝑉𝑖| and 𝑃𝑖𝑠𝑐ℎ are specified, phase angles are set to the slack bus angle or 0, i.e., 𝛿𝑖
(0)=0.0.
For load buses, 𝑃𝑖(𝑠𝑐ℎ)
and 𝑄𝑖(𝑠𝑐ℎ)
are calculated from (7) and (8) respectively and ∆𝑃𝑖(𝑘)
and ∆𝑄𝑖(𝑘)
are calculated from (18) and (19) respectively. For voltage-controlled buses, 𝑃𝑖(𝑘)
and ∆𝑃𝑖(𝑘)
are
calculated form (7) and (18) respectively. The element of the Jacobian matrix (𝐽1, 𝐽2 , 𝐽3, 𝑎𝑛𝑑 𝐽4)
are calculated from (10) and (18). The linear simultaneous equation (10) is solved directly by
optimally ordered triangular factorization and Gaussian elimination. The new voltage magnitude
and phase angles are computed from (20) and (21).The process is continued until the residual ∆𝑃𝑖(𝑘)
and ∆𝑄𝑖(𝑘)
are less than the specified accuracy i.e.
|∆𝑃𝑖(𝑘)
| ≤ 𝜖 (22)
|∆𝑄𝑖(𝑘)
| ≤ 𝜖 (23)
In order to perform load flow, using Gauss-Seidel and Newton-Raphson method as describe above
we have to obtain the resistance and impedance of each 132kV transmission lines as shown in
Figure 1

International Journal of Exploring Emerging Trends in Engineering (IJEETE)
Vol. 04, Issue 06, NOV-DEC, 2017 Pg. 280 – 294 WWW.IJEETE.COM
ISSN – 2394-0573 All Rights Reserved © 2017 IJEETE Page 287
Figure
1: Single line diagram for a three phase transmission line
In Figure 1, 1 is the slack while 2, 3, 4, 5, 6, 7, 8 are the load buses. The geometric mean distance
is given as
𝐷𝐺𝑀𝐷 = √𝑥𝑦𝑧 3 (24)
Figure 2: Single line diagram of a three phase line
The reactance per phase per kilometer length is
𝑥𝑂 = 0.144 log [𝐷𝐺𝑀𝐷
𝑟] + 0.016 (25)
With r given as the radius of the conductor. The cross sectional area of the conductor is 250mm2
and the radius is gotten as
𝑟 = √𝐴
3.142 (26)
The resistance R of the line is
2 3
1
4 5 6 A
YE
DE
IB
AD
AN
IJ
EB
U-O
DE
IS
EY
IN
IWO
330kV bus
Supply
Transmission
line
Bus bar
KEY
7 8
JER
ICH
O
SH
AG
AM
U
Z
Y
X
For 132kV transmission line
X=1.7m
Y=1.7m
Z=3.4m

International Journal of Exploring Emerging Trends in Engineering (IJEETE)
Vol. 04, Issue 06, NOV-DEC, 2017 Pg. 280 – 294 WWW.IJEETE.COM
ISSN – 2394-0573 All Rights Reserved © 2017 IJEETE Page 288
𝑅 =𝜌𝐿
𝐴 (27)
where 𝜌 = 3.26𝑥10−8 Ω
𝑚 𝑎𝑛𝑑 𝐿 𝑎𝑟𝑒 the resistivity and distance of supply. The impedance of
each line shown in Figure 3.1 is
𝑍𝑏𝑎𝑠𝑒 =[𝑉𝑏𝑎𝑠𝑒]2
𝑀𝑉𝐴𝑏𝑎𝑠𝑒 (28)
𝑍𝑏𝑎𝑠𝑒 =[132000]2
100000000= 174.24 Ω (29)
𝑍𝑎𝑐𝑡𝑢𝑎𝑙 = 𝑅 + 𝑗𝑥 𝑂Ω (30)
𝑍𝑝𝑢 =𝑍𝑎𝑐𝑡𝑢𝑎𝑙
𝑍𝑏𝑎𝑠𝑒 (31)
The parameter from Table 1 and Table 2 and then imputed in the Gauss-Seidel and Newton-
Raphson Matlab code to compute the load flow as required.
4. Simulation Results
The simulation for Gauss-Seidel and Newton-Raphson method is carried out using Matlab for test
case Ayede 330/132kV substation. The base mva, selected value for iteration (tolerance) and
maximum numbers of iterations is specified. The simulation results are shown in Figure 3, Figure
4 for Gauss-Seidel and Newton- Raphson method respectively. The bus system consists of Bus 1
which acts as a slack bus. It consists of 7 load buses which are connected to load.

International Journal of Exploring Emerging Trends in Engineering (IJEETE)
Vol. 04, Issue 06, NOV-DEC, 2017 Pg. 280 – 294 WWW.IJEETE.COM
ISSN – 2394-0573 All Rights Reserved © 2017 IJEETE Page 289
Figure 3: Simulation result for Ayede 330/132kV using Gauss-Seidel method.
Figure 4: Simulation result for Ayede 330/132kV using Newton-Raphson method

International Journal of Exploring Emerging Trends in Engineering (IJEETE)
Vol. 04, Issue 06, NOV-DEC, 2017 Pg. 280 – 294 WWW.IJEETE.COM
ISSN – 2394-0573 All Rights Reserved © 2017 IJEETE Page 290
Ayede 330/132kV consist of eight line data as represented in Table 2 which shows the
values for resistance, reactance and half susceptance in per unit for the transmission line connected
together. It also shows the tap setting values for transformers and the position of the transformers
on the transmission line. The information is used to form the admittance bus matrix.
Table 3 represents the line flow and line losses for each of the Ayede 330/132kV bus
system. The line losses are compared for the two iterative techniques: Gauss-Seidel and Newton-
Raphson method while Gauss-Seidel have the highest total losses of 5.277 MW, 14.518 Mvar and
Newton-Raphson have the least losses of 5.271 MW, 14.503 Mvar.
Table 1: Load Data Of Ayede Bus System.
Bus Type of Bus/ Name of feeder
Voltage Load Generation
/V/(P,U) δ(θ) P(MW) Q(Mvar) P(MW) Q(Mvar)
1 Slack 1.0000 0 0 0
2 PQ/Ayede 1.0000 0 128 96
3 PQ/Ibadan-North 1.0000 0 48 36
4 PQ/Ijebu-Ode 1.0000 0 48 36
5 PQ/Iseyin 1.0000 0 36 27
6 PQ/Iwo 1.0000 0 32 24
7 PQ/Jericho 1.0000 0 68 51
8 PQ/Shagamu 1.0000 0 48 36
Table 2: Line data of Ayede 330/132kV bus system
Bus No Bus No R,pu X, pu 0.5B,pu Transformer
tap
1 2 0.0004865 0.0013385 0 1
1 3 0.007930 0.02183 0 1
1 4 0.03832 0.10543 0 1
1 5 0.05239 0.1441 0 1
1 6 0.02919 0.0803 0 1
1 7 0.002694 0.0074132 0 1
1 8 0.047448 0.130555 0 1

International Journal of Exploring Emerging Trends in Engineering (IJEETE)
Vol. 04, Issue 06, NOV-DEC, 2017 Pg. 280 – 294 WWW.IJEETE.COM
ISSN – 2394-0573 All Rights Reserved © 2017 IJEETE Page 291
Table 3: Line flow and losses comparing for Ayede 330/132kV
From
Bus
To
Bus
Newton-Raphson
Method
Gauss-Seidel Method
P Q Lines loss P Q Lines loss
MW Mvar MW Mvar MW Mvar MW Mvar
1 2 413.271 320.503 0.000 0.000 412.976 320.703 0.000 0.000
1 3 128.113 96.312 0.113 0.312 128.113 96.312 0.113 0.312
1 4 48.265 36.728 0.265 0.728 48.265 36.728 0.265 0.728
1 5 49.400 39.852 1.400 3.852 49.408 39.847 1.400 3.853
1 6 37.080 29.971 1.080 2.971 37.088 29.966 1.080 2.972
1 7 32.447 25.230 0.447 1.230 32.447 25.230 0.447 1.230
1 8 68.178 51.491 0.178 0.491 68.178 51.491 0.178 0.491
1 9 49.787 40.918 1.787 4.918 50.054 40.738 1.792 4.932
5. Discussion
5.1 Tolerance
The selected tolerance iteration value used for the simulation is shown in Table 5. This is used to
determine how accurate a solution will be. Thus, using a high tolerance value for a simulation
increases the accuracy of the solution whereas when a low tolerance value is used, it reduces the
accuracy of the solution and number of iterations. The selected tolerance value used for the
simulation is 0.001 and 0.1. Thus the 0.001 did not converge with the Gauss-Seidel method but
converge at 0.1 while the Newton-Raphson method converges at the tolerance value of 0.001 and
0.1.
5.2 Iteration number
Table 5 and Table 6 show the number of iterations for the power flow solution using selected
iteration value of 0.001 and 0.1 respectively to converge for the two load flow methods. Gauss-
Seidel Method has the highest number of iterations before it converges. The number of iteration
increases as the number of buses in the system increases. Newton-Raphson has the least number

International Journal of Exploring Emerging Trends in Engineering (IJEETE)
Vol. 04, Issue 06, NOV-DEC, 2017 Pg. 280 – 294 WWW.IJEETE.COM
ISSN – 2394-0573 All Rights Reserved © 2017 IJEETE Page 292
of iteration to converge. For the Gauss-Seidel method, the load flow solution did not converge
using 0.001. Then another selected value of 0.1 was chosen for the iteration.
5.3. Computing time
The computation time for load flow solutions using selected iteration value of 0.001 is shown in
Table 8 and Table 9 respectively. Newton-Raphson has same computation time as the number of
buses increases. Newton-Raphson has more computational time compared among the three
methods. Gauss-Seidel has the least computation.
Table 4: Comparison of tolerance value
Test System Gauss-Seidel Newton-Raphson
Ayede 330/132kV 0.001/0.1 0.001/0.1
Table 5: Comparison of iteration number using selected value of 0.001
Test System Gauss-Seidel Newton-Raphson
Ayede 330/132kV 101 4
Table 6: Comparison of iteration number using selected value of 0.1
Test System Gauss-Seidel Newton-Raphson
Ayede 330/132kV 21 3
Table 7: Comparison of computing time using selected value of 0.001
Test System Gauss-Seidel Newton-Raphson
Ayede 330/132kV 2.08 seconds 0.0360 seconds

International Journal of Exploring Emerging Trends in Engineering (IJEETE)
Vol. 04, Issue 06, NOV-DEC, 2017 Pg. 280 – 294 WWW.IJEETE.COM
ISSN – 2394-0573 All Rights Reserved © 2017 IJEETE Page 293
Table 8: Comparison of computing time using selected iteration value of 0.1
Test System Gauss-Seidel Newton-Raphson
Ayede 330/132kV 0.048 seconds 0.0355 seconds
5.4. Convergence
Convergence is used to determine how fast a power flow reaches its solution. The convergence
rate for Gauss-Seidel is slow compared to the other. Newton-Raphson has the fastest rate of
convergence among the two numerical methods.
6. CONCLUSIONS
All the simulations were carried out using Matlab and implemented for Ayede 330/132 kV bus
test cases for Gauss-Seidel and Newton-Raphson. In the load flow analysis methods simulated, the
tolerance values used for simulations are 0.001 and 0.1 for all the simulation carried out except for
the Gauss-Seidel method which did not converge with the tolerance value 0.001. This explains
why the Gauss-Seidel method is not as accurate as Newton-Raphson method because a lower
tolerance value of 0.1 was used to carry out the simulation.
The time for iteration in Gauss-Seidel is the longest compared to the Newton-Raphson
method . The time for iterations in Gauss-Seidel increases as the number of buses increases. The
Gauss-Seidel method increases in arithmetic progression. Newton-Raphson increases in quadratic
progression. This explains why it takes longer time for Gauss-Seidel to converge. The
computational time for Gauss-Seidel is low compared to Newton-Raphson. Newton-Raphson have
more computational time due to the complexity of the Jacobian matrix for each iteration but still
converges fast enough because less number of iterations are carried out and required.
The results of this paper suggest that the planning of a power system can be carried out by
using Gauss-Seidel method for a small system with less computational complexity due to the good
computational characteristics it exhibited. The effective and most reliable amongst the two load
flow methods is the Newton-Raphson method because it converges fast and is more accurate.
References

International Journal of Exploring Emerging Trends in Engineering (IJEETE)
Vol. 04, Issue 06, NOV-DEC, 2017 Pg. 280 – 294 WWW.IJEETE.COM
ISSN – 2394-0573 All Rights Reserved © 2017 IJEETE Page 294
(1) Temitope Adefarati, Adedayo Kayode Babarinde, Ayodele Sunday Oluwole and Kehinde
Olusuyi (2014) Reliability Evaluation Of Ayede 330/132kV Substation ISSN: 2277-3754 ISO
9001:2008 Certified International Journal of Engineering and Innovative Technology (IJEIT)
Volume 4, Issue 4, October 2014.
(2) Adejumobi, I.A., et al. (2014) Numerical Methods in Load Flow Analysis: An Application to
Nigeria Grid System. International Journal of Electrical and Electronics Engineering (IJEEE) 3.
(3) Hadi, S. (2010) Power System Analysis. 3rd Edition, PSA Publishing, North York.
(4) Bhakti, N. and Rajani, N. (2014) Steady State Analysis of IEEE-6 Bus System Using PSAT
Power Tool Box. International Journal of Engineering Science and Innovation Technology
(IJESIT), 3.
(5) Aroop, B., Satyajit, B. and Sanjib, H. (2014) Power Flow Analysis on IEEE 57 bus System
Using Mathlab. International Journal of Engineering Research & Technology (IJERT), 3.
(6) Afolabi, O.A., Ali, W.H., Cofie, P., Fuller, J., Obiomon, P. and Kolawole, E.S. (2015)
Analysis of the Load Flow Problem in Power System Planning Studies. Energy and Power
Engineering, 7, 509-523. http://dx.doi.org/10.4236/epe.2015.710048