International Journal of Agricultural Economics Report...
14
International Journal of Agricultural Economics 2017; 2(4): 96-109 http://www.sciencepublishinggroup.com/j/ijae doi: 10.11648/j.ijae.20170204.12 Report Economic Modelling and Forecasting of Sugar Production and Consumption in Egypt Bader Esam A. Department of Agricultural Economics, Faculty of Agriculture, Damietta University, Damietta, Egypt Email address: [email protected] To cite this article: Bader Esam A. Economic Modelling and Forecasting of Sugar Production and Consumption in Egypt. International Journal of Agricultural Economics. Vol. 2, No. 4, 2017, pp. 96-109. doi: 10.11648/j.ijae.20170204.12 Received: April 12, 2017; Accepted: April 27, 2017; Published: June 19, 2017 Abstract: Sugar is considered one of the strategic commodities in Egypt. The domestic production of sugar is still insufficient to meet the consumption needs, which increases the food gap of sugar. This paper analyses the main features of the production and consumption of sugar in Egypt. Descriptive and quantitative analysis are used relying on data obtained from the Ministry of Agriculture and Land Reclamation for the period (2000-2015). Results indicate that the total sugar production and consumption in Egypt are increased with an annual significant growth rate of 4.08% and 3.26%, respectively. Water productivity for sugar beet is more than sugar cane, with a net return per unit of water of 684.40 and 474.19 LE/1000M3, respectively. The average monthly profitability for sugar beet is about 0.16 which is higher than sugar cane (0.11). Nerlove's model shows that producers responsive to net return in cane production, with elasticity of response about 0.02 and to prices and one year lag of area in sugar beet production, with elasticities of response about 0.57 and 0.40, respectively. The most important factors that influence the food gap of sugar are the domestic production, per capita consumption, and population. Finally, the forecast figures base on ARIMA models show that sugar production and consumption are predicted to increase over the forthcoming decades, and in spite of these, the food gap of sugar would be about 735.43 thousand tons with self-sufficiency rate of 76.26% for the year 2025. For this reason, Egypt should exert more efforts to increase sugar production by increasing beet area, raising the delivery prices, adopting high yielding varieties of sugar crops and rationalizing per capita sugar consumption to reduce the size of sugar gap. Keywords: Egypt, Food Gap of Sugar, Sugar Crops, Supply Response, ARIMA 1. Introduction In Egypt, sugar is an important food commodities because of its strategic position in consumption as well as for industrial use. Sugar consumption has been driven by population growth associated with changes in food consumption patterns. Per capita consumption of sugar has been growing fast since 2000 in Egypt and was recorded at 27 kg/capita and 34 kg/capita in 2015, due to population growth and income level increase. Sugar production depends on two main crops, sugar cane and sugar beet. Sugar cane was the only source to produce sugar until the sugar beet was adopted by the Government of Egypt by 1982. Cane and beet represent the main sources of sugar that contributed to about 61.28% and 38.72%, respectively, of the total sugar production during the period (2000-2015) [8]. Due to land and water scarcity in Egypt at the increase of sugar demand, some efforts were made by the state to increase the cultivated area and productivity of sugar beet source during the last years. Whereas, cane crop needs more water resources per Feddan, reached about 11032M3 of irrigation water in 2014 [3].The average amount of sugar production in Egypt is about 2.15 million tons during the last five years (2011-2015). While the total consumption of sugar was about 2.93 million tons, and the food gap of sugar is about 799.4 thousand tons. The self-sufficiency rate was about 72.8% during the same years, indicating that the 27.2% of local sugar consumption was covered by imports [9]. Despite the observed increase in sugar production in Egypt, there is a wide gap between the domestic production and consumption of sugar, where the average gap accounted for about 799.4 thousand tons with self-sufficiency ratio was about 72.8% during the period (2011-2015). This gap is covered through sugar imports, which negatively affect Egypt's agricultural trade balance. The analysis of variables
Transcript of International Journal of Agricultural Economics Report...
International Journal of Agricultural Economics 2017; 2(4): 96-109 http://www.sciencepublishinggroup.com/j/ijae doi: 10.11648/j.ijae.20170204.12
Report
Economic Modelling and Forecasting of Sugar Production and Consumption in Egypt
Bader Esam A.
Department of Agricultural Economics, Faculty of Agriculture, Damietta University, Damietta, Egypt
Email address:
To cite this article: Bader Esam A. Economic Modelling and Forecasting of Sugar Production and Consumption in Egypt. International Journal of Agricultural
Economics. Vol. 2, No. 4, 2017, pp. 96-109. doi: 10.11648/j.ijae.20170204.12
Received: April 12, 2017; Accepted: April 27, 2017; Published: June 19, 2017
Abstract: Sugar is considered one of the strategic commodities in Egypt. The domestic production of sugar is still insufficient
to meet the consumption needs, which increases the food gap of sugar. This paper analyses the main features of the production
and consumption of sugar in Egypt. Descriptive and quantitative analysis are used relying on data obtained from the Ministry of
Agriculture and Land Reclamation for the period (2000-2015). Results indicate that the total sugar production and consumption
in Egypt are increased with an annual significant growth rate of 4.08% and 3.26%, respectively. Water productivity for sugar beet
is more than sugar cane, with a net return per unit of water of 684.40 and 474.19 LE/1000M3, respectively. The average monthly
profitability for sugar beet is about 0.16 which is higher than sugar cane (0.11). Nerlove's model shows that producers responsive
to net return in cane production, with elasticity of response about 0.02 and to prices and one year lag of area in sugar beet
production, with elasticities of response about 0.57 and 0.40, respectively. The most important factors that influence the food gap
of sugar are the domestic production, per capita consumption, and population. Finally, the forecast figures base on ARIMA
models show that sugar production and consumption are predicted to increase over the forthcoming decades, and in spite of these,
the food gap of sugar would be about 735.43 thousand tons with self-sufficiency rate of 76.26% for the year 2025. For this reason,
Egypt should exert more efforts to increase sugar production by increasing beet area, raising the delivery prices, adopting high
yielding varieties of sugar crops and rationalizing per capita sugar consumption to reduce the size of sugar gap.
Keywords: Egypt, Food Gap of Sugar, Sugar Crops, Supply Response, ARIMA
1. Introduction
In Egypt, sugar is an important food commodities because
of its strategic position in consumption as well as for industrial
use. Sugar consumption has been driven by population growth
associated with changes in food consumption patterns. Per
capita consumption of sugar has been growing fast since 2000
in Egypt and was recorded at 27 kg/capita and 34 kg/capita in
2015, due to population growth and income level increase.
Sugar production depends on two main crops, sugar cane and
sugar beet. Sugar cane was the only source to produce sugar
until the sugar beet was adopted by the Government of Egypt
by 1982. Cane and beet represent the main sources of sugar
that contributed to about 61.28% and 38.72%, respectively, of
the total sugar production during the period (2000-2015) [8].
Due to land and water scarcity in Egypt at the increase of
sugar demand, some efforts were made by the state to increase
the cultivated area and productivity of sugar beet source
during the last years. Whereas, cane crop needs more water
resources per Feddan, reached about 11032M3 of irrigation
water in 2014 [3].The average amount of sugar production in
Egypt is about 2.15 million tons during the last five years
(2011-2015). While the total consumption of sugar was about
2.93 million tons, and the food gap of sugar is about 799.4
thousand tons. The self-sufficiency rate was about 72.8%
during the same years, indicating that the 27.2% of local sugar
consumption was covered by imports [9].
Despite the observed increase in sugar production in Egypt,
there is a wide gap between the domestic production and
consumption of sugar, where the average gap accounted for
about 799.4 thousand tons with self-sufficiency ratio was
about 72.8% during the period (2011-2015). This gap is
covered through sugar imports, which negatively affect
Egypt's agricultural trade balance. The analysis of variables
97 Bader Esam A.: Economic Modelling and Forecasting of Sugar Production and Consumption in Egypt
associated with production and consumption of over time
reveals a clear picture of expected food gap of sugar.
Therefore, this paper aims to analyze econometrically sugar
production and consumption in Egypt. Specifically, there are
four aims for this study: First, studying the performance of
production and estimating the supply response function for
sugar crops. Second, assessing the operational efficiency of
sugar processing. Third, analyzing sugar consumption and gap
during the period (2000-2015), to determine the most
important factors influencing the gap of sugar. Finally,
forecasting to future production, consumption and food gap of
sugar to give food policy recommendations eliminate sugar
gap in Egypt. The paper is organized as follows: Section (2)
describes methodology and data, section (3) discusses results
and discussions, and section (4) presents conclusion and
recommendations.
2. Methodology and Data
The study applies descriptive and statistical methods to
analyse the data in order to achieve the aims of the study.
Simple regression is used to estimate growth rates for
cultivated area, yield, production, and consumption of sugar
crops. Decomposition analysis is used to estimate the
components of production changes. A multiple regression
analysis and the stepwise method with double logarithmic
form are used to determine the most important factors
influencing the food gap of sugar, in addition to, some
statistical methods such as Marc Nerlove's1958 partial
adjustment lagged model which is used to estimate area
response to some economic variables. At last the Auto
Regressive Integrated Moving Average (ARIMA) model is
used to forecast the production, consumption, and sugar gap in
Egypt.
(1) Nerlove Supply Response Model
Farmers allocate their land resource, depending on their
expected net return. They can seldom make hundred per cent
adjustment while responding to economic variables. Lagged
prices of crops and the competing variable are available to
farmers. Also, the agricultural production is determined by
natural conditions, where the agricultural products generally
take time to adjust to the changes in economic variables. For
these reason, the partial adjustment lagged model is widely
used by researchers [1], [7], [12], and [10], to measure the
farmers' behaviour.
A typical specification can be written as follows:
EbPaX tt ++= −1* (1)
Where *tX is the desired cultivated area of crop at time t.
Pt-1 is the lagged crop price, tE error term. Since the desired
cultivated area of crop is an unobservable variable, the Nerlove formulation can be specified as follows:
1011 ≺≺ ββ )( *−− −=− tttt XXXX (2)
The current supply is:
1
11
1 −
−−
−+=
−+=
ttt
tttt
XXX
XXXX
)(
)(*
*
βββ
(3)
By substituting equation 3 in equation 1, the response
supply model can written as follows:
EXbPaX ttt +−++= −− 11 1 )(* β (4)
β is the coefficient of adjustment, represents the cause of
difference between the short-run and long-run supply
elasticities. 1−− tt XX is the actual change, and 1*
−− tt XX
is the desired change. The first equation is a behavioural
relationship, stating that the desired cropped area depends on
the crop price in the previous year. The second equation states
that the actual area of crop plus a proportion of the difference
between the desired area in period t and area in period t-1.
Due to natural condition of the crop production, producers
cannot fully adjust their current area to the desired area in
response to changes in economic variables. The β parameter
determines how the farmers are adjusting to their expectations.
The value of β ranges between 0 and 1. When the value is
close to one, that means the farmers are quickly adjusting to
the changing of economic variables. Relations with equation 1
and 2 give the reduced form which eliminates the unobserved
variable by an observed variable.
tttt EbPXbaX +++= −− 11 (5)
Equation 5 provides a simple version of the partial adjustment model and the parameters of this model can be estimated using OLS [5]. To test the response of producers to economic variables, the partial adjustment model will be estimated in the double logarithmic functional form. The
estimated parameter b can be readily interpreted as supply
elasticities. The model was estimated as presented below:
titjtjtjtjt ENbNbpbXbaX +++++= −∗
−−− 14131211 lnlnlnlnln (6)
Where:
jtXln : Natural log of area under crop j in period t,
1ln −jtX : Natural log of area under crop j lagged by one year ( 1−jtx ),
1ln −jtp : Natural log of crop price in period (t-1),
1ln −jtN : Natural log of net return of crop j in period (t-1),
1ln −∗
itN : Natural log of net return of competitive crops in period (t-1),

International Journal of Agricultural Economics 2017; 2(4): 96-109 98
tE : Error term,
4321 ,,, bbbb The coefficients to be estimated. (2) ARIMA Forecasting Model
Auto Regressive Integrated Moving Average (ARIMA) is
the method first introduced by Box-Jenkins (1976). This
model has been commonly used in practice for forecasting
time series data [11]. The model has been chosen as the basic
model in this study for the forecasting because the model
assumes and considers the none zero autocorrelation between
the successive values of the series data. The model consists of
two parts [6], [11]:
First, the notation (AR) of Autoregressive model of order p
can be written as follows:
tptpttt EYYYY ++++= −−− δδδθ 2211
Where tY is the independent variable at time t, θ is the
constant, pδδδ ,, 21 are the parameters of the model and tE
is the terms of error at time t, Ptt YY −− ....,,1 are explanatory
variables at time lag 1−t , p is the number of values. In AR
process, the value of time series variable depends on its previous values.
Second, the notation MA (q) refers to the Moving Average
model of order q, which can be written as follows:
qtqtttt EEEEY −−− −+++= γγγθ .....2211
Where 1−tE , ….. qtE − are the forecast errors at time
1−t ,… qt − respectively, qγγ ...1 are the coefficients to
be estimated. The forecast errors represent the effect of variable which not explained by the model.
The simple form of ARMA (p, q)
AverageMovingsiveAutoregres
EEEYYY tqtqtptptt +++++++= −−−− γγδδθ .......... 1111
In case of none stationary series with unit root, stationary
can sometimes be achieved by taking first, second or higher
difference of the original series. The number of differences
required to make the series stationary is known as the order
of integration and denoted by d.
The simple ARIMA (p, d, q) model can be written as
follows:
1 1 1 1..... .....d t d t p d t p t q t q tY Y Y E E Eθ δ δ γ γ− − − −∆ = + ∆ + + ∆ + + + +
The Box- Jenkins producer of ARIMA modelling consists
of the following four steps namely Identification of the model
(based on Autocorrelation Function (ACF) and Partial
Autocorrelation Function (PACF), estimation of model
parameter, diagnostic checking, and forecasting time series
data. In this study, with the help of SPSS 17 computer package,
ARIMA models are applied for the sugar production,
consumption, and gap.
Data Sources
The study is based on secondary data covering the time
period starting from 2000 to 2015 which was published by the
Government of Egypt: the Ministry of Agriculture and Land
Reclamation (MALR), Sugar Crops Council, the annual report
of sugar crops, and, the General Department of Agricultural
Statistics. Also, data was obtained from the Central Agency
for Public Mobilization and Statistics of Egypt (CAPMAS):
Annual bulletin for consumption of food commodities and
Statistical Year Book. In addition data is related to research
and references associated with the subject of the study.
3. Results and Discussion
3.1. Economic Analysis of Sugar Crop Production
In Egypt, sugar production depends on both sugar cane and
sugar beet crops, in addition sugar processing of sugar
factories, which affects the produced sugar. Sugar production
fluctuated from a minimum of 976.50 thousand tons in 2002
and a maximum of 1024.40 thousand tons in 2014. Sugar cane
is the major industrial crop in Egypt. It is a source of raw
material to sugar industry and various related industries as
well as it provides employment for many people. Sugar cane is
grown on 329 thousand Feddan, with total annual production
of 1024 thousand tons [8]. Sugar cane cultivation in Egypt is
concentrated in EL-Minia, Sohag, Qena, and Aswan
governorates which represent about 98% of the total area of
sugar cane, with a productivity of about 50 ton/Feddan. Sugar
factories are constructed in these governorates with actual
operational efficiency.
3.1.1. Growth Performance of Area, Yield, and Production
for Sugar Crops
Table 1 in the Appendix shows the cultivated area, yield,
and production for sugar crops during the period (2000-2015).
The estimated growth rates for cultivated area, yield, and
production for sugar crops during the study period are
presented in Table 1.
Sugar Cane Crop
Sugar cane crop has played an important role in improving
the supplies of sugar. Cultivated area of sugar cane crop
ranged between a minimum of 307.2 thousand Feddan in 2000
and a maximum of around 332.02 thousand Feddan in 2015. A
simple linear trend shows that cultivated area under sugar cane
increased by an annual growth rate of 0.32%. However, the
yield under sugar cane decreased from 50.96 ton/Feddan in
2006 to 48.29 ton/Feddan in 2014, with an annual growth rate
of 0.62 during the study period. Despite the growth rate in
cultivated area of sugar cane, it could not offset the declining
trend of yield, which resulted in decrease of production. The
production of sugar cane crop increased from a minimum of
15129.6 thousand tons in 2000 to a maximum of around
17056.59 thousand tons in 2008 and then declined to 16053.65
thousand tons in 2015, with an annual average rate of 0.64%.
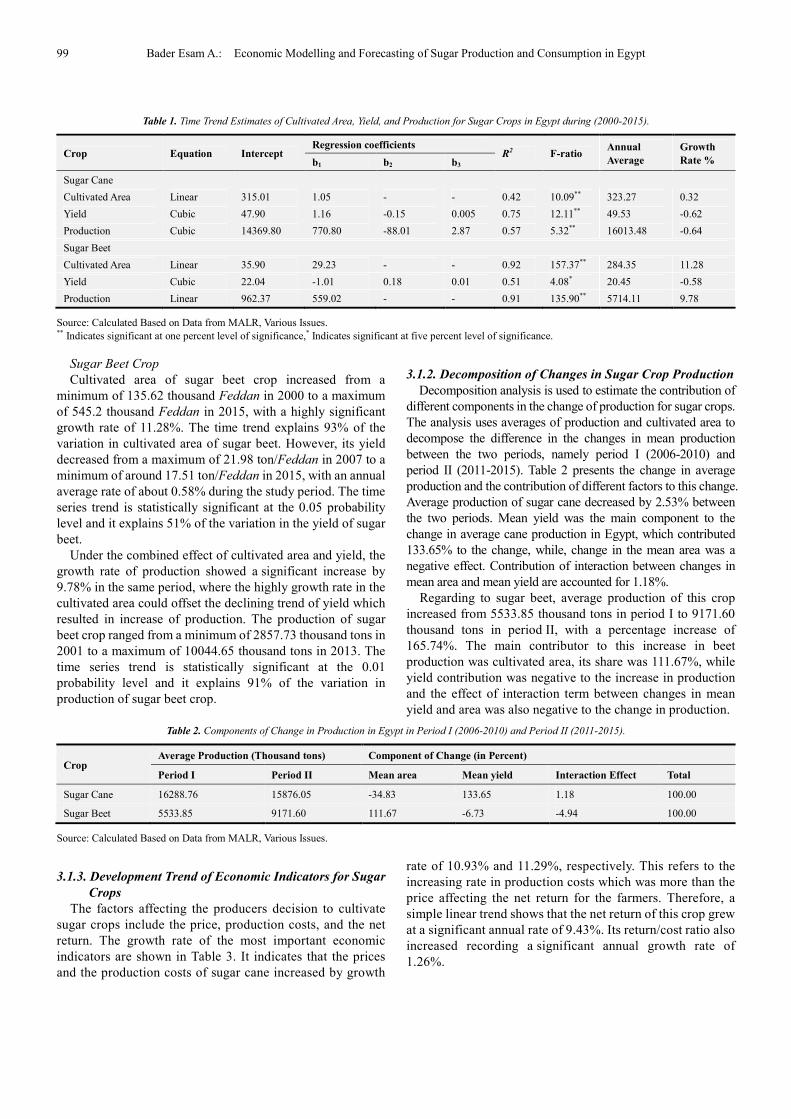
99 Bader Esam A.: Economic Modelling and Forecasting of Sugar Production and Consumption in Egypt
Table 1. Time Trend Estimates of Cultivated Area, Yield, and Production for Sugar Crops in Egypt during (2000-2015).
Crop Equation Intercept Regression coefficients
R2 F-ratio Annual
Average
Growth
Rate % b1 b2 b3
Sugar Cane
Cultivated Area Linear 315.01 1.05 - - 0.42 10.09** 323.27 0.32
Yield Cubic 47.90 1.16 -0.15 0.005 0.75 12.11** 49.53 -0.62
Production Cubic 14369.80 770.80 -88.01 2.87 0.57 5.32** 16013.48 -0.64
Sugar Beet
Cultivated Area Linear 35.90 29.23 - - 0.92 157.37** 284.35 11.28
Yield Cubic 22.04 -1.01 0.18 0.01 0.51 4.08* 20.45 -0.58
Production Linear 962.37 559.02 - - 0.91 135.90** 5714.11 9.78
Source: Calculated Based on Data from MALR, Various Issues. ** Indicates significant at one percent level of significance,* Indicates significant at five percent level of significance.
Sugar Beet Crop
Cultivated area of sugar beet crop increased from a
minimum of 135.62 thousand Feddan in 2000 to a maximum
of 545.2 thousand Feddan in 2015, with a highly significant
growth rate of 11.28%. The time trend explains 93% of the
variation in cultivated area of sugar beet. However, its yield
decreased from a maximum of 21.98 ton/Feddan in 2007 to a
minimum of around 17.51 ton/Feddan in 2015, with an annual
average rate of about 0.58% during the study period. The time
series trend is statistically significant at the 0.05 probability
level and it explains 51% of the variation in the yield of sugar
beet.
Under the combined effect of cultivated area and yield, the
growth rate of production showed a significant increase by
9.78% in the same period, where the highly growth rate in the
cultivated area could offset the declining trend of yield which
resulted in increase of production. The production of sugar
beet crop ranged from a minimum of 2857.73 thousand tons in
2001 to a maximum of 10044.65 thousand tons in 2013. The
time series trend is statistically significant at the 0.01
probability level and it explains 91% of the variation in
production of sugar beet crop.
3.1.2. Decomposition of Changes in Sugar Crop Production
Decomposition analysis is used to estimate the contribution of
different components in the change of production for sugar crops.
The analysis uses averages of production and cultivated area to
decompose the difference in the changes in mean production
between the two periods, namely period I (2006-2010) and
period II (2011-2015). Table 2 presents the change in average
production and the contribution of different factors to this change.
Average production of sugar cane decreased by 2.53% between
the two periods. Mean yield was the main component to the
change in average cane production in Egypt, which contributed
133.65% to the change, while, change in the mean area was a
negative effect. Contribution of interaction between changes in
mean area and mean yield are accounted for 1.18%.
Regarding to sugar beet, average production of this crop
increased from 5533.85 thousand tons in period I to 9171.60
thousand tons in period II, with a percentage increase of
165.74%. The main contributor to this increase in beet
production was cultivated area, its share was 111.67%, while
yield contribution was negative to the increase in production
and the effect of interaction term between changes in mean
yield and area was also negative to the change in production.
Table 2. Components of Change in Production in Egypt in Period I (2006-2010) and Period II (2011-2015).
Crop Average Production (Thousand tons) Component of Change (in Percent)
Period I Period II Mean area Mean yield Interaction Effect Total
Sugar Cane 16288.76 15876.05 -34.83 133.65 1.18 100.00
Sugar Beet 5533.85 9171.60 111.67 -6.73 -4.94 100.00
Source: Calculated Based on Data from MALR, Various Issues.
3.1.3. Development Trend of Economic Indicators for Sugar
Crops
The factors affecting the producers decision to cultivate
sugar crops include the price, production costs, and the net
return. The growth rate of the most important economic
indicators are shown in Table 3. It indicates that the prices
and the production costs of sugar cane increased by growth
rate of 10.93% and 11.29%, respectively. This refers to the
increasing rate in production costs which was more than the
price affecting the net return for the farmers. Therefore, a
simple linear trend shows that the net return of this crop grew
at a significant annual rate of 9.43%. Its return/cost ratio also
increased recording a significant annual growth rate of
1.26%.
International Journal of Agricultural Economics 2017; 2(4): 96-109 100
Table 3. Time Trend Estimates of Economic Indicators for Sugar Crops in Egypt during (2000-2014).
Crop Equation Intercept Regression Coeff.
R2 F-ratio Annual Average Growth Rate % b1 b2
Sugar Cane
Price Linear 24.99 2.74 - 0.94 197.37** 198.93 10.93
Total Cost Linear 604.91 703.26 - 0.79 48.39** 6231.00 11.29
Net Return Linear 831.59 319.99 - 0.86 81.32** 3391.58 9.43
Return/Cost Cubic 1.04 0.18 -0.01 0.63 10.09** 1.59 1.26
Sugar Beet
Price Linear 32.15 23.70 - 0.95 238.01** 221.67 10.69
Total Cost Linear 539.62 245.83 - 0.78 46.33** 2506.23 9.81
Net Return Cubic 43.199 275.35 3.72 0.92 71.04** 2552.41 8.46
Return/Cost Cubic 0.94 0.28 -0.01 0.55 7.44** 2.01 2.14
Source: Calculated Based on Data from MALR, Various Issues. ** Indicates significant at one percent level of significance.
The prices and production costs of sugar beet increased by
growth rate of 10.69% and 9.81%, respectively. This refers to
the increasing rate in output price which was more than the
production cost contributing to increasing the net return for
the producers by a significant growth rate of 8.46% during
period (2000-2014). Under the price effect, the growth rate of
return/cost ratio showed a significant increase in the same
period, where it grew by 2.14%.
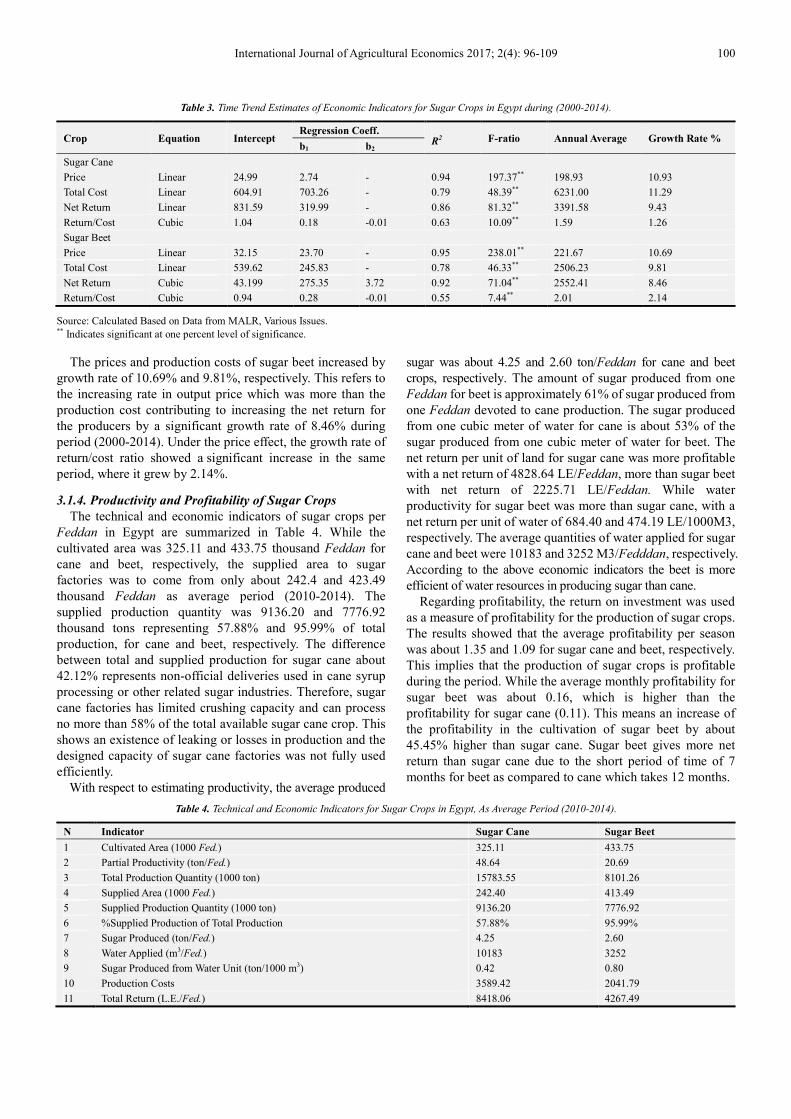
3.1.4. Productivity and Profitability of Sugar Crops
The technical and economic indicators of sugar crops per
Feddan in Egypt are summarized in Table 4. While the
cultivated area was 325.11 and 433.75 thousand Feddan for
cane and beet, respectively, the supplied area to sugar
factories was to come from only about 242.4 and 423.49
thousand Feddan as average period (2010-2014). The
supplied production quantity was 9136.20 and 7776.92
thousand tons representing 57.88% and 95.99% of total
production, for cane and beet, respectively. The difference
between total and supplied production for sugar cane about
42.12% represents non-official deliveries used in cane syrup
processing or other related sugar industries. Therefore, sugar
cane factories has limited crushing capacity and can process
no more than 58% of the total available sugar cane crop. This
shows an existence of leaking or losses in production and the
designed capacity of sugar cane factories was not fully used
efficiently.
With respect to estimating productivity, the average produced
sugar was about 4.25 and 2.60 ton/Feddan for cane and beet
crops, respectively. The amount of sugar produced from one
Feddan for beet is approximately 61% of sugar produced from
one Feddan devoted to cane production. The sugar produced
from one cubic meter of water for cane is about 53% of the
sugar produced from one cubic meter of water for beet. The
net return per unit of land for sugar cane was more profitable
with a net return of 4828.64 LE/Feddan, more than sugar beet
with net return of 2225.71 LE/Feddan. While water
productivity for sugar beet was more than sugar cane, with a
net return per unit of water of 684.40 and 474.19 LE/1000M3,
respectively. The average quantities of water applied for sugar
cane and beet were 10183 and 3252 M3/Fedddan, respectively.
According to the above economic indicators the beet is more
efficient of water resources in producing sugar than cane.
Regarding profitability, the return on investment was used
as a measure of profitability for the production of sugar crops.
The results showed that the average profitability per season
was about 1.35 and 1.09 for sugar cane and beet, respectively.
This implies that the production of sugar crops is profitable
during the period. While the average monthly profitability for
sugar beet was about 0.16, which is higher than the
profitability for sugar cane (0.11). This means an increase of
the profitability in the cultivation of sugar beet by about
45.45% higher than sugar cane. Sugar beet gives more net
return than sugar cane due to the short period of time of 7
months for beet as compared to cane which takes 12 months.
Table 4. Technical and Economic Indicators for Sugar Crops in Egypt, As Average Period (2010-2014).
N Indicator Sugar Cane Sugar Beet
1 Cultivated Area (1000 Fed.) 325.11 433.75
2 Partial Productivity (ton/Fed.) 48.64 20.69
3 Total Production Quantity (1000 ton) 15783.55 8101.26
4 Supplied Area (1000 Fed.) 242.40 413.49
5 Supplied Production Quantity (1000 ton) 9136.20 7776.92
6 %Supplied Production of Total Production 57.88% 95.99%
7 Sugar Produced (ton/Fed.) 4.25 2.60
8 Water Applied (m3/Fed.) 10183 3252
9 Sugar Produced from Water Unit (ton/1000 m3) 0.42 0.80
10 Production Costs 3589.42 2041.79
11 Total Return (L.E./Fed.) 8418.06 4267.49
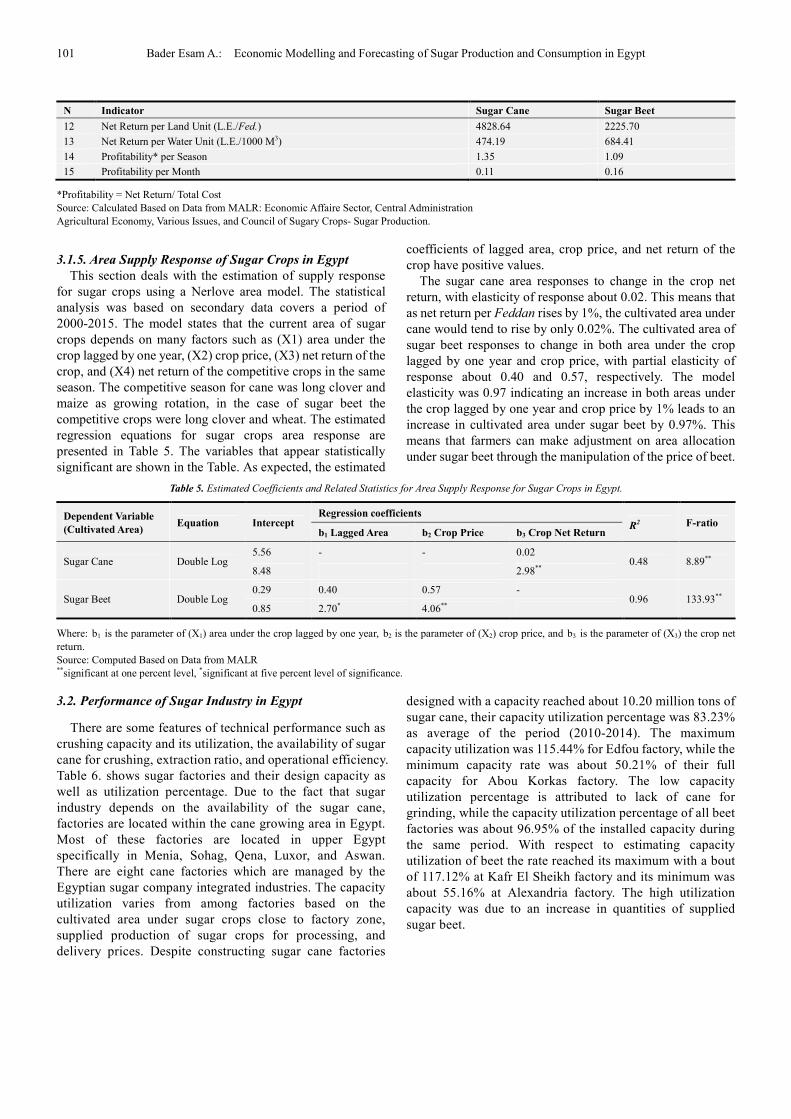
101 Bader Esam A.: Economic Modelling and Forecasting of Sugar Production and Consumption in Egypt
N Indicator Sugar Cane Sugar Beet
12 Net Return per Land Unit (L.E./Fed.) 4828.64 2225.70
13 Net Return per Water Unit (L.E./1000 M3) 474.19 684.41
14 Profitability* per Season 1.35 1.09
15 Profitability per Month 0.11 0.16
*Profitability = Net Return/ Total Cost
Source: Calculated Based on Data from MALR: Economic Affaire Sector, Central Administration
Agricultural Economy, Various Issues, and Council of Sugary Crops- Sugar Production.
3.1.5. Area Supply Response of Sugar Crops in Egypt
This section deals with the estimation of supply response
for sugar crops using a Nerlove area model. The statistical
analysis was based on secondary data covers a period of
2000-2015. The model states that the current area of sugar
crops depends on many factors such as (X1) area under the
crop lagged by one year, (X2) crop price, (X3) net return of the
crop, and (X4) net return of the competitive crops in the same
season. The competitive season for cane was long clover and
maize as growing rotation, in the case of sugar beet the
competitive crops were long clover and wheat. The estimated
regression equations for sugar crops area response are
presented in Table 5. The variables that appear statistically
significant are shown in the Table. As expected, the estimated
coefficients of lagged area, crop price, and net return of the
crop have positive values.
The sugar cane area responses to change in the crop net
return, with elasticity of response about 0.02. This means that
as net return per Feddan rises by 1%, the cultivated area under
cane would tend to rise by only 0.02%. The cultivated area of
sugar beet responses to change in both area under the crop
lagged by one year and crop price, with partial elasticity of
response about 0.40 and 0.57, respectively. The model
elasticity was 0.97 indicating an increase in both areas under
the crop lagged by one year and crop price by 1% leads to an
increase in cultivated area under sugar beet by 0.97%. This
means that farmers can make adjustment on area allocation
under sugar beet through the manipulation of the price of beet.
Table 5. Estimated Coefficients and Related Statistics for Area Supply Response for Sugar Crops in Egypt.
Dependent Variable
(Cultivated Area) Equation Intercept
Regression coefficients
R2 F-ratio b1 Lagged Area b2 Crop Price b3 Crop Net Return
Sugar Cane Double Log 5.56 - - 0.02
0.48 8.89** 8.48 2.98**
Sugar Beet Double Log 0.29 0.40 0.57 -
0.96 133.93** 0.85 2.70* 4.06**
Where: b1 is the parameter of (X1) area under the crop lagged by one year, b2 is the parameter of (X2) crop price, and b3 is the parameter of (X3) the crop net
return.
Source: Computed Based on Data from MALR **significant at one percent level, *significant at five percent level of significance.
3.2. Performance of Sugar Industry in Egypt
There are some features of technical performance such as
crushing capacity and its utilization, the availability of sugar
cane for crushing, extraction ratio, and operational efficiency.
Table 6. shows sugar factories and their design capacity as
well as utilization percentage. Due to the fact that sugar
industry depends on the availability of the sugar cane,
factories are located within the cane growing area in Egypt.
Most of these factories are located in upper Egypt
specifically in Menia, Sohag, Qena, Luxor, and Aswan.
There are eight cane factories which are managed by the
Egyptian sugar company integrated industries. The capacity
utilization varies from among factories based on the
cultivated area under sugar crops close to factory zone,
supplied production of sugar crops for processing, and
delivery prices. Despite constructing sugar cane factories
designed with a capacity reached about 10.20 million tons of
sugar cane, their capacity utilization percentage was 83.23%
as average of the period (2010-2014). The maximum
capacity utilization was 115.44% for Edfou factory, while the
minimum capacity rate was about 50.21% of their full
capacity for Abou Korkas factory. The low capacity
utilization percentage is attributed to lack of cane for
grinding, while the capacity utilization percentage of all beet
factories was about 96.95% of the installed capacity during
the same period. With respect to estimating capacity
utilization of beet the rate reached its maximum with a bout
of 117.12% at Kafr El Sheikh factory and its minimum was
about 55.16% at Alexandria factory. The high utilization
capacity was due to an increase in quantities of supplied
sugar beet.

International Journal of Agricultural Economics 2017; 2(4): 96-109 102
Table 6. Technical Performance of Sugar Factories in Egypt, (2010-2014).
Sugar Cane Sugar Beet
Factory Installed Capacity
(thousand tons)
Capacity Utilization
(%) Factory
Installed Capacity
(thousand tons)
Capacity Utilization
(%)
Abou Korkas 700 50.21 Kafr El Sheikh 1750 117.21
Gerga 1000 55.89 Dakahlia 1750 111.93
Nagy Hamady 1700 86.02 Fayoum 1250 99.70
Deshna 1000 76.91 Nobaria 1000 84.28
Quos 1600 93.78 EL-Nil 1000 78.41
Armant 1300 98.62 Abou korkas 550 111.33
Edfou 1100 115.44 Alexandria 1000 55.16
Kom-embou 1800 104.57 Average 8300 96.95
Average 10200 88.23
Source: Calculated Based on Data from MALR, Council of sugary crops, Annual Report, Various Issues.
Table 7 shows the trends of produced sugar and its
percentage of total supplied production, extraction ratio, and
operation efficiency during the period (2000-2014). The
average extraction rate was about 11.39% and 13.57% for
sugar cane and beet, respectively. This rate was lower than
theoretical ratio, indicating an existence of unused capacity of
sugar factories. Also, the extraction rate is influenced by the
quality of sugar cane delivered by the farmers and weather
conditions.
The average of operation efficiency was about 85.29% and
90.97% for sugar cane and sugar beet, respectively. This
indicates that the resources used in sugar cane processing were
inefficient. There were lower capacity utilization of factories
problems because the availability of cane which is supplied to
factories by farmers and low delivery prices. The supplied
production of cane declined by an annual rate of 0.48% during
the same period. Sugar processed grew at a significant annual
rate of 1.10% resulting from the increase of extraction rate.
The operation efficiency recorded a significant annual growth
rate of 1.60%. The time trend variable explains 49% of the
variation in operation efficiency of cane factories.
Table 7. Time Trend Estimates of Technical Performance Indicators for Sugar Processing in Egypt During (2000-2014).
Crop Equation Intercept Regression coefficients
R2 F-ratio Annual
Average
Growth
Rate % b1 b2 b3
Sugar Cane
Supplied Production Linear 9794.27 - 45.71 - - 0.30 5.53* 9428.57 - 0.48
Sugar Processed Linear 979.84 0.011 - - 0.39 8.27** 1074.70 1.10
Extraction Rate Exponential 10.01 0.016 - - 0.49 12.33** 11.39 1.60
Operation Efficiency* Exponential 74.67 0.016 - - 0.49 12.33** 85.29 1.60
Sugar Beet
Supplied Production Linear 2069.17 0.096 - - 0.86 82.82** 2279.09 9.60
Sugar Processed Linear 278.11 0.097 - - 0.91 138.34** 664.76 9.70
Extraction Rate Cubic 12.28 0.84 -0.12 0.01 0.34 1.88 13.57 N.s.
Operation Efficiency Cubic 81.91 5.62 -.81 0.03 0.34 1.88 90.97 N.s.
*Operation Efficiency = Extraction ratio/Theoretical Extraction ratio
Extraction ratio = Sugar processed /supplied quantity of cane or beet
N.s. = not significant
Source: Calculated Based on Data from MALR, Council of sugary crops, Annual Report, Various Issues. ** Indicates significant at one percent level * Indicates significant at five percent level.
During the period (2000-2014), the supplied production to
the beet factories was highly significant, with an annual
growth rate of 9.60%. The quantity of sugar processed also
grew at a significant annual rate of 9.70%. and 91% of the
variation in sugar production is explained by the time factor.
Although supplied production contributed significantly to an
increase in sugar processed levels, extraction rate for beet
processing showed a stagnant position. Where the derived
growth rate of these variables was considered zero, as the time
response coefficient was statistically insignificant.
3.3. Economic Analysis of Sugar Consumption
3.3.1. Development of The Sugar Production, Consumption,
and Gap in Egypt
According to Table 2 in the Appendix, the production of
sugar in Egypt is about 1.73 million tons as average of the
period (2000-2015). Sugar cane contributed to about 1057.31
thousand tons representing 61.28% of the total sugar
production, while sugar beet accounted only for 668.01
thousand tons with a percentage 38.72% of the production in
the same study period. It is observed that the share of sugar
cane decreased from a maximum of 74.47% in 2000 to a
minimum of 43.52% in 2015. While the share of sugar beet
increased from a minimum of 25.53% in 2000 to a maximum
of 56.75% in 2015, resulting from some efforts made by the
state to increase its cultivated area and productivity during the
last years. The sugar beet production increases with a
significant annual rate of 9.68% of the average production
during the period of study (699.17 thousand tons). But, for
sugar cane, the time trend variable is insignificant. The trend
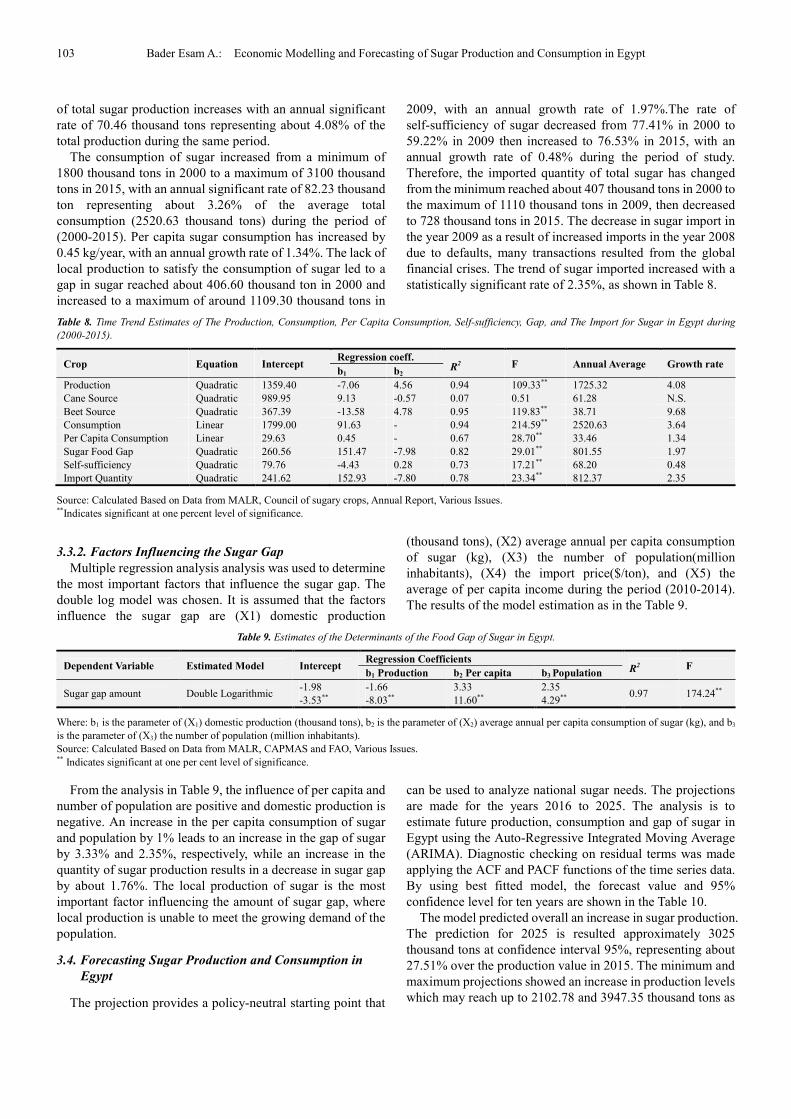
103 Bader Esam A.: Economic Modelling and Forecasting of Sugar Production and Consumption in Egypt
of total sugar production increases with an annual significant
rate of 70.46 thousand tons representing about 4.08% of the
total production during the same period.
The consumption of sugar increased from a minimum of
1800 thousand tons in 2000 to a maximum of 3100 thousand
tons in 2015, with an annual significant rate of 82.23 thousand
ton representing about 3.26% of the average total
consumption (2520.63 thousand tons) during the period of
(2000-2015). Per capita sugar consumption has increased by
0.45 kg/year, with an annual growth rate of 1.34%. The lack of
local production to satisfy the consumption of sugar led to a
gap in sugar reached about 406.60 thousand ton in 2000 and
increased to a maximum of around 1109.30 thousand tons in
2009, with an annual growth rate of 1.97%.The rate of
self-sufficiency of sugar decreased from 77.41% in 2000 to
59.22% in 2009 then increased to 76.53% in 2015, with an
annual growth rate of 0.48% during the period of study.
Therefore, the imported quantity of total sugar has changed
from the minimum reached about 407 thousand tons in 2000 to
the maximum of 1110 thousand tons in 2009, then decreased
to 728 thousand tons in 2015. The decrease in sugar import in
the year 2009 as a result of increased imports in the year 2008
due to defaults, many transactions resulted from the global
financial crises. The trend of sugar imported increased with a
statistically significant rate of 2.35%, as shown in Table 8.
Table 8. Time Trend Estimates of The Production, Consumption, Per Capita Consumption, Self-sufficiency, Gap, and The Import for Sugar in Egypt during
(2000-2015).
Crop Equation Intercept Regression coeff.
R2 F Annual Average Growth rate
b1 b2
Production Quadratic 1359.40 -7.06 4.56 0.94 109.33** 1725.32 4.08
Cane Source Quadratic 989.95 9.13 -0.57 0.07 0.51 61.28 N.S.
Beet Source Quadratic 367.39 -13.58 4.78 0.95 119.83** 38.71 9.68
Consumption Linear 1799.00 91.63 - 0.94 214.59** 2520.63 3.64
Per Capita Consumption Linear 29.63 0.45 - 0.67 28.70** 33.46 1.34
Sugar Food Gap Quadratic 260.56 151.47 -7.98 0.82 29.01** 801.55 1.97
Self-sufficiency Quadratic 79.76 -4.43 0.28 0.73 17.21** 68.20 0.48
Import Quantity Quadratic 241.62 152.93 -7.80 0.78 23.34** 812.37 2.35
Source: Calculated Based on Data from MALR, Council of sugary crops, Annual Report, Various Issues. **Indicates significant at one percent level of significance.
3.3.2. Factors Influencing the Sugar Gap
Multiple regression analysis analysis was used to determine
the most important factors that influence the sugar gap. The
double log model was chosen. It is assumed that the factors
influence the sugar gap are (X1) domestic production
(thousand tons), (X2) average annual per capita consumption
of sugar (kg), (X3) the number of population(million
inhabitants), (X4) the import price($/ton), and (X5) the
average of per capita income during the period (2010-2014).
The results of the model estimation as in the Table 9.
Table 9. Estimates of the Determinants of the Food Gap of Sugar in Egypt.
Dependent Variable Estimated Model Intercept Regression Coefficients
R2 F b1 Production b2 Per capita b3
Population
Sugar gap amount Double Logarithmic -1.98 -1.66 3.33 2.35
0.97 174.24** -3.53** -8.03** 11.60** 4.29**
Where: b1 is the parameter of (X1) domestic production (thousand tons), b2 is the parameter of (X2) average annual per capita consumption of sugar (kg), and b3
is the parameter of (X3) the number of population (million inhabitants).
Source: Calculated Based on Data from MALR, CAPMAS and FAO, Various Issues. ** Indicates significant at one per cent level of significance.
From the analysis in Table 9, the influence of per capita and
number of population are positive and domestic production is
negative. An increase in the per capita consumption of sugar
and population by 1% leads to an increase in the gap of sugar
by 3.33% and 2.35%, respectively, while an increase in the
quantity of sugar production results in a decrease in sugar gap
by about 1.76%. The local production of sugar is the most
important factor influencing the amount of sugar gap, where
local production is unable to meet the growing demand of the
population.
3.4. Forecasting Sugar Production and Consumption in
Egypt
The projection provides a policy-neutral starting point that
can be used to analyze national sugar needs. The projections
are made for the years 2016 to 2025. The analysis is to
estimate future production, consumption and gap of sugar in
Egypt using the Auto-Regressive Integrated Moving Average
(ARIMA). Diagnostic checking on residual terms was made
applying the ACF and PACF functions of the time series data.
By using best fitted model, the forecast value and 95%
confidence level for ten years are shown in the Table 10.
The model predicted overall an increase in sugar production.
The prediction for 2025 is resulted approximately 3025
thousand tons at confidence interval 95%, representing about
27.51% over the production value in 2015. The minimum and
maximum projections showed an increase in production levels
which may reach up to 2102.78 and 3947.35 thousand tons as
International Journal of Agricultural Economics 2017; 2(4): 96-109 104
a lower and upper values, respectively, by the year 2025.
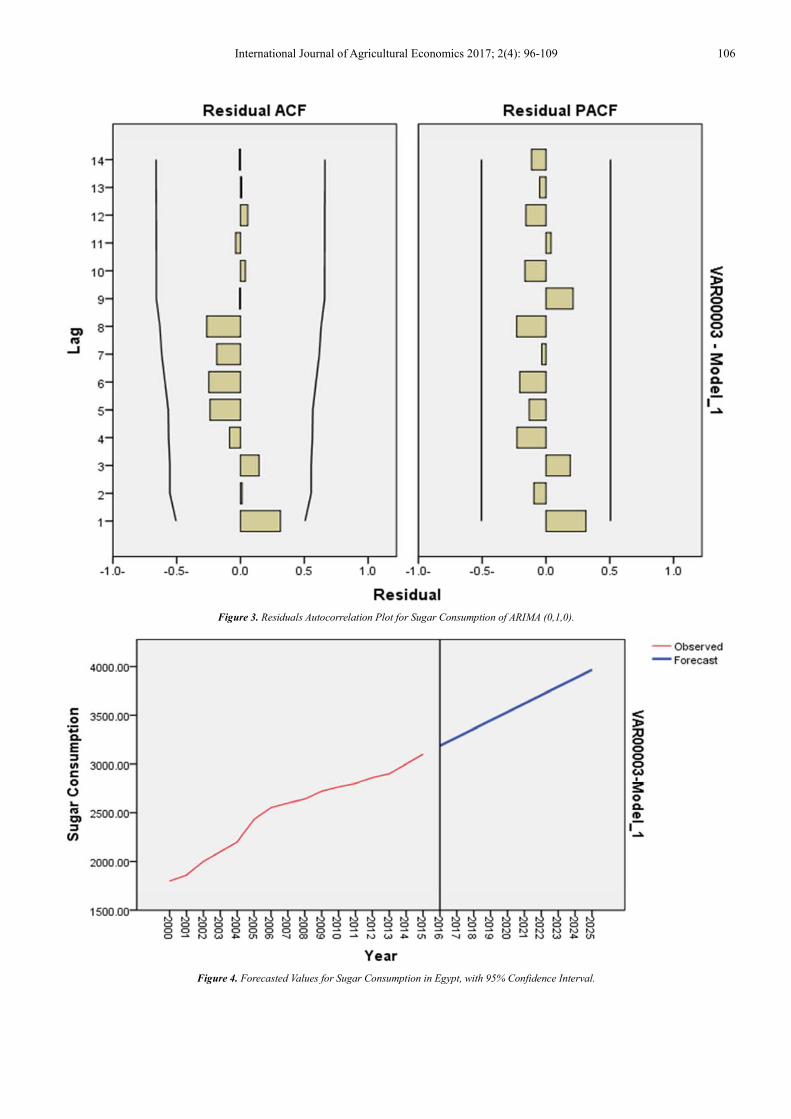
The best fitted ARIMA model applied for sugar
consumption was (0,1,0). ARIMA model projected that
consumption will increase from 3100 in 2015 to 3966.67
thousand tons in 2025, with an increase ratio of about 28%
more than its value in 2015 (Table 10). With 95% confidence
interval, the maximum consumption would increase from
3297.90 thousand tons in 2016 to 4318.43 thousand tons in
2025. This increase may be due to an increase in population of
Egypt and per capita consumption.
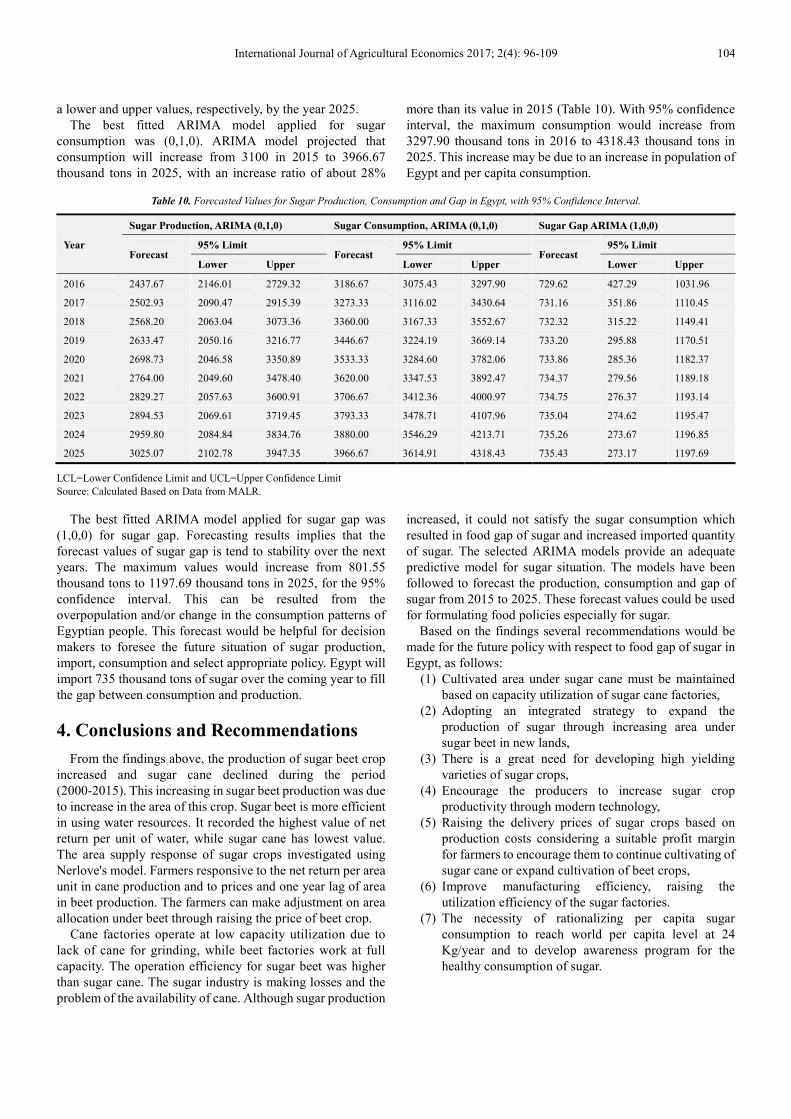
Table 10. Forecasted Values for Sugar Production, Consumption and Gap in Egypt, with 95% Confidence Interval.
Year
Sugar Production, ARIMA (0,1,0) Sugar Consumption, ARIMA (0,1,0) Sugar Gap ARIMA (1,0,0)
Forecast 95% Limit
Forecast 95% Limit
Forecast 95% Limit
Lower Upper Lower Upper Lower Upper
2016 2437.67 2146.01 2729.32 3186.67 3075.43 3297.90 729.62 427.29 1031.96
2017 2502.93 2090.47 2915.39 3273.33 3116.02 3430.64 731.16 351.86 1110.45
2018 2568.20 2063.04 3073.36 3360.00 3167.33 3552.67 732.32 315.22 1149.41
2019 2633.47 2050.16 3216.77 3446.67 3224.19 3669.14 733.20 295.88 1170.51
2020 2698.73 2046.58 3350.89 3533.33 3284.60 3782.06 733.86 285.36 1182.37
2021 2764.00 2049.60 3478.40 3620.00 3347.53 3892.47 734.37 279.56 1189.18
2022 2829.27 2057.63 3600.91 3706.67 3412.36 4000.97 734.75 276.37 1193.14
2023 2894.53 2069.61 3719.45 3793.33 3478.71 4107.96 735.04 274.62 1195.47
2024 2959.80 2084.84 3834.76 3880.00 3546.29 4213.71 735.26 273.67 1196.85
2025 3025.07 2102.78 3947.35 3966.67 3614.91 4318.43 735.43 273.17 1197.69
LCL=Lower Confidence Limit and UCL=Upper Confidence Limit
Source: Calculated Based on Data from MALR.
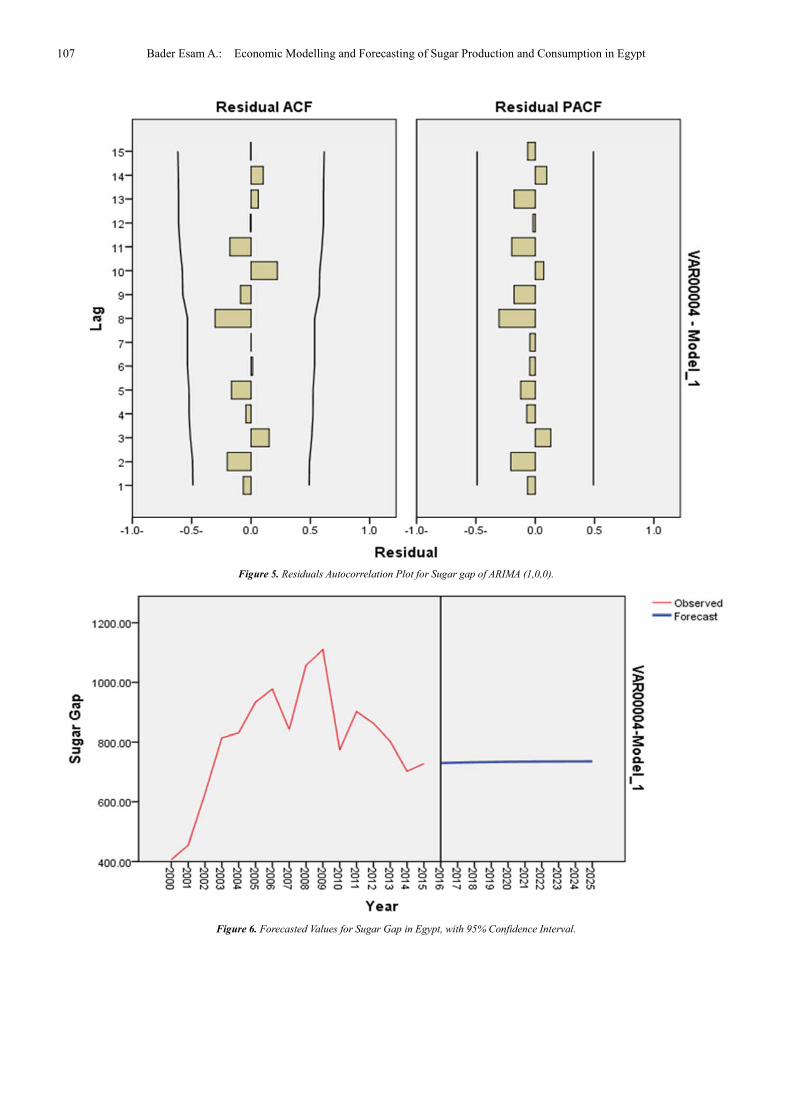
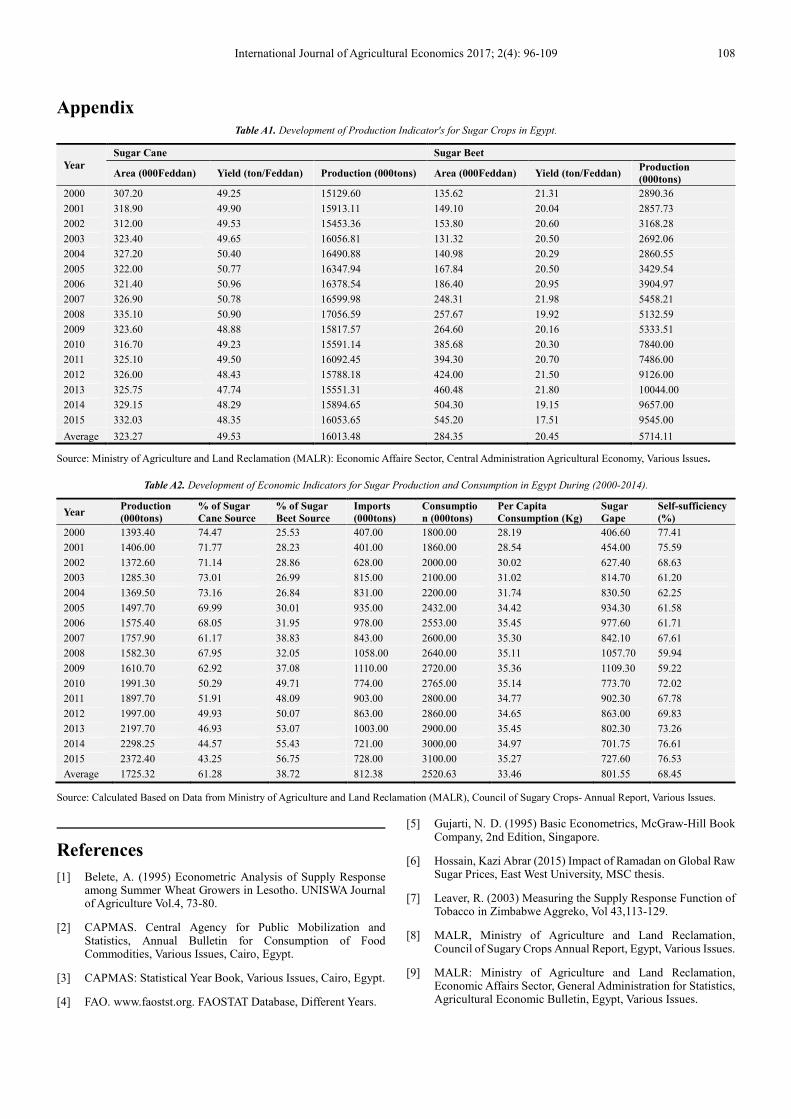
The best fitted ARIMA model applied for sugar gap was
(1,0,0) for sugar gap. Forecasting results implies that the
forecast values of sugar gap is tend to stability over the next
years. The maximum values would increase from 801.55
thousand tons to 1197.69 thousand tons in 2025, for the 95%
confidence interval. This can be resulted from the
overpopulation and/or change in the consumption patterns of
Egyptian people. This forecast would be helpful for decision
makers to foresee the future situation of sugar production,
import, consumption and select appropriate policy. Egypt will
import 735 thousand tons of sugar over the coming year to fill
the gap between consumption and production.
4. Conclusions and Recommendations
From the findings above, the production of sugar beet crop
increased and sugar cane declined during the period
(2000-2015). This increasing in sugar beet production was due
to increase in the area of this crop. Sugar beet is more efficient
in using water resources. It recorded the highest value of net
return per unit of water, while sugar cane has lowest value.
The area supply response of sugar crops investigated using
Nerlove's model. Farmers responsive to the net return per area
unit in cane production and to prices and one year lag of area
in beet production. The farmers can make adjustment on area
allocation under beet through raising the price of beet crop.
Cane factories operate at low capacity utilization due to
lack of cane for grinding, while beet factories work at full
capacity. The operation efficiency for sugar beet was higher
than sugar cane. The sugar industry is making losses and the
problem of the availability of cane. Although sugar production
increased, it could not satisfy the sugar consumption which
resulted in food gap of sugar and increased imported quantity
of sugar. The selected ARIMA models provide an adequate
predictive model for sugar situation. The models have been
followed to forecast the production, consumption and gap of
sugar from 2015 to 2025. These forecast values could be used
for formulating food policies especially for sugar.
Based on the findings several recommendations would be
made for the future policy with respect to food gap of sugar in
Egypt, as follows:
(1) Cultivated area under sugar cane must be maintained
based on capacity utilization of sugar cane factories,
(2) Adopting an integrated strategy to expand the
production of sugar through increasing area under
sugar beet in new lands,
(3) There is a great need for developing high yielding
varieties of sugar crops,
(4) Encourage the producers to increase sugar crop
productivity through modern technology,
(5) Raising the delivery prices of sugar crops based on
production costs considering a suitable profit margin
for farmers to encourage them to continue cultivating of
sugar cane or expand cultivation of beet crops,
(6) Improve manufacturing efficiency, raising the
utilization efficiency of the sugar factories.
(7) The necessity of rationalizing per capita sugar
consumption to reach world per capita level at 24
Kg/year and to develop awareness program for the
healthy consumption of sugar.

105 Bader Esam A.: Economic Modelling and Forecasting of Sugar Production and Consumption in Egypt
Figure 1. Residuals Autocorrelation Plot for Sugar Production of ARIMA (0,1,0).
Figure 2. Forecasted Values for Sugar Production in Egypt, with 95% Confidence Interval.
International Journal of Agricultural Economics 2017; 2(4): 96-109 106
Figure 3. Residuals Autocorrelation Plot for Sugar Consumption of ARIMA (0,1,0).
Figure 4. Forecasted Values for Sugar Consumption in Egypt, with 95% Confidence Interval.
107 Bader Esam A.: Economic Modelling and Forecasting of Sugar Production and Consumption in Egypt
Figure 5. Residuals Autocorrelation Plot for Sugar gap of ARIMA (1,0,0).
Figure 6. Forecasted Values for Sugar Gap in Egypt, with 95% Confidence Interval.
International Journal of Agricultural Economics 2017; 2(4): 96-109 108
Appendix Table A1. Development of Production Indicator's for Sugar Crops in Egypt.
Year
Sugar Cane Sugar Beet
Area (000Feddan) Yield (ton/Feddan) Production (000tons) Area (000Feddan) Yield (ton/Feddan) Production
(000tons)
2000 307.20 49.25 15129.60 135.62 21.31 2890.36
2001 318.90 49.90 15913.11 149.10 20.04 2857.73
2002 312.00 49.53 15453.36 153.80 20.60 3168.28
2003 323.40 49.65 16056.81 131.32 20.50 2692.06
2004 327.20 50.40 16490.88 140.98 20.29 2860.55
2005 322.00 50.77 16347.94 167.84 20.50 3429.54
2006 321.40 50.96 16378.54 186.40 20.95 3904.97
2007 326.90 50.78 16599.98 248.31 21.98 5458.21
2008 335.10 50.90 17056.59 257.67 19.92 5132.59
2009 323.60 48.88 15817.57 264.60 20.16 5333.51
2010 316.70 49.23 15591.14 385.68 20.30 7840.00
2011 325.10 49.50 16092.45 394.30 20.70 7486.00
2012 326.00 48.43 15788.18 424.00 21.50 9126.00
2013 325.75 47.74 15551.31 460.48 21.80 10044.00
2014 329.15 48.29 15894.65 504.30 19.15 9657.00
2015 332.03 48.35 16053.65 545.20 17.51 9545.00
Average 323.27 49.53 16013.48 284.35 20.45 5714.11
Source: Ministry of Agriculture and Land Reclamation (MALR): Economic Affaire Sector, Central Administration Agricultural Economy, Various Issues.
Table A2. Development of Economic Indicators for Sugar Production and Consumption in Egypt During (2000-2014).
Year Production
(000tons)
% of Sugar
Cane Source
% of Sugar
Beet Source
Imports
(000tons)
Consumptio
n (000tons)
Per Capita
Consumption (Kg)
Sugar
Gape
Self-sufficiency
(%)
2000 1393.40 74.47 25.53 407.00 1800.00 28.19 406.60 77.41
2001 1406.00 71.77 28.23 401.00 1860.00 28.54 454.00 75.59
2002 1372.60 71.14 28.86 628.00 2000.00 30.02 627.40 68.63
2003 1285.30 73.01 26.99 815.00 2100.00 31.02 814.70 61.20
2004 1369.50 73.16 26.84 831.00 2200.00 31.74 830.50 62.25
2005 1497.70 69.99 30.01 935.00 2432.00 34.42 934.30 61.58
2006 1575.40 68.05 31.95 978.00 2553.00 35.45 977.60 61.71
2007 1757.90 61.17 38.83 843.00 2600.00 35.30 842.10 67.61
2008 1582.30 67.95 32.05 1058.00 2640.00 35.11 1057.70 59.94
2009 1610.70 62.92 37.08 1110.00 2720.00 35.36 1109.30 59.22
2010 1991.30 50.29 49.71 774.00 2765.00 35.14 773.70 72.02
2011 1897.70 51.91 48.09 903.00 2800.00 34.77 902.30 67.78
2012 1997.00 49.93 50.07 863.00 2860.00 34.65 863.00 69.83
2013 2197.70 46.93 53.07 1003.00 2900.00 35.45 802.30 73.26
2014 2298.25 44.57 55.43 721.00 3000.00 34.97 701.75 76.61
2015 2372.40 43.25 56.75 728.00 3100.00 35.27 727.60 76.53
Average 1725.32 61.28 38.72 812.38 2520.63 33.46 801.55 68.45
Source: Calculated Based on Data from Ministry of Agriculture and Land Reclamation (MALR), Council of Sugary Crops- Annual Report, Various Issues.
References
[1] Belete, A. (1995) Econometric Analysis of Supply Response among Summer Wheat Growers in Lesotho. UNISWA Journal of Agriculture Vol.4, 73-80.
[2] CAPMAS. Central Agency for Public Mobilization and Statistics, Annual Bulletin for Consumption of Food Commodities, Various Issues, Cairo, Egypt.
[3] CAPMAS: Statistical Year Book, Various Issues, Cairo, Egypt.
[4] FAO. www.faostst.org. FAOSTAT Database, Different Years.
[5] Gujarti, N. D. (1995) Basic Econometrics, McGraw-Hill Book Company, 2nd Edition, Singapore.
[6] Hossain, Kazi Abrar (2015) Impact of Ramadan on Global Raw Sugar Prices, East West University, MSC thesis.
[7] Leaver, R. (2003) Measuring the Supply Response Function of Tobacco in Zimbabwe Aggreko, Vol 43,113-129.
[8] MALR, Ministry of Agriculture and Land Reclamation, Council of Sugary Crops Annual Report, Egypt, Various Issues.
[9] MALR: Ministry of Agriculture and Land Reclamation, Economic Affairs Sector, General Administration for Statistics, Agricultural Economic Bulletin, Egypt, Various Issues.
109 Bader Esam A.: Economic Modelling and Forecasting of Sugar Production and Consumption in Egypt
[10] Mythili G. (2008) Acreage and Yield Response for Major Crops in the Pre-and Post-Reform Periods in india: A Dynamic Panal Data Approach, Report prepared for IGIDR-ERS/USDA Project: Agricultural Markets and Policy. Mumbai, India.
[11] Suresh, K. K., and Priya, S. R. K. (2011) Forecasting
Sugarcane Yield of Tamil Nadu Using ARIMA Models. Sugar Technology, 13 (1), 23-26.
[12] Wasim P. M. (2005) Milk Production Response in Pakistan. The Lahore Journal of Economics Vol.10 (1), 105-121.