International Investment Patterns - imf.org · A number of papers have also focused more...
46
WP/04/134 International Investment Patterns Philip R. Lane and Gian Maria Milesi-Ferretti
Transcript of International Investment Patterns - imf.org · A number of papers have also focused more...

WP/04/134
International Investment Patterns
Philip R. Lane and
Gian Maria Milesi-Ferretti
© 2004 International Monetary Fund WP/04/134
IMF Working Paper
Research Department
International Investment Patterns1
Prepared by Philip R. Lane and Gian Maria Milesi-Ferretti
July 2004
Abstract
This Working Paper should not be reported as representing the views of the IMF. The views expressed in this Working Paper are those of the author(s) and do not necessarily represent those of the IMF or IMF policy. Working Papers describe research in progress by the author(s) and are published to elicit comments and to further debate.
The paper provides a systematic analysis of bilateral, source and host factors driving portfolio equity investment across countries, using newly-released data on international equity holdings at the end of 2001. It develops a model that links bilateral equity holdings to bilateral trade in goods and services and finds that the data strongly support such a correlation. Larger bilateral positions are also associated with proxies for informational proximity. It further documents that the scale of aggregate foreign equity asset and liability holdings is larger for richer countries and countries with more developed stock markets. JEL Classification Numbers: F21, F34 Keywords: International portfolio equity investment, gravity, international trade Author’s E-Mail Address: [email protected], [email protected] 1 Philip R. Lane is professor of economics at Trinity College Dublin. The authors thank John Joisce and Samuele Rosa for discussions and clarifications on the Portfolio Survey data; Natalia Tamirisa for the data on capital controls; and Gabriele Galati, Paula Hernandez-Verme, Kathryn Dominguez, Philippe Martin, Frank Warnock, Jim Markusen, and participants at the CEPR ESSIM 2003, the ECB workshop “The External Dimension of the Euro Area,” the UH/Dallas Fed. Reserve international conference, and seminars at the IMF, IIIS-TCD, Banco de Portugal, GREMAQ, IIES, LSE, and the FRB of New York for comments. Madhuri Edwards, Vahagn Galstyan, Charles Larkin, and Victor Shlychkov provided able research assistance. Part of this paper was written while Lane was a visiting scholar at the FRB of New York and the IMF. Lane gratefully acknowledges the financial support of the Irish Research Council on Humanities and Soc. Sciences (IRCHSS) and the HEA-PRTLI grant to the IIIS. This paper is also part of a research network on “The Analysis of International Capital Markets: Understanding Europe’s Role in the Global Economy,” funded by the European Commission under the Research Training Network Programme (Contract No. HPRN–CT–1999–00067).

- 2 -
Contents Page
I. Introduction............................................................................................................................ 3 II. Theoretical Framework......................................................................................................... 5 III. Empirical Strategy............................................................................................................... 9
A. Specification ............................................................................................................. 9 B. Bilateral Factors...................................................................................................... 10 C. Source and Host Country Factors ........................................................................... 11
IV. Data: Description and Issues............................................................................................. 12
A. Stylized Facts of the 2001 CPIS: Aggregate Investment ....................................... 13 B. Stylized Facts of the 2001 CPIS: Bilateral Investment Patterns............................. 14
V. Empirical Analysis ............................................................................................................. 15
A. The Determinants of Bilateral Equity Holdings..................................................... 15 B. Aggregate Asset Positions ...................................................................................... 22 C. Aggregate Liability Positions ................................................................................. 23
VI. Concluding Remarks ......................................................................................................... 25
Appendix I. .............................................................................................................................................. 27 Tables 1. Largest Holders of Portfolio Equity Assets......................................................................... 30 2. Largest Holders of Portfolio Equity Liabilities................................................................... 30 3. Summary Statistics on Stock Market Size and Foreign Ownership (2001) ........................ 31 4. Foreign Portfolio Equity Investment: Actual and Predicted Shares.................................... 31 5. Bilateral Portfolio Equity Holdings, All Countries: Panel Regressions with Fixed
Source and Host Effects ...................................................................................................... 32 6. Bilateral Portfolio Equity Holdings, OECD Source Countries: Panel Regressions with Fixed Source and Host Effects .................................................................................... 33 7. Bilateral Portfolio Equity Holdings, Emerging Market Source Countries: Panel Regressions with Fixed Source and Host Effects................................................................ 34 8. Determinants of Aggregate Portfolio Equity Assets (2001 end-of-period stock) ............... 35 9. Determinants of Aggregate Portfolio Equity Liabilities (2001 end-of-period stock) ......... 36 A1. Sample Size, Number of Observations=0, and Total Equity Holdings............................ 37 A2. Portfolio Equity Investment: The Role of Financial and Offshore Centers ..................... 38 Figures 1. Degree of Foreign Equity Bias ............................................................................................ 39 2. Scatter of 2001 Equity Holdings versus 2001 Imports........................................................ 40 References ............................................................................................................................... 41

- 3 -
I. INTRODUCTION
This paper is motivated by the idea that understanding the geography of international investment provides insights into the globalization process. In a fully integrated global economy without frictions in product or asset markets, benchmark economic theory suggests that investors should hold identical portfolios, regardless of nationality. Documenting and explaining deviations from this benchmark position potentially reveals the nature of the current limitations on global economic integration. For instance, how do frictions in product markets affect the structure of international financial trade? Are cultural/informational factors important in explaining the bilateral structure of international portfolios? What is the connection between domestic and international financial development? Answers to these questions are of interest for several fields in economics, including international macroeconomics and international finance, portfolio analysis, and behavioral finance. An especially intriguing feature in international equity investment patterns is the presence of strong bilateral variation in portfolio allocations, in that different source countries attach sharply different weights across various host (destination) countries. Identifying the bilateral factors that explain these portfolio asymmetries is a major focus of our work. Moreover, the determinants of bilateral holdings also combine to affect aggregate positions: a financially remote country will receive less inward investment and face a higher cost of equity capital. Asymmetries in the geography of international investment also have potentially important implications for other international economic linkages. Most obviously, a negative shock in host country C will have a more negative wealth effect on investor country A than investor country B, if country A’s portfolio is more heavily weighted towards country C. In related fashion, the geography of investment positions also heavily shapes international risk-sharing patterns. Interest in studying these linkages has been heightened by the increase in international portfolio diversification over the past few years, as well as by evidence of increased comovements between the main economic and financial variables of the world’s largest economies, over and above what could be explained by trade. The pattern of bilateral financial linkages may influence the matrix of correlations in asset prices (Forbes and Chinn, 2003) and may also affect the degree of business cycle synchronization (Imbs, 2004a, 2004b). Relatedly, it may also affect the covariance structure of real exchange rates: if countries A and B have extensive bilateral financial cross-holdings, whereas country C is financially isolated, then we may expect larger real exchange rate movements between countries A and C than between countries A and B. Although some authors have previously considered aspects of the geography of international investment patterns, data limitations have meant that these contributions have been quite narrowly focused: for example, only considering a single source country (most often, the United States). In this paper, we make use of a new data set on international portfolio positions in order to explore this topic in a comprehensive manner. The data provide a

- 4 -
geographical breakdown of international portfolio holdings at end-2001 by 67 source countries, which include virtually all major international investors.2 In contrast to much of the existing literature, we attempt to guide our empirical work with reference to a simple theoretical model of bilateral equity investment patterns. In particular, we extend the work of Obstfeld and Rogoff (2001), presenting a simple theoretical framework that highlights trade as an important potential determinant of bilateral portfolio equity holdings. In our empirical analysis, we also explore the roles played by financial and informational frictions. In addition to highlighting the role of bilateral factors in explaining the structure of countries’ equity asset portfolios, our empirical work also considers the role of aggregate country characteristics in explaining the overall size of countries’ foreign equity asset and liability positions. There is a rapidly increasing literature trying to explain international patterns of bilateral investment. Typically, this literature has used empirical methods borrowed from the traditional gravity models of international goods trade, and has focused on direct investment and bank lending, for which data are readily available (from the OECD and BIS, respectively). Studies focusing on the geography of foreign direct investment include Wei (2000) and Stein and Daude (2003), among many others. Studies on bank lending include Buch (2002, 2003); Buch and others (2003); and Kawai and Liu (2001). Ghosh and Wolf (2001) and Sarisoy (2003) conduct a comparative analysis of the impact of spatial factors on different international investment categories, as do, for the United States, Portes, Rey, and Oh (2001). A number of papers have also focused more specifically on the pattern of bilateral equity investment. For example, Portes and Rey (2003) use portfolio equity flows from Capital Data and show that proxies for informational asymmetries, together with the size of host countries’ stock markets, are key determinants of the pattern of international equity flows. Other studies on the geography of the stock of portfolio equity investment have focused primarily on a single source country: the United States (Ahearne, Griever, and Warnock, 2003; Mann and Meade, 2002; Dahlquist, Pinkowitz, Stulz, and Williamson, 2002; and Ireland, Honohan and Lane, 2000.3 An exception is a recent paper by Yildirim (2003) that also exploits the 2001 CPIS data, employing a methodology different from ours. She examines the role of various corporate governance indicators in determining investment patterns, employing a subset of the CPIS data (23 source countries, 49 host countries) for which such data are available. Several of these studies are related to the voluminous literature on home bias. This literature is relevant: our approach is substantially different in focus, however, in that we also place 2 A still preliminary and incomplete set of data for end-2002 was posted on the IMF website in February 2004. The correlation in bilateral positions for end-2001 and end-2002 is 0.99 for those country pairs for which data are available for both years.
3 Coval and Moskowitz (1999) and Huberman (2001) explore regional investment patterns within the United States.

- 5 -
heavy emphasis on explaining the structure of the international component of portfolios rather than the split between domestic and foreign allocations.4 This project is theoretically and empirically innovative, relative to the existing literature. With regard to theory, we develop a coherent framework for analyzing bilateral equity holdings. With regard to empirics, the availability of detailed cross-country data permits a more comprehensive study of the determinants of international investment patterns that allows the joint analysis of both bilateral and aggregate positions. The structure of the rest of the paper is as follows. Section II develops a theoretical framework, and Section III the empirical strategy. Section IV describes the data and discusses some relevant interpretation issues. Econometric results are reported in Section V. Some preliminary conclusions and directions for future research are outlined in Section VI.
II. THEORETICAL FRAMEWORK
In respect of theory, we can identify three main approaches to modeling bilateral equity investment positions, illustrated by Obstfeld and Rogoff (2001), Martin and Rey (2003) and Davis, Nalewaik, and Willen (2001) respectively. In a two-country setting, Obstfeld and Rogoff (2001) show that the existence of frictions in product markets naturally generates a home bias in equity positions, even if global financial markets are complete. We develop an N-country generalization of this model later in this section, in order to draw out the implications of this approach for the bilateral composition of foreign portfolio holdings. In contrast, Martin and Rey (2003) focus on transactional frictions in asset markets.5 Their framework postulates incomplete asset markets, iceberg costs in financial markets, and endogenous asset creation: larger countries will have deeper domestic equity markets and a reduction in financial trade costs leads to more international asset trade. This approach generates a bilateral equation for equity positions as a function of the cost of bilateral financial trade and the endogenously-determined market capitalization levels. These authors broadly interpret financial frictions to include informational asymmetries.
4 Pinkowitz and others (2002) treat the domestic allocation of U.S. investors as being symmetric to the foreign allocation: however, some sources of home bias plausibly imply that the determinants of domestic investment are not identical to those for overseas investment.
5 See also the application in Martin and Rey (2000). The working paper version of Ahearne and others (2004) generate a similar reduced form, employing the portfolio model with country-specific proportional investment costs that was originally developed by Cooper and Kaplanis (1986).

- 6 -
Davis, Nalewaik and Willen (2001) also focus on financial market incompleteness. In their setup, a domestic agent faces a risky labor income stream. Domestic financial instruments consist of a riskless and a risky asset. The ability of a domestic agent to diversify risk at home depends on the correlation between labor income and the return on the risky asset. The degree to which the availability of a second risky asset (an international equity fund) improves risk allocation depends on its correlation with domestic labor income, in addition to its correlation with the domestic risky asset. The authors develop a procedure to assess the gains to international financial trade in risky assets that depends on these correlations. Importantly, agents from different countries will hold different combinations of risky assets, since the differences in labor income streams means that the “mutual fund separation theorem” does not hold: the returns on the various risky assets will have different correlations with the domestic labor income streams across countries. In what follows, we rely on an N-country generalization of the Obstfeld and Rogoff (2001) model to generate a benchmark empirical equation, but also allow for the financial frictions highlighted by others in our empirical investigation. In a two-country setting, Obstfeld and Rogoff show that the existence of trading costs in the goods market naturally generates a home bias in equity positions, even if global financial markets are complete. These authors also note that an additional potential source of variation in bilateral investment patterns is heterogeneity in consumption preferences.6 In the N-country generalization of the Obstfeld-Rogoff model, the share of country i ’s equity that is held by country j is: (a) a decreasing function of the bilateral trading cost between i and j , relative to the average trading costs between country i and all other countries; and (b) an increasing function of the relative importance of good i in country j ’s consumption preferences. The relative statement is important: it is the same point made by Anderson and van Wincoop (2003) in respect of “multilateral resistance” in product trade. The setup is as follows. There are N countries, each with a random endowment of a distinct perishable good: there is a symmetric joint distribution across 1( )NY Y... . A complete set of Arrow-Debreu securities are available. We consider a one-period portfolio problem. An individual agent in country j seeks to maximize the expected utility from consumption
1
1
11
1
11 1
i Nj
j ij iji
CEU E C E
θθ
θθ
ρρ
ωρ ρ
−−
− − = =
= =− −∑ (1)
where ijω is the relative preference by consumers in country j for good i , jC is the index of total real consumption, θ is the elasticity of substitution between any two goods and ρ is
6 It would be equivalent to model trade in intermediate inputs, which are then locally assembled into a nontradable final consumption good.

- 7 -
the coefficient of relative risk aversion. There are iceberg shipping costs: only a fraction (1 )ijτ− of a unit of a good shipped from country i to country j survives the journey. We normalize 1, 0jj jj jω τ= = ∀ . We assume competitive product markets such that (1 )ii ij ijP Pτ= − (2) where ii ijP P, denotes the prices of good i in countries i and j respectively. Free trade in Arrow-Debreu securities implies that the ratio of marginal utilities of consumption for good i between agents in countries i and j must reflect the relative price of good i between countries i and j :
1 1
ii ii ij ij
U U i jP C P C
∂ ∂= ∀ ,
∂ ∂ (3)
or 1 1 1 1(1 )ii i ij ij ij jC C C Cθ θ ρ θ θ ρτ ω− / / − − / / −= − (4) Under the simplifying assumption that 1ρ θ= / , this further reduces to [1 ]ij ij ii ijC Cθ θτ ω− = (5) In the goods market, output clearing requires that
1 (1 )
Nij
ij ij
CY
τ=
=
− ∑ (6)
It follows that the portfolio allocations required to generate equilibrium consumption shares are of the form
1
1
1
(1 )
(1 )ij ij
ij ijij iN
j
x Yθ θ
θ θτ ω
τ ω−
−∗
=
− = −
∑ (7)
Under the simplifying assumption that 1ρ θ= / , this allocation can be achieved under equity trade alone. The allocation means that country j holds a larger share in country i’s equity, the lower is the transport cost between countries i and j relative to the average transport cost

- 8 -
between country i and all other countries; and the greater is the relevant importance attached to good i in country j’s consumption preferences. The log of this expression yields
1
1
log( ) ( 1) log(1 ) log( ) log( (1 ) ]) log[N
ij ij ij ij ij ij
x Yθ θθ τ θ ω τ ω∗ −
=
= − − + − − +∑ (8)
The latter two terms are constant for fixed i across all pairs ( )i j, and so can be represented by a country- i constant. This allows us to simplify the expression to log( ) ( 1) log(1 ) log( )ij i ij ijx α θ τ θ ω∗ = + − − + (9) The above analysis assumes symmetry across countries (i.e. identical shares in consumption in the absence of transport costs or heterogeneity in preferences). It is straightforward to allow for differences across countries (e.g. differences in relative country sizes). In fact, this delivers a revised version of the portfolio allocation equation
1
1
11
(1 )
(1 )
ij ij jij i NN
jij ijjj
Wx Y
W
θ θ
θ θ
τ ω
τ ω
−∗
−
==
− = −
∑∑ (10)
where the last term is the share of country j in global wealth. In the log transformation, this term can be represented by a country-j constant log ( 1) log(1 ) log( )ij i j ij ij ijx vα α θ τ θ ω∗
= + + − − + + (11) Empirically, transport costs and consumer preferences are not directly observable. One approach would be to develop proxies for these variables. However, in the model, the volume of imports to country j from country i perfectly captures the impact of these variables. Indeed, the theoretical correspondence between equity holdings and imports is one-to-one log( ) log( )ij ijx IMP= (12) Clearly, other bilateral factors—in addition to the level of imports—matter for the pattern of international equity investment. A simple way to account for these factors is the following. While equation (10) gives the benchmark allocation, frictions in financial markets, information asymmetries or behavioral-finance factors may induce deviations from this benchmark. These factors could be represented by log( ) logij ij i j ij ijx x Fφ φ γ η∗
− = + + + (13)

- 9 -
where ,i jφ φ denote “aggregate” financial frictions that apply at the level of the source and host countries and ijF denotes a set of factors that generate financial frictions at the bilateral level. In combination with equation (10), this gives a new equation log( ) log( )ij i j ij ij ijx IMP Fφ φ σ γ ε= + + + + (14) where we allow for a non-unitary coefficient on the trade variable in view of the possibility that bilateral trade may partly operate as an information variable that reduces bilateral financial frictions.7 (Of course, measurement error in the imports variables is another reason to expect the coefficient estimate to deviate from unity.)
III. EMPIRICAL STRATEGY
We focus on a single cross-sectional observation for the structure of external equity portfolios for the year 2001.8 In line with the theoretical framework developed in the previous section, our empirical strategy is to isolate the relative contributions of (i) bilateral factors; (ii) source-country factors; and (iii) host-country factors. Bilateral factors may explain the heterogeneity in the geographical composition of the asset portfolios of source countries and the investor bases of host countries. Controlling for these bilateral considerations, source-country factors help us to explain cross-country differences in the propensity to invest overseas while host-country factors are potentially important in determining variation in the attractiveness of different destinations for overseas investors.
A. Specification
In general, the specification equation (14) guides the empirical work. However, we augment this bilateral equation with equations that seek to explain the fixed effects iα and jα i i iH uα ρ= + (15)
7 This equation suggests that the appropriate specification for a regression explaining bilateral equity investment patterns should include both source- and host-country fixed effects. Anderson and van Wincoop (2003b) also emphasize the importance of including country dummies in gravity trade models, for analogous reasons. See also Baltagi et al (2003). Anderson and van Wincoop (2003a) implement a nonlinear estimation method, while Rose and van Wincoop (2002) rely instead on country dummies.
8As noted in the introduction, the 1997 survey refers to a much smaller set of source countries; the newly-released results for end-2002 are still provisional and incomplete (and, at any rate, highly correlated with the end-2001 positions).

- 10 -
j j jS uα ρ= + (16) where ,i jH S are vectors of country characteristics that explain variation in the aggregate levels of portfolio positions for host and source countries respectively. Most existing empirical work on the geographical allocation of equity holdings, such as Ahearne et al (2003) and Pinkowitz et al (2002), considers a single source country and cannot control for host-country fixed effects. Our broader data set allows us to adopt this more general approach.
B. Bilateral Factors
In section II, we developed a benchmark allocation model in which bilateral portfolio positions are related to the level of bilateral. In addition, we highlighted that various informational and financial frictions may also influence bilateral allocations. In common with others (e.g. Portes and Rey 2003), we include an array of gravity-type variables to proxy for information costs. Since trade volume is directly included in the regression, these variables should exert an independent influence on portfolio positions only to the extent that they proxy for informational or other financial frictions.9 We include in this list: distance, the time zone difference, common language, colonial relationship, a currency union dummy, a dummy for the existence of an investment tax treaty, and, as a general proxy for institutional similarity, a dummy for common origins to the legal system.10 In some specifications (albeit at the cost of a major reduction in sample size), we also include some bilateral financial correlations that may influence asset holdings in an incomplete-markets environment. These include the correlation in stock market returns and the correlation in GDP growth rates.11 In addition, following Davis et al (2001), we also include the correlation between the host-country stock market return and the source-country GDP growth rate to take into account the role of the host-country stock market in potentially hedging against source-country output fluctuations. In all cases, these correlations are calculated using historical data: since much of the foreign portfolio equity investment took
9 In addition, the inclusion of these variables ensures that the estimated import effect is not driven by omitted variable bias, since these variables are naturally highly correlated with the volume of trade but may yet exert an independent influence on bilateral equity holdings.
10 We additionally explored the contribution of telephone traffic and the level of bilateral migration as proxies for information flows. Both variables reduce sample size considerably, particularly the latter, which is available for only 8 countries (see Section V). Although each is significant in a bivariate regression, neither is significant in a multivariate setting.
11 We also examined the volatility of the bilateral real exchange rate. However, this had little explanatory power, being highly correlated with the set of host and source country fixed effects.

- 11 -
place only since the mid-1990s, we are confident that the endogeneity of financial correlations to the level of bilateral financial holdings is not a major concern. However, as a robustness check, we also report instrumental-variables estimates that allow for the potential endogeneity of a number of regressors.
C. Source and Host Country Factors
Our theoretical framework suggests that larger economies will have correspondingly larger international equity asset and liability positions. However, the size-holdings relation may be less than proportional: the gains to international risk-sharing may larger for a smaller country, due to the lesser scope for domestic diversification. In addition to economic size, according to the logic of our benchmark model, measures of aggregate trade openness should also be important in explaining aggregate international investment activity. In previous work, we have argued that a number of other characteristics can help explain variation in the levels of cross-border asset holdings (Lane and Milesi-Ferretti 2001a, 2001b, 2003).12 For instance, to the extent that there are fixed costs to overseas investment and that risk aversion is decreasing in wealth, we may expect richer countries to invest more overseas. Moreover, a well-developed domestic financial sector may also affect international investment through a variety of mechanisms. First, a large domestic financial sector facilitates international risk sharing by enabling the issuing of liabilities to foreign investors. Second, the accumulation of domestic financial assets and liabilities may increase the need to diversify overseas, especially if it increases exposure to domestic risk. Third, the sophistication that is acquired through domestic financial transactions may reduce the barriers to international investment. All those factors would lead us to expect a positive correlation between domestic financial market development and international asset holdings. However, a counter-argument is that, domestic investors may be more prone to invest overseas if investment opportunities in a shallow domestic financial market are scarce—hence, for a given level of economic development, a shallower domestic financial market may be associated with higher asset holdings overseas. On the liability side, the size of the domestic financial market is a basic constraint on the scale of foreign portfolio liabilities: foreign portfolio equity investment in domestic public companies cannot exceed the size of the domestic stock market capitalization. A country’s history with capital controls may bind the level of foreign holdings: a country with a ‘natural’ potential to invest overseas may have an artificially small foreign asset position if capital controls are currently in place or have been in the recent past. We also include a dummy for financial centers, to allow for the possibility that some holdings by intermediaries (rather than the ultimate owners) are included in the data. 12 Here, we examine separately the determinants of equity assets and equity liabilities. Lane and Milesi-Ferretti (2003) consider the determinants of the sum of equity assets and liabilities, as a measure of general international financial integration.

- 12 -
In addition to these structural characteristics, we also include historical measures of stock market risk and return that may help to explain the extent of home bias, if return-chasing is a driver of portfolio decisions. By this line of reasoning, investor in a country that historically offered a favorable domestic return-risk tradeoff may be less prone to invest overseas and may be a more popular destination for inward equity investment.
IV. DATA: DESCRIPTION AND ISSUES
The dataset combines data on aggregate and bilateral international portfolio equity investment positions. Since 1997, the International Monetary Fund has published data on international investment positions for a number of countries: the coverage has expanded over time. With regard to bilateral data, the International Monetary Fund has also released two editions of its Coordinated Portfolio Investment Survey (CPIS), for end-1997 (IMF, 2000) and end-2001.13 For each participating country, the CPIS reports data on foreign portfolio asset holdings (divided into equity, long-term debt, and short-term debt) by residence of the issuer. The earlier survey covered 29 source countries, but some major investing nations (such as Germany) did not participate. The more recent survey is much broader, with 67 source countries included, among those several offshore and financial centers. For each source, the survey reports holdings in up to 218 destination countries/territories.14 . The data are based on the residence principle adopted for balance of payments statistics (see IMF, 1993 for a description of the general principles). Problems with the CPIS data can arise for several reasons: • Incomplete country coverage. A number of countries did not participate to the CPIS.
Among the likely largest holders of portfolio equity assets among non-participants are the British Virgin Islands, China, Kuwait, Saudi Arabia, Taiwan Province of China, and the United Arab Emirates.
• Under-reporting of assets by CPIS participants. Under-reporting can be due to
incomplete institutional coverage of the survey. For example, the Cayman Islands reported only portfolio holdings by the banking sector (and hence excluding its sizable mutual fund industry); the Bahamas also reported exclusively banking sector holdings, and the German survey did not cover holdings by households.15 Under-reporting is also
13 The data are available at http://www.imf.org/external/np/sta/pi/datarsl.htm.
14 For those countries that participated in both 1997 and 2001 surveys, there is considerable persistence in bilateral equity holdings. A log-log regression of 2001 equity positions on 1997 observations gives an elasticity of 0.86 and an overall R-squared of 0.70.
15 For the Cayman Islands, its derived liabilities (themselves likely to be underestimated) exceed its reported assets by close to US$350 billion. For Germany, the portfolio assets reported in the CPIS survey (US$800 billion), are over US$200 billion lower than those reported in the International Investment Position (which are estimated making use of flow data, and therefore include household holdings as well).

- 13 -
likely to occur for countries that experienced periods of substantial capital flight in the past (such as several Latin American countries) and, more generally, for assets held in offshore centers for tax shelter reasons. 16
• Third-party holdings. Third party holdings refer to securities issued by country B and
held in an institution residing in country C by a resident of country A. Third-party holdings do not pose a measurement problem when using end-investor surveys, but can lead to mismeasurement if the surveys are based on custodians (typically domestic ones, therefore missing assets held by foreign custodians on behalf of domestic residents). The United States uses a mix of both methods of survey.17
• Problems in collection methods. For many countries this is the first participation to the
CPIS, and therefore collection methods may still be inadequate. While these shortfalls need to be taken into account when examining the data, the CPIS provides a unique perspective on cross-country equity positions that warrants a detailed analysis.
A. Stylized Facts of the 2001 CPIS: Aggregate Investment
The total recorded level of portfolio equity investment in the CPIS was US$5.16 trillion. Table 1 lists the 10 largest foreign investors, both in absolute terms and as ratios of domestic GDP. In absolute levels, the largest foreign investors are the main advanced economies; a notable exception is Luxembourg, a very small economy with a large financial center. According to the CPIS, “external” equity holdings of euro area countries amount to US$893 billion, while intra-euro area holdings are over US$800 billion. When comparing the CPIS equity holdings with those reported in these countries’ International Investment Position, the most notable discrepancy is for Germany that reports IIP equity assets totaling over US$500 billion, well above the level in the survey.18 When scaling equity holdings by GDP, financial and offshore centers dominate the picture, with total assets amounting to multiples of their domestic output. Total reported portfolio equity investment by offshore centers and small economies with financial centers (including in the latter category Ireland, Luxembourg, Hong Kong SAR, and Singapore, but excluding
16 With regard to countries that experienced capital flight in the past, some of the gaps may be filled with the help of the United States’ survey of its portfolio liabilities, since a substantial portion of their assets may well be in the US. 17 Griever, Lee, and Warnock (2001) discuss in detail the methodology of US surveys and Warnock and Cleaver (2002) highlight the measurement problems posed by third-party holdings.
18 This difference is reflected in the euro area’s total holdings—those estimated from the survey are US$100 billion less than those reported in the euro area’s IIP.

- 14 -
Switzerland) amounts to over US$700 billion, notwithstanding the incomplete coverage of the survey highlighted in the previous sub-section. Table 2 lists the ten largest geographical destinations for portfolio equity investment. Here liabilities are derived from the asset claims of the countries that participated in the CPIS survey, and therefore provide a somewhat incomplete picture of total portfolio equity liabilities. For sake of comparison, the first column reports in brackets the total amount of portfolio equity liabilities reported by countries in their International Investment Position. The overall pattern is similar to the one for assets—the largest OECD economies are the main destination countries for portfolio equity investment. In terms of ratios to GDP, small economies with financial centers dominate the picture. These centers are very important in absolute terms as well, as highlighted by the presence of Luxembourg and Bermuda among the main destination countries. The total amount of derived equity liabilities of offshore centers and small economies with financial centers is US$870 billion. It is not surprising that this number is larger than reported offshore center assets, even though holdings in offshore centers by foreign residents are clearly under-reported. First, not all offshore centers participated in the CPIS; and second, the derived equity liabilities of these centers often represent shares in mutual funds, that may invest these funds in portfolio debt instruments, and not exclusively in equities.
B. Stylized Facts of the 2001 CPIS: Bilateral Investment Patterns
In order to put the geographical distribution of portfolio equity asset holdings in perspective, Table 3 provides a brief summary of the size of economies, their stock markets, and the share of domestic stocks owned by non residents. A couple of interesting stylized facts emerge from this table. First, at end-2001 exchange rates and prices, the United Kingdom and the United States’ stock market capitalization largely exceeded their aggregate weight in world GDP. Second, the fraction of the domestic stock market held by non-resident portfolio investors was substantially higher in the euro area and the United Kingdom (over a third) than in the United States and Japan (13 and 17 percent, respectively). 19 Table 4 summarizes the geographical distribution of portfolio equity investment among the main advanced economies by comparing the share of foreign equity investment in the host country with the share of the host country’s stock market capitalization in the rest of the world’s stock market capitalization. We use the latter as a simple predictive benchmark for the allocation of foreign portfolio equity investment. Japan’s foreign equity investment is the most closely aligned with the benchmark, while the least closely aligned is the United Kingdom, which invests much more in the euro area than in the United States. The euro area has higher than predicted investment in the rest of the world and especially in the United Kingdom, and lower than predicted investment in Japan and the United States. Finally, the 19 Note that Table 3 only reports domestic shares owned by portfolio equity investors (who by definition hold participations below 10 percent). Adding the shares held by direct investors would increase the measured size of non-resident ownership of domestic shares.

- 15 -
United States is “overweight” in the United Kingdom and the rest of the world, and underweight in the euro area and especially in Japan. Figure 1 summarizes the degree of “foreign bias” for a restricted sample of OECD host and source countries, as well as for the whole sample. The foreign bias is a measure of the deviation of a source country’s equity holdings in a given host from an international benchmark, and is defined as FORBIAS=[1- (equity holdings ratio/market value ratio)]. The market value ratio is the ratio of host country’s stock market capitalization to world stock market capitalization net of the source country, while the equity holdings ratio is the ratio of equity holdings by the source country in the host country to total equity holdings of the source country. If source country holdings in the host country simply reflect the relative weight of the host country in the world’s stock market capitalization, the bias is equal to zero. If equity holdings are higher than the market ratio, the bias is positive, and viceversa. The figure shows the percentage of total observations for which the foreign bias falls within a given range, and shows that the degree of dispersion is substantial, especially for the whole sample. While for some advanced economies the equity holdings ratio lines up quite closely with the market value ratio, this dispersion warrants a closer look at other determinants of bilateral investment patterns.
V. EMPIRICAL ANALYSIS
We focus on explaining the portfolio equity positions for end-2001. In line with the discussion above, we report results for three different dependent variables: bilateral positions; aggregate asset positions; and aggregate liability positions. We consider a wide range of explanatory variables in our empirical analysis. The data appendix describes the data sources and construction methods for these variables.
A. The Determinants of Bilateral Equity Holdings
Regression Specification and Estimation Procedures In Tables 5-7, we present results of panel regressions of equity holdings for three samples: all countries, OECD source countries, and emerging market source countries. The same set of destination countries (as determined by data availability) is used in each case, subject to the restrictions discussed below.20
20 The OECD sample, excludes Korea, Mexico, and Central European countries. Results for restricted sets of destination countries (e.g. only OECD destinations; only emerging market destinations) are available from the authors upon request.

- 16 -
The dependent variable is specified as log(1+equity), so as to explicitly account for the large number of observations equal to zero.21 All regressions control for both fixed source and host country effects—hence the only explanatory variables included in the regression are those that have variation along both sample dimensions.22 Because of the log specification of the regressions, adopted in line with the literature on gravity models, the effect of variables such as the (log) product of host and source country area, population, GDP, etc. are automatically soaked up by the fixed host and source effects. All regressions exclude source and host offshore and small financial centers. 23 This choice is motivated by the fact that these centers act as pure intermediaries, and are neither true sources nor final destinations of investment. Ideally, we would wish to “re-allocate” the funds invested by source economies in offshore centers to their ultimate destination. However, this type of exercise is fraught with uncertainty, also given the limited available information on the pattern of investment of certain offshore centers. Nevertheless, to the extent that every dollar invested by a source country in an offshore center is invested by the offshore center in the same way as the average dollar invested abroad by the source country, the exclusion of offshore centers is of no consequence to the empirical analysis. This is the case since re-allocating holdings in offshore centers to their ultimate destinations would affect bilateral holdings only up to a common factor of proportionality. Given that the regressions are run in log form, this factor of proportionality would be soaked up by the fixed source-country effects. In any case, the exclusion of several offshore centers is unavoidable, given the lack of data on macroeconomic variables, bilateral trade, and stock market capitalization and returns. In each table, columns (1)-(3) report panel OLS regressions with fixed source and host effects; column (4) reports IV estimates; while columns (5)-(7) Tobit regressions. Although, for timing and scale reasons, we are generally skeptical that reverse causation from equity 21 Table A1 presents summary statistics on available observations for equity holdings, as well as number of observations equal to zero, for all samples and regression specifications. Since equity positions are measured in dollars, adding 1 dollar to the equity position is trivially not distortionary: it just allows us to include the zero observations in the regressions in the log specification.
22 The tables report both the overall adjusted R2 (which includes the explanatory power of the source and host country dummies) and the bilateral R2 (which measures the marginal explanatory power of the bilateral variables). While the host and source country dummies are very important, the bilateral variables also contribute considerable explanatory power. In the broadest specification (column (3) in Tables 5-7), the bilateral R2 is in the range (0.23-0.33).
23 Among the source countries and territories, these are Aruba, The Bahamas, Bahrain, Bermuda, The Cayman Islands, Cyprus, Guernsey, The Isle of Man, Jersey, Lebanon, Luxembourg, Macao SAR, Malta, Mauritius, the Netherlands Antilles, Panama, and Vanuatu. A complete data appendix with a list of countries and territories for each sample is available from the authors upon request.

- 17 -
holdings to the regressors is an important problem, the IV estimates are included to guard against possible reverse causation running from financial holdings to a number of regressors.24 The Tobit estimates are included in light of the fact that a large number of bilateral observations is equal to zero and allow for the possibility that the observed distribution of equity holdings is censored at zero.25 Such censoring is plausible, given the restrictions on shorting equity holdings in many countries. Columns (1) and (5) present results using only source-country imports from the host country, measured as log(1+imports), as an explanatory variable. This partial specification allows the use of the widest possible sample: 50 sources and 172 hosts. Columns (2) and (6) add to the explanatory variables a number of proxies for information barriers and ‘cultural’ distance that have been widely used in the literature attempting to explain trade and capital flows with gravity models.26 These include: the log of geographical distance; the time difference (to proxy for the difficulties of communication when the overlap between office hours is limited, as suggested by Portes and Rey (2003) and Stein and Daude (2003)); a dummy for countries that have been in a colonial relation; a dummy for countries in a strict currency union; a dummy for a common language; and a dummy for countries with a tax treaty established prior to 1999. In addition, columns (2) and (6) also include the correlation in GDP growth rates between the source and host country, as a widely-available proxy for the gains from bilateral diversification, along the lines of Davis et al (2001). As highlighted in Table A1, the addition of these variables reduces the full sample size by about 20 percent (15 host countries are dropped), with the large majority of the dropped observations reflect equity holdings equal to zero. Finally, regressions (3), (4) and (7) also add the correlation between stock market returns in the source and host country (measured in US dollars); the correlation between source-country GDP and host-country equity returns (following Davis et al (2001)); and a dummy for common legal origin. The first two variables are further proxies for the gains to bilateral diversification, while the latter variable is a general proxy for similarity in institutions.27
24 The bulk of equity holdings were accumulated only over the last decade and remain comparatively small, whereas import patterns (for instance) are quite persistent.
25 It is well known that Tobit panel estimation with fixed effects can give rise to biased and inconsistent estimates, due to the incidental parameters problem. However, Greene (2003) shows that Tobit estimates in practice are more reliable than least-squares estimates if censoring is a significant data problem. We do not attempt to estimate an IV-Tobit specification, in view of the stringent assumptions required to implement such a procedure (Honore and Hu 2003).
26 See, for example, Frankel and Rose (2002). See, among others, Portes and Rey (2003) and Rose and Spiegel (2002) on the application of gravity models to capital flows.
27 The common legal origin dummy is only available for approximately the same set of countries for which stock market return data are available.

- 18 -
Adding these variables reduces the number of observations substantially—data for the whole sample now cover 37 sources and 48 hosts, and two thirds of the observations are dropped with respect to the specification of columns (2)-(5). However, once again the majority of the dropped observations reflect equity holdings equal to zero, and the size of total equity assets included in the regressions drops by a trivial amount (less than 1 percent). For the full sample and the OECD sub-sample (Tables 5 and 6), in the IV estimation in column (4), we treat as potentially endogenous variables: the level of imports; the correlation of GDP growth rates; the correlation of stock returns; and the correlation between domestic GDP growth and the foreign stock return. Our instrument list consists of: distance; the time difference; a border dummy; the lagged correlation in GDP growth rates; the lagged correlation in stock returns; and the lagged correlation between domestic GDP growth and the foreign stock return.28 For the emerging market sub-sample (Table 7), including lagged stock returns would lead to a sharp drop in data availability (many emerging market stock markets become active only in the mid-1990s). For this reason, we only treat the level of imports and the correlation of GDP growth rates as potentially endogenous variables and drop the lagged correlation in stock returns and the lagged correlation between domestic GDP growth and the foreign stock return from the list of instruments in this case.29 Note that, in the IV specification, we drop distance and the time difference from the list of independent variables in the main regression and allow these variables to influence bilateral equity holdings through their effect on the endogenous regressors. The excludability of distance from the main regression is based on the OLS results for the comparable specification in column (3): although distance is significant at the 5 percent level in the full sample, it is not significant in the OECD or the emerging market sub-samples. While the time difference variable is significant at the 1 percent level for the emerging market sub-sample in column (3) of Table 7, it is not significant for the OECD sub-sample and significant only at the 10 percent level for the full sample. Empirical Results Across Tables 5-7, the most striking result is the strong link between bilateral imports and bilateral investment holdings (columns (1) and (5)) which, not surprisingly, shows up with a
28 We assume that the correlations between growth rates prior to 1990 as well as the correlation between stock returns prior to 1995 are exogenous with respect to 2001 equity holdings, which reflect to a substantial degree the large flows of the period 1995-2001. For this reason we use lagged correlations, which have an “exogenous” overlap with the instrumented variables, as instruments.
29 The results are little changed if use a smaller sample and run the same IV specification as for the full sample and the OECD sample.
- 19 -
much higher coefficient in the Tobit regressions.30 The strength of this bivariate relation is quite noteworthy and consistent with the model laid out in section II. That the point estimate is below the theoretical value of unity can be attributed to a number of factors. First, measurement error in imports imparts a downward bias to the coefficient estimate. Second, holding destination X’s equity is not the only route to gain exposure to import-related risk: a complementary route would be to invest in domestic firms with overseas operations in those markets (Cai and Warnock 2004). Third, the composition of destination X’s stock market index may not perfectly reflect import risk (e.g. it may include domestically-orientated firms). Fourth, in some cases, imports from country X may consist of generic commodities for which country X’s stock market would not be the appropriate hedging mechanism. It is possible that the level of imports may simply proxy for bilateral information flows, rather than reflecting the risk-sharing mechanism outlined in our baseline theoretical model. However, the imports variable remains robustly significant (although its point estimate is reduced), once the set of gravity-related regressors that may proxy for informational linkages are included in the specification. Moreover, if the informational role for trade is dominant, exports should play a similar role to imports in explaining bilateral equity holdings: however, holding fixed bilateral imports, bilateral exports has no additional explanatory power for the whole sample and emerging markets, and an economically weaker and statistically less significant impact than imports for the OECD sample.31 The importance of trade here stands in contrast to the evidence of Ahearne et al (2003) for the U.S. pattern of overseas investment: using 1997 data, they find no role for bilateral trade in explaining the bilateral equity holdings of U.S. investors.32 The only case in which the imports variable loses significance is for the emerging-market sub-sample in the regressions including the financial correlations in columns (3) and (7) in Table 7: these regressions have a much smaller set of observations. Moreover, even for this specification, imports remain highly significant in the IV estimation in column (4). The results also lend considerable support to the role of informational linkages in explaining bilateral asset holdings: a number of the cultural and physical proximity variables are statistically and economically significant. Taking first the ‘broad’ sample in columns (2) and (7), distance is robustly significant in all three samples: it is also interesting to note that its impact is more powerful for investors from emerging markets than for investors from OECD 30 Figure 2 shows the scatter plot of equity positions against imports. The simple pooled regression generates an elasticity of 0.39 (t-statistic of 22.2), with an R-squared of 0.18. The deviation from the unitary coefficient that is predicted by the model in section II may be in part attributable to measurement error.
31 The results including bilateral exports are available upon request.
32 Their specification includes a different array of control variables and, of course, cannot control for fixed host country effects. They also measure trade as a ratio to the host country’s GDP.

- 20 -
countries. The full sample OLS estimate in column (2) of Table 5 indicates that, all else equal, doubling the physical distance reduces equity holdings by 61 percent for the whole sample. Also, speaking a common language raises equity holdings by about 40 percent. 33 The colony dummy is also positive and significant for both the OECD and emerging market sub-samples, and particularly large for the latter group, where a common colonial history is associated with a quadrupling of equity investment. The currency union dummy is large and very significant for the full sample in the OLS panel regression, but not in the remaining sub-samples and in the Tobit regressions. This suggests that the variable is useful in distinguishing between zero and nonzero observations for equity holdings in the full sample, but has no independent explanatory power in explaining the size of desired equity holdings. In the broad sample, the tax treaty variable is significantly positive only in the Tobit estimates for the emerging market sample. The correlation between GDP growth rates is significantly positive for both the full sample and the OECD subsample, under both OLS and Tobit estimation procedures. To the extent that the output growth correlation is a proxy for the gains from diversification, its positive sign is unexpected: rather, it seems that investors hold equity in destinations with similar business cycles. When stock market-related variables and the common legal origin dummy are added to the regressions (columns (3), (4) and (7) in Tables 5-7), there is a notable change in some of the results, related primarily to the change in sample size.34 For this narrower sample, the most remarkable change is in the coefficient on distance, which is dramatically reduced in size and loses statistical significance in the OECD and emerging market sub-samples. Since the main difference between the samples in column (2) and (3) are observations with equity holdings close to or equal to zero, this suggests that—once we control for trade—distance helps predict whether a given source country is going to invest in a given host country, rather than the size of the investment. The results on the distance variable differ from those in Portes and Rey (2003): one interpretation is that the information frictions captured by distance may matter more for turnover than equity holdings.35 36
33 Yildirim (2003) reports similar findings for distance and language, in a specification without country and host fixed effects. She also considers a variety of corporate governance indicators, whose effects in our specification are soaked up by the source and host dummies.
34 Results for the regression specification in columns (2)-(5) for the same sample as (3)-(6) give results that are very similar to those reported in (3)-(6). These are available from the authors upon request.
35 The correlation between bilateral equity holdings and bilateral equity flows is significantly positive at 0.55 for the 14 country sample examined by Portes and Rey (2003). (We thank the authors and Capital Data for providing us with their data.) Following Portes and Rey (2003), we also examined bilateral telephone traffic as an information variable but found it to be insignificant once trade is included as a regressor. For the small number of countries with
(continued…)

- 21 -
A second difference is that currency union dummy is now quite significant for the OECD subsample: according to the OLS estimates, a source country tends to invest 60 percent more in a host which participates in the same currency union. Another is that the tax treaty dummy is now significantly negative for the OECD and full samples (but not in the Tobit case for the latter), while remaining significantly positive at the 10 percent level for the emerging market sub-sample in column (7) of Table 7. As emphasized by Blonigen and Davies (2002) in the context of foreign direct investment, the expected sign of the tax treaty variable is a priori ambiguous: while on the one side a tax treaty reduces the likelihood of double taxation, and hence encourages foreign equity investment, on the other it makes it more difficult to evade taxes on equity returns and hence may discourage investment. For the full sample, the evidence from this smaller set of observations also suggests that source countries tend to invest in hosts with similar characteristics, rather than in countries yielding more risk diversification—for the full sample, the coefficients on the correlation between growth rates, the correlation of stock returns, and the correlation between growth and stock returns are all positive and significant in the OLS, IV and Tobit regressions.37 However, these variables are not significant for either the OECD or emerging market sub-samples. Finally, there is evidence that institutional proximity is important for bilateral equity investment: for both OLS and Tobit specifications (albeit not for the IV regressions), countries tend to invest 30-40 percent more in hosts that have a similar legal background—a result which is common across the three samples. In sum, the geography of bilateral portfolio equity holdings is strongly related to bilateral trade, but also to proxies for informational asymmetries and cultural-institutional proximity, such as a common language and a common legal origin. The impact of distance variables is weakened once we the sample is restricted to the major equity sources and destinations. Among OECD countries, a common currency, which captures primarily the effects of the European Monetary Union, is associated with higher equity investment. More generally, the available data, we also tried the share of immigrants from the host country in the source country’s population but this variable was also insignificant.
36 Distance remains statistically significant in the Tobit regression for emerging markets (column (6)), albeit not in the OLS panel regression. This suggests that for emerging markets sources it has more power to discriminate between positive equity holdings than between zero and nonzero holdings, contrary to what happens for OECD sources.
37 Portes and Rey (2003) find that the covariance of stock returns has a positive impact on bilateral equity flows if distance is excluded from the regression, but turns negative once distance is included. However, in our case, the correlation remains positive even if distance is held fixed. (The results are similar whether we use covariances or correlations. A similar picture applies when we consider real local returns, rather than real dollar returns.)
- 22 -
evidence points to bilateral equity investment taking place between countries with similar characteristics, including coordinated business cycles and correlated stock market returns, against the predictions of standard diversification arguments.
B. Aggregate Asset Positions
We turn next to examining factors explaining the overall size of countries’ portfolio investment holdings. Results are presented in Table 9. From the initial sample of 67 sources we exclude the 17 offshore/small financial centers (see sub-section A). Among the variables explaining cross-country heterogeneity in total external asset holdings, we start in column (1) with a minimum set of variables that includes the size of the domestic economy, its GDP per capita, total exports of goods and services, the size of the domestic stock market, a measure of capital controls, and a dummy for financial centers.38 This set of variables restricts our sample size to 48, on account of lack of data on domestic stock market capitalization for Costa Rica and Uruguay. In columns (1)-(3), the dependent variable is the fixed source-country effect estimated from a multi-variate regression of bilateral equity shares bilateral explanatory variables (Table 5, column 2), in line with our theoretical approach (equation (15) in Section II.A). To check robustness, in columns (4)-(6) we present instead results using as dependent variable the overall stock of portfolio assets, taken to be the highest between the one reported in the 2001 CPIS survey and the one reported in the International Investment Position.39 Overall, results using the estimated fixed effect or the actual stock of equity holdings are similar: the dominant factors explaining equity asset positions are clearly GDP per capita and the size of the domestic stock market. For the former, the elasticity is just below one using the fixed effect specification, and higher in the regression using actual equity holdings, which does not incorporate the role of bilateral factors. For the latter, the elasticity is consistently estimated at around ½ . The importance of domestic stock market development in explaining foreign equity investment is in line with the findings of Di Giovanni (2004), who highlights that countries with more developed domestic financial market are more likely to engage in mergers and acquisitions operations abroad. While our measure of capital controls has a strong negative correlation with external portfolio equity holdings, it loses significance in the multivariate regression, particularly on
38 Financial centers in the sample are Hong Kong SAR, Ireland, Singapore, Switzerland, and the United Kingdom. In addition to acting as financial centers, these countries have domestic stock markets which are ‘final’ destinations for foreign portfolio investment.
39 Countries where the largest differences between the CPIS and the IIP arise are Germany, where the IIP reports higher portfolio equity assets (see discussion in the previous section), and Romania, which reports trivial holdings in the CPIS but over $1 billion in the IIP.

- 23 -
account of its strong collinearity with GDP per capita.40 Also, the financial center dummy, while consistently positive, is always statistically insignificant, suggesting that the features of financial centers relevant for overall asset holdings are already captured by other explanatory variables. Columns (2) and (5) add the domestic stock market’s Sharpe ratio, calculated over the period 1980–1996, among the explanatory variables. Its coefficient is statistically insignificant. Columns (3) and (6) add instead the country’s “beta” vis-à-vis the MSCI world return index, together with the standard deviation of the residual from the beta regression as a measure of stock return volatility. 41 While the beta measure is not statistically significant, there is evidence that higher volatility of domestic stock returns reduces outward equity investment. In sum, our results suggest that the overall level of development and the depth of the domestic financial market, as reflected by stock market capitalization and low volatility, are reflected in increased external diversification—richer countries and those with a stronger “equity culture” hold larger gross foreign equity positions.
C. Aggregate Liability Positions
The final empirical results we present refer to aggregate portfolio equity liabilities. In order to explain what makes countries attractive as a destination for non-resident portfolio equity investors, we use a similar set of explanatory variables as those used for explaining asset holdings. One addition is a dummy for Middle Eastern countries, which is added because the largest holders of equity assets in the region (Kuwait, Saudi Arabia, United Arab Emirates) did not participate in the CPIS. If we assume that proximity matters for portfolio equity investment (either through trade connections or for informational reasons), the derived liabilities for countries in the Middle-Eastern region are likely to substantially underestimate their total external equity liabilities. The overall sample size is constrained by the availability of domestic stock market capitalization data, which reduces the sample from 218 countries/territories for which we have data on derived equity liabilities to 65.42 As the dependent variable, in regressions
40 The measure of controls used here is an average over the period 1996–2001 of an index of restrictions on capital market securities constructed by Johnston and Tamirisa (1998) and Johnston and others (1999).
41 Missing observations for the Sharpe ratio and beta include Bulgaria, Estonia, Iceland, Israel, Kazakhstan, Romania, Slovak Republic, and Ukraine, in addition to those already listed previously.
42 In addition to countries in the sample used for equity assets, we have data on derived liabilities, stock market capitalization, and capital controls for 17 countries/territories that did not participate in the 2001 CPIS. These are Bangladesh*, Bolivia*, China, Croatia*, India, Iran*, Jordan, Latvia*, Lithuania*, Mexico, Morocco, Pakistan*, Peru, Saudi Arabia*, Slovenia*, Sri Lanka, and Trinidad and Tobago*. For countries denoted with an asterisk we
(continued…)

- 24 -
(1)-(3) we use the fixed hostcountry effect estimated from the regression of log bilateral equity shares on log source imports, in line with our theoretical approach (see equation (20) in Section II.A). To check robustness, in columns (4)-(6), we present instead results using as the dependent variable the overall stock of portfolio liabilities, taken to be the highest between the one reported in the 2001 CPIS survey and the one reported in the International Investment Position. 43 Unlike asset holdings, liabilities are not measured directly by the CPIS, but can be derived by summing the asset holdings that participating countries report in each destination country. The results, which are presented in Table 10, are mostly similar between the specification using the fixed effect as explanatory variable and the one using measured equity liabilities. In particular, the size of the host country’s domestic stock market is the key correlate of portfolio equity liabilities. However, the elasticity is well below unity, especially in the fixed effect regressions—according to the point estimate, a 10 percent increase in the size of the domestic stock market is accompanied by a 5 to 7 percent increase in foreign equity liabilities. Also, the financial center and Middle Eastern dummies are highly significant, with the expected sign. For example, other things being equal the stock of portfolio equity liabilities of financial centers is twice as large as in other countries. The level of GDP per capita is significant in regressions (4)-(6), but not in the fixed effect regressions, suggesting that its impact is captured by the variables explaining bilateral holdings. The index of controls on capital inflows is strongly negatively correlated with total equity liabilities, but is statistically insignificant in all multi-variate regressions. The failure to obtain stronger results is probably related on the one side to the difficulty in accurately measuring restrictions on foreign equity investment, and on the other to the collinearity of this variable with stock market development and GDP per capita. The Sharpe ratio (columns (2) and (5)) and the “beta” and volatility measure of the domestic stock market are all statistically insignificant.44 For columns (4)-(6), the last row of the Table reports the fit of the regression when the dependent variable is the log share of the domestic stock market owned by foreigners.45 As for asset regressions, we also experimented with a host of other potential explanatory variables, including inflation and real exchange rate volatility, alternative measures of capital controls (from Quinn, 1997), transaction costs on domestic stock markets (from Elkins-
have no data for the Sharpe ratio or beta—these are therefore excluded from the regressions in columns (2), (3), (5), and (6) of Table 10.
43 Results are broadly similar when we restrict the sample to countries that report their IIP or when we use the CPIS derived liabilities as dependent variable.
44 These variables remain statistically insignificant even when calculated over a more recent period (1995–2001).
45 In these regressions, the estimated coefficients for stock market capitalization are one minus the point estimates from the baseline specifications, and they are all significant at the 5 percent level.

- 25 -
McSherry), legal origin (from La Porta and others, 2003), and indicators of securities’ laws (also from La Porta and others, 2003). While these variables are all correlated with the stock of equity liabilities, they do not come in significant in multi-variate regressions. 46
VI. CONCLUDING REMARKS
This paper makes use of a new dataset on bilateral portfolio equity investment, which covers a very significant number of the largest portfolio equity investor countries, including offshore centers. A stylized theoretical model, based on trade costs, provides a simple framework for analyzing cross-country portfolio investment patterns. The theoretical framework informs the empirical analysis, which highlights key correlates of bilateral equity investment patterns, as well as of aggregate portfolio equity assets and liabilities. The most striking result is that bilateral equity investment is strongly correlated with the underlying patterns of trade in goods. Informational linkages are also important, however, such as a common language and common legal origins. The overall size of portfolio equity investment abroad is increasing in the level of development and the depth of the domestic financial market—richer countries and those with a stronger “equity culture” hold larger gross foreign equity positions. The size of the host country’s domestic stock market is the key correlate of aggregate foreign portfolio equity liabilities. There are several directions for future research. One important issue is the role of offshore centers. Table A2 offers some initial “geographical” perspective on the size of investment in offshore and financial centers: it lists, for the main international investors, the amount of equity assets held in offshore and financial centers, and the amount of derived liabilities to these centers. For example, assets held in offshore and financial centers are over 40 percent of total portfolio equity assets for Belgium and Italy, and over 25 percent in Germany (almost entirely reflecting holdings in Luxembourg). Derived liabilities to offshore and financial centers are also significant, albeit less dramatically so in proportion to total derived liabilities. Devising methods to allocate, albeit roughly, equity investment in offshore centers to their ultimate destination is an important, if difficult, research objective. Another avenue for research consists in developing the economic implications of the asymmetries in the geographical portfolio allocations that have been highlighted in this paper. For instance, these data may be employed to calculate the differential wealth impact across source countries of a financial shock such as a decline in the U.S. stock market: those countries with greater exposures to the United States clearly suffer a greater loss. In addition, asymmetries in investment positions also have implications for the behavior of bilateral exchange rates: the bilateral exchange rate response to a given shock should be affected by the degree of bilateral financial integration. More broadly, these data are an alternative 46 Other potential determinants of aggregate equity positions considered in the literature are corporate governance variables (Yildirim, 2003), the impact of listing on international exchanges (Ahearne and others, 2003), the share of market capitalization held by insiders (Edison and Warnock, 2003b), and psycho-cultural factors such the degree of patriotism (Morse and Shive, 2003).

- 26 -
source in examining whether bilateral financial integration affects other bilateral economic relations.47 Of course, establishing lines of causality between financial and other linkages is a challenging task. Further, it would be interesting to conduct a comparative analysis across different asset classes, including portfolio debt allocations, bank loans and deposits, and FDI positions. This would allow a more comprehensive account of the various components of the geography of international investment positions to be provided and further insight to be gained into the “external capital structure” of nations. At a more speculative level, it is also worth exploring whether the bilateral pattern of investment also influences aggregate economic variables: for instance, does “financial remoteness” or the composition of the investor base affect the level of aggregate investment, the cost of capital, and the stability of capital flows?
47 Imbs (2004a, 2004b) makes some progress on these questions.

- 27 - APPENDIX I
Countries/Territories Participating in the 2001 Coordinated Portfolio Investment Survey
Argentina, Aruba, Australia, Austria, the Bahamas, Bahrain, Belgium, Bermuda, Brazil, Bulgaria, Canada, Cayman Islands, Chile, Colombia, Costa Rica, Cyprus, Czech Republic, Denmark, Egypt, Estonia, Finland, France, Germany, Greece, Guernsey, Hong Kong SAR, Hungary, Iceland, Indonesia, Ireland, Isle of Man, Israel, Italy, Japan, Jersey, Kazakhstan, Republic of Korea, Lebanon, Luxembourg, Macao SAR, Malaysia, Malta, Mauritius, Netherlands, Netherlands Antilles, New Zealand, Norway, Panama, Philippines, Poland, Portugal, Romania, Russian Federation, Singapore, Slovak Republic, South Africa, Spain, Sweden, Switzerland, Thailand, Turkey, Ukraine, United Kingdom, United States, Uruguay, Vanuatu, Venezuela.
Variables: Sources and Definitions
Bilateral portfolio equity holdings: portfolio equity instruments issued by host country residents and held by source country residents. Source: 2001 Coordinated Portfolio Survey. Total portfolio equity holdings, CPIS: total portfolio equity holdings held by source country residents as reported in the 2001 Coordinated Portfolio Survey. Total portfolio equity assets and liabilities, IIP: total portfolio equity assets and liabilities reported in countries’ International Investment Position. Source: International Monetary Fund, International Financial Statistics and national sources. Source-country imports: imports of goods by source countries from host countries (average 1997–2001). Source, International Monetary Fund, Direction of Trade Statistics. Log distance: logarithm of Great Circle distance in miles between the capital cities of source and host country. Source: Rose and Spiegel (2002). Time difference: absolute value of time difference between source and host country (ranging from 1 to 12). Source: Rose and Spiegel (2002). Common language: dummy taking the value of 1 if source and host country share a common language. Source: Rose and Spiegel (2002). Colony dummy: dummy taking the value of 1 if source and host country ever had a colonial relationship. Source: Rose and Spiegel (2002). Strict currency union: dummy taking the value of 1 if source and host country are in a currency union. Source: Rose and Spiegel (2002). Tax treaty: dummy variable taking the value of 1 if the source and host country have a tax treaty enacted prior to 1999. Source: authors’ elaborations based on treaty data taken from www.unctad.org.

- 28 - APPENDIX I
Common legal origin: dummy variable taking the value of 1 if source and host countries have a legal system with a common origin (common law, French, German, or Scandinavian). Source: authors’ elaborations based on La Porta, López de Silanes, and Shleifer (2003). Correlation of stock returns: correlation between the stock market returns of the host and source country, expressed in US dollars. Source; authors’ calculations based on returns data from Datastream and Morgan Stanley Capital International. Correlation in growth rates: correlation between the GDP growth rate in the source and host country. Source: authors’ calculations based on World Bank, World Development Indicators. Correlation growth-stock return: correlation between GDP growth in the source country and real stock returns in the host country, 1980–99. Source: authors’ calculations based on Datastream, Morgan Stanley Capital International, and World Development Indicators. Real exchange rate volatility: volatility of the bilateral real exchange rate index between the source and the host country for the period . Source: authors’ calculations based on International Monetary Fund, Information Notice System. Log GDP: log of 2001 GDP level in current US dollars. Source: World Bank, World Development Indicators. Log GDP per capita: log of 2001 GDP per capita level in current US dollars. Source: World Bank, World Development Indicators. Log domestic stock market capitalization: log of the domestic stock market capitalization in US dollars as of end-2001. Sources: Datastream, Morgan Stanley Capital International, national sources. Capital controls (equity assets): index of restrictions on transactions in capital market securities, 1996–2001. Source: Johnston and Tamirisa (1998) and Johnston and others (1999). Capital controls (equity liabilities): index of restrictions on capital inflows, 1996–2001. Source: Johnston and Tamirisa (1998) and Johnston and others (1999). Financial center dummy: dummy variable taking the value of 1 if the country or territory is a “large” international financial center. Sharpe ratio: average excess return of the country stock market relative to world returns, divided by the standard deviation of the excess return’s variability. Source: authors’ calculations based on Datastream and Morgan Stanley Capital International.

- 29 - APPENDIX I
Beta: coefficient on regression of real US$ stock returns on world stock returns for the period 1980–1996. Source: authors’ calculations based on Datastream and Morgan Stanley Capital International. SD of beta residual: standard deviation of the residual from the beta regression of stock returns. Source: authors’ calculations based on Datastream and Morgan Stanley Capital International.

- 30 -
Table 1. Largest Holders of Portfolio Equity Assets*
Largest asset holdings (US$ billion)
Largest asset holdings (ratio of GDP)
United States 1,613 Luxembourg 16.6 United Kingdom 558 Jersey 14.8 Germany 381 Guernsey 13.5 Luxembourg 319 Isle of Man 9.6 Switzerland 247 Bermuda 8.6 Italy 239 Netherlands Antilles 2.2 Netherlands 235 Ireland 1.3 Japan 227 Bahamas 1.1 France 202 Switzerland 1.0 Canada 199 Netherlands 0.61 * The euro area’s portfolio equity assets (calculated from the CPIS survey) amount to US$893 billion.
Table 2. Largest Holders of Portfolio Equity Liabilities*
Largest derived liabilities US$ billion
(reported IIP equity liabilities in brackets)
Largest derived liabilities (ratio of GDP)
United States 1000 (1533) Cayman Islands 78.5 United Kingdom 711 (768) Bermuda 43.7 France 387 (416) Virgin Islands, British 28.7 Luxembourg 376 (N.A.) Luxembourg 19.5 Japan 330 (376) Netherlands Antilles 8.3 Netherlands 287 (284) Guernsey 4.3 Germany 273 (296) Jersey 2.2 Switzerland 201 (322) Dominica 1.7 Bermuda 157 (N.A.) Bahamas 1.1 Italy 119 (35) Gibraltar 1.0 * The numbers in brackets in the first column are the total portfolio equity liabilities as reported by countries in their International Investment Position (IIP). The 2001 equity liabilities of the euro area reported in their IIP amounted to US$1411 billion.

- 31 -
Table 3. Summary Statistics on Stock Market Size and Foreign Ownership (2001)
Variable
Country
Domestic stock market cap. in
percent of world stock market cap.
Percent of domestic stock market cap. owned by foreign portfolio investors
Domestic GDP in percent of world
GDP
Euro area 15.9 36.5 19.6 Japan 9.3 16.7 13.4 United Kingdom 8.9 35.6 4.6 United States 48.9 12.9 32.3 Other 17.0 N.A. 30.1 Note: world stock market capitalization is calculated as the sum of stock market capitalization of 71 countries in the sample. In this calculation, holdings of shares by residents of one euro area country in another are considered domestic holdings.
Table 4. Foreign Portfolio Equity Investment: Actual and Predicted Shares *
Euro area Japan United Kingdom
United States
Source country Host country
Theor. share 17.5% 17.5% 31.1%Euro area Actual share 16.8% 43.7% 28.6%
Theor. share 11.0% 10.2% 18.1%Japan Actual share 7.3% 9.9% 10.6%
Theor. share 10.6% 9.8% 17.4%United Kingdom Actual share 22.2% 13.0% 21.7%
Theor. share 58.1% 53.8% 53.6% United States Actual share 45.2% 54.3% 24.3%
Theor. share 20.3% 18.8% 18.7% 33.4%Rest of the world Actual share 25.4% 15.9% 22.0% 39.1%
Note: the predicted share is the ratio of host country's stock market capitalization to the stock market capitalization of the world minus the source country. The actual share: ratio of source country's equity investment in host country to total source country foreign equity investment.

- 32 -
Table 5. Bilateral Portfolio Equity Holdings, All Countries: Panel Regressions with Fixed Source and Host Effects
(1) (2) (3) (4) (5) (6) (7) Panel FE Panel FE Panel FE IV Tobit Tobit Tobit Avg. imports, 1997–2001 0.32 0.22 0.21 0.52 0.73 0.36 0.28 (17.93)** (8.42)** (3.58)** (5.13)** (21.82)** (8.24)** (4.81)**
Log distance -0.61 -0.22 -0.75 -0.14 (9.17)** (2.13)* (8.04)** (1.43)
Time difference 0.06 -0.04 0.04 -0.07 (4.52)** (1.88)† (1.83)† (3.42)** Common language 0.33 0.33 0.20 0.64 0.44 (3.63)** (2.54)* (1.43) (4.82)** (3.44)**
Colony dummy 0.19 0.30 0.21 0.50 0.26 (1.21) (1.39) (0.92) (2.43)* (1.24)
Currency union dummy 1.33 0.33 0.61 0.12 0.19 (7.64)** (1.82)† (2.73)** (0.56) (1.06)
Tax treaty -0.10 -0.24 -0.25 0.19 -0.03 (1.36) (2.05)* (1.86)† (1.72)† (0.24)
Correl. in growth rates 0.17 0.61 0.59 0.65 0.63 (1.80)† (3.66)** (2.00)* (4.26)** (3.76)**
Correl. in stock returns 2.08 2.23 1.50 (4.52)** (2.46)* (3.16)**
Correl. growth-stock ret. 0.49 1.07 0.28 (3.00)** (1.80)† (1.65)†
Common legal origin 0.28 0.09 0.32 (2.93)** (0.80) (3.43)**
Observations 4340 3306 1129 927 4340 3306 1129 No. of host countries 50 50 37 33 50 50 37 No. of source countries 172 157 42 36 172 157 42 Adjusted R2 0.60 0.70 0.76 Bilateral R2 0.07 0.16 0.33 Pseudo R2 0.89 0.46 0.45 0.45
Note: the dependent variable is log of 1+portfolio equity holdings of the source country in the host country. Regressions include fixed source and host country effects. t-statistics reported in parenthesis. †, *, ** indicate statistical significance at the 10 percent, 5 percent, and 1 percent confidence level, respectively. Bilateral R2 is the marginal explanatory power of the bilateral regressors, over and above the explanatory power of the host and source country fixed effects and is measured as one minus the squared residual standard error divided by the squared residual standard error of a regression on the fixed effects alone.
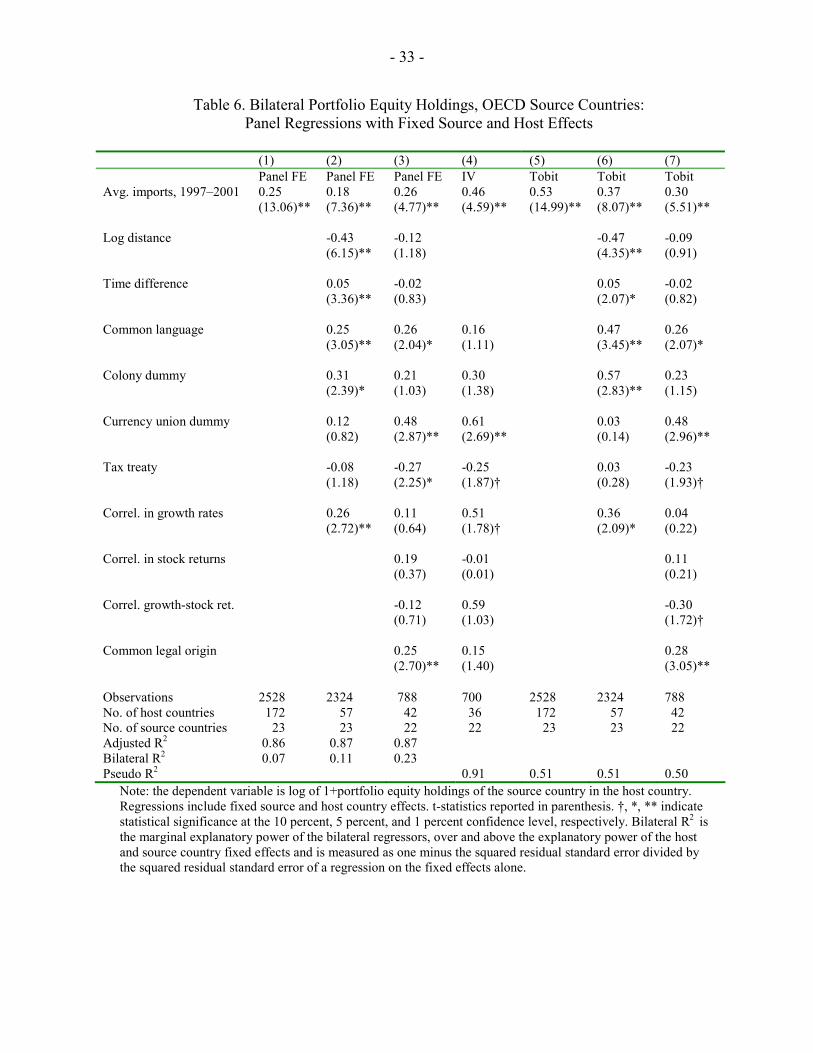
- 33 -
Table 6. Bilateral Portfolio Equity Holdings, OECD Source Countries: Panel Regressions with Fixed Source and Host Effects
(1) (2) (3) (4) (5) (6) (7) Panel FE Panel FE Panel FE IV Tobit Tobit Tobit Avg. imports, 1997–2001 0.25 0.18 0.26 0.46 0.53 0.37 0.30 (13.06)** (7.36)** (4.77)** (4.59)** (14.99)** (8.07)** (5.51)**
Log distance -0.43 -0.12 -0.47 -0.09 (6.15)** (1.18) (4.35)** (0.91)
Time difference 0.05 -0.02 0.05 -0.02 (3.36)** (0.83) (2.07)* (0.82)
Common language 0.25 0.26 0.16 0.47 0.26 (3.05)** (2.04)* (1.11) (3.45)** (2.07)*
Colony dummy 0.31 0.21 0.30 0.57 0.23 (2.39)* (1.03) (1.38) (2.83)** (1.15)
Currency union dummy 0.12 0.48 0.61 0.03 0.48 (0.82) (2.87)** (2.69)** (0.14) (2.96)**
Tax treaty -0.08 -0.27 -0.25 0.03 -0.23 (1.18) (2.25)* (1.87)† (0.28) (1.93)†
Correl. in growth rates 0.26 0.11 0.51 0.36 0.04 (2.72)** (0.64) (1.78)† (2.09)* (0.22)
Correl. in stock returns 0.19 -0.01 0.11 (0.37) (0.01) (0.21)
Correl. growth-stock ret. -0.12 0.59 -0.30 (0.71) (1.03) (1.72)†
Common legal origin 0.25 0.15 0.28 (2.70)** (1.40) (3.05)**
Observations 2528 2324 788 700 2528 2324 788 No. of host countries 172 57 42 36 172 57 42 No. of source countries 23 23 22 22 23 23 22 Adjusted R2 0.86 0.87 0.87 Bilateral R2 0.07 0.11 0.23 Pseudo R2 0.91 0.51 0.51 0.50
Note: the dependent variable is log of 1+portfolio equity holdings of the source country in the host country. Regressions include fixed source and host country effects. t-statistics reported in parenthesis. †, *, ** indicate statistical significance at the 10 percent, 5 percent, and 1 percent confidence level, respectively. Bilateral R2 is the marginal explanatory power of the bilateral regressors, over and above the explanatory power of the host and source country fixed effects and is measured as one minus the squared residual standard error divided by the squared residual standard error of a regression on the fixed effects alone.

- 34 -
Table 7. Bilateral Portfolio Equity Holdings, Emerging Market Source Countries: Panel Regressions with Fixed Source and Host Effects
(1) (2) (3) (4) (5) (6) (7) Panel FE Panel FE Panel FE IV Tobit Tobit Tobit Avg. imports, 1997–2001 0.19 0.18 0.23 0.81 0.71 0.23 0.24 (12.12)** (4.73)** (1.68) (5.19)** (14.81)** (3.18)** (1.55)
Log distance -0.08 -0.04 -0.59 -0.69 (0.99) (0.15) (4.18)** (2.30)*
Time difference -0.10 -0.11 -0.07 -0.08 (5.02)** (2.62)** (2.44)* (1.86)†
Common lang. 0.24 0.06 -0.18 0.55 0.51 (1.77) (0.23) (0.66) (2.71)** (1.87)†
Colony dummy 1.42 1.55 1.21 1.38 0.98 (4.88)** (2.98)** (2.26)* (3.67)** (1.90)†
Tax treaty -0.02 0.10 0.08 0.42 0.44 (0.22) (0.41) (0.34) (2.46)* (1.71)†
Correl. in growth rates -0.07 0.40 0.70 0.12 0.20 (0.52) (1.01) (1.09) (0.53) (0.47)
Correl. in stock returns 0.42 -0.06 0.62 (0.40) (0.06) (0.53)
Correl. growth-stock ret. 0.07 0.17 -0.05 (0.19) (0.44) (0.11)
Common legal origin 0.35 0.26 0.50 (1.94)†
(1.40) (2.56)*
Observations 1812 982 341 341 1812 982 341 No. of host countries 172 157 42 42 172 157 42 No. of source countries 27 27 15 15 27 27 15 Adjusted R2 0.35 0.41 0.51 Bilateral R2 0.08 0.24 0.28 Pseudo R2 0.77 0.49 0.45 0.40 Note: the dependent variable is log of 1+portfolio equity holdings of the source country in the host country. Regressions include fixed source and host country effects. t-statistics reported in parenthesis. †, *, ** indicate statistical significance at the 10 percent, 5 percent, and 1 percent confidence level, respectively. Bilateral R2 is the marginal explanatory power of the bilateral regressors, over and above the explanatory power of the host and source country fixed effects and is measured as one minus the squared residual standard error divided by the squared residual standard error of a regression on the fixed effects alone.

- 35 -
Table 8. Determinants of Aggregate Portfolio Equity Assets (2001 end-of-period stock)
(1) (2) (3) (4) (5) (6) CPIS
(fixed effect)CPIS
(fixed effect)CPIS
(fixed effect)Max
(CPIS, IIP) Max
(CPIS, IIP) Max
(CPIS, IIP)
Log GDP -0.24 -0.29 -0.16 0.32 -0.01 0.20 (1.14) (1.48) (0.77) (0.96) (0.02) (0.61) Log GDP per capita 0.58 0.90 0.87 1.35 1.41 1.44 (2.90)** (4.74)** (4.25)** (4.35)** (4.51)** (4.45)** Log domestic 0.56 0.47 0.35 0.58 0.65 0.45 stock mkt cap (3.20)** (2.98)** (2.09)* (2.11)* (2.51)* (1.73)† Log exports 0.03 0.10 0.10 -0.00 0.01 0.07 (0.27) (1.16) (1.18) (0.01) (0.08) (0.52) Capital controls -0.41 0.25 0.54 -0.83 -1.48 -0.25 (0.63) (0.43) (0.77) (0.83) (1.52) (0.23) Financial center 0.43 0.33 0.44 0.51 0.04 0.45
(0.85) (0.76) (1.04) (0.65) (0.06) (0.68) Sharpe ratio -0.67 1.40 (0.41) (0.52) Beta (1980–1996) -0.02 -0.58 (0.06) (1.13) SD of “beta residual” -6.48 -11.49 (1980–96) (1.94) † (2.18)* Constant -12.19 -10.48 -5.40 -13.17 -9.52 -2.12 (4.20)** (3.47)** (1.72) (4.35)** (3.23)** (0.68) Observations 48 40 40 48 40 40 Adjusted R2 0.76 0.81 0.82 0.83 0.83 0.86
Note: The dependent variable in columns (1)-(3) is the fixed source country effect obtained from a panel regression of log bilateral equity holdings on log source country imports and other macroeconomic and structural variables (see Table 5, column (2)). The dependent variable in columns (4)-(6) is the log of the maximum stock of portfolio equity assets between the one reported in the CPIS and the one reported in the country’s International Investment Position. t-statistics in parenthesis. †, *, ** indicate statistical significance at the 10 percent, 5 percent, and 1 percent confidence level, respectively. CPIS indicates the stock derived from the 2001 Portfolio Survey; IIP indicates the stock reported in the International Investment Position.

- 36 -
Table 9. Determinants of Aggregate Portfolio Equity Liabilities (2001 end-of-period stock)
(1) (2) (3) (4) (5) (6) CPIS
(fixed effect) CPIS
(fixed effect) CPIS
(fixed effect) Max
(CPIS, IIP) Max
(CPIS, IIP) Max
(CPIS, IIP)
Log GDP 0.12 0.16 0.12 -0.00 0.11 0.19 (0.85) (1.22) (0.76) (0.02) (0.60) (0.90)
Log GDP per capita 0.08 0.11 0.10 0.27 0.33 0.31 (0.84) (1.10) (0.96) (1.90)† (2.36)* (2.12)*
Log domestic stock mkt cap 0.46 0.48 0.53 0.71 0.66 0.63 (5.18)** (5.14)** (4.93)** (5.20)** (5.12)** (4.23)**
Log imports 0.12 0.02 0.00 0.45 0.21 0.14 (0.72) (0.11) (0.00) (1.86) † (1.02) (0.68)
Capital controls -0.22 0.17 0.09 -0.43 -0.00 0.01 (0.49) (0.35) (0.18) (0.63) (0.01) (0.01)
Financial center dummy 0.63 0.67 0.65 0.59 0.75 0.82 (2.20)* (2.73)** (2.57)* (1.34) (2.23)* (2.35)*
Middle East dummy -1.23 -1.04 -0.97 -1.73 -1.99 -1.93 (4.95)** (2.88)** (2.60)* (4.53)** (4.00)** (3.81)**
Sharpe ratio (1980–1996) 0.77 0.56 (1.13) (0.60)
Beta (1980–1996) 0.05 0.21 (0.32) (1.02)
SD of “beta residual” 1.92 -1.02 (1980–96) (0.94) (0.37)
Constant -1.75 -1.74 -1.69 -5.54 -4.27 -3.96 (1.80) † (1.51) (1.44) (3.71)** (2.69)* (2.46)*
Observations 65 47 47 65 47 47 Adjusted R2 0.90 0.90 0.90 0.91 0.93 0.93 R2 when dep. var. is log (equity/mkt cap)
0.44 0.54 0.53
* Dependent variable in columns (1)-(3) is the fixed host country effect obtained from a panel regression of log bilateral equity holdings on a set of macroeconomic and structural variables (see Table 5, column (2)). Dependent variable in columns (4)-(6) is the log of the maximum stock of portfolio equity liabilities between the one reported in the CPIS and the one reported in the country’s International Investment Position. t-statistics in parenthesis. CPIS indicates the stock derived from the 2001 Portfolio Survey; IIP indicates the stock reported in the International Investment Position. †, *, ** indicate statistical significance at the 10 percent, 5 percent, and 1 percent confidence level, respectively.

- 37 -
Table A1. Sample Size, Number of Observations=0, and Total Equity Holdings
All countries Sample # source # host # observations total source equity holdings
total =0 US $
billion% of no offshore with
tradeFull 67 223 7069 4293 5163 No offshore, with trade 50 172 4340 2715 3956 100.0% add macro variables 50 157 3126 1579 3952 99.9% add stock mkt variables 42 48 1459 239 3947 99.8% add CLO 37 42 1129 132 3917 99.0%
OECD Sample # source # host # observations total source equity holdings
total =0 US $ billion
% of no offshore with trade
Full 24 223 3779 1885 4921 No offshore, with trade 23 172 2528 1398 3840 100.0% add macro variables 23 157 2171 1086 3836 99.9% add stock mkt variables 23 48 897 46 3832 99.8% add CLO 23 42 788 38 3809 99.2%
European Union sample Sample # source # host # observations total source equity holdings
total =0 US $
billion% of no offshore with
tradeFull 15 223 2171 1127 2449 No offshore, with trade 23 172 1528 806 1773 100.0% add macro variables 23 157 1316 628 1771 99.9% add stock mkt variables 23 48 582 29 1769 99.8% add CLO 23 42 510 24 1759 99.2%
Emerging Market sample Sample # source # host # observations total source equity holdings
total =0 US $
billion% of no offshore with
tradeFull 43 223 3224 2408 224.1 No offshore, with trade 27 172 1812 1317 116.2 100.0% add macro variables 27 157 955 493 115.6 99.5% add stock mkt variables 19 48 562 193 114.6 98.6% add CLO 14 42 341 94 107.6 92.6% Total equity holdings: sum of portfolio equity holdings of source countries included in the sample. % of no offshore with trade: total equity holdings divided by equity holdings for the sample excluding offshore centers, with trade.

- 38 -
Table A2. Portfolio Equity Investment: The Role of Financial and Offshore Centers Largest Portfolio Equity Asset Holdings in
Offshore and Financial Centers
Largest Derived Equity Liabilities to Offshore and Financial Centers
US$ billion
Share of total portf. equity
assets US$
billion
Share of derived portfolio equity
liabs. United States 197.0 12.3% United States 167.3 16.8%Germany 104.4 27.4% United Kingdom 77.0 10.9%Italy 103.7 43.3% Germany 41.4 15.3%Switzerland 73.0 29.5% France 38.2 9.8%Belgium 49.8 46.9% Japan 29.0 8.7%Hong Kong 42.9 45.3% Netherlands 22.4 7.8%France 26.6 14.4% Switzerland 18.9 9.4%United Kingdom 19.3 3.5% Italy 17.7 14.8%Japan 18.3 8.1% Cayman Islands 15.2 16.6%Luxembourg 13.2 4.1% Luxembourg 12.5 3.4%
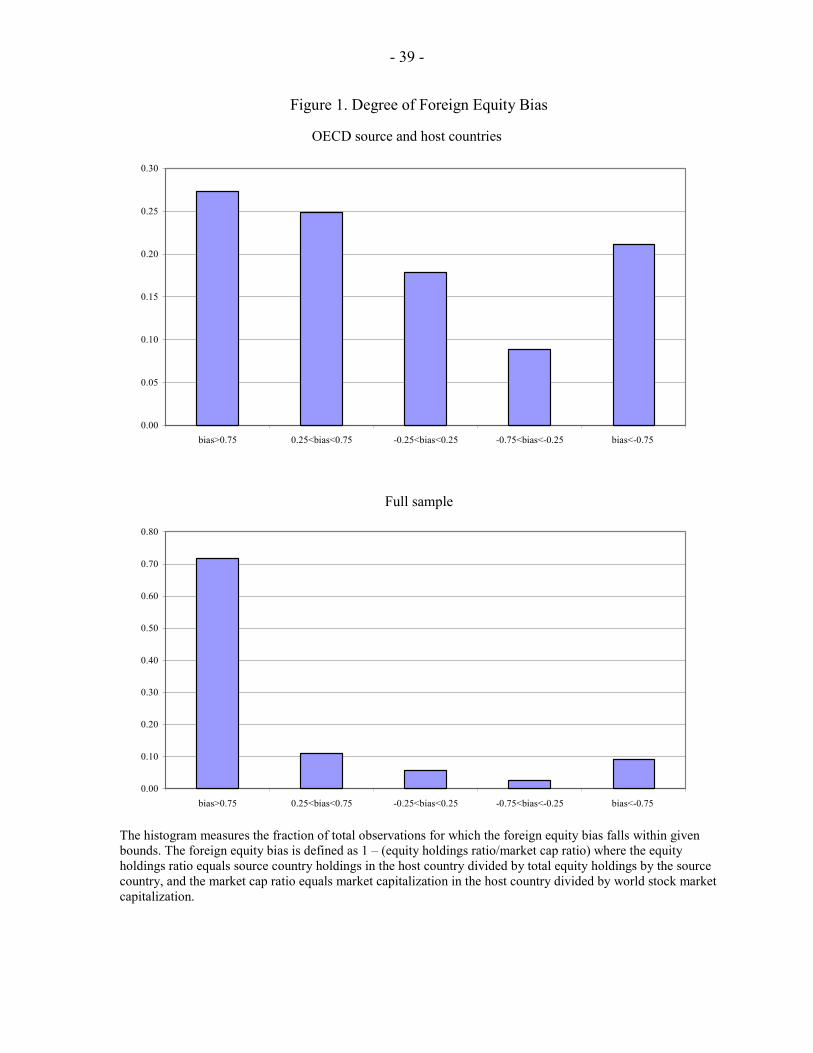
- 39 -
Figure 1. Degree of Foreign Equity Bias
OECD source and host countries
0.00
0.05
0.10
0.15
0.20
0.25
0.30
bias>0.75 0.25<bias<0.75 -0.25<bias<0.25 -0.75<bias<-0.25 bias<-0.75
Full sample
0.00
0.10
0.20
0.30
0.40
0.50
0.60
0.70
0.80
bias>0.75 0.25<bias<0.75 -0.25<bias<0.25 -0.75<bias<-0.25 bias<-0.75
The histogram measures the fraction of total observations for which the foreign equity bias falls within given bounds. The foreign equity bias is defined as 1 – (equity holdings ratio/market cap ratio) where the equity holdings ratio equals source country holdings in the host country divided by total equity holdings by the source country, and the market cap ratio equals market capitalization in the host country divided by world stock market capitalization.

- 40 -
Figure 2. Scatter of 2001 Equity Holdings versus 2001 Imports
0
510
15lo
g(1+
equi
ty)
0 5 10 15log(1+avg imports 1997-01)

- 41 -
REFERENCES
Ahearne, Alan B., William Griever, and Frank Warnock, 2004, “Information Costs and the
Home Bias,” Journal of International Economics, Vol. 62, pp. 313–36. Anderson, James E., and Eric van Wincoop, 2003a, “Gravity with Gravitas: A Solution to the
Border Puzzle,” American Economic Review, Vol. 93, pp. 170–92. ———, 2003b, “Trade Costs,” Journal of Economic Literature, forthcoming. Baltagi, Badi H., Peter Egger, and Michael Pfaffermayr, 2003, “A Generalized Design for
Bilateral Trade Flow Models,” Economics Letters, Vol. 80, pp. 391–97. Blonigen, Bruce A., and Ronald J. Davies, 2002, “Do Bilateral Tax Treaties Promote Foreign
Direct Investment?” NBER Working Paper 8834, (Cambridge, Massachussetts: NBER), March.
Buch, Claudia, 2002, “Are Banks Different? Evidence from International Data,”
International Finance, Vol. 5, No. 1, pp. 97–114. ———, 2003, “Information or Regulation: What Drives the International Activities of
Commercial Banks?” Journal of Money, Credit, and Banking, forthcoming. Buch, Claudia, M., John C. Driscoll, and Charlotte Ostergaard, 2003, “International
Diversification in Bank Asset Portfolios,” (unpublished; Oslo: Norwegian School of Management), March.
Burger, John D., and Francis E. Warnock, 2003, “Diversification, Original Sin, and
International Bond Portfolios,” Federal Reserve Board International Finance Discussion Paper No. 755 (Washington: Federal Reserve Board), January.
Cai, Fang, and Francis E. Warnock, 2004, “International Diversification At Home and
Abroad,” Federal Reserve Board International Finance Discussion Paper No. 793 (Washington: Federal Reserve Board), February.
Cooper, Ian, and Evi Kaplanis, 1986, “Costs to Crossborder Investment and International
Equity Market Equilibrium,” in Recent Developments in Corporate Finance, ed. by Jeremy Edwards, Julian Franks, Colin Mayer and Stephen Schaefer (Cambridge, England: Cambridge University Press), pp. 209–40.
Coval, Joshua D. and Tobias J. Moskowitz, 1999, “The Geography of Investment: Informed
Trading and Asset Prices,” Journal of Finance, Vol. 54, pp. 2045–73.

- 42 -
Dahlquist, Magnus, Lee Pinkowitz, Rene M. Stulz, and Rohan Williamson, 2002, “Corporate Governance and the Home Bias,” Journal of Financial and Quantitative Analysis, forthcoming.
Davis, Steven, Jeremy Nalewaik and Paul Willen, 2001, “On the Gains to International Trade
in Risky Financial Assets,” (unpublished; Chicago: Graduate School of Business). Di Giovanni, Julian, 2004, “What Drives Capital Flows?, The Case of Cross-Border M&A
Activity and Financial Deepening,” Journal of International Economics, forthcoming. Edison, Hali and Frank Warnock, 2003a, “A Simple Measure of the Intensity of Capital
Controls,” Journal of Empirical Finance, Vol. 10, No. 1/2, pp. 81–103. ——— and Frank Warnock, 2003b, “U.S. Investors’ Emerging Market Equity Portfolios: A
Security-Level Analysis,” Review of Economics and Statistics, forthcoming. Flavin, Thomas, Margaret Hurley and Fabrice Rousseau, 2000, “Explaining Stock Market
Correlation: A Gravity Model Approach,” The Manchester School, Vol. 70, pp. 87–106.
Forbes, Kristin J and Menzie D. Chinn, 2003, “A Decomposition of Global Linkages in
Financial Markets Over Time,” NBER Working Paper No. 9555, (Cambridge: Massachussetts; NBER), March.
Frankel, Jeffrey and Andrew K. Rose, 2002, “An Estimate Of The Effect Of Common
Currencies On Trade And Income,” Quarterly Journal Of Economics, Vol. 117, (May), pp. 437–66.
Ghosh, Swati and Holger Wolf, 2001, “Is There a Curse of Location? Spatial Determinants
of Capital Flows to Emerging Markets,” ed. by Sebastian Edwards in Capital Flows and The Emerging Economies: Theory, Evidence, and Controversies, (Chicago: University of Chicago Press for NBER).
Greene, William, 2003, “Fixed Effects and Bias Due to the Incidental Parameters Problem in
the Tobit Model,” (unpublished; New York: New York University). Griever, William L., Gary A. Lee and Francis E. Warnock, 2001, “The US System for
Measuring Cross-Border Investment in Securities: A Primer with A Discussion of Recent Developments,” Federal Reserve Bulletin, Vol. 87, No. 10, pp. 633–50.
Hardouvelis, Gikas, Dimitrios Malliaropulos and Richard Priestly, 2001, “The Impact of
Globalization on the Equity Cost of Capital,” (unpublished; Oslo: Norwegian School of Management).
Honohan, Patrick and Philip R. Lane, 2000, “Where Do the Irish Invest?” Irish Banking
Review, Autumn, pp. 12–23.
- 43 -
Honore, Bo and Luojia Hu, 2003, “Estimation of Cross Sectional and Panel Data Censored Regression Models with Endogeneity,” (unpublished; New Jersey: Princeton University).
Huberman, Gur, 2001, “Familiarity Breeds Investment,” Review of Financial Studies,
Vol. 14, No. 3, (Fall), pp. 659–80. Imbs, Jean, 2004a, “Trade, Finance, Specialization and Synchronization,” Review of
Economics and Statistics, forthcoming. ———, 2004b, “The Real Effects of Financial Integration,” (unpublished; United Kingdom:
London Business School). International Monetary Fund, 1993, Balance of Payments Manual, 5th edition,
(Washington, DC: International Monetary Fund). ———, 2000, The Results of the 1997 Comprehensive Portfolio Investment Survey,
(Washington, DC: International Monetary Fund). Johnston, R. Barry and others, 1999, Exchange Rate Arrangements and Currency
Convertibility: Developments and Issues, (Washington, DC: International Monetary Fund).
Johnston, R. Barry and Natalia Tamirisa, 1998, “"Why Do Countries Use Capital
Controls?,” IMF Working Paper No. 98/181. Kawai, Masahiro and Li-Gang Liu, 2001, “Determinants of International Commercial Bank
Loans to Developing Countries,” (unpublished; Japan: University of Tokyo), June. Lane, Philip R. and Gian Maria Milesi-Ferretti, 2001a, “The External Wealth of Nations:
Measures of Foreign Assets and Liabilities for Industrial and Developing Countries,” Journal of International Economics, Vol. 55, pp. 263–94, December 2001.
———, 2001b, “External Capital Structure: Theory and Evidence,”ed. by H. Siebert in The
World's New Financial Landscape: Challenges for Economic Policy, Berlin Heidelberg: Springer-Verlag, pp. 247–84.
———, 2002, “Long-Term Capital Movements” NBER Macroeconomics Annual 2001,
Vol. 16, pp. 73–116. ———, 2003, “International Financial Integration,” International Monetary Fund Staff
Papers 50(S), pp. 82–113. La Porta, Rafael, Florencio Lopez-de-Silanes, and Andrei Shleifer, 2003, “What Works in
Securities Laws?” (unpublished; Massachussetts: Harvard University), July.

- 44 -
Mann, Catherine and Ellen Meade, 2002, “Home Bias, Transaction Costs, and Prospects for the Euro: A More Detailed Analysis,” (unpublished; London: Institute for International Economics and Center for Economic Performance).
Martin, Philippe and Helene Rey, 2000 “Financial Integration and Asset Returns,” European
Economic Review, Vol. 44, pp. 1327–50. ———, 2003, “Financial Super-Markets: Size Matters for Asset Trade,” Journal of
International Economics, forthcoming. Morse, Adair and Sophie Shive, 2003, “Patriotism in Your Portfolio,” (unpublished;
Michigan: University of Michigan). Obstfeld, Maurice and Kenneth Rogoff, 1996, “Foundations of International
Macroeconomics,” The MIT Press. ———, 2001, “The Six Major Puzzles in International Macroeconomics. Is There a
Common Cause?” NBER Macroeconomics Annual, Vol. 15, pp. 339–90. Obstfeld, Maurice and Alan Taylor, 2002, “Globalization and Capital Markets,” NBER
Working Paper No. 8846, (Cambridge, Massachussetts: NBER), March. Portes, Richard and Hélène Rey, 2003, “The Determinants of Cross-Border Equity Flows:
The Geography of Information,” (unpublished; New Jersey: Princeton University). Portes, Richard, Hélène Rey, and Yonghyup Oh, 2001, “Information and Capital Flows: The
Determinants of Transactions in Financial Assets,” European Economic Review, No. 45, May, pp. 783–96.
Quinn, Dennis, 1997, “The Correlates of Change in International Financial Regulation,”
American Political Science Review, Vol. 91, No. 3, September, pp. 531–51. Rose, Andrew K., 2002, “One Reason Countries Pay Their Debts: Renegotiation and
International Trade,” NBER Working Paper No. 8853, (Cambridge, Massachussetts: NBER), March.
——— and Mark Spiegel, 2002, “A Gravity Model of Sovereign Lending: Trade, Default
and Credit,” NBER Working Paper No. 9285, (Cambridge, Massachussetts: NBER), October.
——— and Eric van Wincoop, 2001, “National Money as a Barrier to International Trade:
The Real Case for Currency Union,” American Economic Review Papers and Proceedings, Vol. 91, No. 2, pp. 386–90.
Sarisoy, Selen, 2003, “Foreign Direct Investment, Trade and Portfolio Investment Flows:
The Role of Geography,” (unpublished; Ireland: Trinity College Dublin).

- 45 -
Stein, Ernesto H. and Christian Daude, 2003, “Longitude Matters: Time Zones and the
Location of FDI,” (unpublished; Washington, DC: Inter-American Development Bank).
Tesar, Linda and Ingrid Werner 1995, “Home Bias and High Turnover,” Journal of
International Money and Finance, Vol. 14, No. 4, pp. 467–92. Warnock, Francis A. and Chad Griever, 2003, “Financial Centers and The Geography of
Capital Flows,” International Finance, Vol. 6, No. 1, pp. 27–59. Wei, Shang-Jin, 2000, “How Taxing Is Corruption On International Investors?,” The Review
of Economics and Statistics, Vol. 82, February, pp. 1–11. Yildrim, Canan, 2003, “Informational Asymmetries, Corporate Governance Infrastructure
and Foreign Portfolio Equity Investment,” (unpublished; The Netherlands: Tilburg University).