International Foundation for Electoral Systems · International Foundation for Electoral Systems 2...
43
-
Upload
truongngoc -
Category
Documents
-
view
222 -
download
0
Transcript of International Foundation for Electoral Systems · International Foundation for Electoral Systems 2...

International Foundation for Electoral Systems
2
INDONESIA ELECTORAL SURVEY 2010
"
"
"
IFES is an international nonprofit organization that supports the building of democratic societies. Additional information is online at www.ifes.org.
3
November 2010 This publication was produced by IFES for the Australian Agency for International Development (AUSAID). Disclaimer The views expressed in this publication do not necessarily reflect the views of the Australian Agency for International Development (AUSAID) or the Australian Government.
Indonesia 2010 Survey Report
2
INDONESIA ELECTORAL SURVEY 2010
"
"
"
IFES is an international nonprofit organization that supports the building of democratic societies. Additional information is online at www.ifes.org.
3
November 2010 This publication was produced by IFES for the Australian Agency for International Development (AUSAID). Disclaimer The views expressed in this publication do not necessarily reflect the views of the Australian Agency for International Development (AUSAID) or the Australian Government.
Indonesia 2010 Survey Report
Indonesia Electoral Survey 2010 Rakesh Sharma, Lauren Serpe, and Astri Suryandari Copyright © IFES. All rights reserved. IFES 1850 K Street, NW Fifth Floor Washington, D.C. 20006 U.S.A. Notice of rights All rights reserved. No part of this report can be reproduced or transmitted in any form by any means without the prior permission of the publisher. ISBN: 1-931459-56-8

International Foundation for Electoral Systems
4
Indonesia Electoral Survey 2010 Authors: Lauren Serpe, Rakesh Sharma, and Astri Suryandari Copyright © IFES. All rights reserved. IFES 1101 15th Street, NW Ste. 300 Washington, D.C. U.S.A. Notice of rights All rights reserved. No part of this report can be reproduced or transmitted in any form by any means without the prior permission of the publisher.
5
Table of Contents Introduction ................................................................................................................................................ 1
Summary of Main Findings ....................................................................................................................... 3
Survey Details ............................................................................................................................................ 8
I. Opinions on Socio-Economic Situation and Political Institutions in Indonesia ............................................ 9
II. Voting and Local Elections .................................................................................................................... 15
III. Election Procedures and Voting Behavior ............................................................................................ 22
IV. Women’s Representation in Politics ..................................................................................................... 29
V. Opinions on Democracy and New Election Issues ................................................................................ 33
Indonesia 2010 Survey Report
4
Indonesia Electoral Survey 2010 Authors: Lauren Serpe, Rakesh Sharma, and Astri Suryandari Copyright © IFES. All rights reserved. IFES 1101 15th Street, NW Ste. 300 Washington, D.C. U.S.A. Notice of rights All rights reserved. No part of this report can be reproduced or transmitted in any form by any means without the prior permission of the publisher.
5
Table of Contents Introduction ................................................................................................................................................ 1
Summary of Main Findings ....................................................................................................................... 3
Survey Details ............................................................................................................................................ 8
I. Opinions on Socio-Economic Situation and Political Institutions in Indonesia ............................................ 9
II. Voting and Local Elections .................................................................................................................... 15
III. Election Procedures and Voting Behavior ............................................................................................ 22
IV. Women’s Representation in Politics ..................................................................................................... 29
V. Opinions on Democracy and New Election Issues ................................................................................ 33

International Foundation for Electoral Systems
Page 1
Indonesia 2010 Survey Report
6
Introduction The 2010 IFES survey in Indonesia shows that while Indonesians are firmly committed to democracy and value the influence that voting provides them, the election process in Indonesia still faces many challenges in providing effective means for participation in elections for voting-age adults in the country. For one, the survey highlights a continued lack of information on key aspects of the election process among most Indonesians. More than three-quarters of Indonesians say they don’t have much or any information on the local elections, and a majority say they need more information on key aspects of the election process such as registration, marking ballots, and where and when to vote. This lack of information is generally spread across society and dictates that electoral authorities devote critical attention to voter education and voter information efforts. The survey data also points out that those charged with developing voter education and information strategies should be cognizant of the differing preferences for information sources among key sub-groups in the population. While television is the primary source of information on socio-political developments in Indonesia, the survey data indicates that voter education and information efforts should rely on a mix of formal and informal sources of information to effectively reach key segments of Indonesian society. Issues related to electoral reform are also critical for efforts related to effective electoral administration in the country. While Indonesians generally express confidence in electoral institutions in the country, the survey data highlights several issues related to the election process that should be addressed to ensure that electoral institutions continue to be viewed with confidence by Indonesians. The issue of political neutrality of election commission members and the possibility of political party members joining the KPU and lower-level commissions is an issue very much at the forefront of electoral reform discussion in Indonesia. Data from the survey indicates general support for limiting political influence on the KPU as exemplified by respondent support for a proposed measure to require a five-year wait period before resigning election commissioners can join political parties. The vast majority of Indonesians also believe that elections management should be led those who have expertise in these matters, and who are perceived as being impartial on political matters. Measures designed to systematize this impartiality should be pursued in electoral reform initiatives to ensure that the vast majority of Indonesians continue to believe that electoral institutions act with impartiality in the election process. Clarity in electoral procedures should also be a priority for electoral authorities. The survey data shows that Indonesians generally lack knowledge on checking the voters register, and are confused as to the proper way to mark ballots. The fact that the procedures for marking ballots have changed from election to election, combined with a general lack of information on the election process, combine to make this issue one requiring focus from electoral authorities. IFES surveys in Indonesia have consistently shown a lack of knowledge among the majority of Indonesians on checking their registration status, and this continues to be an issue with the pemilukada. One area of reform in the electoral system that enjoys popular support is the greater participation of women as candidates in political races in Indonesia. A firm plurality of Indonesians believes that the proportion of women in legislatures is too low, and a solid majority supports quotas to increase the number of women on party lists for legislative elections. There is also strong agreement with various arguments that have been used by proponents for greater number of female parliamentarians in Indonesia. The fact that women are significantly underrepresented in political offices and Indonesia’s obligations under international treaties are the two most influential arguments that influence opinions on the proportion of women in legislative bodies in the country. The IFES trend survey data shows that views

Page 3
Indonesia 2010 Survey Report
8
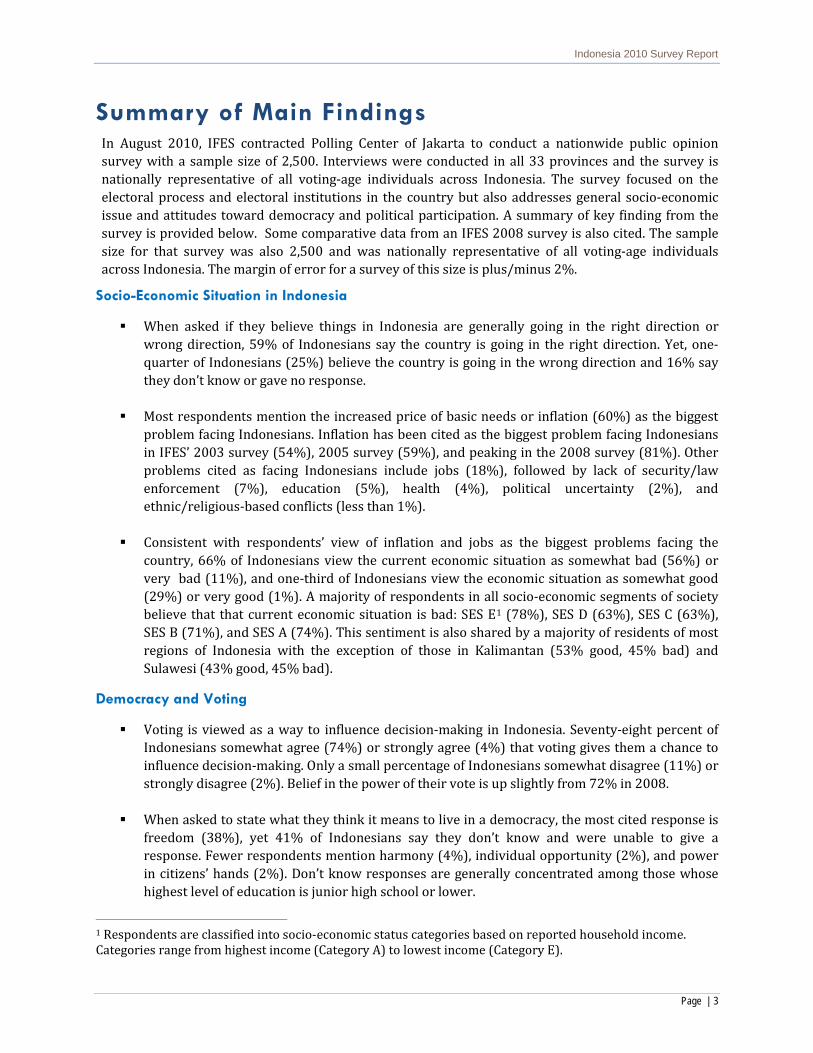
Summary of Main Findings In August 2010, IFES contracted Polling Center of Jakarta to conduct a nationwide public opinion survey with a sample size of 2,500. Interviews were conducted in all 33 provinces and the survey is nationally representative of all voting-age individuals across Indonesia. The survey focused on the electoral process and electoral institutions in the country but also addresses general socio-economic issue and attitudes toward democracy and political participation. A summary of key finding from the survey is provided below. Some comparative data from an IFES 2008 survey is also cited. The sample size for that survey was also 2,500 and was nationally representative of all voting-age individuals across Indonesia. The margin of error for a survey of this size is plus/minus 2%.
Socio-Economic Situation in Indonesia
" When asked if they believe things in Indonesia are generally going in the right direction or wrong direction, 59% of Indonesians say the country is going in the right direction. Yet, one-quarter of Indonesians (25%) believe the country is going in the wrong direction and 16% say they don’t know or gave no response.
" Most respondents mention the increased price of basic needs or inflation (60%) as the biggest problem facing Indonesians. Inflation has been cited as the biggest problem facing Indonesians in IFES’ 2003 survey (54%), 2005 survey (59%), and peaking in the 2008 survey (81%). Other problems cited as facing Indonesians include jobs (18%), followed by lack of security/law enforcement (7%), education (5%), health (4%), political uncertainty (2%), and ethnic/religious-based conflicts (less than 1%).
" Consistent with respondents’ view of inflation and jobs as the biggest problems facing the country, 66% of Indonesians view the current economic situation as somewhat bad (56%) or very bad (11%), and one-third of Indonesians view the economic situation as somewhat good (29%) or very good (1%). A majority of respondents in all socio-economic segments of society (SES) believe that that current economic situation is bad: SES E1 (78%), SES D (63%), SES C (63%), SES B (71%), and SES A (74%). This sentiment is also shared by a majority of residents of most regions of Indonesia with the exception of those in Kalimantan (53% good, 45% bad) and Sulawesi (43% good, 45% bad).
Democracy and Voting
" Voting is viewed as a way to influence decision-making in Indonesia. Seventy-eight percent of Indonesians somewhat agree (74%) or strongly agree (4%) that voting gives them a chance to influence decision-making. Only a small percentage of Indonesians somewhat disagree (11%) or strongly disagree (2%). Belief in the power of their vote is up slightly from 72% in 2008.
" When asked to state what they think it means to live in a democracy, the most cited response is freedom (38%), yet 41% of Indonesians say they don’t know and were unable to give a response. Fewer respondents mention harmony (4%), individual opportunity (2%), and power in citizens’ hands (2%). Don’t know responses are generally concentrated among those whose highest level of education is junior high school or lower.
1 Respondents are classified into socio-economic status categories based on reported household income. Categories range from highest income (Category A) to lowest income (Category E).
7
on gender and politics in Indonesia have become more progressive over time, and that sufficient concern exists to provide space for effective advocacy on this issue in Indonesia with both men and women.
Finally, the survey also points to several areas in the political process that may become a greater focus of advocacy efforts in the future. The majority of Indonesians prefer fewer, rather than greater, political parties in the legislative process because they perceive that this may lead to greater effectiveness in the legislative process. This impacts discussions of threshold limits in the electoral system and is likely to bring heated debate between large and small parties as this issue becomes more resonant in the public sphere. The majority of Indonesians also prefer voting directly for a candidate rather than voting for a party in legislative elections. This is an issue in which most political parties will have a clear interest (maintaining their influence through party list voting) that is opposed to the opinions of the majority of Indonesians, at least as measured through the survey.
A Constitutional Court’s decision prior to the 2009 general elections had the effect of changing voting to open list voting (where voters’ preference determines who from the party lists should fill seats won by the party). There has been much debate about the impact of this change on Indonesian electoral politics and governance. While not a measure of the ultimate impact of open list voting on Indonesia’s political system, the survey data shows that the Indonesian public has a positive disposition toward open list voting.
Page 2
International Foundation for Electoral Systems
8
Summary of Main Findings In August 2010, IFES contracted Polling Center of Jakarta to conduct a nationwide public opinion survey with a sample size of 2,500. Interviews were conducted in all 33 provinces and the survey is nationally representative of all voting-age individuals across Indonesia. The survey focused on the electoral process and electoral institutions in the country but also addresses general socio-economic issue and attitudes toward democracy and political participation. A summary of key finding from the survey is provided below. Some comparative data from an IFES 2008 survey is also cited. The sample size for that survey was also 2,500 and was nationally representative of all voting-age individuals across Indonesia. The margin of error for a survey of this size is plus/minus 2%.
Socio-Economic Situation in Indonesia
" When asked if they believe things in Indonesia are generally going in the right direction or wrong direction, 59% of Indonesians say the country is going in the right direction. Yet, one-quarter of Indonesians (25%) believe the country is going in the wrong direction and 16% say they don’t know or gave no response.
" Most respondents mention the increased price of basic needs or inflation (60%) as the biggest problem facing Indonesians. Inflation has been cited as the biggest problem facing Indonesians in IFES’ 2003 survey (54%), 2005 survey (59%), and peaking in the 2008 survey (81%). Other problems cited as facing Indonesians include jobs (18%), followed by lack of security/law enforcement (7%), education (5%), health (4%), political uncertainty (2%), and ethnic/religious-based conflicts (less than 1%).
" Consistent with respondents’ view of inflation and jobs as the biggest problems facing the country, 66% of Indonesians view the current economic situation as somewhat bad (56%) or very bad (11%), and one-third of Indonesians view the economic situation as somewhat good (29%) or very good (1%). A majority of respondents in all socio-economic segments of society (SES) believe that that current economic situation is bad: SES E1 (78%), SES D (63%), SES C (63%), SES B (71%), and SES A (74%). This sentiment is also shared by a majority of residents of most regions of Indonesia with the exception of those in Kalimantan (53% good, 45% bad) and Sulawesi (43% good, 45% bad).
Democracy and Voting
" Voting is viewed as a way to influence decision-making in Indonesia. Seventy-eight percent of Indonesians somewhat agree (74%) or strongly agree (4%) that voting gives them a chance to influence decision-making. Only a small percentage of Indonesians somewhat disagree (11%) or strongly disagree (2%). Belief in the power of their vote is up slightly from 72% in 2008.
" When asked to state what they think it means to live in a democracy, the most cited response is freedom (38%), yet 41% of Indonesians say they don’t know and were unable to give a response. Fewer respondents mention harmony (4%), individual opportunity (2%), and power in citizens’ hands (2%). Don’t know responses are generally concentrated among those whose highest level of education is junior high school or lower.
1 Respondents are classified into socio-economic status categories based on reported household income. Categories range from highest income (Category A) to lowest income (Category E).
7
on gender and politics in Indonesia have become more progressive over time, and that sufficient concern exists to provide space for effective advocacy on this issue in Indonesia with both men and women.
Finally, the survey also points to several areas in the political process that may become a greater focus of advocacy efforts in the future. The majority of Indonesians prefer fewer, rather than greater, political parties in the legislative process because they perceive that this may lead to greater effectiveness in the legislative process. This impacts discussions of threshold limits in the electoral system and is likely to bring heated debate between large and small parties as this issue becomes more resonant in the public sphere. The majority of Indonesians also prefer voting directly for a candidate rather than voting for a party in legislative elections. This is an issue in which most political parties will have a clear interest (maintaining their influence through party list voting) that is opposed to the opinions of the majority of Indonesians, at least as measured through the survey.
A Constitutional Court’s decision prior to the 2009 general elections had the effect of changing voting to open list voting (where voters’ preference determines who from the party lists should fill seats won by the party). There has been much debate about the impact of this change on Indonesian electoral politics and governance. While not a measure of the ultimate impact of open list voting on Indonesia’s political system, the survey data shows that the Indonesian public has a positive disposition toward open list voting.
Indonesia 2010 Survey Report
Page | 3
Summary of Main Findings In August 2010, IFES contracted Polling Center of Jakarta to conduct a nationwide public opinion survey with a sample size of 2,500. Interviews were conducted in all 33 provinces and the survey is nationally representative of all voting-age individuals across Indonesia. The survey focused on the electoral process and electoral institutions in the country but also addresses general socio-economic issue and attitudes toward democracy and political participation. A summary of key finding from the survey is provided below. Some comparative data from an IFES 2008 survey is also cited. The sample size for that survey was also 2,500 and was nationally representative of all voting-age individuals across Indonesia. The margin of error for a survey of this size is plus/minus 2%.
Socio-Economic Situation in Indonesia
When asked if they believe things in Indonesia are generally going in the right direction or wrong direction, 59% of Indonesians say the country is going in the right direction. Yet, one-quarter of Indonesians (25%) believe the country is going in the wrong direction and 16% say they don’t know or gave no response.
Most respondents mention the increased price of basic needs or inflation (60%) as the biggest problem facing Indonesians. Inflation has been cited as the biggest problem facing Indonesians in IFES’ 2003 survey (54%), 2005 survey (59%), and peaking in the 2008 survey (81%). Other problems cited as facing Indonesians include jobs (18%), followed by lack of security/law enforcement (7%), education (5%), health (4%), political uncertainty (2%), and ethnic/religious-based conflicts (less than 1%).
Consistent with respondents’ view of inflation and jobs as the biggest problems facing the country, 66% of Indonesians view the current economic situation as somewhat bad (56%) or very bad (11%), and one-third of Indonesians view the economic situation as somewhat good (29%) or very good (1%). A majority of respondents in all socio-economic segments of society believe that that current economic situation is bad: SES E1
Democracy and Voting
(78%), SES D (63%), SES C (63%), SES B (71%), and SES A (74%). This sentiment is also shared by a majority of residents of most regions of Indonesia with the exception of those in Kalimantan (53% good, 45% bad) and Sulawesi (43% good, 45% bad).
Voting is viewed as a way to influence decision-making in Indonesia. Seventy-eight percent of Indonesians somewhat agree (74%) or strongly agree (4%) that voting gives them a chance to influence decision-making. Only a small percentage of Indonesians somewhat disagree (11%) or strongly disagree (2%). Belief in the power of their vote is up slightly from 72% in 2008.
When asked to state what they think it means to live in a democracy, the most cited response is freedom (38%), yet 41% of Indonesians say they don’t know and were unable to give a response. Fewer respondents mention harmony (4%), individual opportunity (2%), and power in citizens’ hands (2%). Don’t know responses are generally concentrated among those whose highest level of education is junior high school or lower.
1 Respondents are classified into socio-economic status categories based on reported household income. Categories range from highest income (Category A) to lowest income (Category E).
Page 4
International Foundation for Electoral Systems
10
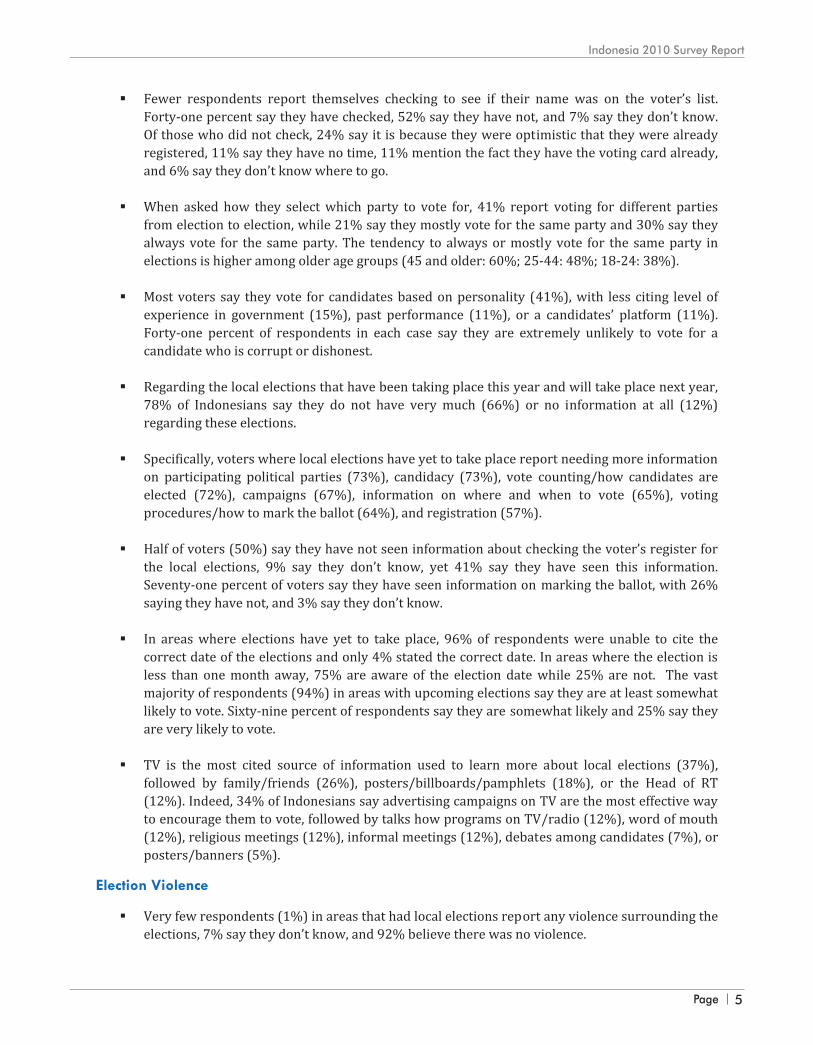
" Fewer respondents report themselves checking to see if their name was on the voter’s list. Forty-one percent say they have checked, 52% say they have not, and 7% say they don’t know. Of those who did not check, 24% say it is because they were optimistic that they were already registered, 11% say they have no time, 11% mention the fact they have the voting card already, and 6% say they don’t know where to go.
" When asked how they select which party to vote for, 41% report voting for different parties from election to election, while 21% say they mostly vote for the same party and 30% say they always vote for the same party. The tendency to always or mostly vote for the same party in elections is higher among older age groups (45 and older: 60%; 25-44: 48%; 18-24: 38%).
" Most voters say they vote for candidates based on personality (41%), with less citing level of experience in government (15%), past performance (11%), or a candidates’ platform (11%). Forty-one percent of respondents in each case say they are extremely unlikely to vote for a candidate who is corrupt or dishonest.
" Regarding the local elections that have been taking place this year and will take place next year, 78% of Indonesians say they do not have very much (66%) or no information at all (12%) regarding these elections.
" Specifically, voters where local elections have yet to take place report needing more information on participating political parties (73%), candidacy (73%), vote counting/how candidates are elected (72%), campaigns (67%), information on where and when to vote (65%), voting procedures/how to mark the ballot (64%), and registration (57%).
" Half of voters (50%) say they have not seen information about checking the voter’s register for the local elections, 9% say they don’t know, yet 41% say they have seen this information. Seventy-one percent of voters say they have seen information on marking the ballot, with 26% saying they have not, and 3% say they don’t know.
" In areas where elections have yet to take place, 96% of respondents were unable to cite the correct date of the elections and only 4% stated the correct date. In areas where the election is less than one month away, 75% are aware of the election date while 25% are not. The vast majority of respondents (94%) in areas with upcoming elections say they are at least somewhat likely to vote. Sixty-nine percent of respondents say they are somewhat likely and 25% say they are very likely to vote.
" TV is the most cited source of information used to learn more about local elections (37%), followed by family/friends (26%), posters/billboards/pamphlets (18%), or the Head of RT (12%). Indeed, 34% of Indonesians say advertising campaigns on TV are the most effective way to encourage them to vote, followed by talks how programs on TV/radio (12%), word of mouth (12%), religious meetings (12%), informal meetings (12%), debates among candidates (7%), or posters/banners (5%).
Election Violence
" Very few respondents (1%) in areas that had local elections report any violence surrounding the elections, 7% say they don’t know, and 92% believe there was no violence.
9
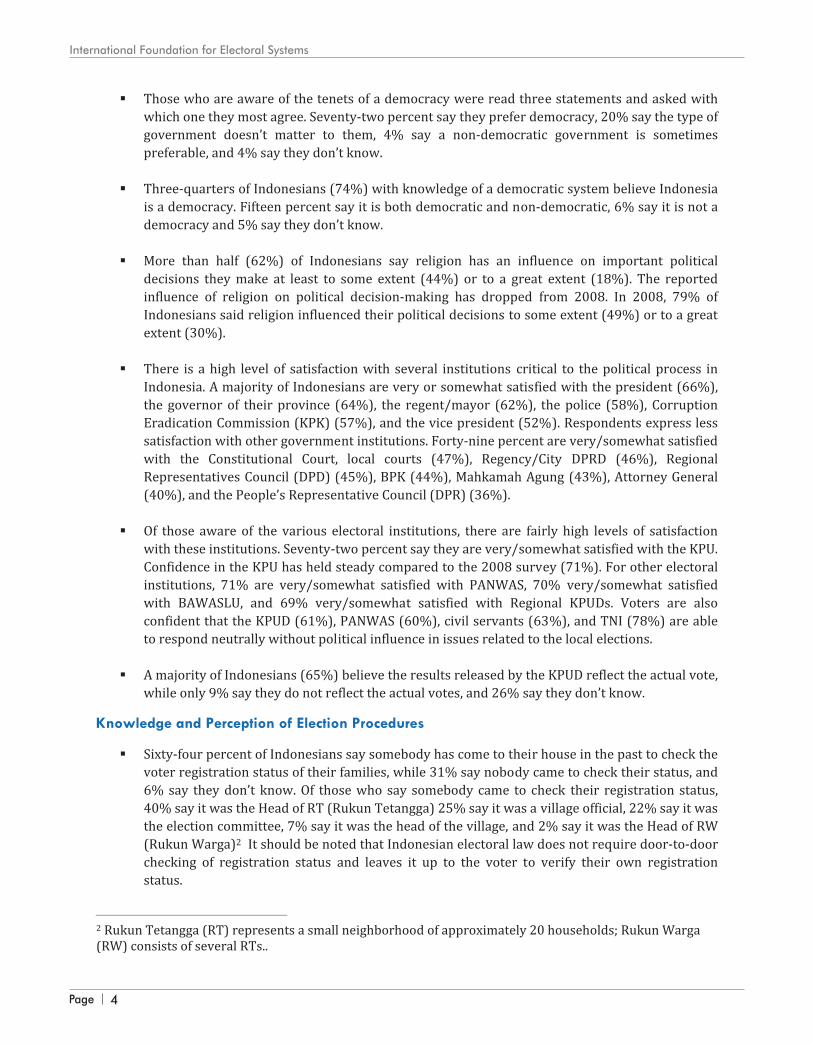
" Those who are aware of the tenets of a democracy were read three statements and asked with which one they most agree. Seventy-two percent say they prefer democracy, 20% say the type of government doesn’t matter to them, 4% say a non-democratic government is sometimes preferable, and 4% say they don’t know.
" Three-quarters of Indonesians (74%) with knowledge of a democratic system believe Indonesia is a democracy. Fifteen percent say it is both democratic and non-democratic, 6% say it is not a democracy and 5% say they don’t know.
" More than half (62%) of Indonesians say religion has an influence on important political decisions they make at least to some extent (44%) or to a great extent (18%). The reported influence of religion on political decision-making has dropped from 2008. In 2008, 79% of Indonesians said religion influenced their political decisions to some extent (49%) or to a great extent (30%).
" There is a high level of satisfaction with several institutions critical to the political process in Indonesia. A majority of Indonesians are very or somewhat satisfied with the president (66%), the governor of their province (64%), the regent/mayor (62%), the police (58%), Corruption Eradication Commission (KPK) (57%), and the vice president (52%). Respondents express less satisfaction with other government institutions. Forty-nine percent are very/somewhat satisfied with the Constitutional Court, local courts (47%), Regency/City DPRD (46%), Regional Representatives Council (DPD) (45%), BPK (44%), Mahkamah Agung (43%), Attorney General (40%), and the People’s Representative Council (DPR) (36%).
" Of those aware of the various electoral institutions, there are fairly high levels of satisfaction with these institutions. Seventy-two percent say they are very/somewhat satisfied with the KPU. Confidence in the KPU has held steady compared to the 2008 survey (71%). For other electoral institutions, 71% are very/somewhat satisfied with PANWAS, 70% very/somewhat satisfied with BAWASLU, and 69% very/somewhat satisfied with Regional KPUDs. Voters are also confident that the KPUD (61%), PANWAS (60%), civil servants (63%), and TNI (78%) are able to respond neutrally without political influence in issues related to the local elections.
" A majority of Indonesians (65%) believe the results released by the KPUD reflect the actual vote, while only 9% say they do not reflect the actual votes, and 26% say they don’t know.
Knowledge and Perception of Election Procedures
" Sixty-four percent of Indonesians say somebody has come to their house in the past to check the voter registration status of their families, while 31% say nobody came to check their status, and 6% say they don’t know. Of those who say somebody came to check their registration status, 40% say it was the Head of RT (Rukun Tetangga) 25% say it was a village official, 22% say it was the election committee, 7% say it was the head of the village, and 2% say it was the Head of RW (Rukun Warga)2 It should be noted that Indonesian electoral law does not require door-to-door checking of registration status and leaves it up to the voter to verify their own registration status.
2 Rukun Tetangga (RT) represents a small neighborhood of approximately 20 households; Rukun Warga (RW) consists of several RTs..
Page 5
Indonesia 2010 Survey Report
10
" Fewer respondents report themselves checking to see if their name was on the voter’s list. Forty-one percent say they have checked, 52% say they have not, and 7% say they don’t know. Of those who did not check, 24% say it is because they were optimistic that they were already registered, 11% say they have no time, 11% mention the fact they have the voting card already, and 6% say they don’t know where to go.
" When asked how they select which party to vote for, 41% report voting for different parties from election to election, while 21% say they mostly vote for the same party and 30% say they always vote for the same party. The tendency to always or mostly vote for the same party in elections is higher among older age groups (45 and older: 60%; 25-44: 48%; 18-24: 38%).
" Most voters say they vote for candidates based on personality (41%), with less citing level of experience in government (15%), past performance (11%), or a candidates’ platform (11%). Forty-one percent of respondents in each case say they are extremely unlikely to vote for a candidate who is corrupt or dishonest.
" Regarding the local elections that have been taking place this year and will take place next year, 78% of Indonesians say they do not have very much (66%) or no information at all (12%) regarding these elections.
" Specifically, voters where local elections have yet to take place report needing more information on participating political parties (73%), candidacy (73%), vote counting/how candidates are elected (72%), campaigns (67%), information on where and when to vote (65%), voting procedures/how to mark the ballot (64%), and registration (57%).
" Half of voters (50%) say they have not seen information about checking the voter’s register for the local elections, 9% say they don’t know, yet 41% say they have seen this information. Seventy-one percent of voters say they have seen information on marking the ballot, with 26% saying they have not, and 3% say they don’t know.
" In areas where elections have yet to take place, 96% of respondents were unable to cite the correct date of the elections and only 4% stated the correct date. In areas where the election is less than one month away, 75% are aware of the election date while 25% are not. The vast majority of respondents (94%) in areas with upcoming elections say they are at least somewhat likely to vote. Sixty-nine percent of respondents say they are somewhat likely and 25% say they are very likely to vote.
" TV is the most cited source of information used to learn more about local elections (37%), followed by family/friends (26%), posters/billboards/pamphlets (18%), or the Head of RT (12%). Indeed, 34% of Indonesians say advertising campaigns on TV are the most effective way to encourage them to vote, followed by talks how programs on TV/radio (12%), word of mouth (12%), religious meetings (12%), informal meetings (12%), debates among candidates (7%), or posters/banners (5%).
Election Violence
" Very few respondents (1%) in areas that had local elections report any violence surrounding the elections, 7% say they don’t know, and 92% believe there was no violence.
9
" Those who are aware of the tenets of a democracy were read three statements and asked with which one they most agree. Seventy-two percent say they prefer democracy, 20% say the type of government doesn’t matter to them, 4% say a non-democratic government is sometimes preferable, and 4% say they don’t know.
" Three-quarters of Indonesians (74%) with knowledge of a democratic system believe Indonesia is a democracy. Fifteen percent say it is both democratic and non-democratic, 6% say it is not a democracy and 5% say they don’t know.
" More than half (62%) of Indonesians say religion has an influence on important political decisions they make at least to some extent (44%) or to a great extent (18%). The reported influence of religion on political decision-making has dropped from 2008. In 2008, 79% of Indonesians said religion influenced their political decisions to some extent (49%) or to a great extent (30%).
" There is a high level of satisfaction with several institutions critical to the political process in Indonesia. A majority of Indonesians are very or somewhat satisfied with the president (66%), the governor of their province (64%), the regent/mayor (62%), the police (58%), Corruption Eradication Commission (KPK) (57%), and the vice president (52%). Respondents express less satisfaction with other government institutions. Forty-nine percent are very/somewhat satisfied with the Constitutional Court, local courts (47%), Regency/City DPRD (46%), Regional Representatives Council (DPD) (45%), BPK (44%), Mahkamah Agung (43%), Attorney General (40%), and the People’s Representative Council (DPR) (36%).
" Of those aware of the various electoral institutions, there are fairly high levels of satisfaction with these institutions. Seventy-two percent say they are very/somewhat satisfied with the KPU. Confidence in the KPU has held steady compared to the 2008 survey (71%). For other electoral institutions, 71% are very/somewhat satisfied with PANWAS, 70% very/somewhat satisfied with BAWASLU, and 69% very/somewhat satisfied with Regional KPUDs. Voters are also confident that the KPUD (61%), PANWAS (60%), civil servants (63%), and TNI (78%) are able to respond neutrally without political influence in issues related to the local elections.
" A majority of Indonesians (65%) believe the results released by the KPUD reflect the actual vote, while only 9% say they do not reflect the actual votes, and 26% say they don’t know.
Knowledge and Perception of Election Procedures
" Sixty-four percent of Indonesians say somebody has come to their house in the past to check the voter registration status of their families, while 31% say nobody came to check their status, and 6% say they don’t know. Of those who say somebody came to check their registration status, 40% say it was the Head of RT (Rukun Tetangga) 25% say it was a village official, 22% say it was the election committee, 7% say it was the head of the village, and 2% say it was the Head of RW (Rukun Warga)2 It should be noted that Indonesian electoral law does not require door-to-door checking of registration status and leaves it up to the voter to verify their own registration status.
2 Rukun Tetangga (RT) represents a small neighborhood of approximately 20 households; Rukun Warga (RW) consists of several RTs..
Page 4
International Foundation for Electoral Systems
10
" Fewer respondents report themselves checking to see if their name was on the voter’s list. Forty-one percent say they have checked, 52% say they have not, and 7% say they don’t know. Of those who did not check, 24% say it is because they were optimistic that they were already registered, 11% say they have no time, 11% mention the fact they have the voting card already, and 6% say they don’t know where to go.
" When asked how they select which party to vote for, 41% report voting for different parties from election to election, while 21% say they mostly vote for the same party and 30% say they always vote for the same party. The tendency to always or mostly vote for the same party in elections is higher among older age groups (45 and older: 60%; 25-44: 48%; 18-24: 38%).
" Most voters say they vote for candidates based on personality (41%), with less citing level of experience in government (15%), past performance (11%), or a candidates’ platform (11%). Forty-one percent of respondents in each case say they are extremely unlikely to vote for a candidate who is corrupt or dishonest.
" Regarding the local elections that have been taking place this year and will take place next year, 78% of Indonesians say they do not have very much (66%) or no information at all (12%) regarding these elections.
" Specifically, voters where local elections have yet to take place report needing more information on participating political parties (73%), candidacy (73%), vote counting/how candidates are elected (72%), campaigns (67%), information on where and when to vote (65%), voting procedures/how to mark the ballot (64%), and registration (57%).
" Half of voters (50%) say they have not seen information about checking the voter’s register for the local elections, 9% say they don’t know, yet 41% say they have seen this information. Seventy-one percent of voters say they have seen information on marking the ballot, with 26% saying they have not, and 3% say they don’t know.
" In areas where elections have yet to take place, 96% of respondents were unable to cite the correct date of the elections and only 4% stated the correct date. In areas where the election is less than one month away, 75% are aware of the election date while 25% are not. The vast majority of respondents (94%) in areas with upcoming elections say they are at least somewhat likely to vote. Sixty-nine percent of respondents say they are somewhat likely and 25% say they are very likely to vote.
" TV is the most cited source of information used to learn more about local elections (37%), followed by family/friends (26%), posters/billboards/pamphlets (18%), or the Head of RT (12%). Indeed, 34% of Indonesians say advertising campaigns on TV are the most effective way to encourage them to vote, followed by talks how programs on TV/radio (12%), word of mouth (12%), religious meetings (12%), informal meetings (12%), debates among candidates (7%), or posters/banners (5%).
Election Violence
" Very few respondents (1%) in areas that had local elections report any violence surrounding the elections, 7% say they don’t know, and 92% believe there was no violence.
9
" Those who are aware of the tenets of a democracy were read three statements and asked with which one they most agree. Seventy-two percent say they prefer democracy, 20% say the type of government doesn’t matter to them, 4% say a non-democratic government is sometimes preferable, and 4% say they don’t know.
" Three-quarters of Indonesians (74%) with knowledge of a democratic system believe Indonesia is a democracy. Fifteen percent say it is both democratic and non-democratic, 6% say it is not a democracy and 5% say they don’t know.
" More than half (62%) of Indonesians say religion has an influence on important political decisions they make at least to some extent (44%) or to a great extent (18%). The reported influence of religion on political decision-making has dropped from 2008. In 2008, 79% of Indonesians said religion influenced their political decisions to some extent (49%) or to a great extent (30%).
" There is a high level of satisfaction with several institutions critical to the political process in Indonesia. A majority of Indonesians are very or somewhat satisfied with the president (66%), the governor of their province (64%), the regent/mayor (62%), the police (58%), Corruption Eradication Commission (KPK) (57%), and the vice president (52%). Respondents express less satisfaction with other government institutions. Forty-nine percent are very/somewhat satisfied with the Constitutional Court, local courts (47%), Regency/City DPRD (46%), Regional Representatives Council (DPD) (45%), BPK (44%), Mahkamah Agung (43%), Attorney General (40%), and the People’s Representative Council (DPR) (36%).
" Of those aware of the various electoral institutions, there are fairly high levels of satisfaction with these institutions. Seventy-two percent say they are very/somewhat satisfied with the KPU. Confidence in the KPU has held steady compared to the 2008 survey (71%). For other electoral institutions, 71% are very/somewhat satisfied with PANWAS, 70% very/somewhat satisfied with BAWASLU, and 69% very/somewhat satisfied with Regional KPUDs. Voters are also confident that the KPUD (61%), PANWAS (60%), civil servants (63%), and TNI (78%) are able to respond neutrally without political influence in issues related to the local elections.
" A majority of Indonesians (65%) believe the results released by the KPUD reflect the actual vote, while only 9% say they do not reflect the actual votes, and 26% say they don’t know.
Knowledge and Perception of Election Procedures
" Sixty-four percent of Indonesians say somebody has come to their house in the past to check the voter registration status of their families, while 31% say nobody came to check their status, and 6% say they don’t know. Of those who say somebody came to check their registration status, 40% say it was the Head of RT (Rukun Tetangga) 25% say it was a village official, 22% say it was the election committee, 7% say it was the head of the village, and 2% say it was the Head of RW (Rukun Warga)2 It should be noted that Indonesian electoral law does not require door-to-door checking of registration status and leaves it up to the voter to verify their own registration status.
2 Rukun Tetangga (RT) represents a small neighborhood of approximately 20 households; Rukun Warga (RW) consists of several RTs..
Page 5
Indonesia 2010 Survey Report
10
" Fewer respondents report themselves checking to see if their name was on the voter’s list. Forty-one percent say they have checked, 52% say they have not, and 7% say they don’t know. Of those who did not check, 24% say it is because they were optimistic that they were already registered, 11% say they have no time, 11% mention the fact they have the voting card already, and 6% say they don’t know where to go.
" When asked how they select which party to vote for, 41% report voting for different parties from election to election, while 21% say they mostly vote for the same party and 30% say they always vote for the same party. The tendency to always or mostly vote for the same party in elections is higher among older age groups (45 and older: 60%; 25-44: 48%; 18-24: 38%).
" Most voters say they vote for candidates based on personality (41%), with less citing level of experience in government (15%), past performance (11%), or a candidates’ platform (11%). Forty-one percent of respondents in each case say they are extremely unlikely to vote for a candidate who is corrupt or dishonest.
" Regarding the local elections that have been taking place this year and will take place next year, 78% of Indonesians say they do not have very much (66%) or no information at all (12%) regarding these elections.
" Specifically, voters where local elections have yet to take place report needing more information on participating political parties (73%), candidacy (73%), vote counting/how candidates are elected (72%), campaigns (67%), information on where and when to vote (65%), voting procedures/how to mark the ballot (64%), and registration (57%).
" Half of voters (50%) say they have not seen information about checking the voter’s register for the local elections, 9% say they don’t know, yet 41% say they have seen this information. Seventy-one percent of voters say they have seen information on marking the ballot, with 26% saying they have not, and 3% say they don’t know.
" In areas where elections have yet to take place, 96% of respondents were unable to cite the correct date of the elections and only 4% stated the correct date. In areas where the election is less than one month away, 75% are aware of the election date while 25% are not. The vast majority of respondents (94%) in areas with upcoming elections say they are at least somewhat likely to vote. Sixty-nine percent of respondents say they are somewhat likely and 25% say they are very likely to vote.
" TV is the most cited source of information used to learn more about local elections (37%), followed by family/friends (26%), posters/billboards/pamphlets (18%), or the Head of RT (12%). Indeed, 34% of Indonesians say advertising campaigns on TV are the most effective way to encourage them to vote, followed by talks how programs on TV/radio (12%), word of mouth (12%), religious meetings (12%), informal meetings (12%), debates among candidates (7%), or posters/banners (5%).
Election Violence
" Very few respondents (1%) in areas that had local elections report any violence surrounding the elections, 7% say they don’t know, and 92% believe there was no violence.
9
" Those who are aware of the tenets of a democracy were read three statements and asked with which one they most agree. Seventy-two percent say they prefer democracy, 20% say the type of government doesn’t matter to them, 4% say a non-democratic government is sometimes preferable, and 4% say they don’t know.
" Three-quarters of Indonesians (74%) with knowledge of a democratic system believe Indonesia is a democracy. Fifteen percent say it is both democratic and non-democratic, 6% say it is not a democracy and 5% say they don’t know.
" More than half (62%) of Indonesians say religion has an influence on important political decisions they make at least to some extent (44%) or to a great extent (18%). The reported influence of religion on political decision-making has dropped from 2008. In 2008, 79% of Indonesians said religion influenced their political decisions to some extent (49%) or to a great extent (30%).
" There is a high level of satisfaction with several institutions critical to the political process in Indonesia. A majority of Indonesians are very or somewhat satisfied with the president (66%), the governor of their province (64%), the regent/mayor (62%), the police (58%), Corruption Eradication Commission (KPK) (57%), and the vice president (52%). Respondents express less satisfaction with other government institutions. Forty-nine percent are very/somewhat satisfied with the Constitutional Court, local courts (47%), Regency/City DPRD (46%), Regional Representatives Council (DPD) (45%), BPK (44%), Mahkamah Agung (43%), Attorney General (40%), and the People’s Representative Council (DPR) (36%).
" Of those aware of the various electoral institutions, there are fairly high levels of satisfaction with these institutions. Seventy-two percent say they are very/somewhat satisfied with the KPU. Confidence in the KPU has held steady compared to the 2008 survey (71%). For other electoral institutions, 71% are very/somewhat satisfied with PANWAS, 70% very/somewhat satisfied with BAWASLU, and 69% very/somewhat satisfied with Regional KPUDs. Voters are also confident that the KPUD (61%), PANWAS (60%), civil servants (63%), and TNI (78%) are able to respond neutrally without political influence in issues related to the local elections.
" A majority of Indonesians (65%) believe the results released by the KPUD reflect the actual vote, while only 9% say they do not reflect the actual votes, and 26% say they don’t know.
Knowledge and Perception of Election Procedures
" Sixty-four percent of Indonesians say somebody has come to their house in the past to check the voter registration status of their families, while 31% say nobody came to check their status, and 6% say they don’t know. Of those who say somebody came to check their registration status, 40% say it was the Head of RT (Rukun Tetangga) 25% say it was a village official, 22% say it was the election committee, 7% say it was the head of the village, and 2% say it was the Head of RW (Rukun Warga)2 It should be noted that Indonesian electoral law does not require door-to-door checking of registration status and leaves it up to the voter to verify their own registration status.
2 Rukun Tetangga (RT) represents a small neighborhood of approximately 20 households; Rukun Warga (RW) consists of several RTs..
Page 6
International Foundation for Electoral Systems
12
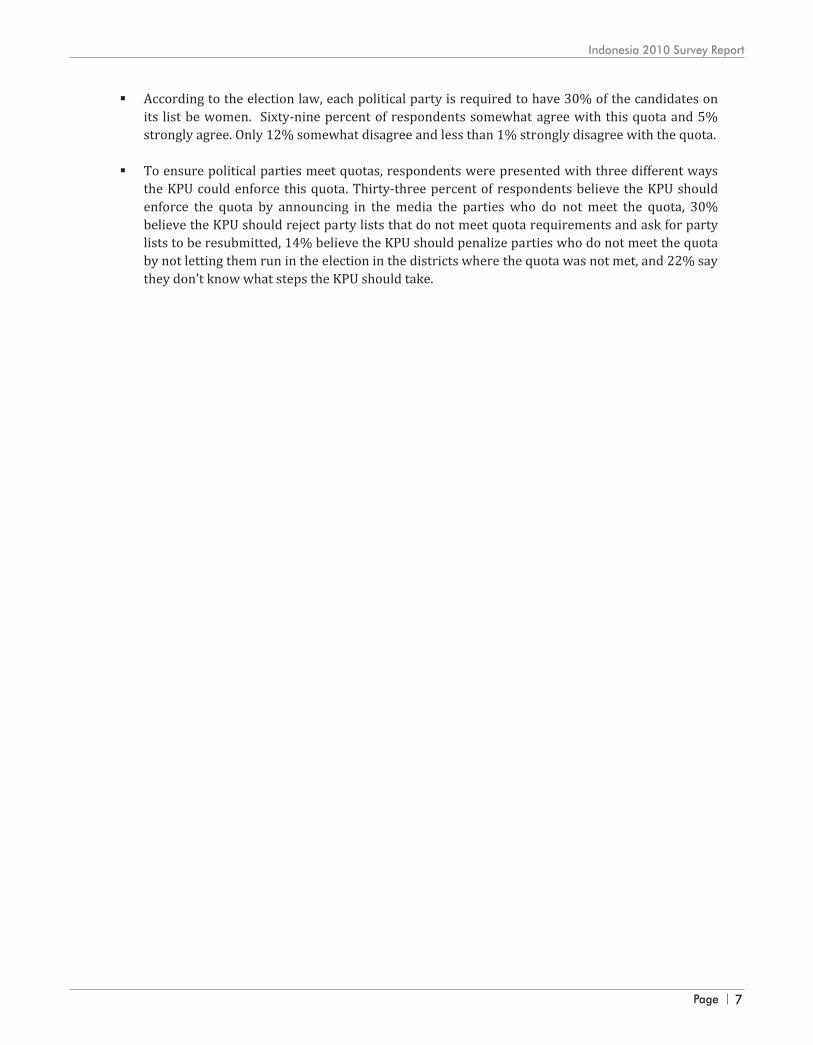
" According to the election law, each political party is required to have 30% of the candidates on its list be women. Sixty-nine percent of respondents somewhat agree with this quota and 5% strongly agree. Only 12% somewhat disagree and less than 1% strongly disagree with the quota.
" To ensure political parties meet quotas, respondents were presented with three different ways the KPU could enforce this quota. Thirty-three percent of respondents believe the KPU should enforce the quota by announcing in the media the parties who do not meet the quota, 30% believe the KPU should reject party lists that do not meet quota requirements and ask for party lists to be resubmitted, 14% believe the KPU should penalize parties who do not meet the quota by not letting them run in the election in the districts where the quota was not met, and 22% say they don’t know what steps the KPU should take.
11
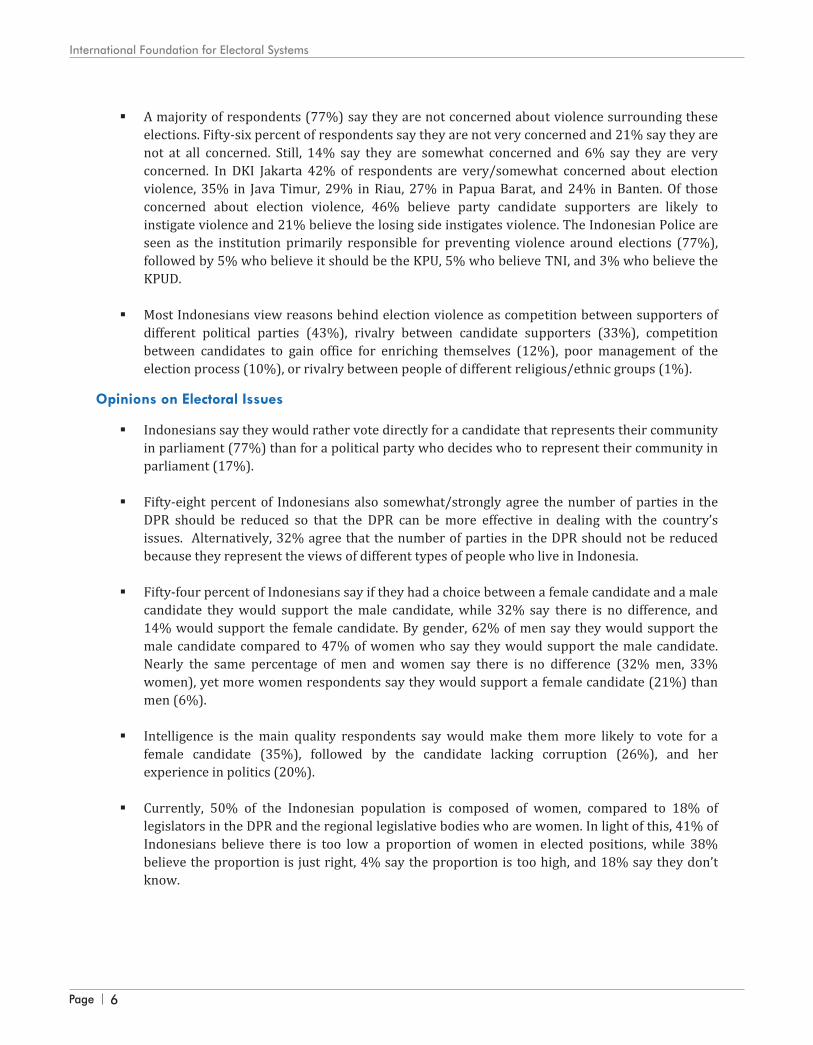
" A majority of respondents (77%) say they are not concerned about violence surrounding these
elections. Fifty-six percent of respondents say they are not very concerned and 21% say they are not at all concerned. Still, 14% say they are somewhat concerned and 6% say they are very concerned. In DKI Jakarta 42% of respondents are very/somewhat concerned about election violence, 35% in Java Timur, 29% in Riau, 27% in Papua Barat, and 24% in Banten. Of those concerned about election violence, 46% believe party candidate supporters are likely to instigate violence and 21% believe the losing side instigates violence. The Indonesian Police are seen as the institution primarily responsible for preventing violence around elections (77%), followed by 5% who believe it should be the KPU, 5% who believe TNI, and 3% who believe the KPUD.
" Most Indonesians view reasons behind election violence as competition between supporters of different political parties (43%), rivalry between candidate supporters (33%), competition between candidates to gain office for enriching themselves (12%), poor management of the election process (10%), or rivalry between people of different religious/ethnic groups (1%).
Opinions on Electoral Issues
" Indonesians say they would rather vote directly for a candidate that represents their community in parliament (77%) than for a political party who decides who to represent their community in parliament (17%).
" Fifty-eight percent of Indonesians also somewhat/strongly agree the number of parties in the DPR should be reduced so that the DPR can be more effective in dealing with the country’s issues. Alternatively, 32% agree that the number of parties in the DPR should not be reduced because they represent the views of different types of people who live in Indonesia.
" Fifty-four percent of Indonesians say if they had a choice between a female candidate and a male candidate they would support the male candidate, while 32% say there is no difference, and 14% would support the female candidate. By gender, 62% of men say they would support the male candidate compared to 47% of women who say they would support the male candidate. Nearly the same percentage of men and women say there is no difference (32% men, 33% women), yet more women respondents say they would support a female candidate (21%) than men (6%).
" Intelligence is the main quality respondents say would make them more likely to vote for a female candidate (35%), followed by the candidate lacking corruption (26%), and her experience in politics (20%).
" Currently, 50% of the Indonesian population is composed of women, compared to 18% of legislators in the DPR and the regional legislative bodies who are women. In light of this, 41% of Indonesians believe there is too low a proportion of women in elected positions, while 38% believe the proportion is just right, 4% say the proportion is too high, and 18% say they don’t know.
Page 7
Indonesia 2010 Survey Report
12
" According to the election law, each political party is required to have 30% of the candidates on its list be women. Sixty-nine percent of respondents somewhat agree with this quota and 5% strongly agree. Only 12% somewhat disagree and less than 1% strongly disagree with the quota.
" To ensure political parties meet quotas, respondents were presented with three different ways the KPU could enforce this quota. Thirty-three percent of respondents believe the KPU should enforce the quota by announcing in the media the parties who do not meet the quota, 30% believe the KPU should reject party lists that do not meet quota requirements and ask for party lists to be resubmitted, 14% believe the KPU should penalize parties who do not meet the quota by not letting them run in the election in the districts where the quota was not met, and 22% say they don’t know what steps the KPU should take.
11
" A majority of respondents (77%) say they are not concerned about violence surrounding these
elections. Fifty-six percent of respondents say they are not very concerned and 21% say they are not at all concerned. Still, 14% say they are somewhat concerned and 6% say they are very concerned. In DKI Jakarta 42% of respondents are very/somewhat concerned about election violence, 35% in Java Timur, 29% in Riau, 27% in Papua Barat, and 24% in Banten. Of those concerned about election violence, 46% believe party candidate supporters are likely to instigate violence and 21% believe the losing side instigates violence. The Indonesian Police are seen as the institution primarily responsible for preventing violence around elections (77%), followed by 5% who believe it should be the KPU, 5% who believe TNI, and 3% who believe the KPUD.
" Most Indonesians view reasons behind election violence as competition between supporters of different political parties (43%), rivalry between candidate supporters (33%), competition between candidates to gain office for enriching themselves (12%), poor management of the election process (10%), or rivalry between people of different religious/ethnic groups (1%).
Opinions on Electoral Issues
" Indonesians say they would rather vote directly for a candidate that represents their community in parliament (77%) than for a political party who decides who to represent their community in parliament (17%).
" Fifty-eight percent of Indonesians also somewhat/strongly agree the number of parties in the DPR should be reduced so that the DPR can be more effective in dealing with the country’s issues. Alternatively, 32% agree that the number of parties in the DPR should not be reduced because they represent the views of different types of people who live in Indonesia.
" Fifty-four percent of Indonesians say if they had a choice between a female candidate and a male candidate they would support the male candidate, while 32% say there is no difference, and 14% would support the female candidate. By gender, 62% of men say they would support the male candidate compared to 47% of women who say they would support the male candidate. Nearly the same percentage of men and women say there is no difference (32% men, 33% women), yet more women respondents say they would support a female candidate (21%) than men (6%).
" Intelligence is the main quality respondents say would make them more likely to vote for a female candidate (35%), followed by the candidate lacking corruption (26%), and her experience in politics (20%).
" Currently, 50% of the Indonesian population is composed of women, compared to 18% of legislators in the DPR and the regional legislative bodies who are women. In light of this, 41% of Indonesians believe there is too low a proportion of women in elected positions, while 38% believe the proportion is just right, 4% say the proportion is too high, and 18% say they don’t know.
Page 6
International Foundation for Electoral Systems
12
" According to the election law, each political party is required to have 30% of the candidates on its list be women. Sixty-nine percent of respondents somewhat agree with this quota and 5% strongly agree. Only 12% somewhat disagree and less than 1% strongly disagree with the quota.
" To ensure political parties meet quotas, respondents were presented with three different ways the KPU could enforce this quota. Thirty-three percent of respondents believe the KPU should enforce the quota by announcing in the media the parties who do not meet the quota, 30% believe the KPU should reject party lists that do not meet quota requirements and ask for party lists to be resubmitted, 14% believe the KPU should penalize parties who do not meet the quota by not letting them run in the election in the districts where the quota was not met, and 22% say they don’t know what steps the KPU should take.
11
" A majority of respondents (77%) say they are not concerned about violence surrounding these
elections. Fifty-six percent of respondents say they are not very concerned and 21% say they are not at all concerned. Still, 14% say they are somewhat concerned and 6% say they are very concerned. In DKI Jakarta 42% of respondents are very/somewhat concerned about election violence, 35% in Java Timur, 29% in Riau, 27% in Papua Barat, and 24% in Banten. Of those concerned about election violence, 46% believe party candidate supporters are likely to instigate violence and 21% believe the losing side instigates violence. The Indonesian Police are seen as the institution primarily responsible for preventing violence around elections (77%), followed by 5% who believe it should be the KPU, 5% who believe TNI, and 3% who believe the KPUD.
" Most Indonesians view reasons behind election violence as competition between supporters of different political parties (43%), rivalry between candidate supporters (33%), competition between candidates to gain office for enriching themselves (12%), poor management of the election process (10%), or rivalry between people of different religious/ethnic groups (1%).
Opinions on Electoral Issues
" Indonesians say they would rather vote directly for a candidate that represents their community in parliament (77%) than for a political party who decides who to represent their community in parliament (17%).
" Fifty-eight percent of Indonesians also somewhat/strongly agree the number of parties in the DPR should be reduced so that the DPR can be more effective in dealing with the country’s issues. Alternatively, 32% agree that the number of parties in the DPR should not be reduced because they represent the views of different types of people who live in Indonesia.
" Fifty-four percent of Indonesians say if they had a choice between a female candidate and a male candidate they would support the male candidate, while 32% say there is no difference, and 14% would support the female candidate. By gender, 62% of men say they would support the male candidate compared to 47% of women who say they would support the male candidate. Nearly the same percentage of men and women say there is no difference (32% men, 33% women), yet more women respondents say they would support a female candidate (21%) than men (6%).
" Intelligence is the main quality respondents say would make them more likely to vote for a female candidate (35%), followed by the candidate lacking corruption (26%), and her experience in politics (20%).
" Currently, 50% of the Indonesian population is composed of women, compared to 18% of legislators in the DPR and the regional legislative bodies who are women. In light of this, 41% of Indonesians believe there is too low a proportion of women in elected positions, while 38% believe the proportion is just right, 4% say the proportion is too high, and 18% say they don’t know.
Page 7
Indonesia 2010 Survey Report
12
" According to the election law, each political party is required to have 30% of the candidates on its list be women. Sixty-nine percent of respondents somewhat agree with this quota and 5% strongly agree. Only 12% somewhat disagree and less than 1% strongly disagree with the quota.
" To ensure political parties meet quotas, respondents were presented with three different ways the KPU could enforce this quota. Thirty-three percent of respondents believe the KPU should enforce the quota by announcing in the media the parties who do not meet the quota, 30% believe the KPU should reject party lists that do not meet quota requirements and ask for party lists to be resubmitted, 14% believe the KPU should penalize parties who do not meet the quota by not letting them run in the election in the districts where the quota was not met, and 22% say they don’t know what steps the KPU should take.
11
" A majority of respondents (77%) say they are not concerned about violence surrounding these
elections. Fifty-six percent of respondents say they are not very concerned and 21% say they are not at all concerned. Still, 14% say they are somewhat concerned and 6% say they are very concerned. In DKI Jakarta 42% of respondents are very/somewhat concerned about election violence, 35% in Java Timur, 29% in Riau, 27% in Papua Barat, and 24% in Banten. Of those concerned about election violence, 46% believe party candidate supporters are likely to instigate violence and 21% believe the losing side instigates violence. The Indonesian Police are seen as the institution primarily responsible for preventing violence around elections (77%), followed by 5% who believe it should be the KPU, 5% who believe TNI, and 3% who believe the KPUD.
" Most Indonesians view reasons behind election violence as competition between supporters of different political parties (43%), rivalry between candidate supporters (33%), competition between candidates to gain office for enriching themselves (12%), poor management of the election process (10%), or rivalry between people of different religious/ethnic groups (1%).
Opinions on Electoral Issues
" Indonesians say they would rather vote directly for a candidate that represents their community in parliament (77%) than for a political party who decides who to represent their community in parliament (17%).
" Fifty-eight percent of Indonesians also somewhat/strongly agree the number of parties in the DPR should be reduced so that the DPR can be more effective in dealing with the country’s issues. Alternatively, 32% agree that the number of parties in the DPR should not be reduced because they represent the views of different types of people who live in Indonesia.
" Fifty-four percent of Indonesians say if they had a choice between a female candidate and a male candidate they would support the male candidate, while 32% say there is no difference, and 14% would support the female candidate. By gender, 62% of men say they would support the male candidate compared to 47% of women who say they would support the male candidate. Nearly the same percentage of men and women say there is no difference (32% men, 33% women), yet more women respondents say they would support a female candidate (21%) than men (6%).
" Intelligence is the main quality respondents say would make them more likely to vote for a female candidate (35%), followed by the candidate lacking corruption (26%), and her experience in politics (20%).
" Currently, 50% of the Indonesian population is composed of women, compared to 18% of legislators in the DPR and the regional legislative bodies who are women. In light of this, 41% of Indonesians believe there is too low a proportion of women in elected positions, while 38% believe the proportion is just right, 4% say the proportion is too high, and 18% say they don’t know.
Page 8
International Foundation for Electoral Systems
14
I. Opinions on Socio-Economic Situation and Political Institutions in Indonesia
While most Indonesians believe that the country is headed in the right direction, the vast majority of Indonesians also express concern about the economic situation in the country. Economic concerns top the list of perceived greatest problems impacting Indonesia. Still, Indonesians are likely to express satisfaction with many of the prominent political institutions in the country, with two-thirds expressing satisfaction with President Yudhoyono. Despite weaknesses observed by election specialists and significant press coverage of electoral problems, there remains a high level of satisfaction with electoral institutions in the country, and a general belief that local-level electoral institutions ensure the integrity of the electoral process for local elections.
Assessment of Direction of Country, Indonesian Economy, and Problems Facing Indonesians
The IFES 2010 survey finds that a majority of Indonesians believe the country is generally headed in the right direction (59%), while one quarter of Indonesians (25%) believe the country is going in the wrong direction and 16% say they don’t know. With the exception of residents of East Java and the Malukus, a majority of residents of other regions believe that the country is headed in the right direction (Figure 1).
In East Java, nearly as many respondents believe the country is headed in the wrong direction as the percentage who believe it is headed in the right direction (40% versus 45%). Western Java is another region where a significant percentage of respondents believe that Indonesia is headed in the wrong direction (33%). Positive opinions on the country’s direction are broadly held as majorities in the major demographic sub-groups based on education, age, socio-economic status, and gender believe that the country is headed in the right direction.
59% 52%65%
45%67% 61% 57%
89%
42%
65%
16%15%
16%
15%
16% 21% 23%
7%
40%
20%
25%33%
19%40%
17% 18% 20%
4%
18% 15%
Figure 1: Direction of the Country
Wrong direction
DK/NR
Right direction
13
Survey Details Sample size: 2,500 respondents representing the voting-age population in Indonesia (17 years+). Margin of error: ± 2% within a 95% confidence interval. Sample area coverage: Nationwide coverage; 2,500 observations were allocated proportionately to the regional distribution of the Indonesian population. One hundred oversample interviews were conducted in Papua and West Papua to ensure enough interviews in these two provinces for provincial level analysis. Weights: Following data collection, the data was weighted by province, age, and socio-economic status to bring the realized sample in line with the actual regional distribution of the target adult (17+) population of Indonesia. Fieldwork dates: August 20 to 27, 2010. Survey firm: IFES contracted Polling Center to conduct fieldwork and data processing for the survey. Funding: Funding for the survey was provided by the Australian Agency for International Development (AUSAID).
Charts
For charts and tables where percentages are based on filtered respondents or certain demographic groups, the appropriate unweighted sample base for each percentage is specified in the relevant chart or table (example: n=456). For all other charts or where not otherwise specified, the sample base is the total sample size of 2,500 (n=2,500). There may be slight variation between numbers presented in the analysis and the data figures or tables due to rounding. These are only a few cases and the difference is never greater than one percent.
Regional Breakdowns
When looking at responses broken down by region, broader geographic regions represent groupings of provinces as follows: Sumatra region = Nanggroe Aceh D. + North Sumatera + South Sumatera provinces; Jakarata-Banten region = Jakarta + Banten provinces; West Java region = West Java province; Central Java region = Central Java + D.I. Yogyakarta provinces; East Java region = East Java province; Bali-ENT region = Bali + East Nusa Tenggara provinces; Kalimantan region = Central Kalimantan + South Kalimantan + East Kalimantan provinces; Sulawesi region = Gorontalo + Central Sulawesi + South Sulawesi provinces; Maluku = Maluku + Maluku Utara; Papua region = Papua + Papua Barat provinces.
August-September 2008 survey
IFES conducted another survey in Indonesia during August and September 2008 and results from this survey are sometimes used to compare to findings. The sample size for the September 2008 survey was nationally representative at n=2,500 and funding was also provided by AUSAID.
Page 9
Indonesia 2010 Survey Report
14
I. Opinions on Socio-Economic Situation and Political Institutions in Indonesia
While most Indonesians believe that the country is headed in the right direction, the vast majority of Indonesians also express concern about the economic situation in the country. Economic concerns top the list of perceived greatest problems impacting Indonesia. Still, Indonesians are likely to express satisfaction with many of the prominent political institutions in the country, with two-thirds expressing satisfaction with President Yudhoyono. Despite weaknesses observed by election specialists and significant press coverage of electoral problems, there remains a high level of satisfaction with electoral institutions in the country, and a general belief that local-level electoral institutions ensure the integrity of the electoral process for local elections.
Assessment of Direction of Country, Indonesian Economy, and Problems Facing Indonesians
The IFES 2010 survey finds that a majority of Indonesians believe the country is generally headed in the right direction (59%), while one quarter of Indonesians (25%) believe the country is going in the wrong direction and 16% say they don’t know. With the exception of residents of East Java and the Malukus, a majority of residents of other regions believe that the country is headed in the right direction (Figure 1).
In East Java, nearly as many respondents believe the country is headed in the wrong direction as the percentage who believe it is headed in the right direction (40% versus 45%). Western Java is another region where a significant percentage of respondents believe that Indonesia is headed in the wrong direction (33%). Positive opinions on the country’s direction are broadly held as majorities in the major demographic sub-groups based on education, age, socio-economic status, and gender believe that the country is headed in the right direction.
59% 52%65%
45%67% 61% 57%
89%
42%
65%
16%15%
16%
15%
16% 21% 23%
7%
40%
20%
25%33%
19%40%
17% 18% 20%
4%
18% 15%
Figure 1: Direction of the Country
Wrong direction
DK/NR
Right direction
13
Survey Details Sample size: 2,500 respondents representing the voting-age population in Indonesia (17 years+). Margin of error: ± 2% within a 95% confidence interval. Sample area coverage: Nationwide coverage; 2,500 observations were allocated proportionately to the regional distribution of the Indonesian population. One hundred oversample interviews were conducted in Papua and West Papua to ensure enough interviews in these two provinces for provincial level analysis. Weights: Following data collection, the data was weighted by province, age, and socio-economic status to bring the realized sample in line with the actual regional distribution of the target adult (17+) population of Indonesia. Fieldwork dates: August 20 to 27, 2010. Survey firm: IFES contracted Polling Center to conduct fieldwork and data processing for the survey. Funding: Funding for the survey was provided by the Australian Agency for International Development (AUSAID).
Charts
For charts and tables where percentages are based on filtered respondents or certain demographic groups, the appropriate unweighted sample base for each percentage is specified in the relevant chart or table (example: n=456). For all other charts or where not otherwise specified, the sample base is the total sample size of 2,500 (n=2,500). There may be slight variation between numbers presented in the analysis and the data figures or tables due to rounding. These are only a few cases and the difference is never greater than one percent.
Regional Breakdowns
When looking at responses broken down by region, broader geographic regions represent groupings of provinces as follows: Sumatra region = Nanggroe Aceh D. + North Sumatera + South Sumatera provinces; Jakarata-Banten region = Jakarta + Banten provinces; West Java region = West Java province; Central Java region = Central Java + D.I. Yogyakarta provinces; East Java region = East Java province; Bali-ENT region = Bali + East Nusa Tenggara provinces; Kalimantan region = Central Kalimantan + South Kalimantan + East Kalimantan provinces; Sulawesi region = Gorontalo + Central Sulawesi + South Sulawesi provinces; Maluku = Maluku + Maluku Utara; Papua region = Papua + Papua Barat provinces.
August-September 2008 survey
IFES conducted another survey in Indonesia during August and September 2008 and results from this survey are sometimes used to compare to findings. The sample size for the September 2008 survey was nationally representative at n=2,500 and funding was also provided by AUSAID.

Page 10
International Foundation for Electoral Systems
16
Figure 4: “In your opinion, what is currently the greatest problem being faced by Indonesians?” (TREND) Percentages reflect percent of cases.
2003
(n=3,000) 2005
(n=2,020) 2008
(n=2,500) 2010
(n=2,500)
Increased price of basic needs 54% 59% 81% 60%
Jobs/work -- 26% 2% 18%
Law uncertainty/Less enforcement/Lack of security
23% 7% 7% 7%
Education -- -- -- 5%
Health -- -- -- 4%
Political Uncertainty 13% 2% 4% 2%
Ethnic, religious and race-based conflicts 6% 2% 2% < 1%
Awareness and Assessment of Government Institutions
Respondents were asked whether they are aware or not aware of various government institutions. The data shows there is a fairly high level of awareness of most institutions with 99% of Indonesians saying they are aware of the President, 99% of the police, 98% of TNI, 97% of the Vice President, 97% of their Regent/Mayor, 93% of the Governor of their province, 83% of the People’s Representative Council (DPR), 72% of the Corruption Eradication Commission (KPK), 72% of the Regency/City DPRD, 68% of the Provincial DPRD, 60% of the Attorney General, 57% of Mahkamah Agung (Supreme Court), 65% of local courts, 54% of the Regional Representatives Council (DPD), and 49% of the State Audit Authority (BPK). The Constitutional Court is the one institution of which less than half of Indonesians are aware (34%). In Papua and West Papua provinces, 51% of residents are aware of the Papuan Peoples Council. Of those aware of these institutions, over half of respondents say they are very or somewhat satisfied with the TNI (79%), President Yudhoyono (66%), the Governor of their province (62%), the Regent/Mayor (62%), the police (58%), the Corruption Eradication Commission (KPK) (57%), and the Vice President (52%). Less than half of respondents are very/somewhat satisfied with the remaining institutions: the Constitutional Court (49%), local courts (47%), Regency/City DPRD (46%), Regional Representatives Council (DPD) (45%), Statue Audit Authority (BPK) (44%), Provincial DPRD (43%), Makamah Agung (43%), Attorney General (40%), and the Peoples Representative Council (DPR) (36%) (Figure 5).
15
A majority have positive opinions on the direction of the country despite the fact that most Indonesians have a negative evaluation of the country’s current economic situation. When asked to assess the current economic situation in Indonesia, nearly seven in ten respondents classify it as either somewhat bad (56%) or very bad (11%) compared to the minority who believe it is somewhat good (29%) or very good (1%). Nevertheless, the trend on this question is positive as fewer Indonesians in the 2010 survey say the economy is very or somewhat bad than in 2008 (67% and 80%, respectively) and the percentage of Indonesians rating the economy very or somewhat good has increased from 17% in 2008 to 30% in
2010 (Figures 2 and 3).
The majority of Indonesians in all socio-economic status (SES) categories believe that the economic situation is bad or very bad. This opinion is also held in most regions of Indonesia with the exception of those in Kalimantan and Sulawesi. The importance of the economic situation in the country is indicated by the large number of mentions of economic issues as the greatest problem being faced by Indonesians in 2010. This continues a trend seen in previous IFES survey in Indonesia (Figure 4). Inflation continues to be respondents’ overriding concern with 60% mentioning this as the greatest problem facing Indonesians. Yet, inflation is less of a concern than in the September 2008 IFES survey when it was mentioned by 81% of respondents. A significantly greater percentage of Indonesians in 2010 consider jobs and work as a greater problem facing Indonesia (18%) than in the 2008 survey (2%). Other problems mentioned include law uncertainty/less enforcement/lack of security (7%), followed by education (5%), health (4%), political uncertainty (2%), and ethnic, religious and race-based conflicts (less than 1%). Of these, health and education are issues that are appearing for the first time since this question was first asked in the 2003 survey with a significant percentage of mentions on the list of greatest problems facing Indonesia.
Very good; 1%
S/w good; 29%
S/w bad; 56%
Very bad; 11%
DK/NR; 4%
Figure 3: 2010 Current Economic Situation in Indonesia
Very good; 1%
S/w good; 16%
S/w bad; 67%
Very bad; 13%
DK/NR; 4%
Figure 2: 2008 Current Economic Situation in Indonesia
Page 11
Indonesia 2010 Survey Report
16
Figure 4: “In your opinion, what is currently the greatest problem being faced by Indonesians?” (TREND) Percentages reflect percent of cases.
2003
(n=3,000) 2005
(n=2,020) 2008
(n=2,500) 2010
(n=2,500)
Increased price of basic needs 54% 59% 81% 60%
Jobs/work -- 26% 2% 18%
Law uncertainty/Less enforcement/Lack of security
23% 7% 7% 7%
Education -- -- -- 5%
Health -- -- -- 4%
Political Uncertainty 13% 2% 4% 2%
Ethnic, religious and race-based conflicts 6% 2% 2% < 1%
Awareness and Assessment of Government Institutions
Respondents were asked whether they are aware or not aware of various government institutions. The data shows there is a fairly high level of awareness of most institutions with 99% of Indonesians saying they are aware of the President, 99% of the police, 98% of TNI, 97% of the Vice President, 97% of their Regent/Mayor, 93% of the Governor of their province, 83% of the People’s Representative Council (DPR), 72% of the Corruption Eradication Commission (KPK), 72% of the Regency/City DPRD, 68% of the Provincial DPRD, 60% of the Attorney General, 57% of Mahkamah Agung (Supreme Court), 65% of local courts, 54% of the Regional Representatives Council (DPD), and 49% of the State Audit Authority (BPK). The Constitutional Court is the one institution of which less than half of Indonesians are aware (34%). In Papua and West Papua provinces, 51% of residents are aware of the Papuan Peoples Council. Of those aware of these institutions, over half of respondents say they are very or somewhat satisfied with the TNI (79%), President Yudhoyono (66%), the Governor of their province (62%), the Regent/Mayor (62%), the police (58%), the Corruption Eradication Commission (KPK) (57%), and the Vice President (52%). Less than half of respondents are very/somewhat satisfied with the remaining institutions: the Constitutional Court (49%), local courts (47%), Regency/City DPRD (46%), Regional Representatives Council (DPD) (45%), Statue Audit Authority (BPK) (44%), Provincial DPRD (43%), Makamah Agung (43%), Attorney General (40%), and the Peoples Representative Council (DPR) (36%) (Figure 5).
15
A majority have positive opinions on the direction of the country despite the fact that most Indonesians have a negative evaluation of the country’s current economic situation. When asked to assess the current economic situation in Indonesia, nearly seven in ten respondents classify it as either somewhat bad (56%) or very bad (11%) compared to the minority who believe it is somewhat good (29%) or very good (1%). Nevertheless, the trend on this question is positive as fewer Indonesians in the 2010 survey say the economy is very or somewhat bad than in 2008 (67% and 80%, respectively) and the percentage of Indonesians rating the economy very or somewhat good has increased from 17% in 2008 to 30% in
2010 (Figures 2 and 3).
The majority of Indonesians in all socio-economic status (SES) categories believe that the economic situation is bad or very bad. This opinion is also held in most regions of Indonesia with the exception of those in Kalimantan and Sulawesi. The importance of the economic situation in the country is indicated by the large number of mentions of economic issues as the greatest problem being faced by Indonesians in 2010. This continues a trend seen in previous IFES survey in Indonesia (Figure 4). Inflation continues to be respondents’ overriding concern with 60% mentioning this as the greatest problem facing Indonesians. Yet, inflation is less of a concern than in the September 2008 IFES survey when it was mentioned by 81% of respondents. A significantly greater percentage of Indonesians in 2010 consider jobs and work as a greater problem facing Indonesia (18%) than in the 2008 survey (2%). Other problems mentioned include law uncertainty/less enforcement/lack of security (7%), followed by education (5%), health (4%), political uncertainty (2%), and ethnic, religious and race-based conflicts (less than 1%). Of these, health and education are issues that are appearing for the first time since this question was first asked in the 2003 survey with a significant percentage of mentions on the list of greatest problems facing Indonesia.
Very good; 1%
S/w good; 29%
S/w bad; 56%
Very bad; 11%
DK/NR; 4%
Figure 3: 2010 Current Economic Situation in Indonesia
Very good; 1%
S/w good; 16%
S/w bad; 67%
Very bad; 13%
DK/NR; 4%
Figure 2: 2008 Current Economic Situation in Indonesia

Page 12
International Foundation for Electoral Systems
18
Satisfaction with electoral institutions could be one reason that most Indonesians believe in the integrity of the local election process currently underway in Indonesia. When asked whether the results announced by regional KPUDs reflect the way people actually vote in elections, the majority of Indonesians (65%) say they are confident that the results released by the KPUD for the local elections reflects the way people actually vote in the elections, while 9% believe they do not reflect the actual vote, and 26% say they don’t know (Figure 7). It should be no surprise that respondents who are satisfied with the regional KPUDs are much more likely to say that results reflect the actual vote (80%) than those who are dissatisfied with the KPUDs (54%). The fact that even a majority of those dissatisfied with the KPUDs believe that the results announced by these bodies reflect the vote is a positive indication fraudulent election results is not a primary reason for dissatisfaction with KPUDs. Still focusing on the ongoing local elections, the majority of Indonesians also believe that institutional actors including the KPUDs that are responsible to some extent for the organization of these elections can be expected to perform their duties in a neutral manner without political interference. Respondents believe that the TNI (78%), the police (74%), civil servants (63%), KPUD (61%), and PANWAS (60%) are able to respond neutrally to election issues. Only a small percentage of respondents in each case believe that these institutions do not act in a neutral manner, and sizeable percentages of respondents say they don’t know about the neutrality of these groups (Figure 8).
69%
69%
71%
72%
10%
11%
9%
9%
21%
20%
20%
19%
Regional KPUDs (66% aware)
BAWASLU (60% aware)
PANWAS (63% aware)
KPU (83% aware)
Figure 6: Satisfied/Dissatisfied with Electoral Institutions? (asked of those aware of institutions)
Very/Somewhat Satisfied DK/NR Very/Somewhat Dissatisfied
Yes, 65%
DK/NR, 26%
No, 9%
Figure 7: Confidence that Results Releasted by KPUD Reflect Actual Vote
17
There are several notable patterns in satisfaction levels with these institutions. Local institutions and leaders, with the exception of President Yudhoyono, generally elicit higher satisfaction than their counterparts at the national level. Leaders at the executive level generally elicit higher satisfaction than legislative bodies at the same level. A majority of respondents in all regions of Indonesia say they are very or somewhat satisfied with the performance of President Yudhoyono. Eighty-one percent of respondents in Kalimantan and Papua express satisfaction with the President while this figure is 67% in East Java, 61% in the western part of Java, and 60% in Central Java.
Satisfaction with Electoral Institutions
When asked about awareness and satisfaction with electoral institutions, 83% of Indonesians are aware of the KPU, 66% are aware of Regional KPUDs, 63% are aware of PANWAS, and 60% are aware of BAWASLU. Majorities of those aware of these electoral institutions are very/somewhat satisfied with them. Seventy-two percent of respondents are satisfied with the KPU, 71% are satisfied with PANWAS, 69% are satisfied with BAWASLU, and 69% are satisfied with the Regional KPUDs (Figure 6).
36%
40%
43%
43%
44%
45%
46%
47%
49%
52%
57%
58%
62%
62%
66%
79%
10%
20%
21%
16%
20%
18%
12%
20%
22%
7%
9%
4%
8%
9%
4%
5%
53%
42%
36%
41%
36%
37%
42%
35%
29%
41%
34%
39%
31%
27%
30%
16%
Peoples Representative Council (DPR) (n=2,085)
Attorney General (n=1,504)
Mahkamah Agung (1,417)
Provincial DPRD (n=1,702)
State Audit Authority (BPK) (n=1,280)
Regional Representatives Council (DPD) (n=1,359)
Regency/City DPRD (n=1,788)
Local courts (n=1,619)
Constitutional Court (n=843)
The Vice President (n=2,412)
Corruption Eradication Commission (KPK) …
The police (n=2,475)
Regent/Mayor (n=2,430)
Governor of this province (n=2,325)
The President (n=2,485)
TNI (n=2,445)
Figure 5: Satisfied/Dissatisfied with Institutions? (asked of those aware of institutions)
Very/Somewhat Satisfied DK/NR Very/Somewhat Dissatisfied
Page 13
Indonesia 2010 Survey Report
18
Satisfaction with electoral institutions could be one reason that most Indonesians believe in the integrity of the local election process currently underway in Indonesia. When asked whether the results announced by regional KPUDs reflect the way people actually vote in elections, the majority of Indonesians (65%) say they are confident that the results released by the KPUD for the local elections reflects the way people actually vote in the elections, while 9% believe they do not reflect the actual vote, and 26% say they don’t know (Figure 7). It should be no surprise that respondents who are satisfied with the regional KPUDs are much more likely to say that results reflect the actual vote (80%) than those who are dissatisfied with the KPUDs (54%). The fact that even a majority of those dissatisfied with the KPUDs believe that the results announced by these bodies reflect the vote is a positive indication fraudulent election results is not a primary reason for dissatisfaction with KPUDs. Still focusing on the ongoing local elections, the majority of Indonesians also believe that institutional actors including the KPUDs that are responsible to some extent for the organization of these elections can be expected to perform their duties in a neutral manner without political interference. Respondents believe that the TNI (78%), the police (74%), civil servants (63%), KPUD (61%), and PANWAS (60%) are able to respond neutrally to election issues. Only a small percentage of respondents in each case believe that these institutions do not act in a neutral manner, and sizeable percentages of respondents say they don’t know about the neutrality of these groups (Figure 8).
69%
69%
71%
72%
10%
11%
9%
9%
21%
20%
20%
19%
Regional KPUDs (66% aware)
BAWASLU (60% aware)
PANWAS (63% aware)
KPU (83% aware)
Figure 6: Satisfied/Dissatisfied with Electoral Institutions? (asked of those aware of institutions)
Very/Somewhat Satisfied DK/NR Very/Somewhat Dissatisfied
Yes, 65%
DK/NR, 26%
No, 9%
Figure 7: Confidence that Results Releasted by KPUD Reflect Actual Vote
17
There are several notable patterns in satisfaction levels with these institutions. Local institutions and leaders, with the exception of President Yudhoyono, generally elicit higher satisfaction than their counterparts at the national level. Leaders at the executive level generally elicit higher satisfaction than legislative bodies at the same level. A majority of respondents in all regions of Indonesia say they are very or somewhat satisfied with the performance of President Yudhoyono. Eighty-one percent of respondents in Kalimantan and Papua express satisfaction with the President while this figure is 67% in East Java, 61% in the western part of Java, and 60% in Central Java.
Satisfaction with Electoral Institutions
When asked about awareness and satisfaction with electoral institutions, 83% of Indonesians are aware of the KPU, 66% are aware of Regional KPUDs, 63% are aware of PANWAS, and 60% are aware of BAWASLU. Majorities of those aware of these electoral institutions are very/somewhat satisfied with them. Seventy-two percent of respondents are satisfied with the KPU, 71% are satisfied with PANWAS, 69% are satisfied with BAWASLU, and 69% are satisfied with the Regional KPUDs (Figure 6).
36%
40%
43%
43%
44%
45%
46%
47%
49%
52%
57%
58%
62%
62%
66%
79%
10%
20%
21%
16%
20%
18%
12%
20%
22%
7%
9%
4%
8%
9%
4%
5%
53%
42%
36%
41%
36%
37%
42%
35%
29%
41%
34%
39%
31%
27%
30%
16%
Peoples Representative Council (DPR) (n=2,085)
Attorney General (n=1,504)
Mahkamah Agung (1,417)
Provincial DPRD (n=1,702)
State Audit Authority (BPK) (n=1,280)
Regional Representatives Council (DPD) (n=1,359)
Regency/City DPRD (n=1,788)
Local courts (n=1,619)
Constitutional Court (n=843)
The Vice President (n=2,412)
Corruption Eradication Commission (KPK) …
The police (n=2,475)
Regent/Mayor (n=2,430)
Governor of this province (n=2,325)
The President (n=2,485)
TNI (n=2,445)
Figure 5: Satisfied/Dissatisfied with Institutions? (asked of those aware of institutions)
Very/Somewhat Satisfied DK/NR Very/Somewhat Dissatisfied

Page 14
International Foundation for Electoral Systems
20
II. Voting and Local Elections
The survey finds that most Indonesians value voting as a means to influence decision-making in the country. The survey also finds, however, that most Indonesians lack sufficient levels of information about the ongoing local elections, including in critical areas such as how to mark one’s ballot or registration for local elections. The data points to a need for renewed efforts to provide information on the local elections to the public in places where these elections have yet to take place. Television should be a primary source of information used for voter education, but data from the survey also indicates that informal sources such as local and village officials as well as family and friends are also important sources for information on the local election.
Perceived Influence of Voting
Indonesia has been an electoral democracy since 1999 and the high levels of participation in elections since 1999 indicate the extent to which Indonesians value the exercise of voting. To gauge the perceived influence that voting provides citizens, IFES has asked respondents on its surveys in Indonesia to agree or disagree with the following statement: “Voting gives people like me a chance to influence decision-making in Indonesia.”
A sizeable majority of Indonesians strongly (4%) or somewhat (74%) agree that voting gives them a chance to influence decision-making in Indonesia. Only 11% somewhat disagree and 2% strongly disagree that voting does not give them influence, while 8% say they don’t know. The percentage of Indonesians expressing these views has increased from 72% in 2008 to 78% in 2010 (Figures 9 and 10).
Belief in the influence of voting is high among all major demographic sub-groups in the population. It is also surprising that the vast majority of Indonesians agree with the influence voting provides them, even though most Indonesians say that they do not have any or much interest in politics and government. Only 3% of Indonesians say they are very interested in politics, 35% are somewhat interested, while 43% are not too interested and 16% are not at all interested. Among those who say don’t have much or any interest in politics, 78% say voting gives them influence over decision-making. The influence
Strongly agree;
4%
S/w agree; 68%
S/w disagree;
18%
Strongly disagree;
2%
DK/NR; 10%
Figure 9: Influence of Voting on Decision-Making (2008 Data)
Strongly agree;
4%
S/w agree; 74%
S/w disagree;
11%
Strongly disagree;
2%
DK/NR; 8%
Figure 10: Influence of Voting on Decision-Making (2010 Data)
19
78% 74%63% 61% 60%
15%15%
21% 29% 30%
6% 11% 17%11% 10%
TNI Police Civil Servants
KPUD PANWAS
Figure 8: Perception of Institutions' Neutrality
Not Neutral
DK/NR
Neutral
Page 15
Indonesia 2010 Survey Report
20
II. Voting and Local Elections
The survey finds that most Indonesians value voting as a means to influence decision-making in the country. The survey also finds, however, that most Indonesians lack sufficient levels of information about the ongoing local elections, including in critical areas such as how to mark one’s ballot or registration for local elections. The data points to a need for renewed efforts to provide information on the local elections to the public in places where these elections have yet to take place. Television should be a primary source of information used for voter education, but data from the survey also indicates that informal sources such as local and village officials as well as family and friends are also important sources for information on the local election.
Perceived Influence of Voting
Indonesia has been an electoral democracy since 1999 and the high levels of participation in elections since 1999 indicate the extent to which Indonesians value the exercise of voting. To gauge the perceived influence that voting provides citizens, IFES has asked respondents on its surveys in Indonesia to agree or disagree with the following statement: “Voting gives people like me a chance to influence decision-making in Indonesia.”
A sizeable majority of Indonesians strongly (4%) or somewhat (74%) agree that voting gives them a chance to influence decision-making in Indonesia. Only 11% somewhat disagree and 2% strongly disagree that voting does not give them influence, while 8% say they don’t know. The percentage of Indonesians expressing these views has increased from 72% in 2008 to 78% in 2010 (Figures 9 and 10).
Belief in the influence of voting is high among all major demographic sub-groups in the population. It is also surprising that the vast majority of Indonesians agree with the influence voting provides them, even though most Indonesians say that they do not have any or much interest in politics and government. Only 3% of Indonesians say they are very interested in politics, 35% are somewhat interested, while 43% are not too interested and 16% are not at all interested. Among those who say don’t have much or any interest in politics, 78% say voting gives them influence over decision-making. The influence
Strongly agree;
4%
S/w agree; 68%
S/w disagree;
18%
Strongly disagree;
2%
DK/NR; 10%
Figure 9: Influence of Voting on Decision-Making (2008 Data)
Strongly agree;
4%
S/w agree; 74%
S/w disagree;
11%
Strongly disagree;
2%
DK/NR; 8%
Figure 10: Influence of Voting on Decision-Making (2010 Data)
19
78% 74%63% 61% 60%
15%15%
21% 29% 30%
6% 11% 17%11% 10%
TNI Police Civil Servants
KPUD PANWAS
Figure 8: Perception of Institutions' Neutrality
Not Neutral
DK/NR
Neutral
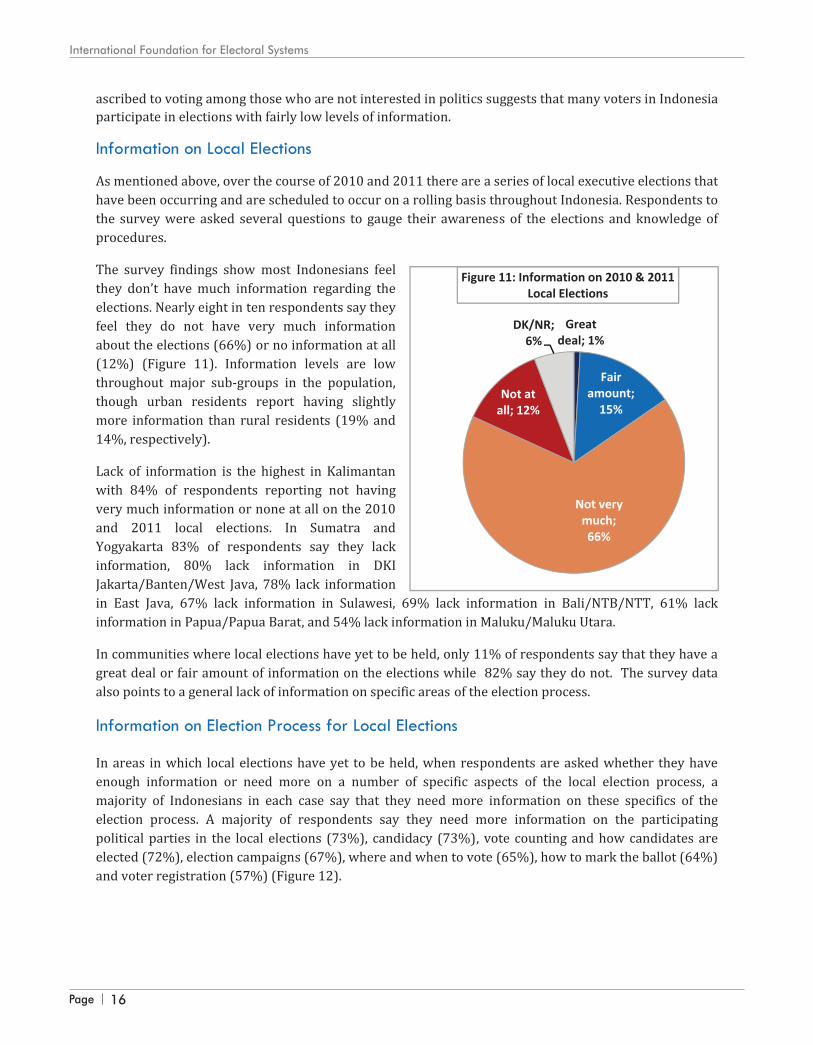
Page 16
International Foundation for Electoral Systems
22
A majority of respondents in all major demographic sub-groups of the population cite a need for more information on these topics. It is notable that there is a lack of information on both the electoral and political aspects of the electoral process, from the process of registration to information on the parties and candidates competing in the election. This finding indicates that both electoral authorities and political parties should focus more attention on strategies to increase the level of information available to voters.
Still, comparison with 2008 survey data indicates that the level of information on these aspects of the election process is higher than was the case for the 2008 presidential election. More Indonesians in this survey report having enough information on registration (33% in 2010, increased from 17% in 2008), voting procedures/how to mark ballots (26% in 2010, increased from 15% in 2008), where and when to vote (24% in 2010, increased from 14% in 2008), and campaigns (21% in 2010, increased from 14% in 2008). These increases may point to somewhat more successful voter education efforts since 2008 in these areas, but the data still points to fairly low levels of information, and the percentage of respondents expressing a need for more information remains consistently high for all parts of the election process.
Respondents were also asked specifically if they had seen or heard information on checking the voter’s register for the local elections. Half of voters (50%) say they have not seen information about checking the voter’s register for the local elections, but 41% say they have seen this information (Figure 13). Most respondents who saw or heard the information on checking the voter’s register say they saw it on TV (66%), then posters/billboards/pamphlets (21%), radio (9%), from the Head of RT (7%), from a Village Official (6%), newspapers/magazines (5%), or family/friends (4%). It is interesting to note that among those who have seen or heard information on checking the voter’s register, 46% say they still need more information on registration while 49% say
Yes; 41%
DK/NR; 9%
No; 50%
Figure 13: Seen/Heard Information on Checking Voter's
Register?
33%
26%
24%
21%
16%
17%
18%
10%
10%
12%
12%
12%
10%
9%
57%
64%
65%
67%
72%
73%
73%
Registration
Voting procedures/how to mark ballot
Information on where and when to vote
Campaigns
Vote counting/how candidates elected
Participating politcal parties
Candidacy
Figure 12: Information on Elections Process(Asked only where local elections have yet to take place, n=1,512)
Have enough information DK/NR Need more information
21
ascribed to voting among those who are not interested in politics suggests that many voters in Indonesia participate in elections with fairly low levels of information.
Information on Local Elections
As mentioned above, over the course of 2010 and 2011 there are a series of local executive elections that have been occurring and are scheduled to occur on a rolling basis throughout Indonesia. Respondents to the survey were asked several questions to gauge their awareness of the elections and knowledge of procedures.
The survey findings show most Indonesians feel they don’t have much information regarding the elections. Nearly eight in ten respondents say they feel they do not have very much information about the elections (66%) or no information at all (12%) (Figure 11). Information levels are low throughout major sub-groups in the population, though urban residents report having slightly more information than rural residents (19% and 14%, respectively).
Lack of information is the highest in Kalimantan with 84% of respondents reporting not having very much information or none at all on the 2010 and 2011 local elections. In Sumatra and Yogyakarta 83% of respondents say they lack information, 80% lack information in DKI Jakarta/Banten/West Java, 78% lack information in East Java, 67% lack information in Sulawesi, 69% lack information in Bali/NTB/NTT, 61% lack information in Papua/Papua Barat, and 54% lack information in Maluku/Maluku Utara.
In communities where local elections have yet to be held, only 11% of respondents say that they have a great deal or fair amount of information on the elections while 82% say they do not. The survey data also points to a general lack of information on specific areas of the election process.
Information on Election Process for Local Elections In areas in which local elections have yet to be held, when respondents are asked whether they have enough information or need more on a number of specific aspects of the local election process, a majority of Indonesians in each case say that they need more information on these specifics of the election process. A majority of respondents say they need more information on the participating political parties in the local elections (73%), candidacy (73%), vote counting and how candidates are elected (72%), election campaigns (67%), where and when to vote (65%), how to mark the ballot (64%) and voter registration (57%) (Figure 12).
Great deal; 1%
Fair amount;
15%
Not very much; 66%
Not at all; 12%
DK/NR; 6%
Figure 11: Information on 2010 & 2011 Local Elections
Page 17
Indonesia 2010 Survey Report
22
A majority of respondents in all major demographic sub-groups of the population cite a need for more information on these topics. It is notable that there is a lack of information on both the electoral and political aspects of the electoral process, from the process of registration to information on the parties and candidates competing in the election. This finding indicates that both electoral authorities and political parties should focus more attention on strategies to increase the level of information available to voters.
Still, comparison with 2008 survey data indicates that the level of information on these aspects of the election process is higher than was the case for the 2008 presidential election. More Indonesians in this survey report having enough information on registration (33% in 2010, increased from 17% in 2008), voting procedures/how to mark ballots (26% in 2010, increased from 15% in 2008), where and when to vote (24% in 2010, increased from 14% in 2008), and campaigns (21% in 2010, increased from 14% in 2008). These increases may point to somewhat more successful voter education efforts since 2008 in these areas, but the data still points to fairly low levels of information, and the percentage of respondents expressing a need for more information remains consistently high for all parts of the election process.
Respondents were also asked specifically if they had seen or heard information on checking the voter’s register for the local elections. Half of voters (50%) say they have not seen information about checking the voter’s register for the local elections, but 41% say they have seen this information (Figure 13). Most respondents who saw or heard the information on checking the voter’s register say they saw it on TV (66%), then posters/billboards/pamphlets (21%), radio (9%), from the Head of RT (7%), from a Village Official (6%), newspapers/magazines (5%), or family/friends (4%). It is interesting to note that among those who have seen or heard information on checking the voter’s register, 46% say they still need more information on registration while 49% say
Yes; 41%
DK/NR; 9%
No; 50%
Figure 13: Seen/Heard Information on Checking Voter's
Register?
33%
26%
24%
21%
16%
17%
18%
10%
10%
12%
12%
12%
10%
9%
57%
64%
65%
67%
72%
73%
73%
Registration
Voting procedures/how to mark ballot
Information on where and when to vote
Campaigns
Vote counting/how candidates elected
Participating politcal parties
Candidacy
Figure 12: Information on Elections Process(Asked only where local elections have yet to take place, n=1,512)
Have enough information DK/NR Need more information
21
ascribed to voting among those who are not interested in politics suggests that many voters in Indonesia participate in elections with fairly low levels of information.
Information on Local Elections
As mentioned above, over the course of 2010 and 2011 there are a series of local executive elections that have been occurring and are scheduled to occur on a rolling basis throughout Indonesia. Respondents to the survey were asked several questions to gauge their awareness of the elections and knowledge of procedures.
The survey findings show most Indonesians feel they don’t have much information regarding the elections. Nearly eight in ten respondents say they feel they do not have very much information about the elections (66%) or no information at all (12%) (Figure 11). Information levels are low throughout major sub-groups in the population, though urban residents report having slightly more information than rural residents (19% and 14%, respectively).
Lack of information is the highest in Kalimantan with 84% of respondents reporting not having very much information or none at all on the 2010 and 2011 local elections. In Sumatra and Yogyakarta 83% of respondents say they lack information, 80% lack information in DKI Jakarta/Banten/West Java, 78% lack information in East Java, 67% lack information in Sulawesi, 69% lack information in Bali/NTB/NTT, 61% lack information in Papua/Papua Barat, and 54% lack information in Maluku/Maluku Utara.
In communities where local elections have yet to be held, only 11% of respondents say that they have a great deal or fair amount of information on the elections while 82% say they do not. The survey data also points to a general lack of information on specific areas of the election process.
Information on Election Process for Local Elections In areas in which local elections have yet to be held, when respondents are asked whether they have enough information or need more on a number of specific aspects of the local election process, a majority of Indonesians in each case say that they need more information on these specifics of the election process. A majority of respondents say they need more information on the participating political parties in the local elections (73%), candidacy (73%), vote counting and how candidates are elected (72%), election campaigns (67%), where and when to vote (65%), how to mark the ballot (64%) and voter registration (57%) (Figure 12).
Great deal; 1%
Fair amount;
15%
Not very much; 66%
Not at all; 12%
DK/NR; 6%
Figure 11: Information on 2010 & 2011 Local Elections
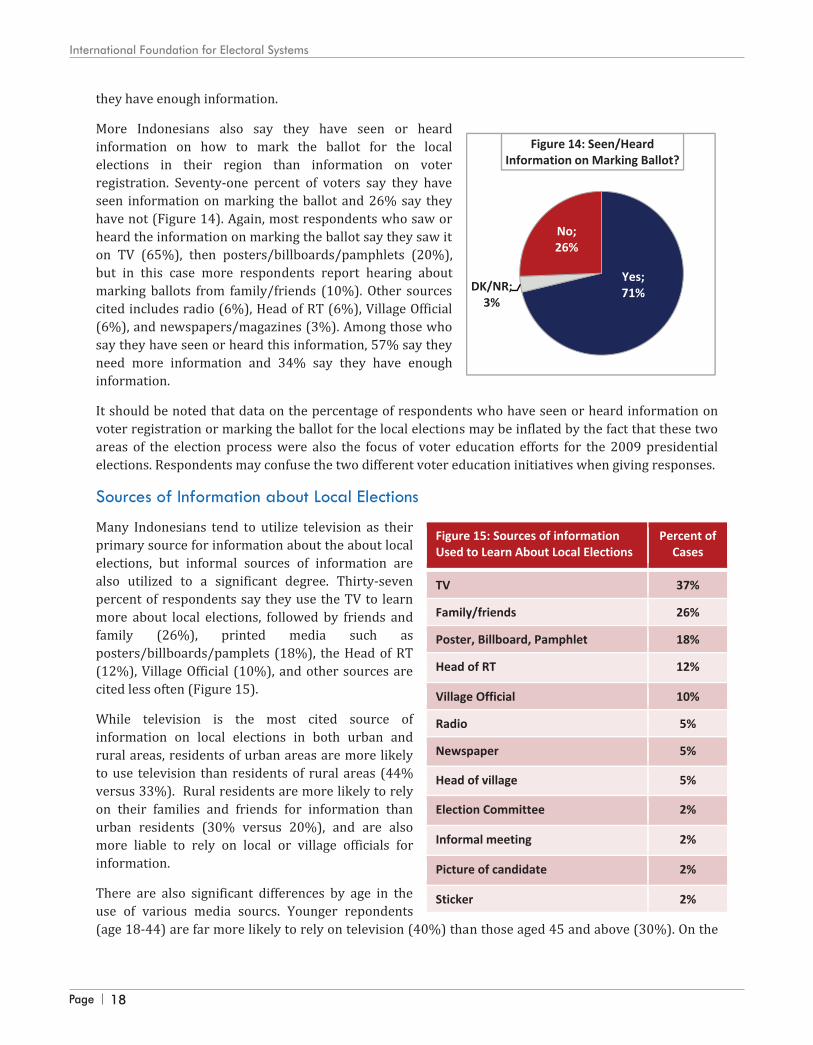
Page 18
International Foundation for Electoral Systems
24
other hand, older respondents are more likely to rely on local and village officials than younger respondents. Both groups are equally likely to rely on family and friends for information on the local elections. General Sources of Information In contrast to sources of information about local elections, Indonesians overwhelmingly cite television as their main source of information to learn about developments in Indonesia (Figure 16). Ninety-two percent of Indonesians report TV as their main source of information on developments in Indonesia, with only 3% using radio as their main source, 1% relying on word of mouth from friends/family/neighbors, 1% getting information from the Head of the RT/Head of Village, and 1% using other sources such as the internet, magazines, or newspapers (Figure 21). TV is the main source of information throughout Indonesia, but more urban residents watch TV than rural residents (97% and 90%, respectively). Men and women watch TV in almost equal proportions (93% and 92%, respectively).
Most people report watching TV everyday (72%), 20% say they watch it once a week, 2% watch less than once a week, and 5% say they never watch TV. More than a quarter (27%) of those who watch TV say RCTI is their most watched TV station, 16% say Indosiar, 16% say SCTV, 5% Metro TV , 10% TV One, 6% Trans TV, 9% TPI, 4% Trans 7, 3% TVRI, 2% ANTV, and 2% watch Global TV.
Only 10% of Indonesians listen to the radio everyday, 15% listen once a week, 7% listen less than once a week, and 68% never listen to the radio. The radio station that is most listened to is RRI (18%), followed by 3% of respondents saying they listen to Rama, El Shinta, and RPD. Two percent listen to JPI, GCD FM, I Radio, TPI Dangdut, Mayangkara, and Karimata.
Three percent of Indonesians read the newspaper everyday, 10% read the newspaper once a week, 6% read the newspaper less than once a week, and 81% of Indonesians never read the newspaper. Only 1% of respondents read a magazine once a week or more, 2% read a magazine less than once a week, and 96% never read magazines. One percent of those who use the internet access it every day, 2% connect to the internet once a week, 2% access the internet less than once a week, and 97% of Indonesians do not access the internet.
Sources of Information Effective for Encouraging Voting Television is also the information source most likely to be mentioned when respondents are asked to name the information sources they believe are most effective in encouraging people like them to vote.
TV; 92%
Radio; 3%
Other; 1%
Head of RT/Head of Village; 1%
Word of mouth/friend, family, neighb
or; 1%
Figure 16: Main Source of Information on Developments in Indonesia
23
they have enough information. More Indonesians also say they have seen or heard information on how to mark the ballot for the local elections in their region than information on voter registration. Seventy-one percent of voters say they have seen information on marking the ballot and 26% say they have not (Figure 14). Again, most respondents who saw or heard the information on marking the ballot say they saw it on TV (65%), then posters/billboards/pamphlets (20%), but in this case more respondents report hearing about marking ballots from family/friends (10%). Other sources cited includes radio (6%), Head of RT (6%), Village Official (6%), and newspapers/magazines (3%). Among those who say they have seen or heard this information, 57% say they need more information and 34% say they have enough information. It should be noted that data on the percentage of respondents who have seen or heard information on voter registration or marking the ballot for the local elections may be inflated by the fact that these two areas of the election process were also the focus of voter education efforts for the 2009 presidential elections. Respondents may confuse the two different voter education initiatives when giving responses.
Sources of Information about Local Elections
Many Indonesians tend to utilize television as their primary source for information about the about local elections, but informal sources of information are also utilized to a significant degree. Thirty-seven percent of respondents say they use the TV to learn more about local elections, followed by friends and family (26%), printed media such as posters/billboards/pamplets (18%), the Head of RT (12%), Village Official (10%), and other sources are cited less often (Figure 15). While television is the most cited source of information on local elections in both urban and rural areas, residents of urban areas are more likely to use television than residents of rural areas (44% versus 33%). Rural residents are more likely to rely on their families and friends for information than urban residents (30% versus 20%), and are also more liable to rely on local or village officials for information. There are also significant differences by age in the use of various media sourcs. Younger repondents (age 18-44) are far more likely to rely on television (40%) than those aged 45 and above (30%). On the
Figure 15: Sources of information Used to Learn About Local Elections
Percent of Cases
TV 37%
Family/friends 26%
Poster, Billboard, Pamphlet 18%
Head of RT 12%
Village Official 10%
Radio 5%
Newspaper 5%
Head of village 5%
Election Committee 2%
Informal meeting 2%
Picture of candidate 2%
Sticker 2%
Yes; 71%DK/NR;
3%
No; 26%
Figure 14: Seen/Heard Information on Marking Ballot?
Page 19
Indonesia 2010 Survey Report
24
other hand, older respondents are more likely to rely on local and village officials than younger respondents. Both groups are equally likely to rely on family and friends for information on the local elections. General Sources of Information In contrast to sources of information about local elections, Indonesians overwhelmingly cite television as their main source of information to learn about developments in Indonesia (Figure 16). Ninety-two percent of Indonesians report TV as their main source of information on developments in Indonesia, with only 3% using radio as their main source, 1% relying on word of mouth from friends/family/neighbors, 1% getting information from the Head of the RT/Head of Village, and 1% using other sources such as the internet, magazines, or newspapers (Figure 21). TV is the main source of information throughout Indonesia, but more urban residents watch TV than rural residents (97% and 90%, respectively). Men and women watch TV in almost equal proportions (93% and 92%, respectively).
Most people report watching TV everyday (72%), 20% say they watch it once a week, 2% watch less than once a week, and 5% say they never watch TV. More than a quarter (27%) of those who watch TV say RCTI is their most watched TV station, 16% say Indosiar, 16% say SCTV, 5% Metro TV , 10% TV One, 6% Trans TV, 9% TPI, 4% Trans 7, 3% TVRI, 2% ANTV, and 2% watch Global TV.
Only 10% of Indonesians listen to the radio everyday, 15% listen once a week, 7% listen less than once a week, and 68% never listen to the radio. The radio station that is most listened to is RRI (18%), followed by 3% of respondents saying they listen to Rama, El Shinta, and RPD. Two percent listen to JPI, GCD FM, I Radio, TPI Dangdut, Mayangkara, and Karimata.
Three percent of Indonesians read the newspaper everyday, 10% read the newspaper once a week, 6% read the newspaper less than once a week, and 81% of Indonesians never read the newspaper. Only 1% of respondents read a magazine once a week or more, 2% read a magazine less than once a week, and 96% never read magazines. One percent of those who use the internet access it every day, 2% connect to the internet once a week, 2% access the internet less than once a week, and 97% of Indonesians do not access the internet.
Sources of Information Effective for Encouraging Voting Television is also the information source most likely to be mentioned when respondents are asked to name the information sources they believe are most effective in encouraging people like them to vote.
TV; 92%
Radio; 3%
Other; 1%
Head of RT/Head of Village; 1%
Word of mouth/friend, family, neighb
or; 1%
Figure 16: Main Source of Information on Developments in Indonesia
23
they have enough information. More Indonesians also say they have seen or heard information on how to mark the ballot for the local elections in their region than information on voter registration. Seventy-one percent of voters say they have seen information on marking the ballot and 26% say they have not (Figure 14). Again, most respondents who saw or heard the information on marking the ballot say they saw it on TV (65%), then posters/billboards/pamphlets (20%), but in this case more respondents report hearing about marking ballots from family/friends (10%). Other sources cited includes radio (6%), Head of RT (6%), Village Official (6%), and newspapers/magazines (3%). Among those who say they have seen or heard this information, 57% say they need more information and 34% say they have enough information. It should be noted that data on the percentage of respondents who have seen or heard information on voter registration or marking the ballot for the local elections may be inflated by the fact that these two areas of the election process were also the focus of voter education efforts for the 2009 presidential elections. Respondents may confuse the two different voter education initiatives when giving responses.
Sources of Information about Local Elections
Many Indonesians tend to utilize television as their primary source for information about the about local elections, but informal sources of information are also utilized to a significant degree. Thirty-seven percent of respondents say they use the TV to learn more about local elections, followed by friends and family (26%), printed media such as posters/billboards/pamplets (18%), the Head of RT (12%), Village Official (10%), and other sources are cited less often (Figure 15). While television is the most cited source of information on local elections in both urban and rural areas, residents of urban areas are more likely to use television than residents of rural areas (44% versus 33%). Rural residents are more likely to rely on their families and friends for information than urban residents (30% versus 20%), and are also more liable to rely on local or village officials for information. There are also significant differences by age in the use of various media sourcs. Younger repondents (age 18-44) are far more likely to rely on television (40%) than those aged 45 and above (30%). On the
Figure 15: Sources of information Used to Learn About Local Elections
Percent of Cases
TV 37%
Family/friends 26%
Poster, Billboard, Pamphlet 18%
Head of RT 12%
Village Official 10%
Radio 5%
Newspaper 5%
Head of village 5%
Election Committee 2%
Informal meeting 2%
Picture of candidate 2%
Sticker 2%
Yes; 71%DK/NR;
3%
No; 26%
Figure 14: Seen/Heard Information on Marking Ballot?

Page 20
International Foundation for Electoral Systems
26
indicates that turnout generally does not turn out to be as high as the combined very likely and somewhat likely percentages would indicate. It is probable that many of those who say they are somewhat likely to vote do not actually turn out to vote. For the local elections that have taken place through November in Indonesia, the actual percentage turnout has been 71% (according to KPU data), but there has been a great degree of variability in turnout from local election to local election. The high likelihood of voting in local elections occurs despite the fact that 96% of respondents in areas where elections have yet to take place cannot name the date for the election. Only 4% cited the date correctly, with high levels of awareness in areas where elections are scheduled to take place within 30 days of the survey. The fact that these elections are organized on a rolling basis and election dates are not announced well in advance of the election most probably contributes to the low level of knowledge on election dates in areas where elections are still more than a month away.
Method of Voting and Identity Documents In the past two elections, Indonesia has used two different methods by which voters choose the party or candidate for whom they intend to vote. In 2004, voters made their choice by punching a hole in the ballot, while in 2009 voters made their choice by checking the name of the party or candidate. In the ongoing local elections, voters once again have to punch a hole in the ballot to make their choice. Given the changing method of voting, respondents to the survey were asked to name the method they prefer to make a choice when voting. A slight majority of Indonesians prefer punching the ballot (53%), but 45% prefer checking the ballot, and 2% don’t know. There has also been a fair bit of flexibility in Indonesian elections with regard to the identity documents that voters must provide when voting. A range of documents has been accepted in the past as valid for establishing the identity of the voter. When voters in areas with upcoming elections in the survey were asked to state which documents they believe they can show to prove their identity at polling stations, 62% cite the voter’s form, 28% cite the invitation letter, 18% cite their identity card, 6% cite their family member’s card, and 2% say they don’t know. All of these documents are valid with the exception of family members’ cards which are not specifically addressed as a valid form of identification for legislative elections.
25
When the different types of tools for encouraging voting are assessed, Indonesians roughly equally prefer mass media and informal or more personal communications. One third (34%) of respondents say advertising campaigns on TV would be an effective way to encourage people to vote, 12% say a talk show program on TV and/or radio, 12% cite word of mouth, 12% cite religious meetings, 12% say informal meetings, 7% say candidate dialogues/debates, and 5% say posters/banners. More urban residents prefer advertising campaigns on TV (43%) than rural residents (30%), while more rural residents prefer informal meetings (14%) than urban residents (8%). Men and women are mostly in agreement on what they perceive as the most effective way to encourage people like them to vote, indicating both men and women could potentially be targeted effectively with similar get-out-the-vote efforts. However, women are more inclined to cite word of mouth as an effective way to encourage them to vote (16%) than men do (7%).
Participation in Local Elections Turnout in Indonesian elections for presidential and legislative elections has generally been fairly high, but has fallen over time since the first post-Suharto elections in 1999. Respondents in areas where local elections have yet to take place were asked how likely they are to participate in these local elections. Twenty-six percent say that they are very likely to vote and another 68% say they are somewhat likely to vote (Figure 18). This does not necessarily mean that there will be 94% turnout for the remaining local elections. IFES experience with this question in surveys throughout the world
1%
1%
1%
1%
2%
5%
7%
12%
12%
12%
12%
34%
Seminars
Brochures/flyers
Advertising in print/internet
Letters in the mail
Advertising campaigns on radio
Posters/banners
Candidate debates/dialogues
Informal meetings
Religious meetings
Word of mouth
Talkshow program in TV/radio
Advertising campaigns on TV
Figure 17: Effective Means of Encouraging Voting
Very likely; 26%
S/w likely; 68%
Not very likely; 4%
DK/NR; 2%
Figure 18: Likelihood of Voting in Upcoming Local Elections
Page 21
Indonesia 2010 Survey Report
26
indicates that turnout generally does not turn out to be as high as the combined very likely and somewhat likely percentages would indicate. It is probable that many of those who say they are somewhat likely to vote do not actually turn out to vote. For the local elections that have taken place through November in Indonesia, the actual percentage turnout has been 71% (according to KPU data), but there has been a great degree of variability in turnout from local election to local election. The high likelihood of voting in local elections occurs despite the fact that 96% of respondents in areas where elections have yet to take place cannot name the date for the election. Only 4% cited the date correctly, with high levels of awareness in areas where elections are scheduled to take place within 30 days of the survey. The fact that these elections are organized on a rolling basis and election dates are not announced well in advance of the election most probably contributes to the low level of knowledge on election dates in areas where elections are still more than a month away.
Method of Voting and Identity Documents In the past two elections, Indonesia has used two different methods by which voters choose the party or candidate for whom they intend to vote. In 2004, voters made their choice by punching a hole in the ballot, while in 2009 voters made their choice by checking the name of the party or candidate. In the ongoing local elections, voters once again have to punch a hole in the ballot to make their choice. Given the changing method of voting, respondents to the survey were asked to name the method they prefer to make a choice when voting. A slight majority of Indonesians prefer punching the ballot (53%), but 45% prefer checking the ballot, and 2% don’t know. There has also been a fair bit of flexibility in Indonesian elections with regard to the identity documents that voters must provide when voting. A range of documents has been accepted in the past as valid for establishing the identity of the voter. When voters in areas with upcoming elections in the survey were asked to state which documents they believe they can show to prove their identity at polling stations, 62% cite the voter’s form, 28% cite the invitation letter, 18% cite their identity card, 6% cite their family member’s card, and 2% say they don’t know. All of these documents are valid with the exception of family members’ cards which are not specifically addressed as a valid form of identification for legislative elections.
25
When the different types of tools for encouraging voting are assessed, Indonesians roughly equally prefer mass media and informal or more personal communications. One third (34%) of respondents say advertising campaigns on TV would be an effective way to encourage people to vote, 12% say a talk show program on TV and/or radio, 12% cite word of mouth, 12% cite religious meetings, 12% say informal meetings, 7% say candidate dialogues/debates, and 5% say posters/banners. More urban residents prefer advertising campaigns on TV (43%) than rural residents (30%), while more rural residents prefer informal meetings (14%) than urban residents (8%). Men and women are mostly in agreement on what they perceive as the most effective way to encourage people like them to vote, indicating both men and women could potentially be targeted effectively with similar get-out-the-vote efforts. However, women are more inclined to cite word of mouth as an effective way to encourage them to vote (16%) than men do (7%).
Participation in Local Elections Turnout in Indonesian elections for presidential and legislative elections has generally been fairly high, but has fallen over time since the first post-Suharto elections in 1999. Respondents in areas where local elections have yet to take place were asked how likely they are to participate in these local elections. Twenty-six percent say that they are very likely to vote and another 68% say they are somewhat likely to vote (Figure 18). This does not necessarily mean that there will be 94% turnout for the remaining local elections. IFES experience with this question in surveys throughout the world
1%
1%
1%
1%
2%
5%
7%
12%
12%
12%
12%
34%
Seminars
Brochures/flyers
Advertising in print/internet
Letters in the mail
Advertising campaigns on radio
Posters/banners
Candidate debates/dialogues
Informal meetings
Religious meetings
Word of mouth
Talkshow program in TV/radio
Advertising campaigns on TV
Figure 17: Effective Means of Encouraging Voting
Very likely; 26%
S/w likely; 68%
Not very likely; 4%
DK/NR; 2%
Figure 18: Likelihood of Voting in Upcoming Local Elections
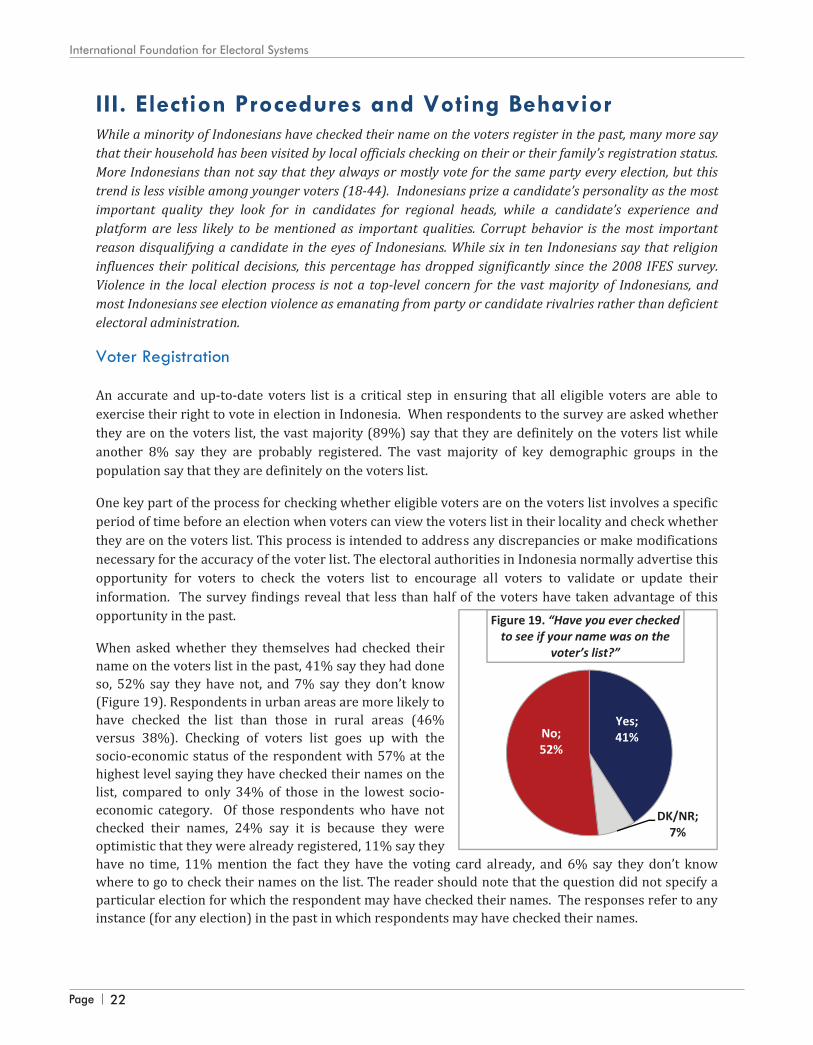
Page 22
International Foundation for Electoral Systems
28
To help bolster the number of people who check their names on the list, residents in many communities in Indonesia are encouraged by community leader or officials to check their name on the list. To check on the incidence of this phenomenon, respondents on the survey were asked whether anyone in their community had visited their household to check on their registration status or that of their family members. Sixty-four percent of Indonesians say somebody has come to their house in the past to check the voter registration status of their families, while 31% say nobody came to check their status and 6% say they don’t know (Figure 20). Of those who say somebody came to check their registration status, 40% say it was the Head of RT, 25% say it was a village official, 23% say it was the election committee, 7% say it was the head of the village, 2% say it was the Head of RW, and 7% do not remember who came to check. During discussion of this finding in public briefings in Indonesia, a point was made noting that at the time of the fieldwork of the survey, an enumeration exercise for the census was also underway in which community leaders and officials were making door-to-door visits in support of the enumeration exercise. This may have led to some confusion among respondents that may have resulted in a high ‘yes’ response to this question. The reader is advised to bear this in mind when considering this data point.
Voting Behavior & Factors in Electoral Decision-Making
The survey results indicate that there is a general split among Indonesians on whether they tend to vote for the same parties in election after election or whether they tend to vote for different parties. Slightly more than half of all Indonesians report always voting for the same party (30%) or mostly voting for the same party (21%) in elections, compared to four in ten Indonesians (41%) who say they vote for different parties in different elections (Figure 21). There is a distinct age gap on habitual voting for the same party. Indonesians 45 and older are much more likely to always or mostly vote for the same party from election to election than Indonesians aged 44 and younger (60% versus 45%), whereas younger voters are more likely to vote for different parties than older voters (44% versus 36%). Starting with the 2004 elections, Indonesia changed to an open list system for legislative elections so that voters could choose a candidate in addition to choosing parties when voting. When those who report voting in the 2009 legislative elections were asked how they voted, half say they voted
Always vote for
the same party; 30%
Mostly vote for
the same party; 21%
Different parties;
41%
First time voter; 5%
DK/NR; 3%
Never voted; 1%
Figure 21: Party Support Over Different Elections
Yes; 64%
DK/NR; 6%
No; 31%
Figure 20: Did Somebody Come to Check Your Voter Registration
Status?
27
III. Election Procedures and Voting Behavior While a minority of Indonesians have checked their name on the voters register in the past, many more say that their household has been visited by local officials checking on their or their family’s registration status. More Indonesians than not say that they always or mostly vote for the same party every election, but this trend is less visible among younger voters (18-44). Indonesians prize a candidate’s personality as the most important quality they look for in candidates for regional heads, while a candidate’s experience and platform are less likely to be mentioned as important qualities. Corrupt behavior is the most important reason disqualifying a candidate in the eyes of Indonesians. While six in ten Indonesians say that religion influences their political decisions, this percentage has dropped significantly since the 2008 IFES survey. Violence in the local election process is not a top-level concern for the vast majority of Indonesians, and most Indonesians see election violence as emanating from party or candidate rivalries rather than deficient electoral administration.
Voter Registration An accurate and up-to-date voters list is a critical step in ensuring that all eligible voters are able to exercise their right to vote in election in Indonesia. When respondents to the survey are asked whether they are on the voters list, the vast majority (89%) say that they are definitely on the voters list while another 8% say they are probably registered. The vast majority of key demographic groups in the population say that they are definitely on the voters list.
One key part of the process for checking whether eligible voters are on the voters list involves a specific period of time before an election when voters can view the voters list in their locality and check whether they are on the voters list. This process is intended to address any discrepancies or make modifications necessary for the accuracy of the voter list. The electoral authorities in Indonesia normally advertise this opportunity for voters to check the voters list to encourage all voters to validate or update their information. The survey findings reveal that less than half of the voters have taken advantage of this opportunity in the past.
When asked whether they themselves had checked their name on the voters list in the past, 41% say they had done so, 52% say they have not, and 7% say they don’t know (Figure 19). Respondents in urban areas are more likely to have checked the list than those in rural areas (46% versus 38%). Checking of voters list goes up with the socio-economic status of the respondent with 57% at the highest level saying they have checked their names on the list, compared to only 34% of those in the lowest socio-economic category. Of those respondents who have not checked their names, 24% say it is because they were optimistic that they were already registered, 11% say they have no time, 11% mention the fact they have the voting card already, and 6% say they don’t know where to go to check their names on the list. The reader should note that the question did not specify a particular election for which the respondent may have checked their names. The responses refer to any instance (for any election) in the past in which respondents may have checked their names.
Yes; 41%
DK/NR; 7%
No; 52%
Figure 19. “Have you ever checked to see if your name was on the
voter’s list?”
Page 23
Indonesia 2010 Survey Report
28
To help bolster the number of people who check their names on the list, residents in many communities in Indonesia are encouraged by community leader or officials to check their name on the list. To check on the incidence of this phenomenon, respondents on the survey were asked whether anyone in their community had visited their household to check on their registration status or that of their family members. Sixty-four percent of Indonesians say somebody has come to their house in the past to check the voter registration status of their families, while 31% say nobody came to check their status and 6% say they don’t know (Figure 20). Of those who say somebody came to check their registration status, 40% say it was the Head of RT, 25% say it was a village official, 23% say it was the election committee, 7% say it was the head of the village, 2% say it was the Head of RW, and 7% do not remember who came to check. During discussion of this finding in public briefings in Indonesia, a point was made noting that at the time of the fieldwork of the survey, an enumeration exercise for the census was also underway in which community leaders and officials were making door-to-door visits in support of the enumeration exercise. This may have led to some confusion among respondents that may have resulted in a high ‘yes’ response to this question. The reader is advised to bear this in mind when considering this data point.
Voting Behavior & Factors in Electoral Decision-Making
The survey results indicate that there is a general split among Indonesians on whether they tend to vote for the same parties in election after election or whether they tend to vote for different parties. Slightly more than half of all Indonesians report always voting for the same party (30%) or mostly voting for the same party (21%) in elections, compared to four in ten Indonesians (41%) who say they vote for different parties in different elections (Figure 21). There is a distinct age gap on habitual voting for the same party. Indonesians 45 and older are much more likely to always or mostly vote for the same party from election to election than Indonesians aged 44 and younger (60% versus 45%), whereas younger voters are more likely to vote for different parties than older voters (44% versus 36%). Starting with the 2004 elections, Indonesia changed to an open list system for legislative elections so that voters could choose a candidate in addition to choosing parties when voting. When those who report voting in the 2009 legislative elections were asked how they voted, half say they voted
Always vote for
the same party; 30%
Mostly vote for
the same party; 21%
Different parties;
41%
First time voter; 5%
DK/NR; 3%
Never voted; 1%
Figure 21: Party Support Over Different Elections
Yes; 64%
DK/NR; 6%
No; 31%
Figure 20: Did Somebody Come to Check Your Voter Registration
Status?
27
III. Election Procedures and Voting Behavior While a minority of Indonesians have checked their name on the voters register in the past, many more say that their household has been visited by local officials checking on their or their family’s registration status. More Indonesians than not say that they always or mostly vote for the same party every election, but this trend is less visible among younger voters (18-44). Indonesians prize a candidate’s personality as the most important quality they look for in candidates for regional heads, while a candidate’s experience and platform are less likely to be mentioned as important qualities. Corrupt behavior is the most important reason disqualifying a candidate in the eyes of Indonesians. While six in ten Indonesians say that religion influences their political decisions, this percentage has dropped significantly since the 2008 IFES survey. Violence in the local election process is not a top-level concern for the vast majority of Indonesians, and most Indonesians see election violence as emanating from party or candidate rivalries rather than deficient electoral administration.
Voter Registration An accurate and up-to-date voters list is a critical step in ensuring that all eligible voters are able to exercise their right to vote in election in Indonesia. When respondents to the survey are asked whether they are on the voters list, the vast majority (89%) say that they are definitely on the voters list while another 8% say they are probably registered. The vast majority of key demographic groups in the population say that they are definitely on the voters list.
One key part of the process for checking whether eligible voters are on the voters list involves a specific period of time before an election when voters can view the voters list in their locality and check whether they are on the voters list. This process is intended to address any discrepancies or make modifications necessary for the accuracy of the voter list. The electoral authorities in Indonesia normally advertise this opportunity for voters to check the voters list to encourage all voters to validate or update their information. The survey findings reveal that less than half of the voters have taken advantage of this opportunity in the past.
When asked whether they themselves had checked their name on the voters list in the past, 41% say they had done so, 52% say they have not, and 7% say they don’t know (Figure 19). Respondents in urban areas are more likely to have checked the list than those in rural areas (46% versus 38%). Checking of voters list goes up with the socio-economic status of the respondent with 57% at the highest level saying they have checked their names on the list, compared to only 34% of those in the lowest socio-economic category. Of those respondents who have not checked their names, 24% say it is because they were optimistic that they were already registered, 11% say they have no time, 11% mention the fact they have the voting card already, and 6% say they don’t know where to go to check their names on the list. The reader should note that the question did not specify a particular election for which the respondent may have checked their names. The responses refer to any instance (for any election) in the past in which respondents may have checked their names.
Yes; 41%
DK/NR; 7%
No; 52%
Figure 19. “Have you ever checked to see if your name was on the
voter’s list?”
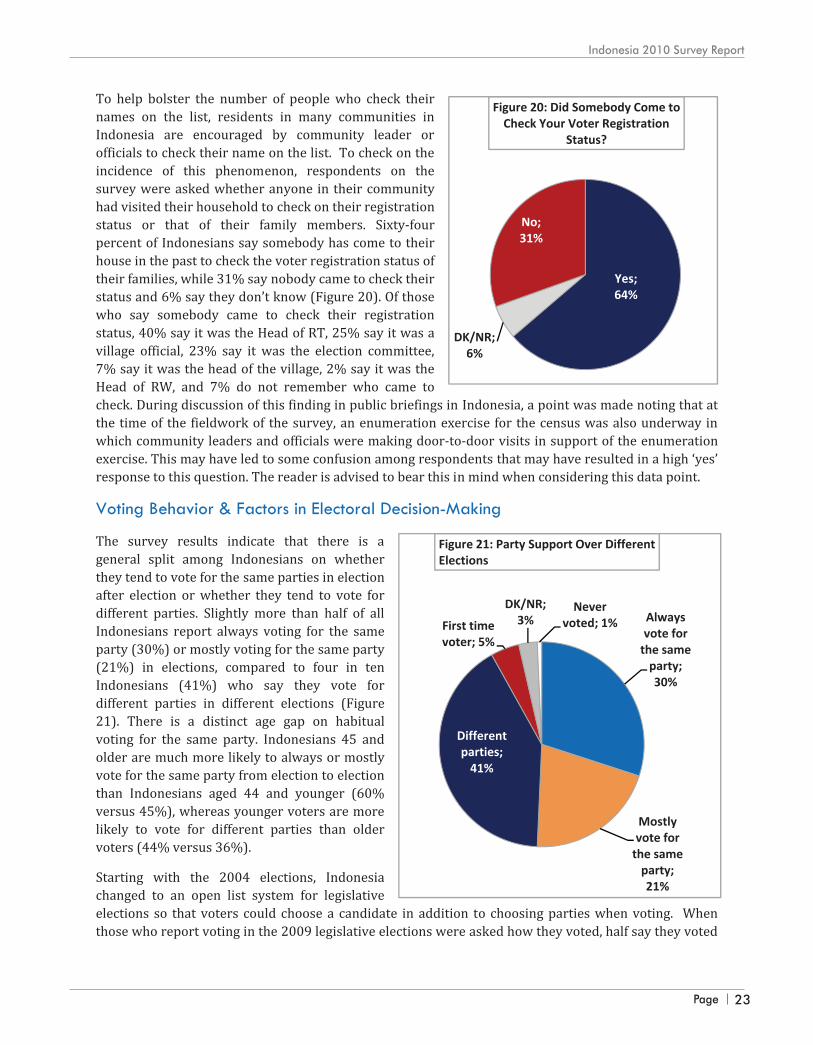

Page 24
International Foundation for Electoral Systems
30
Respondents were also asked to cite the extent to which religion influences important political decisions they make, like choosing political parties or candidates. The data shows more than half (62%) say that religion has an influence on important political decisions they make to some extent (44%) or to a great extent (18%). It is worth noting that the reported influence of religion on political decision-making has dropped since 2008 from 79% to 62% this year. In 2008, nearly eight in ten (79%) of Indonesians said religion influenced their political decisions to some extent (49%) or to a great extent (30%) (Figure 24). At the same time, the percentage saying that religion has no influence or only a very limited influence on their political decision-making has increased from 20% in 2008 to 35% in this survey.
Figure 23: Qualities of Unfavorable Candidates Percent of Cases
Corrupt 41%
Dishonest 40%
Criminal background 5%
Bad personality 3%
Religious background 3%
Unpopular 2%
From a different region of Indonesia 2%
Not close with people 1%
Wealth 1%
Party affiliation (not my party) Less than 1%
18%
30%
44%
49%
4%
2%
21%
10%
14%
10%
2010 Total (n=2,500)
2008 Total (n=2,500)
Figure 24: "To what extent does religion influence the important political decisions you make, like choosing political parties or candidates?"
To a great extent To some extent DK/NR To a very limited extent Has no influence at all
29
for a party and a candidate (49%), 28% say they voted for a candidate only and 19% said they voted for a party only. It should be noted that when respondents say they voted for a candidate, it effectively also means that they voted for the party that candidate represented as well. Respondents to the survey were also asked for the most important quality they look for in candidates for region head. Personality is cited as the most important factor (40%), trailed by level of experience (15%), past performance of candidate (11%), candidate’s platform/stance on main issues (11%), and party affiliation (5%). The candidate’s approach to the community, whether their family supports the candidate, or the ethnicity of the candidate are all less important qualities of a favorable candidate for the head of the region (Figure 22).
When asked about qualities of candidates which make them unlikely to vote for that candidate, Indonesians cite corruption (41%) and dishonesty (41%) as the top two qualities of unfavorable candidates, or qualities that would make them extremely unlikely to vote for a candidate. Criminal background, a bad personality, or the religious background of a candidate were cited as unfavorable traits, but less so than corruption and dishonesty (Figure 23).
Figure 22: Qualities of Favorable Candidates for Head of Region
Percent of Cases
Personality 41%
Level of experience in government 15%
Past performance of candidate 11%
Candidates platform/stance on main issues 11%
Which party the candidate belongs to/Political affiliation 5%
Popularity of candidate 4%
Good approach to community 4%
Candidate my family supports 3%
Ethnicity of candidate is same as me 1%
Against corruption 1%
(For Papua and West Papua only) the candidate is same tribe as me
Less than 1%
Candidates rank in the voter list Less than 1%
Gender of candidate Less than 1%
Page 25
Indonesia 2010 Survey Report
30
Respondents were also asked to cite the extent to which religion influences important political decisions they make, like choosing political parties or candidates. The data shows more than half (62%) say that religion has an influence on important political decisions they make to some extent (44%) or to a great extent (18%). It is worth noting that the reported influence of religion on political decision-making has dropped since 2008 from 79% to 62% this year. In 2008, nearly eight in ten (79%) of Indonesians said religion influenced their political decisions to some extent (49%) or to a great extent (30%) (Figure 24). At the same time, the percentage saying that religion has no influence or only a very limited influence on their political decision-making has increased from 20% in 2008 to 35% in this survey.
Figure 23: Qualities of Unfavorable Candidates Percent of Cases
Corrupt 41%
Dishonest 40%
Criminal background 5%
Bad personality 3%
Religious background 3%
Unpopular 2%
From a different region of Indonesia 2%
Not close with people 1%
Wealth 1%
Party affiliation (not my party) Less than 1%
18%
30%
44%
49%
4%
2%
21%
10%
14%
10%
2010 Total (n=2,500)
2008 Total (n=2,500)
Figure 24: "To what extent does religion influence the important political decisions you make, like choosing political parties or candidates?"
To a great extent To some extent DK/NR To a very limited extent Has no influence at all
29
for a party and a candidate (49%), 28% say they voted for a candidate only and 19% said they voted for a party only. It should be noted that when respondents say they voted for a candidate, it effectively also means that they voted for the party that candidate represented as well. Respondents to the survey were also asked for the most important quality they look for in candidates for region head. Personality is cited as the most important factor (40%), trailed by level of experience (15%), past performance of candidate (11%), candidate’s platform/stance on main issues (11%), and party affiliation (5%). The candidate’s approach to the community, whether their family supports the candidate, or the ethnicity of the candidate are all less important qualities of a favorable candidate for the head of the region (Figure 22).
When asked about qualities of candidates which make them unlikely to vote for that candidate, Indonesians cite corruption (41%) and dishonesty (41%) as the top two qualities of unfavorable candidates, or qualities that would make them extremely unlikely to vote for a candidate. Criminal background, a bad personality, or the religious background of a candidate were cited as unfavorable traits, but less so than corruption and dishonesty (Figure 23).
Figure 22: Qualities of Favorable Candidates for Head of Region
Percent of Cases
Personality 41%
Level of experience in government 15%
Past performance of candidate 11%
Candidates platform/stance on main issues 11%
Which party the candidate belongs to/Political affiliation 5%
Popularity of candidate 4%
Good approach to community 4%
Candidate my family supports 3%
Ethnicity of candidate is same as me 1%
Against corruption 1%
(For Papua and West Papua only) the candidate is same tribe as me
Less than 1%
Candidates rank in the voter list Less than 1%
Gender of candidate Less than 1%
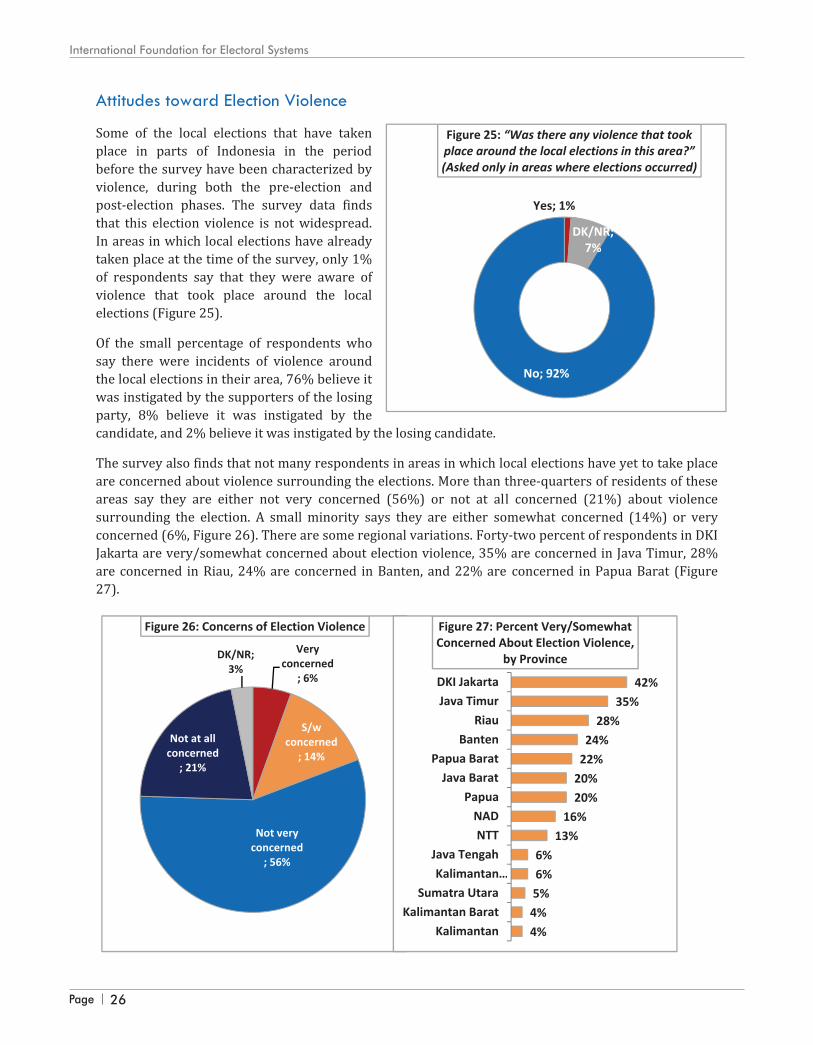
Page 26
International Foundation for Electoral Systems
32
Among those concerned about election violence, the primary reasons given for the threat of election violence are rivalries between party or candidate supporters. Forty-six percent believe party candidate supporters are likely to instigate violence, 21% believe the losing side instigates violence, 7% believe violence is between political parties, and 5% believe the candidate instigates the violence. Very few blame electoral procedures, as 4% believe violence is instigated if there is unclear vote counting (Figure 28). When all respondents are asked why election violence occurs in Indonesia, the vast majority cite rivalries and competition between party or candidate supporters. Most Indonesians view reasons behind election violence as competition between supporters of different political parties (43%), rivalry between candidate supporters (33%), and competition between candidates to gain office for enriching themselves (12%). Few blame poor management of the election process (10%), while an even smaller percentage blames rivalry between people of different religious or ethnic groups (1%) (Figure 29).
Figure 28: [If concerned about violence] “What groups do you think are likely to instigate violence?”
Percent of
Cases
Those supporting a party candidate 46%
Losing side/party who wanted to win 21%
Between political parties 7%
Candidate 5%
If there is unclear vote counting 4%
Third party 3%
Clashes between supporters 2%
Community 2%
Party leaders 1%
DK/NR 7%
Competition btwn supporters
of different political parties;
43%
Competition btwn political candidates to gain political
office to enrich themselves ;
12%
Poor management of
election process; 10%
Rivalry btwn people from
different religious/ethnic
groups; 1%
Rivalry btwn supporters of
candidates; 33%
Figure 29: Perceived Reasons for Election Violence
31
Attitudes toward Election Violence
Some of the local elections that have taken place in parts of Indonesia in the period before the survey have been characterized by violence, during both the pre-election and post-election phases. The survey data finds that this election violence is not widespread. In areas in which local elections have already taken place at the time of the survey, only 1% of respondents say that they were aware of violence that took place around the local elections (Figure 25). Of the small percentage of respondents who say there were incidents of violence around the local elections in their area, 76% believe it was instigated by the supporters of the losing party, 8% believe it was instigated by the candidate, and 2% believe it was instigated by the losing candidate. The survey also finds that not many respondents in areas in which local elections have yet to take place are concerned about violence surrounding the elections. More than three-quarters of residents of these areas say they are either not very concerned (56%) or not at all concerned (21%) about violence surrounding the election. A small minority says they are either somewhat concerned (14%) or very concerned (6%, Figure 26). There are some regional variations. Forty-two percent of respondents in DKI Jakarta are very/somewhat concerned about election violence, 35% are concerned in Java Timur, 28% are concerned in Riau, 24% are concerned in Banten, and 22% are concerned in Papua Barat (Figure 27).
Yes; 1%
DK/NR; 7%
No; 92%
Figure 25: “Was there any violence that took place around the local elections in this area?” (Asked only in areas where elections occurred)
Very concerned
; 6%
S/w concerned
; 14%
Not very concerned
; 56%
Not at all concerned
; 21%
DK/NR; 3%
Figure 26: Concerns of Election Violence
4%
4%
5%
6%
6%
13%
16%
20%
20%
22%
24%
28%
35%
42%
Kalimantan
Kalimantan Barat
Sumatra Utara
Kalimantan …
Java Tengah
NTT
NAD
Papua
Java Barat
Papua Barat
Banten
Riau
Java Timur
DKI Jakarta
Figure 27: Percent Very/Somewhat Concerned About Election Violence,
by Province
Page 27
Indonesia 2010 Survey Report
32
Among those concerned about election violence, the primary reasons given for the threat of election violence are rivalries between party or candidate supporters. Forty-six percent believe party candidate supporters are likely to instigate violence, 21% believe the losing side instigates violence, 7% believe violence is between political parties, and 5% believe the candidate instigates the violence. Very few blame electoral procedures, as 4% believe violence is instigated if there is unclear vote counting (Figure 28). When all respondents are asked why election violence occurs in Indonesia, the vast majority cite rivalries and competition between party or candidate supporters. Most Indonesians view reasons behind election violence as competition between supporters of different political parties (43%), rivalry between candidate supporters (33%), and competition between candidates to gain office for enriching themselves (12%). Few blame poor management of the election process (10%), while an even smaller percentage blames rivalry between people of different religious or ethnic groups (1%) (Figure 29).
Figure 28: [If concerned about violence] “What groups do you think are likely to instigate violence?”
Percent of
Cases
Those supporting a party candidate 46%
Losing side/party who wanted to win 21%
Between political parties 7%
Candidate 5%
If there is unclear vote counting 4%
Third party 3%
Clashes between supporters 2%
Community 2%
Party leaders 1%
DK/NR 7%
Competition btwn supporters
of different political parties;
43%
Competition btwn political candidates to gain political
office to enrich themselves ;
12%
Poor management of
election process; 10%
Rivalry btwn people from
different religious/ethnic
groups; 1%
Rivalry btwn supporters of
candidates; 33%
Figure 29: Perceived Reasons for Election Violence
31
Attitudes toward Election Violence
Some of the local elections that have taken place in parts of Indonesia in the period before the survey have been characterized by violence, during both the pre-election and post-election phases. The survey data finds that this election violence is not widespread. In areas in which local elections have already taken place at the time of the survey, only 1% of respondents say that they were aware of violence that took place around the local elections (Figure 25). Of the small percentage of respondents who say there were incidents of violence around the local elections in their area, 76% believe it was instigated by the supporters of the losing party, 8% believe it was instigated by the candidate, and 2% believe it was instigated by the losing candidate. The survey also finds that not many respondents in areas in which local elections have yet to take place are concerned about violence surrounding the elections. More than three-quarters of residents of these areas say they are either not very concerned (56%) or not at all concerned (21%) about violence surrounding the election. A small minority says they are either somewhat concerned (14%) or very concerned (6%, Figure 26). There are some regional variations. Forty-two percent of respondents in DKI Jakarta are very/somewhat concerned about election violence, 35% are concerned in Java Timur, 28% are concerned in Riau, 24% are concerned in Banten, and 22% are concerned in Papua Barat (Figure 27).
Yes; 1%
DK/NR; 7%
No; 92%
Figure 25: “Was there any violence that took place around the local elections in this area?” (Asked only in areas where elections occurred)
Very concerned
; 6%
S/w concerned
; 14%
Not very concerned
; 56%
Not at all concerned
; 21%
DK/NR; 3%
Figure 26: Concerns of Election Violence
4%
4%
5%
6%
6%
13%
16%
20%
20%
22%
24%
28%
35%
42%
Kalimantan
Kalimantan Barat
Sumatra Utara
Kalimantan …
Java Tengah
NTT
NAD
Papua
Java Barat
Papua Barat
Banten
Riau
Java Timur
DKI Jakarta
Figure 27: Percent Very/Somewhat Concerned About Election Violence,
by Province

Page 28
International Foundation for Electoral Systems
34
IV. Women’s Representation in Politics Women still face obstacles to being seriously considered as candidates in political races in Indonesia, as a majority of Indonesians (including more women than not) say that they would vote for a man if that man was running against an equally qualified woman in an election. The qualities that Indonesians look for in female candidates differ significantly from those for candidates in general. Intelligence and lack of corruption are the two leading qualities Indonesians look for in female candidates. More Indonesians than not believe that the proportion of women in legislatures is too low and support the KPU taking actions to enforce quotas designed to increase the number of women in legislative bodies.
Attitudes toward Women as Candidates
There have been several steps taken to promote greater participation by women as candidates in Indonesian politics, the most prominent of which is in introduction of a quota for party lists that specifies that 30% of each party’s list for legislative elections should be comprised of women. The survey data indicates, however, that a majority of Indonesians are still predisposed toward voting for male candidates even in situations with women candidates with equal credentials. When asked who they would support in a choice between a male and female candidate with equal credentials, 54% of Indonesians say they would support the male candidate, and only 14% say they would support the female candidate. Thirty-two percent say that the gender of the candidate would make no difference in their choice. Men are more likely to say that they would vote for male candidates than women (62% versus 47%) while women are more likely to support the female candidate (21% versus 6%). It is notable that even among women, a much higher percentage would support the male candidate over the female candidate (Figure 31), and may indicate the societal prejudices that female candidates still have to overcome to participate effectively in Indonesian politics.
When asked to list qualities of female candidates that would make them more likely to vote for those candidates, intelligence is the main quality respondents say would make them more likely to vote for a female candidate (35%), followed by a lack of corruption (26%), and her experience in politics (20%) (Figure 32). Personality is only mentioned by 1%, a marked contrast to responses on the question in which Indonesians were asked about qualities they like to see in candidates generally. This data points to an interesting situation for female candidates, where the qualities Indonesians look for in female
47%
62%
54%
33%
32%
32%
21%
6%
14%
Female (n=1,358)
Male (n=1,142)
Indonesia Total (n=2,500)
Figure 31: "If you have a choice between a woman candidate and man candidate with equal credentials, who would you likely support?”
Support male candidate No difference Support female candidate
33
Given that election violence is perceived to primarily result from political competition, it is not surprising that responsibility for ensuring that violence does not take place around the election process is felt to lie with the police by the vast majority of Indonesians. When asked about institutions responsible for ensuring that violence does not take place around elections, over three-quarters of Indonesians expect the Indonesian police to be responsible (77%). Fewer respondents believe TNI (5%), KPU (5%), or the KPUD (3%) should be responsible (Figure 30).
While it may be true that the vast majority of the violence that has taken place around the local elections has been caused due to political rivalries, the findings on causes and responsibilities for election violence may reflect an incomplete understanding among most Indonesians of the ways in which poor electoral administration can impact peace and security during the electoral process. Other research conducted on the electoral environment during the local election process suggests that weaknesses in election law, regulations and election administration have been a catalyst for violence during the process. A focus on these areas of election administration could reduce the incidence of violence in future election cycles.
Indonesian police; 77%
TNI; 5%
KPUD; 3%
Others; 2%KPU; 5%
DK/NR; 4%
Council Defender; 2%
Village official; 1%
Figure 30: “In your opinion, which institution is primarily responsible for ensuring that violence does not take place around
the election process?"
Page 29
Indonesia 2010 Survey Report
34
IV. Women’s Representation in Politics Women still face obstacles to being seriously considered as candidates in political races in Indonesia, as a majority of Indonesians (including more women than not) say that they would vote for a man if that man was running against an equally qualified woman in an election. The qualities that Indonesians look for in female candidates differ significantly from those for candidates in general. Intelligence and lack of corruption are the two leading qualities Indonesians look for in female candidates. More Indonesians than not believe that the proportion of women in legislatures is too low and support the KPU taking actions to enforce quotas designed to increase the number of women in legislative bodies.
Attitudes toward Women as Candidates
There have been several steps taken to promote greater participation by women as candidates in Indonesian politics, the most prominent of which is in introduction of a quota for party lists that specifies that 30% of each party’s list for legislative elections should be comprised of women. The survey data indicates, however, that a majority of Indonesians are still predisposed toward voting for male candidates even in situations with women candidates with equal credentials. When asked who they would support in a choice between a male and female candidate with equal credentials, 54% of Indonesians say they would support the male candidate, and only 14% say they would support the female candidate. Thirty-two percent say that the gender of the candidate would make no difference in their choice. Men are more likely to say that they would vote for male candidates than women (62% versus 47%) while women are more likely to support the female candidate (21% versus 6%). It is notable that even among women, a much higher percentage would support the male candidate over the female candidate (Figure 31), and may indicate the societal prejudices that female candidates still have to overcome to participate effectively in Indonesian politics.
When asked to list qualities of female candidates that would make them more likely to vote for those candidates, intelligence is the main quality respondents say would make them more likely to vote for a female candidate (35%), followed by a lack of corruption (26%), and her experience in politics (20%) (Figure 32). Personality is only mentioned by 1%, a marked contrast to responses on the question in which Indonesians were asked about qualities they like to see in candidates generally. This data points to an interesting situation for female candidates, where the qualities Indonesians look for in female
47%
62%
54%
33%
32%
32%
21%
6%
14%
Female (n=1,358)
Male (n=1,142)
Indonesia Total (n=2,500)
Figure 31: "If you have a choice between a woman candidate and man candidate with equal credentials, who would you likely support?”
Support male candidate No difference Support female candidate
33
Given that election violence is perceived to primarily result from political competition, it is not surprising that responsibility for ensuring that violence does not take place around the election process is felt to lie with the police by the vast majority of Indonesians. When asked about institutions responsible for ensuring that violence does not take place around elections, over three-quarters of Indonesians expect the Indonesian police to be responsible (77%). Fewer respondents believe TNI (5%), KPU (5%), or the KPUD (3%) should be responsible (Figure 30).
While it may be true that the vast majority of the violence that has taken place around the local elections has been caused due to political rivalries, the findings on causes and responsibilities for election violence may reflect an incomplete understanding among most Indonesians of the ways in which poor electoral administration can impact peace and security during the electoral process. Other research conducted on the electoral environment during the local election process suggests that weaknesses in election law, regulations and election administration have been a catalyst for violence during the process. A focus on these areas of election administration could reduce the incidence of violence in future election cycles.
Indonesian police; 77%
TNI; 5%
KPUD; 3%
Others; 2%KPU; 5%
DK/NR; 4%
Council Defender; 2%
Village official; 1%
Figure 30: “In your opinion, which institution is primarily responsible for ensuring that violence does not take place around
the election process?"
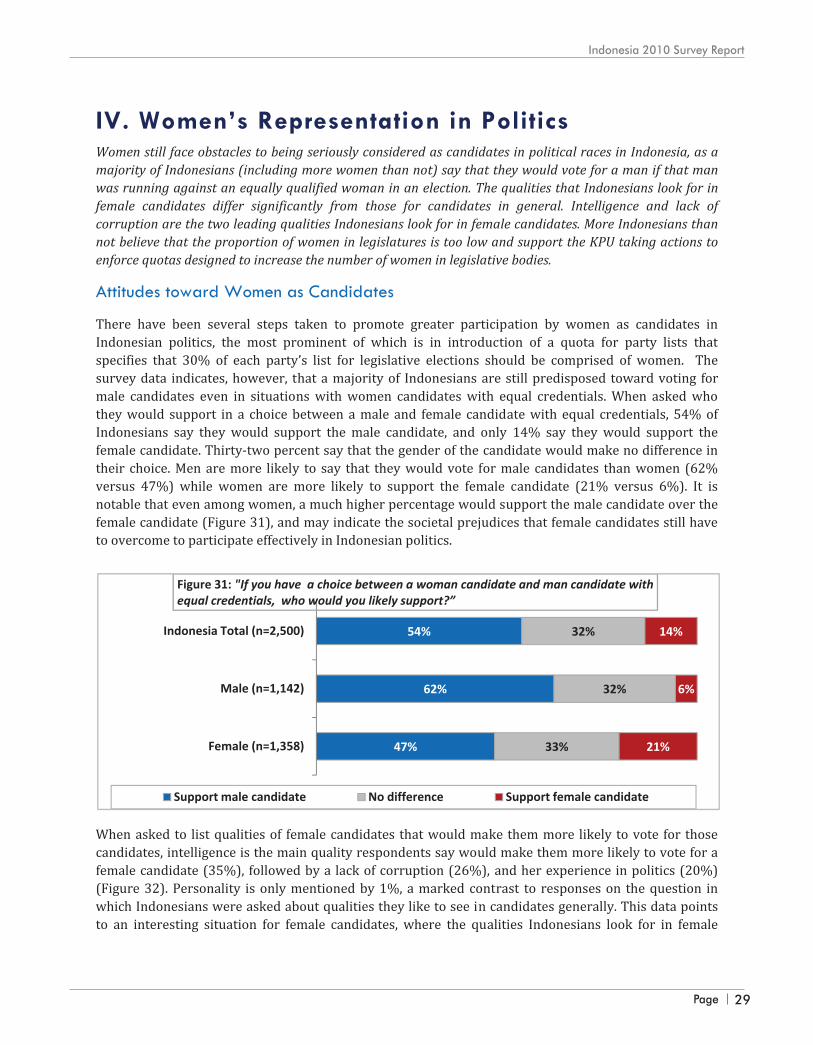

International Foundation for Electoral Systems
Page | 30
candidates that would make them more likely to vote for women are only second-tier qualities that Indonesians look for in politicians generally.
Quotas for Party Lists and Desired KPU Actions to Enforce Quotas
Currently, slightly more than half of the Indonesian population is composed of women, yet only 18% of legislators in the DPR and the regional legislative bodies are women. Respondents were informed about this fact and then asked to comment whether the proportion of women in legislative bodies is too low, too high, or about right. A plurality of Indonesians (41%) believe there is too low a proportion of women in elected positions, while 38% believe the proportion is just right, 4% say the proportion is too high, and 18% say they don’t know (Figure 33). There is little difference between men and women on this issue.
The 30% quota for women on party lists is one step that has been taken to try to increase the number of women elected to legislative bodies. This survey as well as previous IFES surveys in Indonesia, find that the vast majority of Indonesians agree with this quota. Sixty-nine percent of respondents in this survey somewhat agree with this quota and 5% strongly agree. Only 12% somewhat disagree and less than 1%
Figure 32: Favorable Qualities of Female Candidates
Percent of Cases
Intelligence 35%
No corruption 26%
Experience in politics 20%
Religious background 5%
Beauty/attractiveness 2%
Party affiliation 2%
Family history 1%
Attention to people 1%
Personality 1%
Strong 1%
Too low a proportion of women ,
41%Proportion of women about right
, 38%
Too high a proportion of women,
4%
DK/NR, 18%
Figure 33: Opinions on Proportion of Women in Elected Positions

Page 30
International Foundation for Electoral Systems
36
strongly disagree with the quota. There are not large differences of opinion on the gender quota: 75% of women and 71% of men agree with the quota, while 10% of women disagree and 14% of men disagree (Figure 34).
Respondents were also asked to voice their opinion on steps the KPU should take to ensure that all parties abide by the 30% quota in legislative elections. Respondents were presented with three different ways the KPU could enforce the quota and asked to choose one. Thirty-three percent of respondents believe the KPU should enforce the quota by announcing in the media the parties who do not meet the quota, 30% believe the KPU should reject party lists that do not meet quota requirements and ask for party lists to be resubmitted, and 14% advocate the most punitive step and believe the KPU should penalize parties who do not meet the quota by not letting them run in the election in the districts where the quota was not met. Twenty-two percent say they don’t know what steps the KPU should take (Figure 35).
The survey also sought to gauge the attractiveness of several arguments that have been forwarded to justify efforts to increase women’s representation in politics. Respondents were asked whether they agree or disagree with each of these arguments. There was strong agreement with all of the statements provided to respondents. Seventy-six percent of Indonesians strongly/somewhat agree, “We should take
3%
6%
5%
68%
69%
69%
14%
16%
15%
14%
10%
12%
Male (n=1,142)
Female (n=1,358)
Indonesia Total (n=2,500)
Figure 34: Agreement with Gender Quota, by Gender
Strongly agree Somewhat agree DK/NR Somewhat disagree Strongly disagree
KPU should announce the
parties that do no meet the 30%
requirement in the media; 33%
KPU should reject party lists that don’t meet the
requirements and ask parties to resubmit list meeting 30%
requirement; 31%
DK/NR; 22%
KPU should penalize parties that fail to meet requirement
by not allowing them to run in
election in districts where they do no meet quota ; 14%
Figure 35: “Which of the following steps do you think the KPU should take to ensure that political parties meet the 30% requirement for women on their
lists?”
35
candidates that would make them more likely to vote for women are only second-tier qualities that Indonesians look for in politicians generally.
Quotas for Party Lists and Desired KPU Actions to Enforce Quotas
Currently, slightly more than half of the Indonesian population is composed of women, yet only 18% of legislators in the DPR and the regional legislative bodies are women. Respondents were informed about this fact and then asked to comment whether the proportion of women in legislative bodies is too low, too high, or about right. A plurality of Indonesians (41%) believe there is too low a proportion of women in elected positions, while 38% believe the proportion is just right, 4% say the proportion is too high, and 18% say they don’t know (Figure 33). There is little difference between men and women on this issue. The 30% quota for women on party lists is one step that has been taken to try to increase the number of women elected to legislative bodies. This survey as well as previous IFES surveys in Indonesia, find that the vast majority of Indonesians agree with this quota. Sixty-nine percent of respondents in this survey somewhat agree with this quota and 5% strongly agree. Only 12% somewhat disagree and less than 1%
Figure 32: Favorable Qualities of Female Candidates
Percent of Cases
Intelligence 35%
No corruption 26%
Experience in politics 20%
Religious background 5%
Beauty/attractiveness 2%
Party affiliation 2%
Family history 1%
Attention to people 1%
Personality 1%
Strong 1%
Too low a proportion of women ;
41%Proportion of wTomen about right
; 38%df
Too high a proportion of women;
4%
DK/NR; 18%
Figure 33: Opinions on Proportion of Women in Elected Positions
Page 31
Indonesia 2010 Survey Report
36
strongly disagree with the quota. There are not large differences of opinion on the gender quota: 75% of women and 71% of men agree with the quota, while 10% of women disagree and 14% of men disagree (Figure 34).
Respondents were also asked to voice their opinion on steps the KPU should take to ensure that all parties abide by the 30% quota in legislative elections. Respondents were presented with three different ways the KPU could enforce the quota and asked to choose one. Thirty-three percent of respondents believe the KPU should enforce the quota by announcing in the media the parties who do not meet the quota, 30% believe the KPU should reject party lists that do not meet quota requirements and ask for party lists to be resubmitted, and 14% advocate the most punitive step and believe the KPU should penalize parties who do not meet the quota by not letting them run in the election in the districts where the quota was not met. Twenty-two percent say they don’t know what steps the KPU should take (Figure 35).
The survey also sought to gauge the attractiveness of several arguments that have been forwarded to justify efforts to increase women’s representation in politics. Respondents were asked whether they agree or disagree with each of these arguments. There was strong agreement with all of the statements provided to respondents. Seventy-six percent of Indonesians strongly/somewhat agree, “We should take
3%
6%
5%
68%
69%
69%
14%
16%
15%
14%
10%
12%
Male (n=1,142)
Female (n=1,358)
Indonesia Total (n=2,500)
Figure 34: Agreement with Gender Quota, by Gender
Strongly agree Somewhat agree DK/NR Somewhat disagree Strongly disagree
KPU should announce the
parties that do no meet the 30%
requirement in the media; 33%
KPU should reject party lists that don’t meet the
requirements and ask parties to resubmit list meeting 30%
requirement; 31%
DK/NR; 22%
KPU should penalize parties that fail to meet requirement
by not allowing them to run in
election in districts where they do no meet quota ; 14%
Figure 35: “Which of the following steps do you think the KPU should take to ensure that political parties meet the 30% requirement for women on their
lists?”
35
candidates that would make them more likely to vote for women are only second-tier qualities that Indonesians look for in politicians generally.
Quotas for Party Lists and Desired KPU Actions to Enforce Quotas
Currently, slightly more than half of the Indonesian population is composed of women, yet only 18% of legislators in the DPR and the regional legislative bodies are women. Respondents were informed about this fact and then asked to comment whether the proportion of women in legislative bodies is too low, too high, or about right. A plurality of Indonesians (41%) believe there is too low a proportion of women in elected positions, while 38% believe the proportion is just right, 4% say the proportion is too high, and 18% say they don’t know (Figure 33). There is little difference between men and women on this issue. The 30% quota for women on party lists is one step that has been taken to try to increase the number of women elected to legislative bodies. This survey as well as previous IFES surveys in Indonesia, find that the vast majority of Indonesians agree with this quota. Sixty-nine percent of respondents in this survey somewhat agree with this quota and 5% strongly agree. Only 12% somewhat disagree and less than 1%
Figure 32: Favorable Qualities of Female Candidates
Percent of Cases
Intelligence 35%
No corruption 26%
Experience in politics 20%
Religious background 5%
Beauty/attractiveness 2%
Party affiliation 2%
Family history 1%
Attention to people 1%
Personality 1%
Strong 1%
Too low a proportion of women ;
41%Proportion of wTomen about right
; 38%df
Too high a proportion of women;
4%
DK/NR; 18%
Figure 33: Opinions on Proportion of Women in Elected Positions
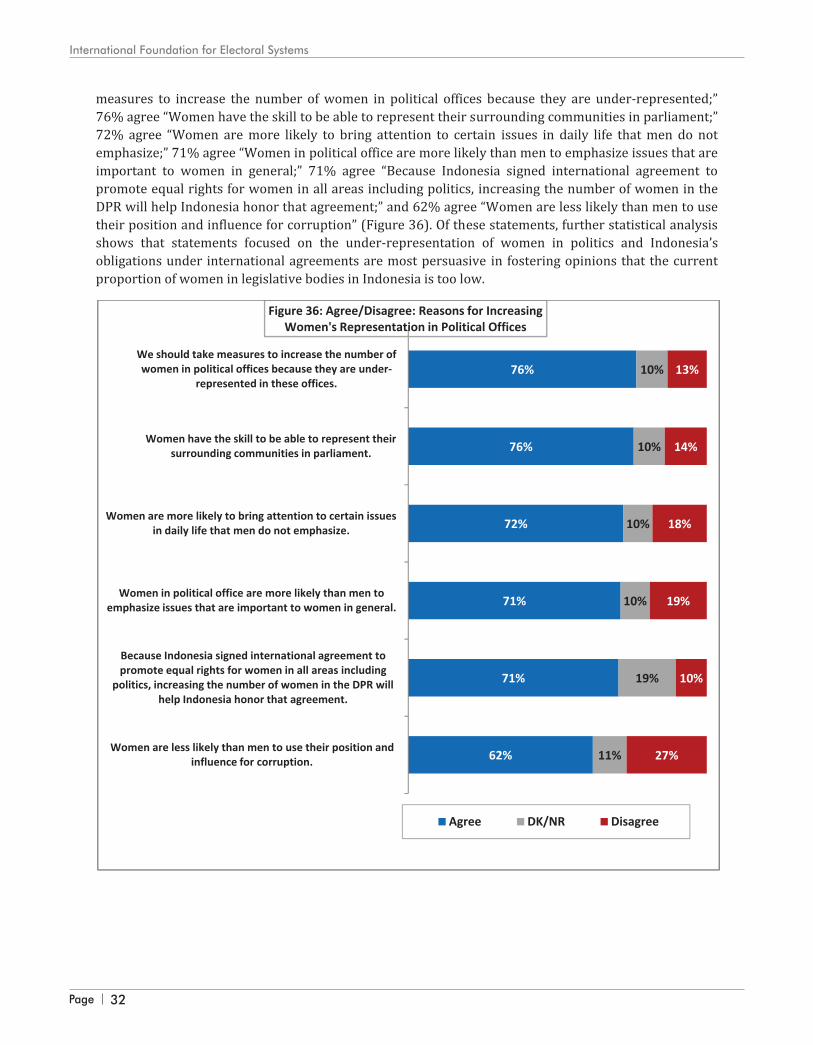
Page 32
International Foundation for Electoral Systems
38
V. Opinions on Democracy and New Election Issues A significant percentage of Indonesians are not able to express what it means to live in a democracy, but among those who can the vast majority values democracy and believes that Indonesia is a democracy. Most Indonesians support a proposed initiative to bar election commissioners from joining a political party for five years after they resign their KPU membership, and the vast majority also supports independence and electoral expertise for members of the KPU. The vast majority of Indonesians support voting directly for candidates over voting for parties that then pick their representatives. The majority of Indonesians also believe that there should be fewer number of parties in the DPR in order to increase its effectiveness.
Opinions on Democracy
Even though Indonesia has had democratic governance since 1999, the survey finds that a large percentage of Indonesians are not able to define what democracy means. More than four in ten Indonesians (41%, Figure 37) do not know what it means to live in a democracy.
Among those who do provide a response, freedom is the most frequently-cited response (38%), followed by other definitions such as harmony (4%), having individual opportunity (2%), and power in citizens’ hands (2%). Inability to provide a definition for democracy is relatively equal among residents of urban and rural areas, but it rises with a decrease in socio-economic status and in education levels. Those aged 45 and older are much more likely not to provide a response than those 18-44 (50% versus 36%).
Figure 37: “What do you think it means to live in a democracy?”
Percent of Cases
Freedom 38%
Harmony 4%
Have individual opportunity 2%
Power in people, citizens hands 2%
Government protect society 1%
Mutual respect/Variety but unity 1%
Consensus for agreement 1%
Emphasize common interest, not personal <1%
Good economics in each region <1%
Don’t know 41%
37
measures to increase the number of women in political offices because they are under-represented;” 76% agree “Women have the skill to be able to represent their surrounding communities in parliament;” 72% agree “Women are more likely to bring attention to certain issues in daily life that men do not emphasize;” 71% agree “Women in political office are more likely than men to emphasize issues that are important to women in general;” 71% agree “Because Indonesia signed international agreement to promote equal rights for women in all areas including politics, increasing the number of women in the DPR will help Indonesia honor that agreement;” and 62% agree “Women are less likely than men to use their position and influence for corruption” (Figure 36). Of these statements, further statistical analysis shows that statements focused on the under-representation of women in politics and Indonesia’s obligations under international agreements are most persuasive in fostering opinions that the current proportion of women in legislative bodies in Indonesia is too low.
62%
71%
71%
72%
76%
76%
11%
19%
10%
10%
10%
10%
27%
10%
19%
18%
14%
13%
Women are less likely than men to use their position and influence for corruption.
Because Indonesia signed international agreement to promote equal rights for women in all areas including
politics, increasing the number of women in the DPR will help Indonesia honor that agreement.
Women in political office are more likely than men to emphasize issues that are important to women in general.
Women are more likely to bring attention to certain issues in daily life that men do not emphasize.
Women have the skill to be able to represent their surrounding communities in parliament.
We should take measures to increase the number of women in political offices because they are under-
represented in these offices.
Figure 36: Agree/Disagree: Reasons for Increasing Women's Representation in Political Offices
Agree DK/NR Disagree
Page 33
Indonesia 2010 Survey Report
38
V. Opinions on Democracy and New Election Issues A significant percentage of Indonesians are not able to express what it means to live in a democracy, but among those who can the vast majority values democracy and believes that Indonesia is a democracy. Most Indonesians support a proposed initiative to bar election commissioners from joining a political party for five years after they resign their KPU membership, and the vast majority also supports independence and electoral expertise for members of the KPU. The vast majority of Indonesians support voting directly for candidates over voting for parties that then pick their representatives. The majority of Indonesians also believe that there should be fewer number of parties in the DPR in order to increase its effectiveness.
Opinions on Democracy
Even though Indonesia has had democratic governance since 1999, the survey finds that a large percentage of Indonesians are not able to define what democracy means. More than four in ten Indonesians (41%, Figure 37) do not know what it means to live in a democracy.
Among those who do provide a response, freedom is the most frequently-cited response (38%), followed by other definitions such as harmony (4%), having individual opportunity (2%), and power in citizens’ hands (2%). Inability to provide a definition for democracy is relatively equal among residents of urban and rural areas, but it rises with a decrease in socio-economic status and in education levels. Those aged 45 and older are much more likely not to provide a response than those 18-44 (50% versus 36%).
Figure 37: “What do you think it means to live in a democracy?”
Percent of Cases
Freedom 38%
Harmony 4%
Have individual opportunity 2%
Power in people, citizens hands 2%
Government protect society 1%
Mutual respect/Variety but unity 1%
Consensus for agreement 1%
Emphasize common interest, not personal <1%
Good economics in each region <1%
Don’t know 41%
37
measures to increase the number of women in political offices because they are under-represented;” 76% agree “Women have the skill to be able to represent their surrounding communities in parliament;” 72% agree “Women are more likely to bring attention to certain issues in daily life that men do not emphasize;” 71% agree “Women in political office are more likely than men to emphasize issues that are important to women in general;” 71% agree “Because Indonesia signed international agreement to promote equal rights for women in all areas including politics, increasing the number of women in the DPR will help Indonesia honor that agreement;” and 62% agree “Women are less likely than men to use their position and influence for corruption” (Figure 36). Of these statements, further statistical analysis shows that statements focused on the under-representation of women in politics and Indonesia’s obligations under international agreements are most persuasive in fostering opinions that the current proportion of women in legislative bodies in Indonesia is too low.
62%
71%
71%
72%
76%
76%
11%
19%
10%
10%
10%
10%
27%
10%
19%
18%
14%
13%
Women are less likely than men to use their position and influence for corruption.
Because Indonesia signed international agreement to promote equal rights for women in all areas including
politics, increasing the number of women in the DPR will help Indonesia honor that agreement.
Women in political office are more likely than men to emphasize issues that are important to women in general.
Women are more likely to bring attention to certain issues in daily life that men do not emphasize.
Women have the skill to be able to represent their surrounding communities in parliament.
We should take measures to increase the number of women in political offices because they are under-
represented in these offices.
Figure 36: Agree/Disagree: Reasons for Increasing Women's Representation in Political Offices
Agree DK/NR Disagree
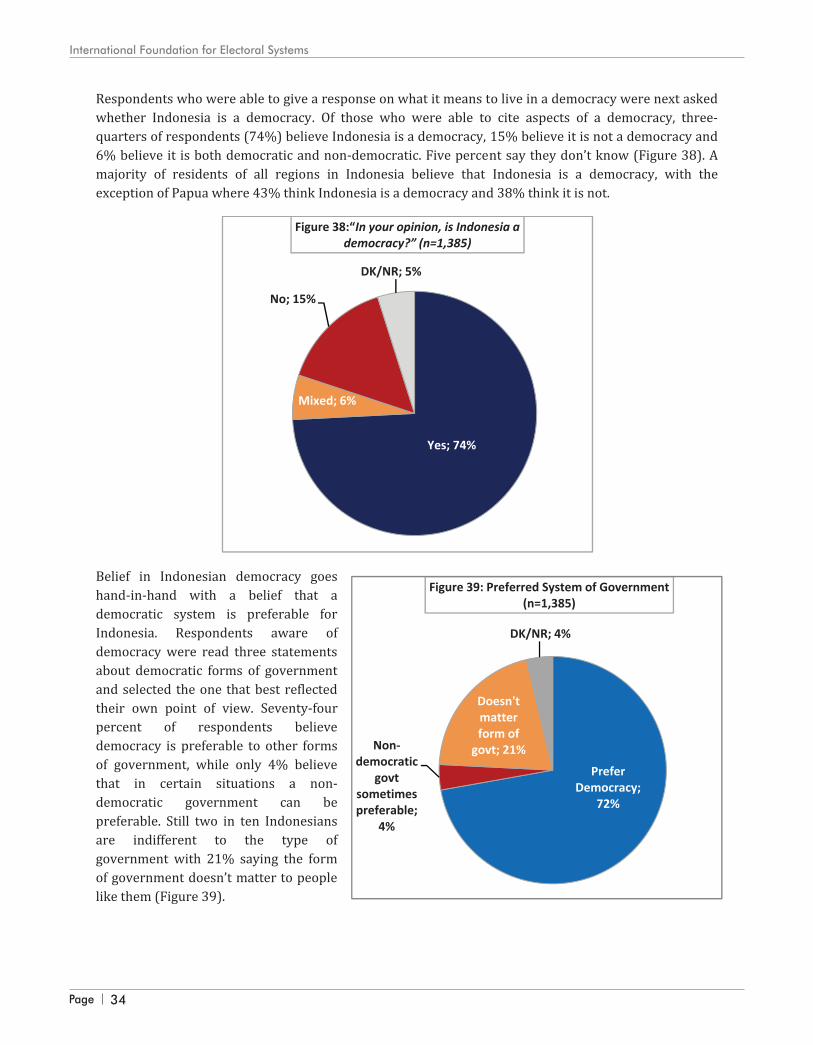
Page 34
International Foundation for Electoral Systems
40
Strongly support; 5%
S/w support; 57%
S/w oppose; 16%
Strongly oppose; 1%
DK/NR; 21%
Figure 40: Support for 5-Year Period between KPU and Political Party Membership
As with opinions on whether Indonesia is a democracy, residents of Papua and West Papua diverge from other Indonesians on whether democracy is a preferred system of government for Indonesia. While a majority of Indonesians in other regions of the country cite democracy as a preferred system of government, 75% of respondents in Papua and West Papua say that it does not matter to people like them what kind of government Indonesia has. Preference for democratic governments increases with educational attainment, and residents of rural areas are more likely to cite a preference for democracy than those in urban areas (75% versus 65%).
Opinions on Electoral Reform Issues
In the year since the 2009 Presidential and legislative elections, Indonesia has started the process of addressing a number of critical issues related to the election process. This survey asked respondents to voice their opinions on some of these issues, and the results reflect an interesting set of viewpoints on the election process in Indonesia. One of the key points of discussion has been regarding election management bodies in Indonesia and whether members of political parties should be able to resign their party membership and become election commissioners, or whether election commissioners should be able to join political parties directly after leaving the election commission. This latter issue emerged in public debate due to a former member of the KPU leaving her position and joining the Partai Demokrat, raising issues of undue political influence on the management of elections. This has led to discussion among some legislators that laws should be passed that bar election commissioners from joining a political party for five years after they leave the commission. The survey finds that the majority of Indonesians support this move (Figure 40). Sixty-one percent either strongly or somewhat support barring election commissioners from joining political parties for five years after they leave the KPU, while only 17% oppose this move. A majority in all regions of Indonesia support this initiative with the exception of those in Sulawesi (49%) and Papua (33%). Indonesians’ views on the limiting of political influence on election commissioners are confirmed by data on a question focusing on the characteristics of the preferred membership of the election commission. When given some statements about election commissioners, positive statements about the independence and expertise of electoral commissioners gained widespread agreement (Figure 41). Ninety one percent of Indonesians agree that the electoral process should be managed by experts in the electoral field, 90% agreed that the management of election process in Indonesia should be led by people who are impartial, and 83% agreed that members of the commission should not hold certain political views in managing elections. The data shows that the level of agreement on the statement that former members of political parties can organize credible elections is lower (67%) compared to other statements.
39
Respondents who were able to give a response on what it means to live in a democracy were next asked whether Indonesia is a democracy. Of those who were able to cite aspects of a democracy, three-quarters of respondents (74%) believe Indonesia is a democracy, 15% believe it is not a democracy and 6% believe it is both democratic and non-democratic. Five percent say they don’t know (Figure 38). A majority of residents of all regions in Indonesia believe that Indonesia is a democracy, with the exception of Papua where 43% think Indonesia is a democracy and 38% think it is not.
Belief in Indonesian democracy goes hand-in-hand with a belief that a democratic system is preferable for Indonesia. Respondents aware of democracy were read three statements about democratic forms of government and selected the one that best reflected their own point of view. Seventy-four percent of respondents believe democracy is preferable to other forms of government, while only 4% believe that in certain situations a non-democratic government can be preferable. Still two in ten Indonesians are indifferent to the type of government with 21% saying the form of government doesn’t matter to people like them (Figure 39).
Yes; 74%
Mixed; 6%
No; 15%
DK/NR; 5%
Figure 38:“In your opinion, is Indonesia a democracy?” (n=1,385)
Prefer Democracy;
72%
Non-democratic
govt sometimes preferable;
4%
Doesn't matter form of
govt; 21%
DK/NR; 4%
Figure 39: Preferred System of Government (n=1,385)
Page 35
Indonesia 2010 Survey Report
40
Strongly support; 5%
S/w support; 57%
S/w oppose; 16%
Strongly oppose; 1%
DK/NR; 21%
Figure 40: Support for 5-Year Period between KPU and Political Party Membership
As with opinions on whether Indonesia is a democracy, residents of Papua and West Papua diverge from other Indonesians on whether democracy is a preferred system of government for Indonesia. While a majority of Indonesians in other regions of the country cite democracy as a preferred system of government, 75% of respondents in Papua and West Papua say that it does not matter to people like them what kind of government Indonesia has. Preference for democratic governments increases with educational attainment, and residents of rural areas are more likely to cite a preference for democracy than those in urban areas (75% versus 65%).
Opinions on Electoral Reform Issues
In the year since the 2009 Presidential and legislative elections, Indonesia has started the process of addressing a number of critical issues related to the election process. This survey asked respondents to voice their opinions on some of these issues, and the results reflect an interesting set of viewpoints on the election process in Indonesia. One of the key points of discussion has been regarding election management bodies in Indonesia and whether members of political parties should be able to resign their party membership and become election commissioners, or whether election commissioners should be able to join political parties directly after leaving the election commission. This latter issue emerged in public debate due to a former member of the KPU leaving her position and joining the Partai Demokrat, raising issues of undue political influence on the management of elections. This has led to discussion among some legislators that laws should be passed that bar election commissioners from joining a political party for five years after they leave the commission. The survey finds that the majority of Indonesians support this move (Figure 40). Sixty-one percent either strongly or somewhat support barring election commissioners from joining political parties for five years after they leave the KPU, while only 17% oppose this move. A majority in all regions of Indonesia support this initiative with the exception of those in Sulawesi (49%) and Papua (33%). Indonesians’ views on the limiting of political influence on election commissioners are confirmed by data on a question focusing on the characteristics of the preferred membership of the election commission. When given some statements about election commissioners, positive statements about the independence and expertise of electoral commissioners gained widespread agreement (Figure 41). Ninety one percent of Indonesians agree that the electoral process should be managed by experts in the electoral field, 90% agreed that the management of election process in Indonesia should be led by people who are impartial, and 83% agreed that members of the commission should not hold certain political views in managing elections. The data shows that the level of agreement on the statement that former members of political parties can organize credible elections is lower (67%) compared to other statements.
39
Respondents who were able to give a response on what it means to live in a democracy were next asked whether Indonesia is a democracy. Of those who were able to cite aspects of a democracy, three-quarters of respondents (74%) believe Indonesia is a democracy, 15% believe it is not a democracy and 6% believe it is both democratic and non-democratic. Five percent say they don’t know (Figure 38). A majority of residents of all regions in Indonesia believe that Indonesia is a democracy, with the exception of Papua where 43% think Indonesia is a democracy and 38% think it is not.
Belief in Indonesian democracy goes hand-in-hand with a belief that a democratic system is preferable for Indonesia. Respondents aware of democracy were read three statements about democratic forms of government and selected the one that best reflected their own point of view. Seventy-four percent of respondents believe democracy is preferable to other forms of government, while only 4% believe that in certain situations a non-democratic government can be preferable. Still two in ten Indonesians are indifferent to the type of government with 21% saying the form of government doesn’t matter to people like them (Figure 39).
Yes; 74%
Mixed; 6%
No; 15%
DK/NR; 5%
Figure 38:“In your opinion, is Indonesia a democracy?” (n=1,385)
Prefer Democracy;
72%
Non-democratic
govt sometimes preferable;
4%
Doesn't matter form of
govt; 21%
DK/NR; 4%
Figure 39: Preferred System of Government (n=1,385)
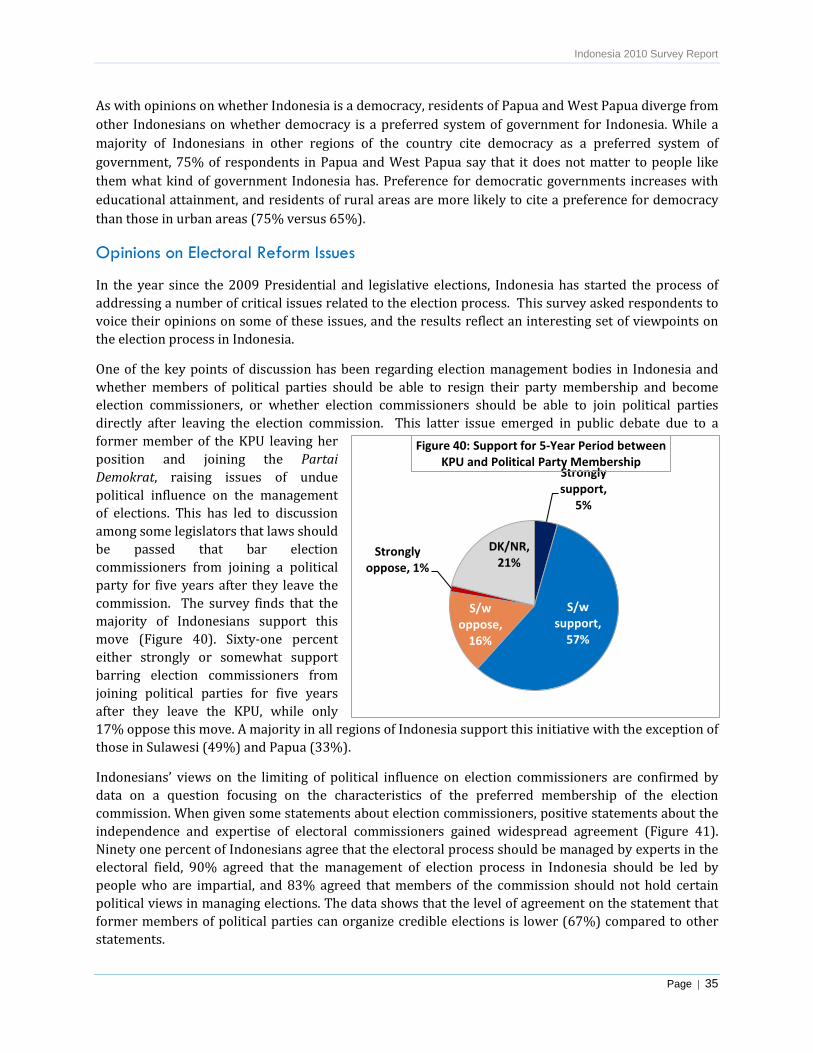
Indonesia 2010 Survey Report
Page | 35
Strongly support,
5%
S/w support,
57%
S/w oppose,
16%
Strongly oppose, 1%
DK/NR, 21%
Figure 40: Support for 5-Year Period between KPU and Political Party Membership
As with opinions on whether Indonesia is a democracy, residents of Papua and West Papua diverge from other Indonesians on whether democracy is a preferred system of government for Indonesia. While a majority of Indonesians in other regions of the country cite democracy as a preferred system of government, 75% of respondents in Papua and West Papua say that it does not matter to people like them what kind of government Indonesia has. Preference for democratic governments increases with educational attainment, and residents of rural areas are more likely to cite a preference for democracy than those in urban areas (75% versus 65%).
Opinions on Electoral Reform Issues
In the year since the 2009 Presidential and legislative elections, Indonesia has started the process of addressing a number of critical issues related to the election process. This survey asked respondents to voice their opinions on some of these issues, and the results reflect an interesting set of viewpoints on the election process in Indonesia.
One of the key points of discussion has been regarding election management bodies in Indonesia and whether members of political parties should be able to resign their party membership and become election commissioners, or whether election commissioners should be able to join political parties directly after leaving the election commission. This latter issue emerged in public debate due to a former member of the KPU leaving her position and joining the Partai Demokrat, raising issues of undue political influence on the management of elections. This has led to discussion among some legislators that laws should be passed that bar election commissioners from joining a political party for five years after they leave the commission. The survey finds that the majority of Indonesians support this move (Figure 40). Sixty-one percent either strongly or somewhat support barring election commissioners from joining political parties for five years after they leave the KPU, while only 17% oppose this move. A majority in all regions of Indonesia support this initiative with the exception of those in Sulawesi (49%) and Papua (33%).
Indonesians’ views on the limiting of political influence on election commissioners are confirmed by data on a question focusing on the characteristics of the preferred membership of the election commission. When given some statements about election commissioners, positive statements about the independence and expertise of electoral commissioners gained widespread agreement (Figure 41). Ninety one percent of Indonesians agree that the electoral process should be managed by experts in the electoral field, 90% agreed that the management of election process in Indonesia should be led by people who are impartial, and 83% agreed that members of the commission should not hold certain political views in managing elections. The data shows that the level of agreement on the statement that former members of political parties can organize credible elections is lower (67%) compared to other statements.
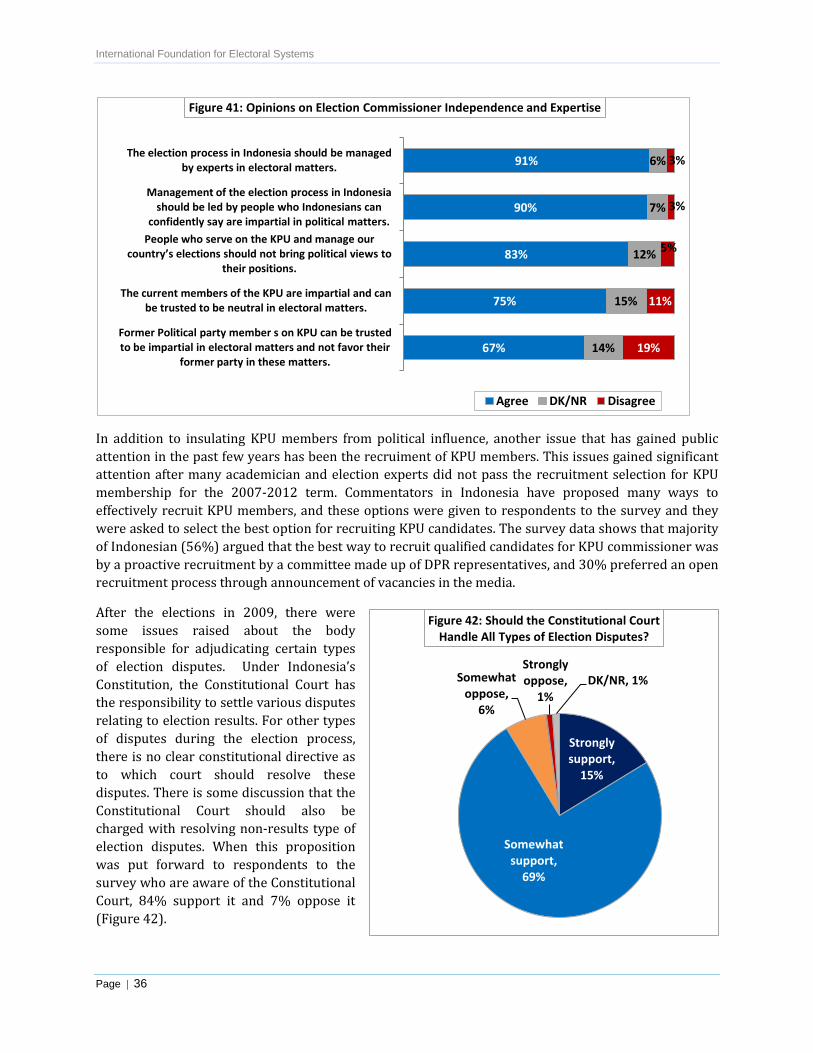
International Foundation for Electoral Systems
Page | 36
In addition to insulating KPU members from political influence, another issue that has gained public attention in the past few years has been the recruiment of KPU members. This issues gained significant attention after many academician and election experts did not pass the recruitment selection for KPU membership for the 2007-2012 term. Commentators in Indonesia have proposed many ways to effectively recruit KPU members, and these options were given to respondents to the survey and they were asked to select the best option for recruiting KPU candidates. The survey data shows that majority of Indonesian (56%) argued that the best way to recruit qualified candidates for KPU commissioner was by a proactive recruitment by a committee made up of DPR representatives, and 30% preferred an open recruitment process through announcement of vacancies in the media.
After the elections in 2009, there were some issues raised about the body responsible for adjudicating certain types of election disputes. Under Indonesia’s Constitution, the Constitutional Court has the responsibility to settle various disputes relating to election results. For other types of disputes during the election process, there is no clear constitutional directive as to which court should resolve these disputes. There is some discussion that the Constitutional Court should also be charged with resolving non-results type of election disputes. When this proposition was put forward to respondents to the survey who are aware of the Constitutional Court, 84% support it and 7% oppose it (Figure 42).
67%
75%
83%
90%
91%
14%
15%
12%
7%
6%
19%
11%
5%
3%
3%
Former Political party member s on KPU can be trusted to be impartial in electoral matters and not favor their
former party in these matters.
The current members of the KPU are impartial and can be trusted to be neutral in electoral matters.
People who serve on the KPU and manage our country’s elections should not bring political views to
their positions.
Management of the election process in Indonesia should be led by people who Indonesians can
confidently say are impartial in political matters.
The election process in Indonesia should be managed by experts in electoral matters.
Figure 41: Opinions on Election Commissioner Independence and Expertise
Agree DK/NR Disagree
Strongly support,
15%
Somewhat support,
69%
Somewhat oppose,
6%
Strongly oppose,
1%DK/NR, 1%
Figure 42: Should the Constitutional Court Handle All Types of Election Disputes?
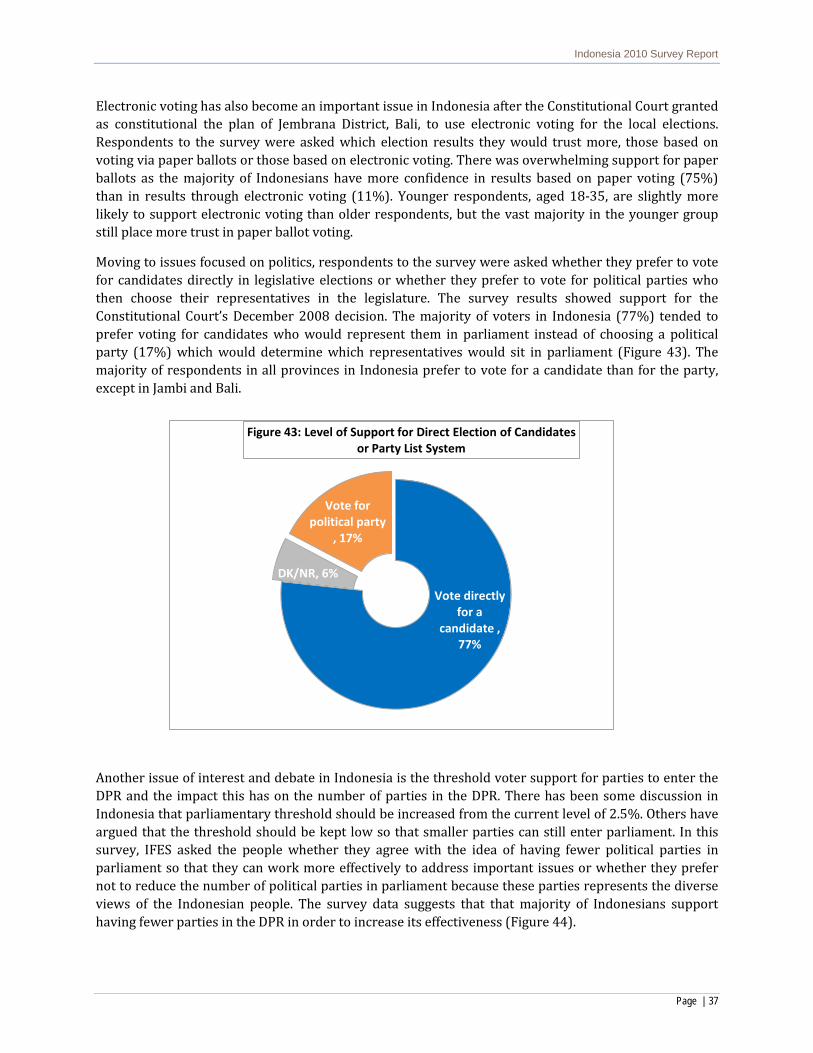
Indonesia 2010 Survey Report
Page | 37
Electronic voting has also become an important issue in Indonesia after the Constitutional Court granted as constitutional the plan of Jembrana District, Bali, to use electronic voting for the local elections. Respondents to the survey were asked which election results they would trust more, those based on voting via paper ballots or those based on electronic voting. There was overwhelming support for paper ballots as the majority of Indonesians have more confidence in results based on paper voting (75%) than in results through electronic voting (11%). Younger respondents, aged 18-35, are slightly more likely to support electronic voting than older respondents, but the vast majority in the younger group still place more trust in paper ballot voting.
Moving to issues focused on politics, respondents to the survey were asked whether they prefer to vote for candidates directly in legislative elections or whether they prefer to vote for political parties who then choose their representatives in the legislature. The survey results showed support for the Constitutional Court’s December 2008 decision. The majority of voters in Indonesia (77%) tended to prefer voting for candidates who would represent them in parliament instead of choosing a political party (17%) which would determine which representatives would sit in parliament (Figure 43). The majority of respondents in all provinces in Indonesia prefer to vote for a candidate than for the party, except in Jambi and Bali.
Another issue of interest and debate in Indonesia is the threshold voter support for parties to enter the DPR and the impact this has on the number of parties in the DPR. There has been some discussion in Indonesia that parliamentary threshold should be increased from the current level of 2.5%. Others have argued that the threshold should be kept low so that smaller parties can still enter parliament. In this survey, IFES asked the people whether they agree with the idea of having fewer political parties in parliament so that they can work more effectively to address important issues or whether they prefer not to reduce the number of political parties in parliament because these parties represents the diverse views of the Indonesian people. The survey data suggests that that majority of Indonesians support having fewer parties in the DPR in order to increase its effectiveness (Figure 44).
Vote directly for a
candidate , 77%
DK/NR, 6%
Vote for political party
, 17%
Figure 43: Level of Support for Direct Election of Candidatesor Party List System
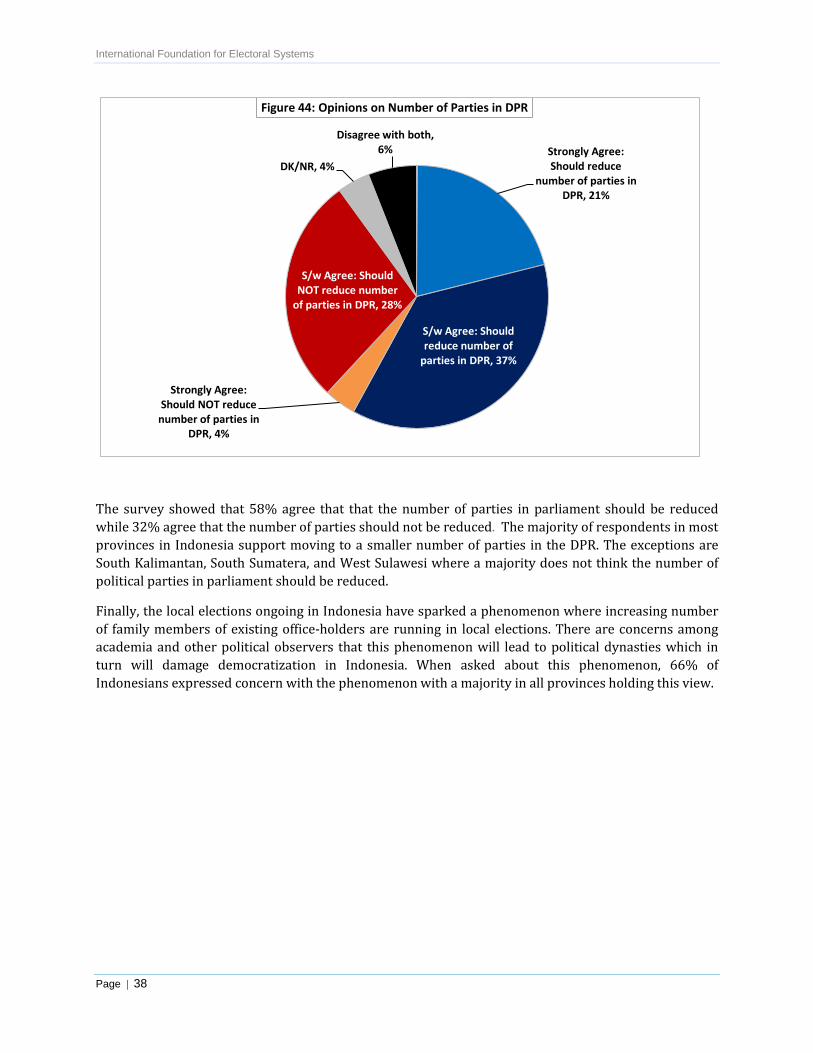
International Foundation for Electoral Systems
Page | 38
The survey showed that 58% agree that that the number of parties in parliament should be reduced while 32% agree that the number of parties should not be reduced. The majority of respondents in most provinces in Indonesia support moving to a smaller number of parties in the DPR. The exceptions are South Kalimantan, South Sumatera, and West Sulawesi where a majority does not think the number of political parties in parliament should be reduced.
Finally, the local elections ongoing in Indonesia have sparked a phenomenon where increasing number of family members of existing office-holders are running in local elections. There are concerns among academia and other political observers that this phenomenon will lead to political dynasties which in turn will damage democratization in Indonesia. When asked about this phenomenon, 66% of Indonesians expressed concern with the phenomenon with a majority in all provinces holding this view.
Strongly Agree: Should reduce
number of parties in DPR, 21%
S/w Agree: Should reduce number of
parties in DPR, 37%
Strongly Agree: Should NOT reduce
number of parties in DPR, 4%
S/w Agree: Should NOT reduce number
of parties in DPR, 28%
DK/NR, 4%
Disagree with both, 6%
Figure 44: Opinions on Number of Parties in DPR