20 Countries With the Largest Foreign Exchange Reserves - Rediff

INTERNATIONALFOREIGN EXCHANGERESERVES
����������������
Celebrating the BNB 130th Anniversary
INTERNATIONAL
FOREIGN EXCHANGE
RESERVESEdited by Tsvetan Manchev,
Doctor in Economics
2009
BULGARIAN
NATIONAL
BANK
2
International Foreign Exchange Reserves
© The Bulgarian National Bank, 2009
© 2009 by Tsvetan Manchev et al.
ISBN 978-954-8579-30-8
Published by the Bulgarian National Bank1, Knyaz Alexander I Square1000 Sofiatelephone +359 2 9145-750facsimile +359 2 980 2425, 980 6493www.bnb.bg
Abbreviations
BNB − the Bulgarian National BankGDP − gross domestic productBIS − the Bank for International Settlementsb.p. − basis pointsEIB − the European Investment BankEC − the European CommissionEU − the European UnionESCB − the European System of Central BanksECB − the European Central BankLBNB − the Law on the Bulgarian National BankМ1 − narrow moneyМ2 − М1 plus quasi moneyМ3 − broad moneyIMF − the International Monetary FundERMII − Exchange Rate Mechanism IIFed − the Federal Reserve System
International Foreign Exchange Reserves
3
Contents
Introduction .........................................................11
PART ONE. THE THEORETICAL FOUNDATIONS
Chapter 1. Nature and Function ..........................................19
1. Definition .............................................................19
2. Gold as a Foreign Reserve Assets ......................20
3. Reasons to Own and Use Foreign Reserves ......23
4. The Functions of Foreign Reserves .....................24
5. Exchange Rate Policy, Monetary Policy,and Foreign Reserves .........................................26
6. Foreign Reserve Adequacy ................................31
Chapter 2. Financial Asset Risk and Return ........................36
1. Financial Assets ..................................................36
2. Types of Asset Risk.............................................37
3. Financial Asset Return. The Yield Curve .............41
3.1. Return ..........................................................41
3.2. Yield Curve ...................................................42
3.3. Yield Curve Theories and Empirical Evidence ......................................................47
4. Fundamentals of the Contemporary PortfolioManagement Theory ...........................................53
Chapter 3. Process Organization .........................................55
1. Stages .................................................................57
2. Central Bank Investment Objectives ...................58
3. Strategic Asset Allocation ...................................59
4. Tactical Asset Allocation .....................................64
4
International Foreign Exchange Reserves
PART TWO. EXPERIENCE OF THE BNB IN MANAGINGFOREIGN EXCHANGE RESERVES UNDERCURRENCY BOARD ARRANGEMENT
Chapter 4. The Nature and Significance of Foreign
Reserves under a Currency Board
Arrangement .......................................................71
1. The Definition of International Foreign ExchangeReserves in the Law on the BNB of 1997 ............71
2. Peculiarities of the Bulgarian Currency Board
as a Monetary and Foreign Exchange Regime ...74
3. Objectives and Major Functions of ForeignReserves in the 1997 Law on the BNB ................78
Chapter 5. BNB Policy in Managing Monetary Gold ...........80
Chapter 6. Institutional Arrangements of the Investment
Process at the BNB ............................................85
1. Organisational Structure .....................................85
2. Decision Making and Compliance Control ..........91
Chapter 7. Choice of Investment Objectives
and Investment Constraints ...............................97
1. Investment Objectives ........................................97
2. Risk Management Limits and InvestmentGuidelines of the BNB .......................................111
Chapter 8. Strategic Asset Allocation ................................121
1. Input Data .........................................................122
1.1. Risk Tolerance ........................................... 122
1.2. Liabilities and Leverage .............................125
1.3. Market Data ................................................127
2. The Optimisation Model ....................................128
3. Output Data ......................................................130
3.1. The Foreign Reserve Benchmark ...............129
3.2. Benchmark Portfolios .................................130
International Foreign Exchange Reserves
5
Chapter 9. BNB Tactical Asset Allocation ......................... 138
1. BNB Active Portfolio Management Strategies ... 139
1.1. Active Positions as regards Duration, Convexity, Yield Curve, and Credit Spread 140
1.2. Active Positions based on Quantitative Methods .................................................... 144
1.3. Active Positions utilising Peculiarities of the Fixed Income Market ........................ 144
1.4. The Importance of Market Timing.............. 145
2. New Instruments Used in Active Strategies ...... 146
3. Passive Strategies ............................................. 146
Chapter 10. BNB Foreign Reserve Management Results ... 149
1. Impact of the Market Environment on ReserveManagement Returns ........................................ 150
2. Portfolio Risk and Return ................................... 157
Chapter 11. Accountability ................................................... 165
1. Reporting .......................................................... 165
2. Control .............................................................. 168
3. Communication ................................................. 170
Chapter 12. IT Aspects of BNB Foreign Reserve
Management .................................................... 173
1. An In-House Developed Information System .... 173
2. The Trema Information System ......................... 174
Chapter 13. Foreign Reserve Management under a Currency
Board amid Integration into the European
System of Central Banks .................................. 179
1. Foreign Reserve Management in theEurosystem ....................................................... 179
2. Forthcoming Obligations of the BNB ................. 186
Chapter 14. From Managing Foreign Reserves to
Managing National Wealth ............................... 188
1. Determining an Adequate Level of ForeignReserves for Bulgaria ........................................ 192

6
International Foreign Exchange Reserves
2. Determining the Objectives of a SovereignWealth Fund ......................................................199
3. The Institutional Setup of a Sovereign WealthFund ..................................................................201
International Foreign Exchange Reserves
7
TABLES, FIGURES AND BOXES
TABLES
1 The Structure of World Currency Reserves ............................ 20
2 Developing Country Reserve Adequacy ................................ 34
3 Developed Country Reserve Adequacy ................................. 35
4 Issue Department Balance Sheet
(Structured to the 2006 Format) .............................................. 76
5 Realized Return from Monetary Gold Investments ................. 84
6 Link between Investment Objectives
and the Law on the BNB ......................................................... 97
7 Formulas for the Distribution of the Total Income from the
Foreign Reserves .................................................................. 101
8 Optimization Models ............................................................. 105
9 Investment Limits by Asset Class ......................................... 116
10 BNB Investment Strategies ................................................... 139
11 Average Coupon Rate for the Period in per cent ................. 154
12 Aggregate Yield over the Period........................................... 155
13 Exposure by Sector and Average Interest Rate Risk
of the Benchmark Portfolio of Euro Denominated
Sovereign Bonds Issued by Euro Area Countries ................ 157
14 Average Market Value of Foreign Reserves
over the Review Period ......................................................... 163
15 ECB Equity Subscriptions by Euro Area National
Central Banks ........................................................................ 184
16 ECB Equity Subscriptions by National Central Banks
outside the Euro Area ........................................................... 185
17 Developing Countries’ International Reserves: Annual
Absolute Growth ................................................................... 189
18 Sovereign Wealth Funds ....................................................... 202
8
International Foreign Exchange Reserves
FIGURES
1 Yield Curve .............................................................................. 42
2 Spot Rates ............................................................................... 43
3 Forward Rates ......................................................................... 43
4 Relationship between Spot and Forward Rates ..................... 44
5 Price of a Coupon Bond at Moment t ...................................... 45
6 Shapes of the Yield Curve ...................................................... 48
7 Yield Curve Theories ............................................................... 50
8 The Investment Process .......................................................... 57
9 Basic Elements of Strategic Asset Allocation ......................... 60
10 Portfolio Optimisation Approaches ......................................... 61
11 Steps in Operational Portfolio Management ........................... 64
12 Dynamics of Monetary Gold on the BNB Balance Sheet ....... 81
13 Price of Gold and Euro area Government Bonds ................... 82
14 Organisational Structure ......................................................... 86
15 Communications on Foreign Reserve Management .............. 90
16 Levels of Investment Decisions .............................................. 94
17 Distribution between the Ministry of Finance and the BNB
of the Total Income from the Foreign Reserves According
to the Law on the BNB and the Accounting Policy
and Methodology .................................................................. 100
18 Types of Investment Objectives and Risks ........................... 103
19 Target Function and Constraints for Optimization ................ 103
20 Expected Quarterly Return on the Bonds in EUR and USD
of Different Maturity Sectors .................................................. 108
21 Empirical Distributions of the Three Types of Return
on the Foreign Reserves if Invested in European
Government Bonds in the Respective Maturity Sectors ....... 109
22 The Strategic Asset Allocation Process ................................ 122
23 Risk Tolerance, Risk Budgets, and Investment Limits ......... 123
24 Structure of the Liabilities by Currency ................................. 126
25 Structure of the Liabilities by Balance Sheet Entry ............... 127
26 Optimisation Model for Foreign Reserve Benchmark
Selection ............................................................................... 129
27 Foreign Reserve Structure by Portfolio ................................. 131
28 Optimisation Model for Determining the Maximum
Permissible Duration of Foreign Reserves ............................ 133
29 Methodology for Determining the Size of the Liquidity
Portfolio in Euro ..................................................................... 136
30 30 Years – 10 Years Spread ................................................. 141
International Foreign Exchange Reserves
9
31 10 Years – 2 Years Spread ................................................... 142
32 Spread between Italian and German 10 years Bonds ......... 143
33 Spread between 3-year French and German Bonds .......... 145
34 ECB Interest Rate Policy (Repo Rate) and Market Yield to
Maturity of 1–3 Year and 7–10 Year European Government
Bonds .................................................................................... 151
35 Federal Reserve Bank Interest Rate Policy (Federal Funds’
Target Rate) and Market Yield to Maturity of 1–3 Years
and 7–10 Year Treasury Securities ....................................... 151
36 Government Bonds Maturing in under a Year ...................... 153
37 Government Bonds Maturing in between
One and Three Years ............................................................ 153
38 Average Coupon Rate and Aggregate Returns on Bonds
Maturing in 1–3 Years ........................................................... 155
39 Average Modified Duration (Interest Rate Risk) of Foreign
Reserves ............................................................................... 158
40 Average Deviation of Modified Duration (Interest Rate Risk)
of Euro Denominated Assets Relative to Benchmark
(in Years) ............................................................................... 158
41 Realized Aggregate Returns on Foreign Reserves
over the Period ...................................................................... 159
42 Average Aggregate Yield and Interest Rate Risk of
European Bonds and Euro-Denominated Assets between
2000 and 2007 ...................................................................... 160
43 Returns on the Banking Department’s Deposit ................... 161
44 Absolute Yield on Foreign Reserves .................................... 162
45 Contribution of Returns to Foreign Reserve Growth ............. 162
46 Growth of the Average Market Value of Reserves ................ 164
47 Summary of Periodical Reports ............................................ 167
48 Main Functionalities of the IT System ................................... 176
49 Straight Through Processing (STP) ...................................... 177
50 Structure of the Foreign Reserves of the Eurosystem .......... 180
51 ECB Portfolio Management ................................................... 180
52 Investment Process Scheme of the ECB Foreign Reserve
Management ......................................................................... 183
53 International Foreign Exchange Reserves (except Gold) .... 188
54 Foreign Reserves/Monetary Aggregate M2 .......................... 193
55 Reserves in Months of Goods and Service Imports ............. 193
56 Foreign Reserves/Short Term External Debt ........................ 194
57 Share of Energy Commodities and Strategic Raw
Materials in Bulgarian Foreign Trade Turnover .................... 194
10
International Foreign Exchange Reserves
58 Budget Balance .................................................................... 195
59 Government Debt/GDP ......................................................... 196
60 Foreign Direct Investment/GDP ............................................ 196
61 Privatisation Revenue/GDP ................................................... 197
62 Foreign Reserves/GDP ......................................................... 197
63 Balance of Issue Department Excluding the Government
Deposit .................................................................................. 198
BOXES
1 Derivation of Yield using Spot and Forward
Interest Rates .......................................................................... 43
2 Main Statistical Parameters of the Model ............................... 63
3 Example for the Income Distribution Given Zero Income
from the Change in Price of the Government Bonds ............ 107
4 Setting a Worst Case Scenario and Determining
Maximum Asset Duration ...................................................... 132
5 Methods for Forecasting Changes in the Yield Curve .......... 134
6 Methodology for Determining the Size of the
Liquidity Portfolio in Euro ...................................................... 136
7 Yield Curve Exposures .......................................................... 141
8 Exposure to Credit Risk ........................................................ 143
9 A Position based on Future Movement
of Spread between two Securities ........................................ 145
10 Passive Strategy Implementation .......................................... 147
International Foreign Exchange Reserves
11
Introduction
This book caters to a growing public interest in the principles, or-
ganisation, and results of foreign reserve management at the BNB. It
took some four years to write. The process of managing foreign re-
serves does indeed deserve interest! The fact that it is manifest tes-
tifies to the march of democracy, the opening of Bulgaria’s economy
to the world, and to growing awareness of the concept of public
wealth. The period since currency board launch – one of the most
successful in Bulgaria’s new economic history – saw the accumula-
tion of significant foreign reserves. In late 2007, the BNB held some
12 billion euro of them, worth some 41 per cent of Bulgaria’s GDP.
Globalisation and information technology offer ever greater opportu-
nities for economic analyses and comparisons, boosting both compe-
tition and the development of civil society.
We began working on the book in 2004, just as the BNB success-
fully completed the World Bank’s RAMP1 foreign reserve manage-
ment programme. The certificate we received after three years with
the World Bank Treasury2 encouraged us to present to the public the
sequence of complex theoretical and practical economic and finan-
cial issues which central banks tackle in managing their foreign re-
serves. Thus, this book is also a gesture of gratitude to the World
Bank for the reserve management support it offered and continues to
offer the BNB. We cannot fail to mention current World Bank Treasury
Vice President Kenneth G Lay, a friend of Bulgaria down the years
through posts he has held, and RAMP and Sovereign Investment
Partnerships Director Jennifer Johnson-Calari. They sent the special-
ists who worked with us, encouraged us to pose difficult issues and
to resolve them constructively and openly in managing the substan-
tial portion of public wealth that foreign reserves represent.
1 Reserve Advisory and Management Programme.2 World Bank Treasury.
12
International Foreign Exchange Reserves
In striving to be a modern European central bank, the BNB has to
stay abreast of global and national trends in foreign reserve manage-
ment. The Bank recently gained access to the expert potential of the
European System of Central Banks (the ESCB) and worked with the
central banks of France, the Netherlands, and Italy on foreign reserve
management in the Euro System. The Bank’s cooperation with the
Bank for International Settlements in Basel and the International Mon-
etary Fund (the IMF) is particularly beneficial to building administra-
tive capacity and improving employees’ theoretical grasp and profes-
sional qualifications. Not least, daily management of the foreign re-
serve has meant direct BNB involvement on international financial
markets, building additional expert potential.
All this made us identify a problem not unknown to other countries
which have accumulated foreign reserves through reform and the lib-
eralisation of the world economy. This problem is the lack of a basis
for national debate. The public, politicians, media, even many econo-
mists in these countries lack the theoretical basis for such a debate.
This is why we published the theoretical part of the book in 2005. In
the two years that followed, we offered additional information on how
the BNB understands and applies the theory of foreign reserve man-
agement under a currency board through BNB Annual and Semian-
nual Reports. We trust that this book will lend added impetus to de-
bate as the public, politicians, and leading economists have accumu-
lated a basic body of knowledge. The BNB has the will for this, sens-
ing as it does that public wealth and attitudes to it exceed the purview
of a central bank.
This is the place to express my gratitude to the BNB Governing
Council and to Governor Ivan Iskrov for their strong and continuing
support in resolving the complex theoretical, practical, and purely
operational or organisational issues of foreign reserve management.
While adhering strictly to the Law on the BNB (the LBNB) and its defi-
nitions of their purviews and duties, they have offered this help in the
earnest hope that it would strengthen and develop foreign reserve
management capacity and assist the young specialists of the Treas-
ury and Risk Control and Analysis Offices.
International Foreign Exchange Reserves
13
Part Two, then, outlines the BNB’s current practice in managing
foreign reserves under a currency board. It shows how the public
interest is safeguarded to the utmost by national legislation and rec-
ommended international practice, and how Bulgaria and its central
bank honour their commitments to the EU and the ESCB. This prac-
tice rests on theoretical grounds whose soundness was proven by
recent uncertainties on international markets and the global economy.
BNB practice, however, is not final and immutable: life is much richer
than any theory and things can never stand still.
Foreign reserve management has the character of a social con-
tract. We feel that the book manages to show how economic theory
and practice develop to cater for the changes which life invariably
imposes. The purpose of this study is to highlight knowledge accu-
mulated at the BNB as a basis for continuing public debate on our
attitude to the public wealth that the central bank’s foreign reserves
are. The book aims to send echoes among politicians, economists,
the media, and civil society on managing this wealth in a manner
which must:
1. Rest on principles derived from modern theory and practice;
2. Demonstrate at all times international standards of accountabil-
ity and transparency;
3. Rest on legal instruments which exclude any possibility of po-
litical pressure to trample principles and skew accountability.
Much attention in Part Two is devoted to the match between Bul-
garia’s monetary regime, the currency board, and foreign reserve
management theory. In an example of Bank accountability and trans-
parency, financial results from foreign reserve management for the
entire period after 2000 are presented. They are all the more valuable
since they surpass the scope of Annual and Semiannual Reports. This
highlights cyclicity on international financial markets, financial lever-
age in reserve management, and the distinction between reserve
management and the Bank’s disbursement role. The last chapter
presents the meaning and significance of sovereign investment funds
in today’s economy and their link with foreign reserves as a platform
of debate on efficient public wealth management. The BNB reserve
management information platform, live since 2006, is also explained.

14
International Foreign Exchange Reserves
The book was written by a team of authors:
Part One
Chapter 1 Petar Chobanov (1-6)
Boris Petrov (1, 5, 6)
Tsvetan Manchev (5)
Chapter 2 Ilia Galabov (2)
Ivan Minchev (3, 4)
Boris Petrov (1, 3, 4)
Chapter 3 Ilia Galabov (1, 2)
Ivan Minchev (1-3)
Daniela Minkova (4)
Part Two
Chapter 4 Tsvetan Manchev
Chapter 5 Boris Petrov
Chapter 6 Tsvetan Manchev, Vladislav Nikolov and
Iglika Andreevska
Chapter 7 Ivan Minchev and Ilia Galabov
Chapter 8 Ivan Minchev
Chapter 9 Daniela Minkova
Chapter 10 Tsvetan Manchev
Chapter 11 Ilia Galabov, Iglika Andreevska and
Tsvetan Manchev
Chapter 12 Iglika Andreevska
Chapter 13 Tsvetomir Penev
Chapter 14 Tsvetan Manchev and Mincho Karavastev
The major conclusions we offer the reader are:
1. Foreign reserve management is a complex financial, business,
public, and political process which ought to be vested into the
central bank through modern theory and practice set in legal
terms as exemplified by the LBNB.
International Foreign Exchange Reserves
15
2. The BNB acts on the basis of clear and transparent, hierarchi-
cally arranged foreign reserve management principles. They
must endure in any future legislation governing the monetary
and foreign exchange regime, national debt, and public wealth.
3. The currency board places liquidity as a priority of BNB foreign
reserve investment in order to maintain the Bank’s standing
and public confidence in the monetary regime.
4. Safeguarding and boosting the value of BNB capital involves
important tasks and constraints in foreign reserve investing and
decisionmaking. Adhering to them helps maintain and improve
the BNB’s standing as the nation’s monetary centre.
5. A flexible internal organisation to manage foreign reserves to
legal principles, clear and unambiguous internal rules at all lev-
els, strict accountability, and public visibility, is an important
condition for continuity in the Bank’s investment policy and for
its reputation.
6. The long term outcomes of reserve management are strongly
dependent on the theoretical soundness of the investment
process and on the categorical clarity of statutory principles.
7. The results of foreign reserve management since 2000 confirm
the dependability of statutory instruments and of BNB invest-
ment policy.
8. BNB entry into the ESCB did not entail changes to foreign re-
serve investment policy. Change will come with BNB entry into
the Euro System, and the Strategy for BNB Development be-
tween 2004 and 2009 provides for staff retraining and prepa-
ration.
9. The emerging public debate on managing public wealth to rec-
ommended international practice and principles and obtaining
higher yield touches on foreign reserve management. We re-
gard foreign reserves as part of public wealth. The manner in
which this wealth is managed is a political matter for the Na-
tional Assembly.
10. Only the National Assembly may set a theoretical business and
political extent on the foreign reserves which the BNB requires
16
International Foreign Exchange Reserves
to maintain monetary regime stability until Bulgarian accession
to the Euro System.
11. Upon such an assessment, the National Assembly may legis-
late on that portion of public wealth which is currently part of
BNB foreign reserves, but which may exceed the amount
needed for monetary cover and currency board stability. The
Bank has the capacity and will to assist the legislator.
All opinions and comments will be received with interest. Readers
may contact us through bnb.bg or [email protected]. We trust
you will enjoy the book.
Tsvetan Manchev
Doctor of Economics, Deputy Governor,
and Member of the Governing Council of the BNB
December 2008
Sofia

PART ONE
THE THEORETICAL
FOUNDATIONS

18
Part One. The Theoretical Foundations
Chapter 1. Nature and Function
19
Chapter One
Nature and Function
1. Definition
Foreign reserves3 include gold and/or other central bank assets
which come entirely within its control and are easy to trade on inter-
national financial markets. According to the Fifth Edition of the IMF’s
Balance of Payments Manual “reserve assets consist of those exter-
nal assets that are readily available to and controlled by monetary
authorities for direct financing of payments imbalances, for indirectly
regulating the magnitude of such imbalances through intervention in
exchange markets to affect the currency exchange rate, and/or for
other purposes”.4
The IMF description is clear on the role and significance of re-
serves, and on the motives for owning and using them. Except in
special and closely defined circumstances, the monetary authorities
in the definition are national governments and central banks. Depend-
ing on organizational and legal arrangements, the government and
central bank may either manage their portions of foreign reserves
independently, or have them managed by one or the other on behalf
of the nation. World practice tends to favor central banks as manag-
ers of these reserves and, as the law stands, Bulgaria is no excep-
tion. Hence our definition treats foreign reserves as a central bank
province.
Another important element of the proposed BNB definition, in line
with the IMF one, is the necessity to hold reserves in foreign ex-
change and foreign financial assets which are easy to trade on inter-
national financial markets. Ease of trading implies that assets and
currencies are quoted at all times, enabling transaction immediacy
with no significant departures from current market quotes.
3 We use ‘foreign reserves’ or ‘reserves’ for brevity instead of ‘international reserves’.4 Balance of Payments Manual, Fifth Edition, the International Monetary Fund, 1993, p. 97.
20
Part One. The Theoretical Foundations
Easily traded instruments (assets and currency) broadly fulfill
these criteria:
• the country 5 which issues “international currency” has to have
a stable financial and political system imparting confidence in
the currency;
• the issuing country’s financial markets have to be well devel-
oped and integrated into world financial markets;
• the currency must be recognized as internationally stable and
suitable for use as a means of storing value;
• the issuing country must have a large share of world trade, or
the currency must be widely used as a means of exchange in
international transactions.
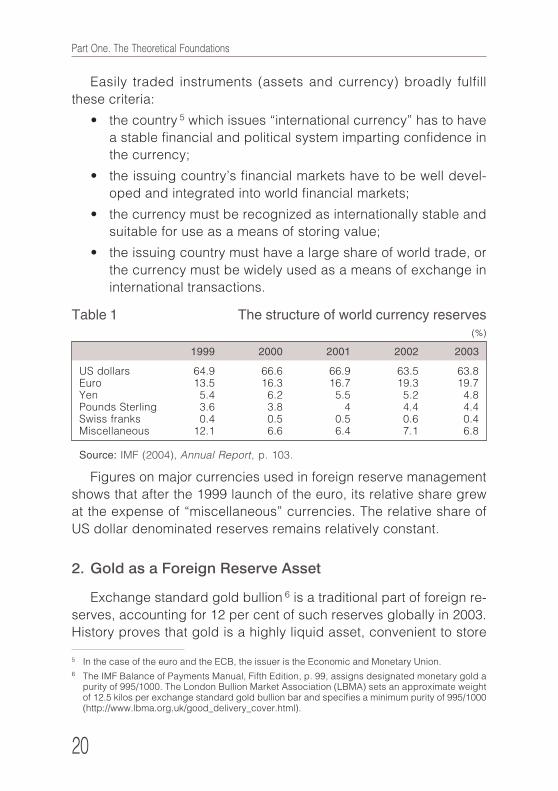
Figures on major currencies used in foreign reserve management
shows that after the 1999 launch of the euro, its relative share grew
at the expense of “miscellaneous” currencies. The relative share of
US dollar denominated reserves remains relatively constant.
2. Gold as a Foreign Reserve Asset
Exchange standard gold bullion 6 is a traditional part of foreign re-
serves, accounting for 12 per cent of such reserves globally in 2003.
History proves that gold is a highly liquid asset, convenient to store
Table 1 The structure of world currency reserves(%)
1999 2000 2001 2002 2003
US dollars 64.9 66.6 66.9 63.5 63.8Euro 13.5 16.3 16.7 19.3 19.7Yen 5.4 6.2 5.5 5.2 4.8Pounds Sterling 3.6 3.8 4 4.4 4.4Swiss franks 0.4 0.5 0.5 0.6 0.4Miscellaneous 12.1 6.6 6.4 7.1 6.8
Source: IMF (2004), Annual Report, p. 103.
5 In the case of the euro and the ECB, the issuer is the Economic and Monetary Union.6 The IMF Balance of Payments Manual, Fifth Edition, p. 99, assigns designated monetary gold a
purity of 995/1000. The London Bullion Market Association (LBMA) sets an approximate weightof 12.5 kilos per exchange standard gold bullion bar and specifies a minimum purity of 995/1000(http://www.lbma.org.uk/good_delivery_cover.html).
Chapter 1. Nature and Function
21
7 Harmston, S. Gold as a Store of Value, World Gold Council, Research Study No 22, November1998.
8 Doran, A. Trends in Gold Banking, World Gold Council Research Study No 19, June 1997.9 Bordo, M., B. Eichengreen, The Rise and Fall of a Barbarous Relic: The Role of Gold in the Inter-
national Monetary System, National Bureau of Economic Research Working Paper 6436, March1998.
and exchange, and commonly accepted in foreign trade. Since it is
not issued by a country, gold is not subject to national crises, as dis-
tinct from money issued by a country or economic community. Histori-
cally, this circumstance has boosted gold prices amid political, mili-
tary, or socioeconomic crises, and/or geopolitical tension.
Harmston (1998)7 shows that gold has retained its real purchasing
power over very long terms in the USA, Britain, France, Germany, and
Japan. Regardless of any long term price fluctuations, the purchas-
ing power of gold swings back to parity with other commodities such
as petroleum, sugar, grain, and metals. This determines one of gold’s
major functions as a hedge against inflation. The same study shows
that gold may be used to diversify an asset portfolio.
Some central banks in manage their gold reserves more actively.
Doran (1997)8 shows lending in gold growing dynamically, with de-
veloping country central banks playing the major role, though they
only hold some 17 per cent of world public sector gold. In 1996 these
banks disbursed about two thirds of gold loans, or some 2750 tonnes.
Intermediaries in this business are banks with a very high international
rating (АА or better), since they tend to be the only private banks with
whom central banks work. The most common financial instruments
are deposits whose interest is paid in gold.
Other authors see the role of gold in foreign reserves declining.
Bordo and Eichengreen (1998)9 show that central banks’ commitment
to price stability, which has ushered a significant curb on world infla-
tion, would cut the future monetary role of gold. Other factors in this
trend include the greater mobility of capital, the falling significance of
tradition, foreign factors, and legal requirements for gold.
Today’s central banks continue to be positive on gold. This is
gleaned from the so called Washington Agreements. The first such
accord dates from September 1999 when the price of gold (USD250
per troy ounce) was at a low since 1980. The agreement was between
22
Part One. The Theoretical Foundations
10 The Basle based Bank for International Settlements.
15 European central banks, of which 14 (all except the Swiss) were
in the ESCB. The BIS10 monitored this gentlemen’s agreement lack-
ing the legal force of an international treaty. The parties owned about
half of world official gold. The USA and Japan undertook not to sell or
lend gold. The BIS and the IMF supported the agreement. The accord
limited gold sales to 2000t over five years: some 400t per annum.
Switzerland accounted for 1300t of the total, and Britain for 365t.
Other parties had 335t between them, with the Netherlands and Bel-
gium seen as the keenest sellers.
A central part of the agreement limited the amount of gold for lend-
ing. The parties contracted not to increase it, and not to boost futures
and options volumes. The accord injected clarity into the fate of a
large amount of gold which was practically removed from the market
for its duration. This largely relieved world gold markets from uncer-
tainty as to the behavior of such major market participants as central
banks, cutting price fluctuations.
In March 2004, before the expiry of the Washington Agreement,
central banks signed a new gold accord. Again covering five years,
it came into force as the prior agreement lapsed on 27 September
that year. Annual sales by parties to the agreement will not exceed
500t, limiting overall gold sales to 2500t over the life of the accord.
Gold lending and gold futures volumes are kept at former levels.
Main factors governing gold prices over the past two years in-
clude:
• reduced hedging positions by gold producers;
• geopolitical instability;
• the weak US dollar;
• low interest rates;
• equity market volatility;
• the slow growth of gold supply by mining companies.
Record low international market interest in gold denominated fi-
nancial instruments is expected to remain set over the medium term.
Main drivers here are the cutting of hedging positions by gold pro-
Chapter 1. Nature and Function
23
ducers (the main demand factor), and the readiness of central banks
to lend large amounts of gold (the main supply factor). Nevertheless,
as the second Washington Agreement expressly states, gold remains
an important part of global reserves.
Amid these worldwide trends, the BNB position is that existing
monetary gold will continue forming a part of its reserves in the long
term. At the close of the last century the Bank took the strategic de-
cision to manage some 60 per cent of its gold reserves by allowing
it outside Bank vaults. This sensible move allows revenue to offset a
significant part of gold maintenance costs while staying within LBNB
statutory risk requirements. Gold reserve liquidity increases, and (last
but not least) the BNB is accumulating experience in managing gold
reserves on international markets.
3. Reasons to Own and Use Foreign Reserves
The motivations for any country to own reserves have always been
liquidity and insurance: a hedge against the unforeseen. The IMF
definition clearly states that foreign reserves serve foremost for:
• financing foreign payment disbalances;
• maintaining a set exchange rate level.
Each country faces constant demands for foreign payments on
demand for trade purposes, necessitating a reserve to accumulate
and disburse foreign payments. Foreign trade and domestic policy
also often lead to the accumulation of foreign debt which is serviced
with foreign exchange. Normally, the debtor country manages to gen-
erate a revenue stream with which to settle its obligations. Unreason-
able economic policies or shock falls in foreign revenue can cause
payment difficulties. Reserves then become a source of liquidity.
Foreign reserve amounts and composition also affect exchange
rates. All exchange policy classifications11 stress that entirely free
floating exchange rates are rare exceptions across the world. Even
countries internationally acknowledged to have floating exchange
rates own reserves.
11 See IMF, Annual Report on Exchange Arrangements and Exchange Restrictions, 2004.
24
Part One. The Theoretical Foundations
4. The Functions of Foreign Reserves
The main purposes of foreign reserves are:
• to act as a monetary policy instrument;
• to act as an exchange rate instrument helping cut fluctuations
in the exchange rates of the national currency against foreign
currencies, or maintain a set exchange rate;
• to act as a liquidity buffer in case of an international financial
market crash;
• to reduce vulnerability to external factors and safeguard
against crises;
• to boost stability and confidence in financial markets, since re-
serves are among the foremost indicators monitored by inter-
national ratings agencies;
• to act as a source of subsidiary revenue derived from manag-
ing them.
The above list is most general and detached from theoretically
possible exchange rate policies and the degree of national develop-
ment; the significance of foreign reserves varies according to specific
circumstances. Financial history offers as few grounds for simple
assessments of foreign reserve management as it does examples of
more successful central banks. Interventions in support of an ex-
change rate or of other monetary policies appear appropriate only in
the short term. Pragmatic thinking puts them alongside other mon-
etary policy levers, with success dependent on their combined use.
Alan Greenspan12 states the general principle that foreign reserves
should be kept in currencies seen as stronger than the local one. The
proof by default is that the Fed has used gold as a foreign reserve for
a lengthy period. Whenever the dollar has weakened, the Fed has
boosted the shares of yen and marks (euro).
The process of managing foreign reserves increases knowledge
of developments in the economy and on international financial mar-
12 Greenspan, A. Currency Reserves and Debt: Remarks before The World Bank Conference on Re-cent Trends in Reserves Management, Washington, D.C., April 1999.
Chapter 1. Nature and Function
25
kets, thus assisting one of the central bank’s basic functions: attain-
ing financial stability.
The example of New Zealand is indicative of the functions of for-
eign reserves today. Since 1985, this country’s currency has floated
freely, the central bank not intervening at all on the forex market; yet
it continues maintaining reserves13. The bank’s entire reserve is dis-
bursed as loans on the international markets. New Zealand has an AA
credit rating, yet its foreign reserves yield something just below the
AAA rating mark14. By 2000 reserves came to USD2.5b, while the total
maintenance spend on them came to USD2.5m. Despite these ex-
penses, the Reserve Bank of New Zealand does not intend to re-
nounce foreign reserve maintenance and management, foremost ar-
guments being:
• liquidity in case of a collapse of international financial markets;
• cash in hand to meet foreign debt repayments;
• honing staff know how and skills as regards the global
economy;
• a reserve fund in case of natural disasters;
• a monetary policy instrument amid stable national budget sur-
pluses and cuts in government bond issues.
Another reason why central banks have to maintain additional li-
quidity in the form of foreign reserves lies in the nature of international
forex markets which appear more adept at spreading shocks than at
absorbing and controlling them.
This is borne out by the dynamics of bid/offer spreads: traders’
basic transaction cost. Where fluctuations and uncertainty grow, the
spread broadens, cutting market liquidity. Forex market brokers al-
ways have a swift retreat ready when crisis looms. Central bank inter-
vention becomes necessary in such cases, since decisions are
longer term and planning horizons are broader.15�
13 Archer, D., J. Halliday, “The Rationale for Holding Foreign Currency Reserves,” Reserve Bank ofNew Zealand Bulletin, December 1998.
14 Sherwin, M., Foreign Reserves: Some Observations in an Asian Context: Current Issues, Addressto a Conference of the World Bank Treasury, Thailand, May 2000.
15 For a more detailed insight into forex market structure and participant behavior (including centralbanks), see Goodhart, C., M. Glugale, “Some Evidence on Daily Trading Activity in the London
26
Part One. The Theoretical Foundations
5. Exchange Rate Policy, Monetary Policy, and Foreign
Reserves
Choices facing central bank managers when combining monetary
policy with government’s chosen exchange and capital controls are
hard and controversial, even in theory. The theoretical debate on ex-
change policy alone dates back a couple of centuries and, economic
theory advances notwithstanding, has not reached an unconditional
conclusion on the dilemma between a fixed or floating (flexible) ex-
change rate. It is endless, for the choice of exchange policy entails
balancing current and expected spending and revenue, while they in
turn depend on specific points of departure, structural and behavioral
peculiarities, as well as on economic shocks that are as inevitable as
they are unpredictable. Each exchange policy change is subject to at
least two further constrictions. The first comprises manifold legislative,
structural, and institutional adjustments in the state, and especially its
central bank, which would back exchange policy stability. To some
extent these changes determine how long the economy adapts to the
chosen exchange policy. The second involves several years’ settling
down; precisely how many years depends on the country and histori-
cal juncture.
Harvard professor Frankel, a universally acknowledged exchange
policy authority, stated in 1999 that “no single foreign exchange regime
is right for all countries in all times.”16 Choosing between fixed and
floating exchange rates is not a simple matter of selecting one oppo-
site, but rather a multilayered decision surmounting а multiplicity of in-
stitutional choices and policies. Moreover, it is not isolated, but forms
a part of an overall exchange and monetary policy framework, with
implications for the free movement of goods and capital17.
Foreign Exchange Market,” Journal of International Securities Markets, Summer 1989; Flood, M.,“Market Structure and Inefficiency in the Foreign Exchange Market,” Federal Reserve Bank of St.Louis Review, Working Paper 91-001B; Bollershev, T., M. Melvin, “Bid-Ask Spreads and Volatil-ity in the Foreign Exchange Market,” Journal of International Economics, Vol. 36 (1994).
16 Frankel (1999), NBER Working Paper No 7338.17 The degree of autonomy in selecting an exchange policy remains an open issue outside the
scope of this study.

Chapter 1. Nature and Function
27
Formulating a monetary regime is even more complex, both theo-
retically and in practice. Several types have emerged18:
1. A central bank entirely independent from government and pur-
suing monetary policy with price stability as its aim.
2. A relatively independent central bank whose monetary policy,
alongside price stability, aims at currency stability under the
chosen exchange policy and/or attaining set economic growth
rates.
3. A currency board.
4. The gold standard.
5. The gold/dollar standard.
Each historic regime features a different institutional framework.
Currently, the top two are most widespread worldwide. Typical exam-
ples of the first include the USA and the eurozone, with the Fed and
the ECB enjoying independence both statutorily (formally) and in
practice (based on democratic tradition and experience) to conduct
monetary policies whose major aim is price stability. Some new EU
members from the 2004 expansion wave also have regimes of the
first type: Poland and the Czech Republic. Typical of the second re-
gime are India, China, and Russia, as well as most developing na-
tions in South East Asia and Latin America.
The currency board is a very rare regime considered especially
successful in countries with small open economies striving to balance
their state finances and remove all hindrances to the movement of capi-
tal. The model calls for suitable legislation which also encourages flex-
ibility in the movement of goods, people, and services. Typical of the
regime are the central banks of Bulgaria, Estonia, Hong Kong, and
Lithuania.
The gold and gold/dollar standards rest on a direct or indirect peg
between the national currency and gold, with local money wholly or
partially covered by gold19. The classic gold standard reigned world-
18 For a detailed discussion on monetary regimes, see Mishkin, F., International Experiences withDifferent Monetary Policy Regimes, National Bureau of Economic Research, Working PaperNo. 7044, 1999.
19 Gold standards are reviewed in detail in, inter alia, Desquilbet, J.B., N. Nenovsky, Credibility andAdjustment: Gold Standards Versus Currency Boards, Bulgarian National Bank, DP/39/2004, 2004.

28
Part One. The Theoretical Foundations
wide between 1880 and 1914 with no administrative fiat, but rather
because of market forces20. It featured automatic adjustments to
shocks while maintaining complete capital mobility. Monetary gold
reserves were distributed among participating countries according to
their demand for money. Balance of payments disbalances were
overcome automatically. Gold moved from countries with balance of
payments deficits to those with surpluses, balancing the money mar-
ket and price levels. The gold standard imposed strict rules and
could be viewed as a counter to discretionary monetary policy. Much
criticism may be leveled against the regime. The main ones which led
to its demise addressed: the development of financial intermediacy
and the growing role of broader monetary aggregates and money
multiplier which mean a reducing cover; political problems and the
need for large money issues (the two World Wars); the high transac-
tion costs of basing the system on a noble metal; insufficient gold
supply; and international contagion for shocks and financial crises.
The choice of a stable currency and monetary regime for Bulgaria
in the periods until EU accession, ERMII membership, and eurozone
entry, has to be viewed in the context of the above resume. The
choice would affect the role of foreign reserves in these periods. The
brief theoretical discussion below aims to outline the realistic bounds
of such a choice and inform readers’ personal conclusions as to the
stability and adequacy of the currency board regime with its lev euro
peg.
The link between monetary and exchange regimes is reviewed by
Schuler (2005)21. The choice before a central bank, given a set cur-
rency and monetary regime, is also theoretically constrained due to
the so called impossible trinity principle. This dictates that decision
makers have to sacrifice one of three possible, yet conflicting, aims:
monetary policy independence aiming at price stability, exchange
rate stability, or freedom of capital movement. This principle is the
natural extension and conclusion of the existence and application of
20 A detailed description of the gold standard is contained in Bordo, M., Monetary Standards: An Es-say written for the Oxford Encyclopedia of Economic History, http://econweb.rutgers.edu/bordo/encyclopedia.doc.
21 Schuler, K., Classifying Exchange Rates, http://users.erols.com/kurrency/classifying.pdf, 2005.
Chapter 1. Nature and Function
29
the so called Mundel22 (1968) Fleming23 (1962) Model24.
The two cases below illustrate the impossible trinity in a market
economy, with foreign reserve dynamics an important variable in the
model25.
First let us assume a central bank which maintains a fixed exchange
rate and does not intervene to maintain a constant money supply. Initially
there is balance between supply and demand for the local currency. If
demand falls amid a liberal capital movement policy and the central
bank continues maintaining a fixed exchange rate, local money oversup-
ply results. Excess local currency is changed at the central bank for for-
eign currency, cutting foreign reserves. Foreign exchange replaces the
local currency in economic agents’ portfolios, causing a fall in the mon-
etary base, which, assuming an unchanged exchange rate, leads to
reduced money supply and the restoration of equilibrium. The adjust-
ment is at the expense of falls in foreign reserves and nominal money
supply. The opposite obtains where demand for local money grows, with
adjustment resulting in increased foreign reserves and money supply.
Here there is no conflict between the objectives: the central bank main-
tains its fixed exchange rate, capital moves freely (is convertible), yet
independent policy is absent inasmuch as managing the monetary base
is not a central bank objective and falls outside its purview.
Second, let us assume a flexible exchange rate and an initial bal-
ance between money supply and demand, with a central bank con-
ducting monetary policy which does not include interventions to main-
tain the exchange rate. Once again there is no conflict between ob-
jectives. If money demand falls, there is excess local currency, caus-
ing its rate to fall against foreign exchange. Adjustment takes the form
of exchange rate changes, with the local currency falling without
22 The model develops the Keynesian IS/LM model for a small open economy. It was initially de-signed for the IMF, from whence the analysis of the effectiveness of monetary and fiscal policiesunder various exchange rate regimes comes. The authors’ basic contribution is in the stress laidon the role of capital flows in policy success.
23 Mundell, R., International Economics, New York, Macmillan, 1968.24 Fleming, M., Domestic Financial Policies Under Fixed and Floating Exchange Rates, IMF Staff Pa-
pers 9, 3 (Nov.), pp 369-379, 1962.25 The link between foreign reserves, exchange regimes and monetary policy is examined in detail
in Schuler, K., The Problem with Pegged Exchange Rates, KYKLOS, Vol. 52, Issue 1, 1999.

30
Part One. The Theoretical Foundations
changes to the monetary base or foreign reserves. The corollary is
that greater demand for local money would cause its rate to rise.
Incongruities under a fixed exchange rate regime arise where the
central bank begins conducting independent monetary policy. If de-
mand for local money fell then, the bank would sell foreign reserves
against money it issued, but for which there was no demand. This
would continue until the central bank had reserves left. When their
level got critically low, the likeliest outcome would be a successful
speculative raid on the fixed rate, causing a sharp drop in the local
currency, often combined with the loss of the remaining reserves. In
this case, the central bank is not allowing money supply to adjust and
keeps it at an artificial level: something impossible over a long term.
In order to maintain the fixed exchange rate and yet not sacrifice any
foreign reserves, the bank has to relinquish control over money sup-
ply, i. e. to cede monetary policy independence.
Incongruities under a floating exchange rate arise where the cen-
tral bank attempts to set and maintain a given trajectory for this rate.
The Mundell Fleming Model allows the above scenarios to be
made more complex and analyses to be made of various balancing
options in an economy with freedom of capital movement and fixed or
floating exchange rates, depending on how much stress falls on in-
dependent discretionary monetary (or rather fiscal) policy26. Econo-
mists such as Krugman (1979)27 and Dornbusch (1976)28 have deep-
ened and developed this analysis.
Over the 1990s’ transition to a market economy, Bulgaria acquired
experience of two different monetary and foreign exchange regimes.
Assessments of their success or otherwise must rest with economic
historians.
Ultimately, in 1997 Bulgaria relinquished independent monetary
policy and undertook, under the LBNB, to peg the lev against the
euro under a currency board. In view of Bulgaria’s approaching Eu-
26 Thorough explanations and diagrammatic representations of the various balancing options arecontained in Пилбийм, К., Международни финанси, FTP, Sofia, 1995.
27 Krugman, P., A Model of Balance-of-Payments Crises, Journal of Money Credit and Banking, Vol.11, Issue 3, pp 311−325, 1979.
28 Dornbusch, R., Expectations and Exchange Rate Dynamics, Journal of Political Economy 84,pp 1161−1176, 1976.

Chapter 1. Nature and Function
31
ropean Union accession in 2007, it matters that the ECB29 sees the
currency board with a lev peg to the euro as within ERMII member-
ship requirements. Bulgaria can also use the accumulated positive
experience of other countries opting for similar regimes (Estonia and
Lithuania), which are now ERMII members.
Today Bulgaria enjoys overall theoretical, political, and practical
consensus on the benefits of free capital movement and the positive
technological changes30 it brings, as evidenced by the 2000 Cur-
rency Law and the many statutory instruments and Bank Ordinances
under it. The Bank feels that limiting the freedom of capital movement
is not only undesirable but even dangerous in the run up to full EU
membership. Hence any possibility of capital movement restrictions
is seen as justified only in extremis. Such circumstances are usually
defined as events preceding a crisis.
6. Foreign Reserve Adequacy
The question of what level of reserves would allow a central bank to
discharge its basic tasks of financing disbalances in foreign payments,
and maintaining the foreign exchange regime and exchange rates has
been widely deliberated since the 1960s31 as the “adequacy issue.”
Adequate reserve levels are seen as ones which allow the maintenance
of international financial system stability. Plans exist to reform the still
functional, albeit much modified, 60 year old Bretton Woods system
and create an additional source of international liquidity. Countries fear-
ing contagious global recession in case the Bretton Woods institutions
(the IMF and the World Bank) fail to guarantee liquidity elect to have
greater reserves than others32. Transiting to predominantly floating ex-
29 See Some ECB Views on Accession Process, a Speech delivered by Christian Noyer, Vice-Presi-dent of ECB, on the occasion of The Central and Eastern European Issuers and Investors Forum,Vienna, on 17 January 2001, http://www.ecb.int/press/key/date/2001/html/sp010117.en.html.
30 For greater detail, see Edison, Klein, Ricci, Sloek, Capital Account Liberalization and EconomicPerformance: Survey and Synthesis, NBER Working Paper 9100, 2002.
31 A chronological progression of developments in the foreign reserves adequacy and demand is-sue may be found in Bird, G. and R. Rajan, Too much of a Good Thing?: The Adequacy of Inter-national Reserves in the Aftermath of Crises, CIES Discussion Paper 0210, April 2002.
32 A review of the literature addressing the problems of international liquidity and reserves during thisperiod is contained in Machlup, F., Plans for the Reforming of the International Monetary System,Special Papers in International Economics No. 3, Princeton University, 1964.
32
Part One. The Theoretical Foundations
change rates at the close of the 20th Century did not curtail demand
for foreign reserves. Studies show that reserve adequacy varies be-
tween countries and historical junctures and depends on national mac-
roeconomic specifics.
The liberalization of world trade at the close of the 20th Century
increased the significance of the balance of payments current ac-
counts for individual countries, and this read across into one of the
earliest indicators of reserve adequacy. Expressing reserves as a
number of months’ worth of imports of goods and services is a tradi-
tional way of linking foreign assets with foreign trade. Its explanation
is clear and logical: the number of months over which the country can
continue servicing its current level of imports if all other revenue and
spending were to end. The indicator only helps monitor and secure
adequate reserves to cover foreign trade disbalances. It is particu-
larly relevant to countries with a limited access to international finan-
cial markets and is strongly sensitive to downturns in investor expec-
tations. Three months’ worth of imports is the traditional critical low.33�
The adequacy issue resurfaced in the 1990s and the early 21st
Century after several serious currency crises, primarily in emerging
markets like Mexico, South East Asia, Russia, Argentina, and Bulgaria.
There the traditional ratio of foreign reserves to months of imports failed
to give early warning of crisis34. The main reason for this was the re-
moval of constrictions to the free movement of capital and the integra-
tion of emerging countries into international financial markets. This
boosted the importance of indicators linked with the balance of pay-
ments capital account, and hence with monetary aggregates and for-
eign debt.
The monetary aggregates to foreign reserves ratio shows the de-
gree of cover of a set aggregate (reserve money, М1, or М2) by for-
eign reserves. Adequacy indicators resting on ratios between mon-
33 See Fischer, S., Opening Remarks, IMF/World Bank International Reserves: Policy Issues Forum.Washington D.C., April 2001.
34 For some empirical studies confirming this, see Bussiere, M., C. Mulder, External Vulnerability inEmerging Market Economies: How High Liquidity Can Offset Weak Fundamentals and the Effectsof Contagion, IMF Working Paper No. 99/88, 1999; Edison, H., Do Indicators of Financial CrisesWork? An Evaluation of an Early Warning System, Board of Governors of the Federal Reserve Sys-tem, International Finance Discussion Papers, No. 675, 2000.
Chapter 1. Nature and Function
33
etary aggregates and reserves actually predate import ratios. Most
central banks which adhered to the gold standard in the Interwar
period strove to maintain a set ratios between their gold reserves and
foreign exchange holdings and the banknotes and short term paper
they issued35. Narrower aggregates such as reserve money and M1
read across directly to the currency board regime36 and show the
extent to which a country’s foreign exchange holdings can meet de-
mand for highly liquid means (money in circulation and overnight
deposits) at any one time.
The M2/foreign reserves ratio has a bearing on possible capital
runs in unfavorable circumstances and shows the extent to which the
banking system is ready to deal with such a development.37
The ratio between foreign reserves and short term foreign debt is
classically required to be at unity at least. It determines the ability to
meet the shortest term obligations in case of hindered access to new
foreign currency sources. Authorship of the indicator is ascribed to
former Argentine finance minister Pablo Guidotti38. Where balance of
payments current account deficits are high, the part of deficit seen as
unstable and unsustainable in the long term boosts the ratio. A re-
lated indicator is that of foreign debt service/foreign reserves. Apart
from measuring reserve adequacy by the Guidotti ratio, Alan
Greenspan39 proposes that the mean maturity of a country’s foreign
obligations be at least three years. Greenspan also speaks of a new
method of assessing a country’s relative foreign positions, called li-
quidity-at-risk. Foreign liquidity position is assessed on the basis of
a broad circle of possible values of related financial variables (ex-
change rate, basic commodity prices, and debt interest, inter alia).
Thus foreign reserves are adequate where they ensure a great prob-
35 Debt and Reserve-Related Indicators of External Vulnerability, IMF, March 2000.36 A certain analogy with the gold standard may be seen here.37 The М2/reserves ratio has been a good indicator of currency crises in many studies such as
Kaminsky, G., S. Lizondo, C.M. Reinhart, Leading Indicators of Currency Crises, IMF Working Pa-per, No. 97/79, 1997; IMF, Chapter IV, Financial Crises: Characteristics and Indicators of Vulner-ability, World Economic Outlook, 1998; Edison, H. Do Indicators of Financial Crises Work?: AnEvaluation of an Early Warning System, Board of Governors of the Federal Reserve System, In-ternational Finance Discussion Papers, No. 675, 2000.
38 De Beaufort, J. Wijnholds, A. Kapteyn, Reserve Adequacy in Emerging Market Economies, IMFWorking Paper No. 01/43, 2001.
39 See footnote 13.
34
Part One. The Theoretical Foundations
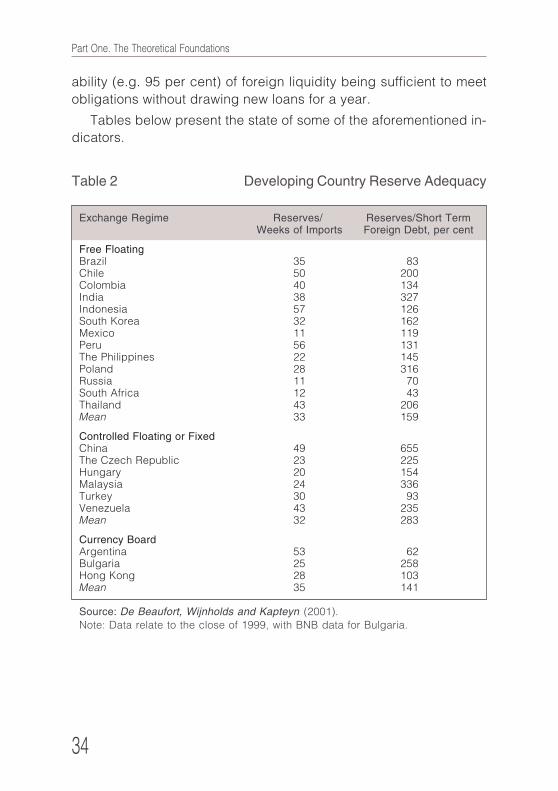
Table 2 Developing Country Reserve Adequacy
Exchange Regime Reserves/ Reserves/Short Term Weeks of Imports Foreign Debt, per cent
Free FloatingBrazil 35 83Chile 50 200Colombia 40 134India 38 327Indonesia 57 126South Korea 32 162Mexico 11 119Peru 56 131The Philippines 22 145Poland 28 316Russia 11 70South Africa 12 43Thailand 43 206Mean 33 159
Controlled Floating or FixedChina 49 655The Czech Republic 23 225Hungary 20 154Malaysia 24 336Turkey 30 93Venezuela 43 235Mean 32 283
Currency BoardArgentina 53 62Bulgaria 25 258Hong Kong 28 103Mean 35 141
Source: De Beaufort, Wijnholds and Kapteyn (2001).Note: Data relate to the close of 1999, with BNB data for Bulgaria.
ability (e.g. 95 per cent) of foreign liquidity being sufficient to meet
obligations without drawing new loans for a year.
Tables below present the state of some of the aforementioned in-
dicators.
Chapter 1. Nature and Function
35
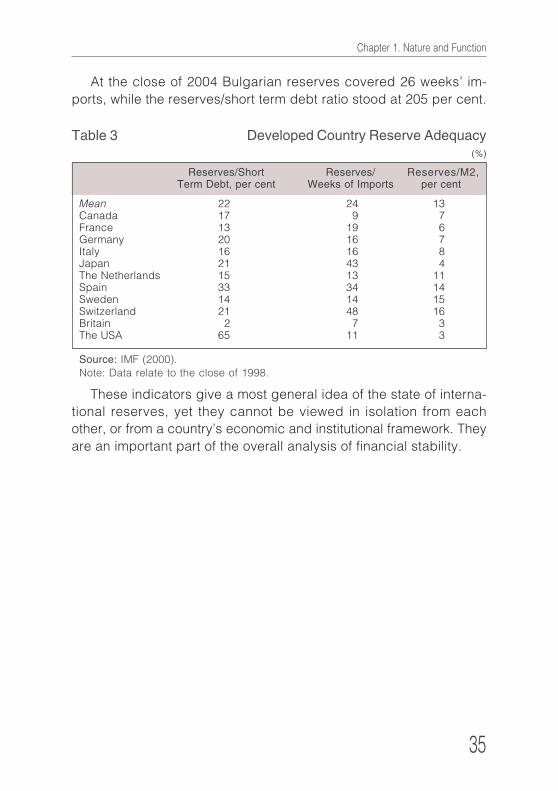
At the close of 2004 Bulgarian reserves covered 26 weeks’ im-
ports, while the reserves/short term debt ratio stood at 205 per cent.
These indicators give a most general idea of the state of interna-
tional reserves, yet they cannot be viewed in isolation from each
other, or from a country’s economic and institutional framework. They
are an important part of the overall analysis of financial stability.
Table 3 Developed Country Reserve Adequacy(%)
Reserves/Short Reserves/ Reserves/М2,Term Debt, per cent Weeks of Imports per cent
Mean 22 24 13Canada 17 9 7France 13 19 6Germany 20 16 7Italy 16 16 8Japan 21 43 4The Netherlands 15 13 11Spain 33 34 14Sweden 14 14 15Switzerland 21 48 16Britain 2 7 3The USA 65 11 3
Source: IMF (2000).Note: Data relate to the close of 1998.
36
Part One. The Theoretical Foundations
Chapter Two
Financial Asset Risk and Return
Foreign reserve management by modern central banks is a proc-
ess which employs financial asset investment theory, and this Chap-
ter presents a basic set of the concepts and terminology used by the
BNB. The Chapter systematizes the Bank’s understanding of financial
assets, the nature of financial risk, and factors influencing the yield
curve. A resume summarizes accumulated modern knowledge in in-
vestment portfolio management and yield curve theories.
1. Financial Assets
Chapter One explained that central banks keep reserves in foreign
currency, financial assets, and gold. This Chapter presents BNB
views on financial assets. Financial assets have tangible expressions
one may see or touch, such as land, buildings, or other chattels. They
are paper, and ever more electronic, records of certain ownership
(title, holder) rights. In essence these rights concern the distribution
of income from diverse origins and forms. Financial assets distribute
and redistribute income created by business, within households, or
arising from government.
Financial assets defer consumption by some economic agents,
and hasten current consumption by others. They are a conduit be-
tween those agents who create deficits in their business and those
who create current surpluses. They may serve as ways of assuming
risk or guarding against it, since the income generated and distrib-
uted among agents may be dependent on a certain event.
The simplest financial asset features fixed interest. It sets up a
relationship where a party is obliged to pay a defined sum on a de-
fined date. What distinguishes fixed interest financial assets is that
income from them, or the method of its generation, is known before-

Chapter 2. Financial Asset Risk and Return
37
40 Fixed Income Analysis for Chartered Financial Analysts, Frank Fabozzi Associates, 2000.41 On risk theory related to investment on financial markets, see for instance Mishkin, F., The Eco-
nomics of Money, Banking and Financial Markets, Mishkin Economics, or Боди, Кейн, Маркъс,Инвестиции, Натурела, 2000.
hand. This makes them particularly suitable for investment by central
banks in view of the latter’s functions and the role of reserves in dis-
charging them.
Fabozzi (2000)40 lists two main subgroups of fixed interest income
assets: debt and privilege shares. Debt includes bonds, mortgages,
equity backed bonds, and bank loans. Bonds may give income
through a coupon and/or discount. In managing foreign reserves,
central banks traditionally invest in fixed income financial assets, and
moreover in tradable debt most often issued or underwritten by for-
eign governments or supranational bodies. Naturally, some central
banks and other public bodies may also invest in assets not featur-
ing fixed income. For instance, the Hong Kong central bank has in-
vested in foreign equity and in the Norwegian Petroleum Fund.
2. Types of Asset Risk41
Central banks face manifold risks when investing foreign re-
serves. They stem from the objective natures of financial assets and
the international financial markets where they are traded. Financial
risks ought to be thoroughly understood, defined, quantitatively clas-
sified, and managed. This is an ongoing and complex process. Be-
low we restate that, in the broadest sense, risk for financial market
participants arises from the conditions of insecurity under which they
have to implement investment decisions.
Investment risk reflects the degree to which an asset or a portfo-
lio of assets is open to risk.
Risk factors are reasons for uncertainty as to the eventual income
at the close of the investment horizon. They are parameters which
determine the probable distribution of return. Main risk factors for as-
sets in central bank portfolios include:
• sudden exchange rate changes;
• sudden interest rate changes (i.e., changes in yield curves);
38
Part One. The Theoretical Foundations
42 We use “duration” in the identical sense below.
• sudden changes in the ability clients’ or debt issuers’ ability to
pay.
These risk factors define the main risks to which a financial asset
or asset portfolio is subject: currency risk; interest rate risk, and credit
risk. Currency and interest risks are varieties of market risk, being
functions of evolutions in important market variables such as ex-
change rates or base rates. Market risks may lead to (occasionally
temporary) falls in the market value of an asset. Each participant in
the financial markets is subject to the risk of imbalance between the
structures of his assets and liabilities.
Below are definitions of the most widespread types of risk in finan-
cial asset or portfolio management.
Currency Risk. This is the danger of losses resulting from a
change in the exchange rate of the currency in which the asset is
priced against the base currency in which financial results are ac-
counted. Currency risk for each financial institution stems largely from
the difference between the currency structures of assets and liabili-
ties, and ought not to be linked exclusively with assets, as is often
done. The greater the currency structure disparities between assets
and liabilities, the greater the risk the institution courts.
Interest Rate Risk. This is the danger of falls in the market value
of fixed income paper (bonds) stemming from changes in the yield
curve. Modified duration42 is a basic measure of interest rate risk. It
assesses the extent to which a given asset or liability’s market value
may change with minor changes in interest rates and concomitant
changes to the yield curve. Since interest risk is undoubtedly the
most significant risk factor in bond portfolio management, we exam-
ine it in detail further below.
Credit Risk. This is the danger of an irrecoverable partial or com-
plete loss of the market value of a given asset resulting from insol-
vency or bankruptcy on the part of the issuer or debtor. Due to its
irreversibility, credit risk is seen as one of the gravest risk factors in
asset management. It is impossible or very hard to determine quan-
titatively. On the basis of a complex of criteria and in-depth credit

Chapter 2. Financial Asset Risk and Return
39
analyses, ratings agencies assign credit ratings to public companies,
and especially to financial institutions. These ratings are measures of
the credit risk an institution carries. Alongside this, ratings agencies
prepare and publish comparative tables on credit rating evolution.
These matrices comprise the probability of a credit rating cut or of
direct bankruptcy over a set period (say, a year) for companies
grouped by credit ratings. Probabilities are extrapolated from histori-
cal data. Ratings are crucial in central bank asset management credit
risk analysis and assessment.
Spread Risk. This is the danger of loss stemming from changes in
the yield curve spreads of assets subjected to credit risk against the
benchmark (government bond) yield curve. All fixed interest paper
not issued by a government is subject to spread risk. Some analysts
view spread risk as market related, while others see it as credit re-
lated. We feel it is essentially much closer to market risk.
Apart from the aforementioned risks, many other and often no less
significant dangers attend financial asset or portfolio management
(and foreign reserve management in particular). They affect liquidity,
operations, the law, the model used, and reputation.
Liquidity Risk. This is the danger of a company, and particularly a
financial institution, not having enough liquidity to meet its obligations.
Liquidity risk management is particularly important in every central
bank. Under a currency board, the need for a high liquidity of foreign
reserves is imposed by the central bank’s duty to offer unlimited
quantities of the reserve currency on demand.
The second expression of liquidity risk is in the danger that a finan-
cial institution may not be able to sell its assets at fair prices, or within
set or reasonable timescales. Because of this, central banks usually
keep the greater part of their assets highly liquid (and low risk).
Operational Risk. Most generally this is the risk of partial or full loss
(mostly irrecoverable) of asset market value due to, inter alia:
(1) badly drafted rules and procedures; (2) unintentional lapses from
set rules and procedures, and omissions and errors in the payment
process; (3) breakdowns in information and communications sys-
tems; (4) natural disasters, acts of terrorism and other exceptional
events; or (5) intentional violations of rules and procedures, and at-
40
Part One. The Theoretical Foundations
tempts at fraud or abuse of privilege. Operational risk is regarded as
among the most hazardous forms of risk; it is hard to quantify and
there are as yet no widely accepted models of measuring and man-
aging it. History shows that where operational risk rears its head,
large companies can go to the wall. Operational risk is mostly man-
aged by implementing clear rules, separating payments from trans-
actions, establishing independent control and internal audit, account-
ing independence, and clear organizational structures preempting
conflicts of interest.
Model Risk. This is the danger stemming from models which fail to
describe reality well enough. Relying on such models and using them
in practice would lead to wrong conclusions and potential financial
loss. Model testing is particularly important in managing this type of
risk. Literature very often classifies it as part of operational risk.
Reputation Risk. This is the danger of events hitting an institution’s
standing domestically or internationally. This type of risk indirectly
affects a company’s market value (its market capitalization). As re-
gards central banks, it would manifest itself in the partial or complete
loss of confidence in a central bank, in turn eroding confidence in the
local currency and boosting demand for foreign currencies. Interna-
tionally, reputation risk would complicate relations with business part-
ners and lower market quotations or cause them to be withheld.
Legal Risk. Broadly present in every business, this type of risk is
the danger of losses as a result of poor awareness of legislation gov-
erning transactions. Central banks are exposed to legal risk in man-
aging foreign reserves because some or all transactions are subject
to foreign statutes which may not dovetail with national ones. This
calls for detailed study of specialist foreign legislation.
Communications advances in the 1990s put financial markets
across the world into a single information environment. Financial lib-
eralization and the fall of barriers to the movement of capital since the
1980s make today’s markets a global system of interconnected ves-
sels which cannot tolerate long term disbalance. World trade in goods
is growing even faster than world GDP. Regional diversification is
ever harder to sustain, with most institutional investors seeking diver-
sification based on asset and financial product groups.
Chapter 2. Financial Asset Risk and Return
41
Structural changes to world financial markets since the 1990s set
new challenges in the form of systemic financial crises. Systemic cri-
ses combine high exchange rate fluctuations and banking and eco-
nomic crises with sudden switches in financial asset liquidity. Thus
the past seven years witnessed events whose financial market con-
sequences were unprecedented in scale. Two South East Asian and
Russian financial crises of 1997 and 1998 caused record asset price
and exchange rate fluctuations, as well as record risk spreads. To
protect financial markets from further contagion, in 1998 the Fed cut
interest rates by 25bp and led the rescue of the Long Term Capital
Management hedging fund43 whose foreign positions (including off-
balance sheet ones) had reached over USD120b. The largest US
equity market correction since 1897 came in 2000. After the dotcom
bubble burst alongside related irrational expectations of future high
tech sector earnings, equity investors lost almost half the value they
had accumulated. The credit for the failure of such a huge loss to
cause serious shocks in the global business cycle goes to the ener-
getic Fed policy of cutting interest rates by a record 475bp in a year,
starting at 6.25 per cent. Aggressive 150bp cuts by the ECB accom-
panied this.
3. Financial Asset Return. The Yield Curve
3.1. Return
When on international financial markets a decision to invest in a
particular financial asset or to create a portfolio of financial assets is
made, there exists great uncertainty as nothing more than “an expec-
tation of the return” can be conjectured, i.e. the expected return on
the asset or portfolio of assets. It is calculated based on the assump-
tion that, theoretically, the returns are normally distributed.
After the end of the investment horizon, it may turn out that the
actual or so-called realized return differs from the expected. The
probability to realize return different form the expected one is called
43 LTCM was a closed type investment fund managed by Nobel Prize winning economists RobertMerton and Myron Scholes.

42
Part One. The Theoretical Foundations
investment risk and is measured by standard deviation (volatility of
the return), or other risk measures. In case some particular return,
specified in advance in the investment objectives of a given portfo-
lio, need be attained – the so-called target return, naturally the invest-
ment risk comes to be the probability to receive return different from
the target one.
3.2. Yield Curve
A key concept for the fixed income assets markets is the yield
curve. It is comprised of a set of points defining the relation between
the return on a financial asset and its time to maturity. A starting point
for all parties involved in the investment process is the so-called
benchmark yield curve – the one which shows the yields of the most
recently issued government bonds. The Eurozone benchmark curve
comprises French government bonds for the maturity sectors up to
one year and German government bonds for the maturities longer
than one year. The current yield levels of the curve are also known as
spot yields in order to differentiate them from the so called forward
yield curve, another important concept on the fixed income markets,
which shows the announced (or contracted) future yields of the same
type fixed income securities which are to be issued.
Figure 1 Yield Curve

Chapter 2. Financial Asset Risk and Return
43
Spot rate (sn) − this is the rate we negotiate today and which we will
receive as income from today on for each period of an n number of peri-ods if we issue a security with fixed time to maturity. This means the if weissue an n-period security of USD 1 today at spot rate sn, after n periodswe will have income of (1 + s
n)n USD.
Forward rate (nfm
) is the rate which we negotiate today and which wewill receive each period in the course of m periods if we give out a loancommencing after an n number of periods. This means that if we an-nounce today an m-period security of USD 1, which will be issued afteran n number of periods, at a forward rate of
nfm, after n + m periods we
will have an income of (1+ nfm
)m USD.
Forward rates can be derived from spot rates using the following relation:
(1+sn)n(1+
nfm
)m = (1+ sn+m
)n+m (1).
Box 1 Derivation of yield using spot and forward interest rates
Figure 3 Forward rates
Figure 2 Spot rates
There exist mathematical relations between the spot and forward
yield of securities.
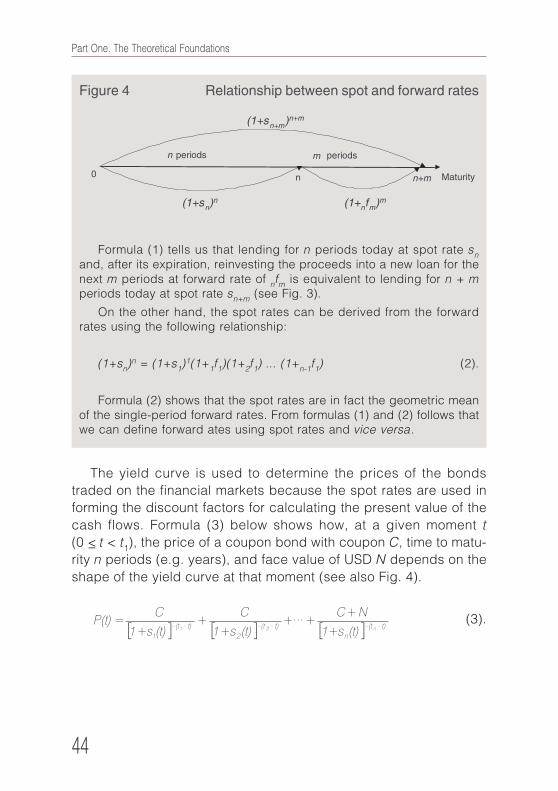
44
Part One. The Theoretical Foundations
Formula (1) tells us that lending for n periods today at spot rate sn
and, after its expiration, reinvesting the proceeds into a new loan for thenext m periods at forward rate of
nfm
is equivalent to lending for n + mperiods today at spot rate s
n+m (see Fig. 3).
On the other hand, the spot rates can be derived from the forwardrates using the following relationship:
(1+sn)n = (1+s
1)1(1+
1f1)(1+
2f1) ... (1+
n-1f1) (2).
Formula (2) shows that the spot rates are in fact the geometric meanof the single-period forward rates. From formulas (1) and (2) follows thatwe can define forward ates using spot rates and vice versa.
The yield curve is used to determine the prices of the bonds
traded on the financial markets because the spot rates are used in
forming the discount factors for calculating the present value of the
cash flows. Formula (3) below shows how, at a given moment t
(0 <_ t < t1), the price of a coupon bond with coupon C, time to matu-
rity n periods (e.g. years), and face value of USD N depends on the
shape of the yield curve at that moment (see also Fig. 4).
(3).
Figure 4 Relationship between spot and forward rates

Chapter 2. Financial Asset Risk and Return
45
44 This formula is valid when there is no coupon payment in the period under consideration.
In the formula, the variable t is an independent variable both for
the price of the bond and the level of the spot rates in order to under-
score that the latter change with time. The relative change in the price
of a bond between two moments in time, t0 and t
1, determines the
return on that bond Rt0,t1
44:
(4).
It is obvious from formulas (3) and (4) that, if we are at moment t0,
in order to calculate the return on the bond at moment t1, it is neces-
sary to forecast the yield curve at that future moment. Because of this,
the market participants use the expected return on the bonds in for-
mula (4) in order to determine the expected price of the bond P (t1)
at moment t1.
Within a future, even if particularly defined, investment horizon,
however, the yield curve is only probabilistically determined and de-
pends on different factors. In the first place, these are the expected
changes in the short-term interest rates. The latter are controlled by
the leading central banks in the world − The Federal Reserve System
of the USA, the European Central Bank, and the Bank of Japan. The
aforementioned central banks make decisions with respect to the in-
terest rates based on the expected deviations of the current inflation
levels from the implicitly or explicitly defined inflation target. Another
Figure 5 Price of a coupon bond at moment t
46
Part One. The Theoretical Foundations
45 Potential GDP (Potential economic activity) is the one at which the economy has full utilization ofits production capacity, including labor and capital (author’s note).
factor that informs their decisions regarding the short-term interest
rates is the extent of deviation of the current GDP level from the po-
tential one or the so-called output gap45.
The second factor that determines the yield curve is the level of
uncertainty embedded in the expectations of the market interest rates.
This uncertainty stems from the fact that the future levels of the short-
term interest rates are unknown and from the reaction of the central
bank to shocks. The uncertainty leads to an increase of the term risk
premium for the different maturity sectors.
Thirdly, the yield curve is also affected by a host of factors related
to the long-term interest rates. These are the expectations for: the long-
term inflation rate, the productivity of labor in the economy, the poten-
tial rate of economic growth, the demographic features of the popula-
tion and the structural fiscal position of the governments in the USA, EU
and Japan (the so-called structural deficit). The changes in the above-
listed factors affect the long-term interest rates – usually in the sectors
over 5 years.
In the last decade, a couple of persistent trends in the factors de-
termining the yield curve became salient. In the first place, there is a
tendency for a global reduction of inflation rates related to the enforce-
ment of rules on monetary policy of central banks, the focus of the
central banks, mandate on price stability, and an increase in the mon-
etary policy know-how. With the introduction of stricter discipline and
of subordination of the fiscal policy to dynamic rules in most industri-
alized nations, a reduction of the structural fiscal deficits was accom-
plished. At the same time, the ubiquitous financial liberalization induced
globalization of the financial markets and flows, which, in turn, contrib-
uted to the lasting reduction of the long-term interest rates and an in-
crease in the interdependence of the prices of financial securities in the
different parts of the world.
The unprecedented decrease in interest rates to record lows over
a very short period of time that was undertaken by the two leading
central banks spurred a record increase in the value of fixed income
securities investments worldwide. Since the beginning of 2001 till April
Chapter 2. Financial Asset Risk and Return
47
2004, the return from investment in the Morgan Stanley World Bond
Index measured in USD46 is 37.8%. This is an unprecedented value
compared to the historical return realized from investing in fixed income
instruments. It is the result of an extraordinary clustering of events re-
lated to the aggressive reaction of the central banks and the congru-
ence in the cycle of the world interest rates observed in that period.
As mentioned above with regard to the factors determining the
monetary policy of central banks, the short-term interest rates have
procyclical behavior. In times of boom the interest rates rise, and in
times of recession they fall. Because of that we cannot expect inves-
tors in fixed income securities, especially central banks, to always re-
alize such a high return for such a short time. In case of reversal in the
cycle of interest rates in the next years, the return form investment in
fixed income bonds is bound to decline. The extent of this decline
depends mostly on how fast the interest rates go up and on how pro-
longed this increase is.
3.3. Yield Curve Theories and Empirical Evidence
Several theories have been created to explain the changes in ex-
pected return on bonds. The most popular of these are the pure ex-
pectations hypothesis, the liquidity preference theory, and the pre-
ferred habitat theory.
Pure Expectations Hypothesis
One of the earliest theories that comes to explain the shape of the
yield curve, as well as to predict the future spot rates, is known as the
Pure Expectations Hypothesis (PEH)47. According to it, the expecta-
tions of the market participants are reflected in the current yield curve
and can be extracted from it using forward rates. More precisely, a
key assertion of this theory is that the forward rate for a given future
period, which is embedded in the yield curve today, equals the ex-
pected future spot rate for the same period.48
nfm(t) = E[sm(t + n)] (5).
46 Morgan Stanley World Bond Index.47 An alternative name in financial literature for that theory is Unbiased Expectations Hypothesis.48 The transformation E designates mathematical expectation.
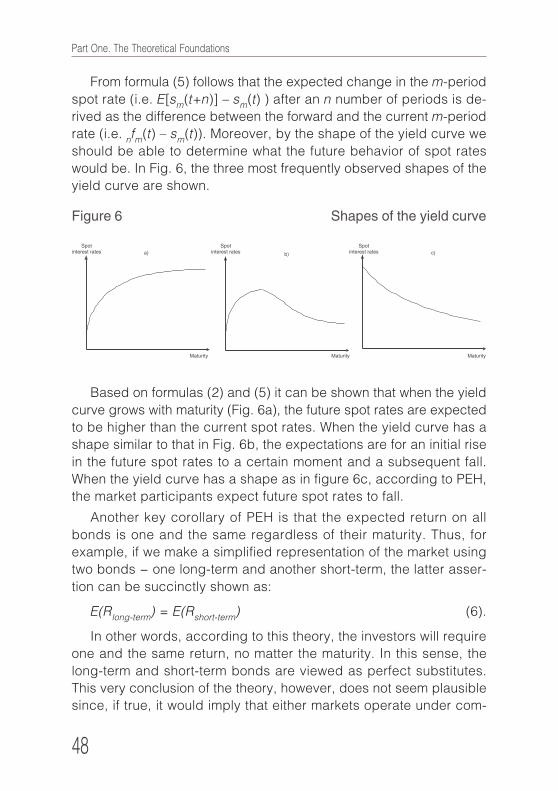
48
Part One. The Theoretical Foundations
From formula (5) follows that the expected change in the m-period
spot rate (i.e. E[sm(t+n)] – sm(t) ) after an n number of periods is de-
rived as the difference between the forward and the current m-period
rate (i.e. nfm
(t) – sm(t)). Moreover, by the shape of the yield curve we
should be able to determine what the future behavior of spot rates
would be. In Fig. 6, the three most frequently observed shapes of the
yield curve are shown.
Based on formulas (2) and (5) it can be shown that when the yield
curve grows with maturity (Fig. 6a), the future spot rates are expected
to be higher than the current spot rates. When the yield curve has a
shape similar to that in Fig. 6b, the expectations are for an initial rise
in the future spot rates to a certain moment and a subsequent fall.
When the yield curve has a shape as in figure 6c, according to PEH,
the market participants expect future spot rates to fall.
Another key corollary of PEH is that the expected return on all
bonds is one and the same regardless of their maturity. Thus, for
example, if we make a simplified representation of the market using
two bonds − one long-term and another short-term, the latter asser-
tion can be succinctly shown as:
E(Rlong-term
) = E(Rshort-term
) (6).
In other words, according to this theory, the investors will require
one and the same return, no matter the maturity. In this sense, the
long-term and short-term bonds are viewed as perfect substitutes.
This very conclusion of the theory, however, does not seem plausible
since, if true, it would imply that either markets operate under com-
Figure 6 Shapes of the yield curve
Chapter 2. Financial Asset Risk and Return
49
plete certainty or that investors are indifferent to the market risk they
take. As both conditions are unrealistic, another hypothesis which
does not necessitate these assumptions is later proposed.
The Liquidity Preference Theory
The liquidity Preference Theory (LPT) introduced by Hicks (1939)
asserts that the forward rates contain additional information apart
from the expectations of the market for the future interest rates. Ac-
cording to this theory, investors are not indifferent to risk but try to
avoid it unless compensated for taking it. The theory assumes that for
short investment horizons49 the long-term bonds are riskier than the
short-term bonds since the latter are more sensitive to changes in the
interest rates. That is why for the investors to be willing to invest in
long-term bonds, they need to receive a positive premium added to
the expected return in order to make higher income. Using this
theory, we can modify formula (6) in the following way:
E (Rlong
) = E (Rshort
) + risk premium P (N), P (N) > 0 (7).
An alternative interpretation of the higher expected return sought
after is that investors seek compensation via positive income because
of loss of liquidity due to investing in a longer-term bond.
nfm
(t) = E[sm
(t+n)] + liquidity premium L(m), L(m) > 0 (8).
The reasoning for both formula (7) and (8) is built around the fact
that they both depend on the time to maturity of the long-term bond
or, respectively, on the number of periods m over which interest is
compounded. The longer the bond, the greater the premium since the
probability for change in the short-term interest rates is greater. Ac-
cording to LPT, however, the premiums are constant over time. Un-
fortunately, though this theory does specify the sign of the premiums,
it does not say anything as to how determine their size.
A chief source of criticism against this theory is the fact that al-
though the long-term bonds are riskier than the short-term bonds for
a short horizon due to the greater capital risk of the former, the case
may be just the opposite for long-term horizons. This stems from the
49 I.e. holding period of the bond.
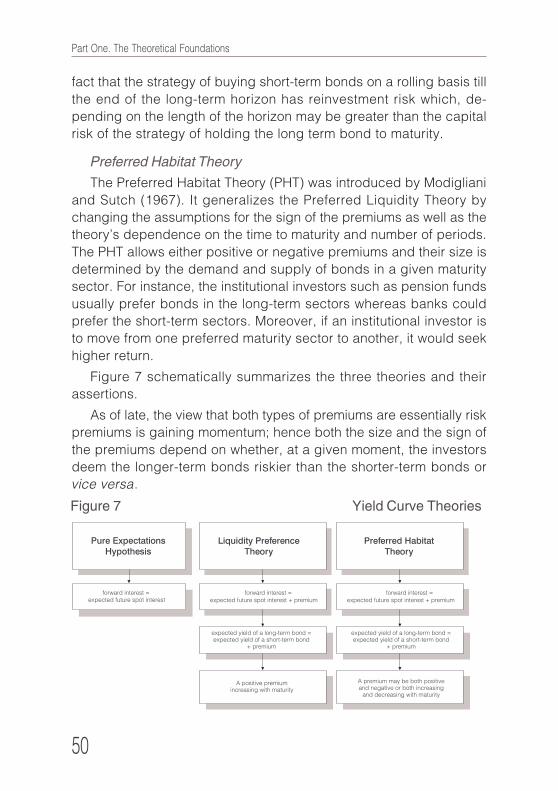
50
Part One. The Theoretical Foundations
fact that the strategy of buying short-term bonds on a rolling basis till
the end of the long-term horizon has reinvestment risk which, de-
pending on the length of the horizon may be greater than the capital
risk of the strategy of holding the long term bond to maturity.
Preferred Habitat Theory
The Preferred Habitat Theory (PHT) was introduced by Modigliani
and Sutch (1967). It generalizes the Preferred Liquidity Theory by
changing the assumptions for the sign of the premiums as well as the
theory’s dependence on the time to maturity and number of periods.
The PHT allows either positive or negative premiums and their size is
determined by the demand and supply of bonds in a given maturity
sector. For instance, the institutional investors such as pension funds
usually prefer bonds in the long-term sectors whereas banks could
prefer the short-term sectors. Moreover, if an institutional investor is
to move from one preferred maturity sector to another, it would seek
higher return.
Figure 7 schematically summarizes the three theories and their
assertions.
As of late, the view that both types of premiums are essentially risk
premiums is gaining momentum; hence both the size and the sign of
the premiums depend on whether, at a given moment, the investors
deem the longer-term bonds riskier than the shorter-term bonds or
vice versa.
Figure 7 Yield Curve Theories
Chapter 2. Financial Asset Risk and Return
51
50 Fama, E. and R. Bliss (1987) The Information in Long-Maturity Bond Rates. American EconomicReview, Vol. 77, Issue 4, September 1987, pp. 680–692.
51 Campbel, J. and R Shiller (1991) Yield Spreads and Interest Rates Movements: A Bird’s EyesView. The Review of Economic Studies, Vol. 58, Issue 3, Special Issue, The Econometrics of Fi-nancial Markets (May, 1991).
52 Fama, E. (2004) The Behavior of Interest Rates, unpublished manuscript, Graduate School ofBusiness, University of Chicago.
Empirical Evidence
Classical empirical tests of the theories reviewed above have been
conducted by Fama and Bliss (1987)50, Campbell and Shiller
(1991)51, and later again Fama (2004)52.
In an attempt to verify the theoretical conclusions using monthly
data on the spot and forward rates spanning a period of nearly 40
years, Fama and Bliss establish that for short periods (up to 1 year)
the forward interest rates do not possess significant prediction power
over the realized spot interest rates. With the increase of the length
of the period forecast to an interval from 2 to 4 years, the one-year
forward interest rate inferred from the four- and five-year spot rates
significantly increases the precision of its prediction. The authors
explain the behavior observed with the presence of a risk premium
which is variable over time but averages to a constant. The process
of returning to this “normal” level, however, is slow, and this is namely
from where the precision of the predictions over longer forecast pe-
riod comes.
However, the recent empirical research conducted by Fama
(2004), which wields monthly data over a considerably longer pe-
riod – observations span the period 1953–2002, rejects the former
findings of Fama and Bliss. The period can be factored into two
subpeiods. During the first period (1953–1985), a there is a marked
trend for rise of the spot rates, which peak in late 1981. During the
second period (1985–2002), the reverse trend of fall in spot rates is
observed. Within each subperiod, the quality of predictions using
PEH for long-term horizons is comparable and indeed good, but
when the whole period is taken under consideration, the quality of
predictions considerably deteriorates. Fama (2004) explains this fact
alleging that although interest rates do have the property to tend to
some mean level, this very level is not stationary but changes over
52
Part One. The Theoretical Foundations
time. Because of that the spot rates locally tend to the current long-
term interest rate level. The lack of stationarity is due to the influence
of unforeseeable shocks on the current mean level caused by struc-
tural changes in the economy or monetary policy which have taken
place in the meantime. These shocks have been previously dis-
cussed in the text above. Due to the unpredictable nature of these
shocks, the market participants cannot reflect them neither in the
expected changes of the spot rates, nor in the requisite risk premium.
Campbell and Shiller (1991) in research similar to that by Fama
and Bliss use monthly data for the period 1952–1987 and prove that
the spread between long-term and short-term interest rates does not
posses prediction power for horizons shorter than 3–4 years. Hence
the empirical evidence rejects the Pure Expectations Hypothesis for
short-term horizons. For long-term horizons, similarly to the findings
by Fama and Bliss, the empirical evidence does not reject the Pure
Expectations hypothesis. In order to explain the inability of the Pure
Expectations Hypothesis to account for the realized interest rates, the
authors assume that the size of the term risk premium between the
long- and short-term interest rates varies over time depending on the
changes in short-term interest rates.
Another classical empirical study analyzing the factors deriving
the yield curve dynamic was conducted by Knez, Litterman and
Scheinkmann (1994)53. Using principal component analysis, they
show that over 90% of the variations in the yield curve with two inde-
pendent and directly observable factors. The first one, which explains
80% of the yield curve dynamic, is its level and the second one is its
slope. This fact naturally turns the yield curve level and slope into
candidates for variables in the estimation of the expected yield curve
changes. Thus, information conditional on the current market informa-
tion on these two variables should be sought.
Other variables oftentimes used for conditional estimation of the
expected change in spot rates are the difference between forward
and spot rates or the combination of forward rates.
53 Knez, P., R. Litterman and J. Scheikman (1994) Explorations into Factor Explaining Money Mar-ket Returns. The Journal of Finance, XLIX, No 5.
Chapter 2. Financial Asset Risk and Return
53
54 Markovitz, H. (1952) Portfolio Selection. Journal of Finance, Volume 7, Issue 1, March 1952, pp. 77–91.
For short-term horizons ranging from a few months to a year, how-
ever, most of these models cannot manage a statistically significant
improvement of their prediction power compared to the simplest
econometric model – random walk. According to that model, the yield
curve has an expected change of 0, i.e. it cannot be forecast, and the
best forecast of the future spot rates are the current ones. This makes
the random walk model often used for estimating the expected return
on bonds.
4. Fundamentals of the Contemporary Portfolio
Management Theory
Harry Markovitz (1952)54, (1959) is the founder of modern portfo-
lio theory. In his article, and later − book, on the topic, he for the first
time formulates the optimization problem for portfolio management.
According to him, we have a choice between two alternative ap-
proaches when constructing an investment portfolio of securities. The
first alternative is to maximize the expected return given a fixed level
of risk (variation); the second alternative is to minimize the expected
risk given a level of expected return.
Later, portfolio theory undergoes further development. A host of
authors − Lee (1977), Litzenberger and Kraus (1976) – introduced
second and third moment of the return, and others, including Fama
(1969), Elton and Gruber (1974) strived to use more realistic distribu-
tions of the return on assets for optimization process purposes. The
model by Markovitz is based on a single period optimization and is
based on the assumption that economic agents make decisions in
each investment interval regardless of the actual return in the preced-
ing interval. In practice, however, the actual returns and variations in
the different time intervals are interconnected. Due to that fact,
Markovitz’s method undergoes development in order to encompass
more than one temporal interval, and thus the so-called dynamic op-
timization models were introduced. They are based on multiperiod

54
Part One. The Theoretical Foundations
optimization. Fama (1970)55 and Mossin (1969)56 show that under cer-
tain restrictive assumptions the multiperiod optimization reduces to a
single period one, and in this sense Markovitz’s model is a particular
case of the multiperiod optimization method.
On the whole, despite the various modifications and development,
the optimization based on risk and expected return forms the core of
nowadays portfolio theory as well.
55 Fama, E. (1970) Multiperiod Consumption-investment Decisions. American Economic Review 60,163–174.
56 Mossin, J. (1969) Optimal Multiperiod Portfolio Policies. Journal of Business 41, pp. 215–229.
Chapter 3. Process Organization
55
Chapter Three
Process Organization
As the prior Chapter shows, foreign reserve management by a
modern central bank is a routine investment process. Yet however
routine it may be, central banks need appropriate legislative and
regulatory frameworks and suitable internal organizations due to the
nature and function of reserves (see Chapter One) and the attendant
risks (see Chapter Two) in the constantly changing conditions of in-
ternational financial markets.
Legislation should define exchange and monetary rules clearly
and unambiguously: they are the limits the public sets the central
bank in its monetary policy. At the same time legislation must be suf-
ficiently flexible to afford the central bank leeway to react to interna-
tional market trends.
The complexity and public significance of the process also call for
legislation to define the central bank’s accountability mechanism and
its public communications as regards results, thus ensuring that risk
management as regards foreign reserves follows acceptable policy
and stays within publicly set bounds.
Managing foreign reserves became routine during the 1990s sub-
sequent to an analysis of the experience of the international financial
community, as well as experience within individual countries and their
central banks after the Second World War. Cukierman (1992)57 shows
unequivocally that inadequate legislative definition of monetary policy
and the rules for managing foreign reserves, as well as of account-
ability, limits the scope for clear cut public assessment of central
bank performance. This creates an environment of uncertainty, in-
creasing room for political conjecture at central bank expense, and
further limiting the bank’s ability to use reserves in accordance with
their intrinsic nature and function.
57 Cukierman, A. Central Bank Strategy, Credibility and Independence: Theory and Evidence.�TheMIT Press, Cambridge, MA, 1992.
56
Part One. The Theoretical Foundations
Rising to the above challenges, modern central banks took the
initiative for a gradual unification of investment decision standards
and of accountability as regards foreign reserves as part of interna-
tional financial accountability standards. These steps boosted the
volume, regularity, and quality of information to the public and to un-
biased analysts.
Comparability between central banks in foreign reserve manage-
ment at the close of the 1990s became an important basis for assess-
ing their investment process skills. The BNB is part of this initiative.
The Bank’s foreign reserves accountability is entirely in line with
adopted international standards. In evidence of this, statistical com-
pendia by all reputable international financial institutions such as the
IMF, the WB, and the ECB regularly publish BNB information.
The establishment of the ECB with its legal standing as an institu-
tion independent of national governments and the EC, had a positive
bearing on all accession states. Legal regulation of the performance
of accession state central banks became uniform, including foreign
reserve management. All these changes set new and higher require-
ments before national central banks which are members of the ESCB,
requiring regular, clear, unambiguous, and highly detailed account-
ability before the broad public.
The above challenges apart, central banks constantly face the
eternal dilemmas of whether to put up with lower yield on their assets,
or to give head to their appetite for greater risk by broadening its
definitions (naturally, within legal bounds). Made at the highest man-
agement level within the central bank, this choice is a strategic one
(Fig. 9). This decision making level also defines the margin of toler-
ance from this strategic portfolio choice as part of tactical positioning.
Strategic and tactical positioning are elective factors, affecting antici-
pated yield directly (see Chapter Two, Item 3).
In recent years central banks improved and largely standardised
decision making approaches on strategic and tactical positioning in
foreign reserve management. The objective was to limit the influence
of subjective assessments by managers at various levels of reserve
management in favor of modern probabilistic analysis methods, and
of harnessing bank and academic institution analytical potential as
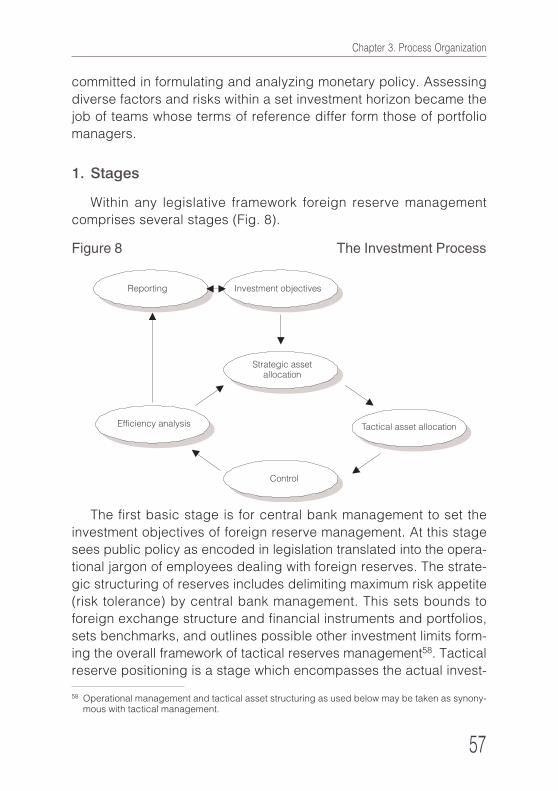
Chapter 3. Process Organization
57
committed in formulating and analyzing monetary policy. Assessing
diverse factors and risks within a set investment horizon became the
job of teams whose terms of reference differ form those of portfolio
managers.
1. Stages
Within any legislative framework foreign reserve management
comprises several stages (Fig. 8).
The first basic stage is for central bank management to set the
investment objectives of foreign reserve management. At this stage
sees public policy as encoded in legislation translated into the opera-
tional jargon of employees dealing with foreign reserves. The strate-
gic structuring of reserves includes delimiting maximum risk appetite
(risk tolerance) by central bank management. This sets bounds to
foreign exchange structure and financial instruments and portfolios,
sets benchmarks, and outlines possible other investment limits form-
ing the overall framework of tactical reserves management58. Tactical
reserve positioning is a stage which encompasses the actual invest-
Figure 8 The Investment Process
58 Operational management and tactical asset structuring as used below may be taken as synony-mous with tactical management.

58
Part One. The Theoretical Foundations
59 IMF (2003) Guidelines for Foreign Exchange Reserve Management, http://www.imf.org/external/np/mae/ferm/eng/index.htm.
ing of foreign exchange by individual portfolio managers. The control
stage involves comparing the results of tactical allocation with strate-
gic allocation. This generates information for the next stage. The re-
porting stage includes preparing reliable data on the outcomes of this
particular central bank business for bank managers and the public.
Analyses of reserve management effectiveness, assessments of the
degree to which investment objectives have been fulfilled, and feed-
back are obligatory here.
2. Central Bank Investment Objectives
After the 1990s changes to central bank status and performance,
maintaining and managing foreign reserves became one of the most
important and significant central bank functions. Though the political
and economic environment continue to affect this function, national
peculiarities bow to the consensus on the three basic investment
objectives in foreign reserve management59:
• security: guaranteeing adequate reserves to fulfil their defined
functions and retain their value;
• liquidity: ensuring a set proportion of reserves is available for
the operational objectives of monetary policy;
• yield: generating a return on investment within the medium and
long term horizons while consistently maintaining security and
liquidity.
While for most European central banks the security objective has
the leading priority, all three objectives are very closely linked as shown
in the theoretical overview of the investment process in Chapter Two.
This current understanding stems from the new imperative to pro-
vide financial stability which independent central banks and the ECB
discharge within the European economy. The rise of security as a
priority since the 1990s entailed major consequences for the process
of managing reserves. Trends there are the increase of those re-
sources (analytical tools, information and financial technology, and
people) which analyze, plan, control, and provide accountability, at
Chapter 3. Process Organization
59
the expense of those which conduct international financial market
operations.
Liquidity follows security closely due to the nature and significance
of foreign reserves as reviewed in Chapter One.
Changes in the priority of investment objectives also stemmed
from the effort of independent central banks to gain deeper aware-
ness and more knowledge of the objective nature of financial risk in
managing foreign reserves. The new priorities meet growing public
requirements for transparency and accountability in the performance
of today’s independent central banks amid growing haziness on the
international financial markets.
3. Strategic Asset Allocation
As with all investors, central banks have differing subjective views
of risk, with some being less, and others more, tolerant to it. Hence
balancing between subjective decisions and the application of theo-
retical probabilistic models (Chapter Two) are serious issues in or-
ganising the investment process.
Theoretically, structuring the foreign reserve portfolio of a central
bank comprises solving an optimisation riddle whose solution is the
optimum structure of a portfolio from the standpoint of maximum
yield60 within a set risk tolerance. Certain assumptions need to be
made to make the riddle solvable, some of which are inevitably sub-
jective and thus within the ambit of senior management.
Strategic asset allocation (SAA) reflects the central bank’s long
term policy on investment. It is formulated at the highest management
level, most often at board or governor level, or by a deputy governor
in charge of foreign reserves.
SAA traditionally defines three basic input components in the op-
timization task (Fig. 9). First of these is central bank investment risk
tolerance: the degree to which potential loss is acceptable. Second
is the classes of asset into which the central bank would invest within
its statutory leeway. Third come subsidiary investment constraints, if
60 This entails a mathematical expression (i.e., a mean) of the given value.
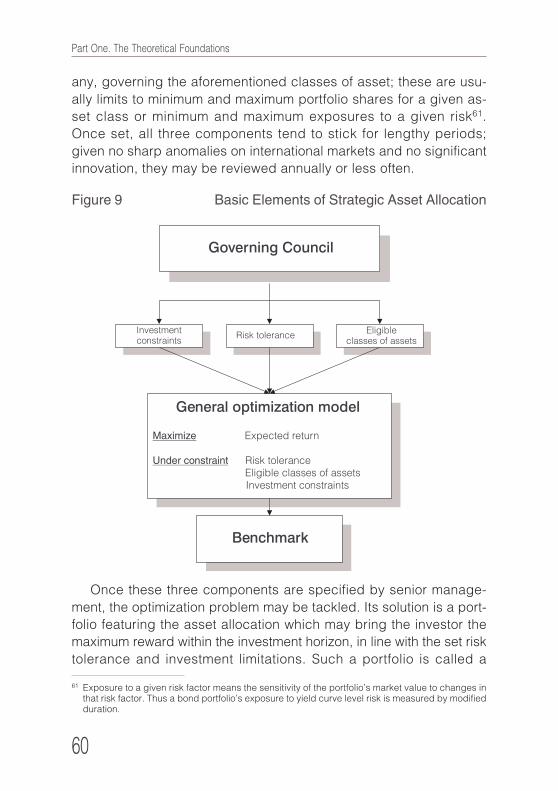
60
Part One. The Theoretical Foundations
any, governing the aforementioned classes of asset; these are usu-
ally limits to minimum and maximum portfolio shares for a given as-
set class or minimum and maximum exposures to a given risk61.
Once set, all three components tend to stick for lengthy periods;
given no sharp anomalies on international markets and no significant
innovation, they may be reviewed annually or less often.
Once these three components are specified by senior manage-
ment, the optimization problem may be tackled. Its solution is a port-
folio featuring the asset allocation which may bring the investor the
maximum reward within the investment horizon, in line with the set risk
tolerance and investment limitations. Such a portfolio is called a
61 Exposure to a given risk factor means the sensitivity of the portfolio’s market value to changes inthat risk factor. Thus a bond portfolio’s exposure to yield curve level risk is measured by modifiedduration.
Figure 9 Basic Elements of Strategic Asset Allocation
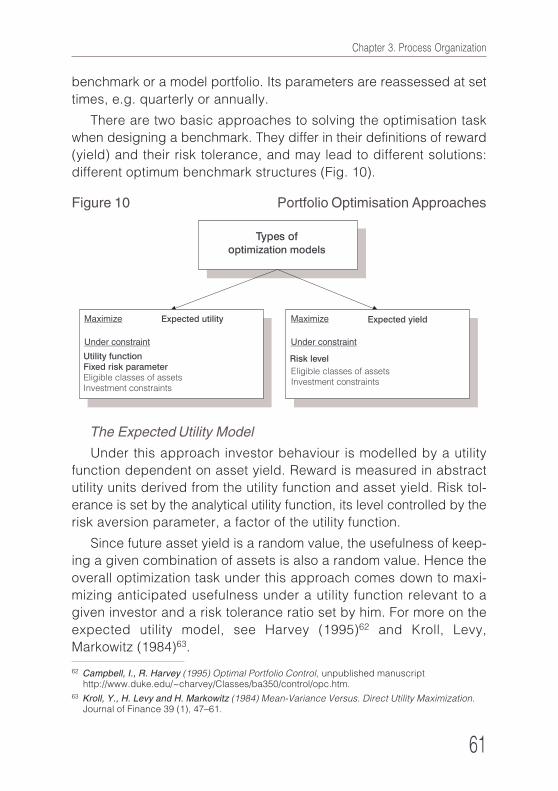
Chapter 3. Process Organization
61
benchmark or a model portfolio. Its parameters are reassessed at set
times, e.g. quarterly or annually.
There are two basic approaches to solving the optimisation task
when designing a benchmark. They differ in their definitions of reward
(yield) and their risk tolerance, and may lead to different solutions:
different optimum benchmark structures (Fig. 10).
The Expected Utility Model
Under this approach investor behaviour is modelled by a utility
function dependent on asset yield. Reward is measured in abstract
utility units derived from the utility function and asset yield. Risk tol-
erance is set by the analytical utility function, its level controlled by the
risk aversion parameter, a factor of the utility function.
Since future asset yield is a random value, the usefulness of keep-
ing a given combination of assets is also a random value. Hence the
overall optimization task under this approach comes down to maxi-
mizing anticipated usefulness under a utility function relevant to a
given investor and a risk tolerance ratio set by him. For more on the
expected utility model, see Harvey (1995)62 and Kroll, Levy,
Markowitz (1984)63.
62 Campbell, I., R. Harvey (1995) Optimal Portfolio Control, unpublished manuscripthttp://www.duke.edu/~charvey/Classes/ba350/control/opc.htm.
63 Kroll, Y., H. Levy and H. Markowitz (1984) Mean-Variance Versus. Direct Utility Maximization.Journal of Finance 39 (1), 47–61.
Figure 10 Portfolio Optimisation Approaches
62
Part One. The Theoretical Foundations
64 Haugen, Robert A. (2001) Modern Investment Theory. Pearson Higher Education, 5th edition,2001.
65 Kroll, Y., H. Levy and H. Markowitz (1984) Mean-Variance Versus. Direct Utility Maximization.Journal of Finance 39 (1), 47–61.
The benefits of the approach lie in its deep link with the fundamen-
tals of classical economics, and in the single solution it offers for sin-
gle period optimization, involving optimum weights for individual as-
sets over a broad range of utility functions. Another very important
benefit is that the approach is sufficiently flexible for use in signifi-
cantly more complex multi period optimizations.
The expected utility model also has serious drawbacks. One is
that all too often the expected utility function has no apparent analyti-
cal expression, rendering optimization difficult and calling for simula-
tion techniques. A second and more serious drawback is that setting
specific utility functions to describe individual investor risk appetites
is not easy, while defining individual investor risk tolerance ratios is
even harder. The difficulties this approach entails limit its practical
use greatly compared with the second optimisation approach.
The Expected Return Model
Under the expected return model the overall optimization task is
solved directly using yield and risk. As distinct from the expected
utility model, this approach defines investor reward as anticipated
yield, with risk tolerance assigned a risk measure. Solving the over-
all optimization task comes down to maximising anticipated portfolio
yield while keeping risk within limits corresponding to central bank
risk tolerance. For more on the expected yield model, see Haugen
(2001)64 and Kroll, Levy, Markowitz (1984)65.
Diverse forms of the approach may be applied depending on risk
measure. Widely applied risk measures include fluctuation, value at
risk (VaR), and conditional value at risk (CVaR) (see below). Risk
measures are functions of the probabilistic distribution of asset yield
and show the probability of variation in actual versus anticipated port-
folio yield.
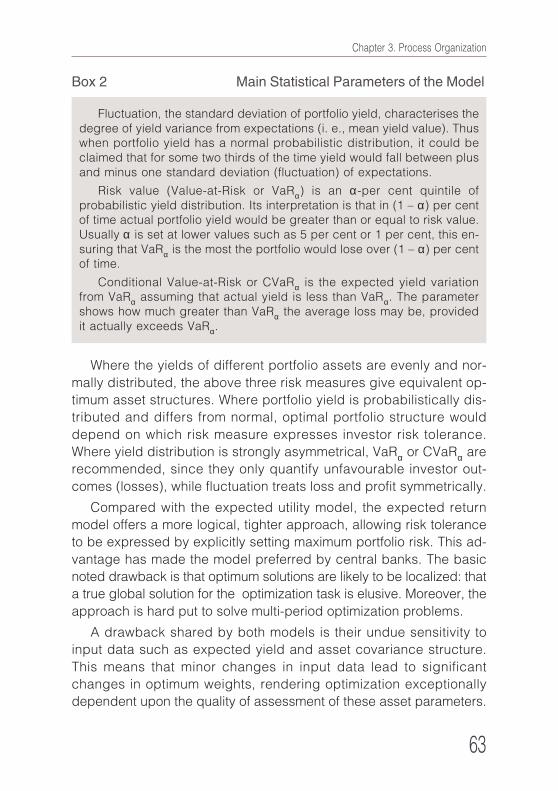
Chapter 3. Process Organization
63
Where the yields of different portfolio assets are evenly and nor-
mally distributed, the above three risk measures give equivalent op-
timum asset structures. Where portfolio yield is probabilistically dis-
tributed and differs from normal, optimal portfolio structure would
depend on which risk measure expresses investor risk tolerance.
Where yield distribution is strongly asymmetrical, VaRα or CVaRα are
recommended, since they only quantify unfavourable investor out-
comes (losses), while fluctuation treats loss and profit symmetrically.
Compared with the expected utility model, the expected return
model offers a more logical, tighter approach, allowing risk tolerance
to be expressed by explicitly setting maximum portfolio risk. This ad-
vantage has made the model preferred by central banks. The basic
noted drawback is that optimum solutions are likely to be localized: that
a true global solution for the optimization task is elusive. Moreover, the
approach is hard put to solve multi-period optimization problems.
A drawback shared by both models is their undue sensitivity to
input data such as expected yield and asset covariance structure.
This means that minor changes in input data lead to significant
changes in optimum weights, rendering optimization exceptionally
dependent upon the quality of assessment of these asset parameters.
Fluctuation, the standard deviation of portfolio yield, characterises thedegree of yield variance from expectations (i. e., mean yield value). Thuswhen portfolio yield has a normal probabilistic distribution, it could beclaimed that for some two thirds of the time yield would fall between plusand minus one standard deviation (fluctuation) of expectations.
Risk value (Value-at-Risk or VaRα) is an α-per cent quintile ofprobabilistic yield distribution. Its interpretation is that in (1 – α) per centof time actual portfolio yield would be greater than or equal to risk value.Usually α is set at lower values such as 5 per cent or 1 per cent, this en-suring that VaRα is the most the portfolio would lose over (1 – α) per centof time.
Conditional Value-at-Risk or CVaRα is the expected yield variationfrom VaRα assuming that actual yield is less than VaRα. The parametershows how much greater than VaRα the average loss may be, providedit actually exceeds VaRα.
Box 2 Main Statistical Parameters of the Model
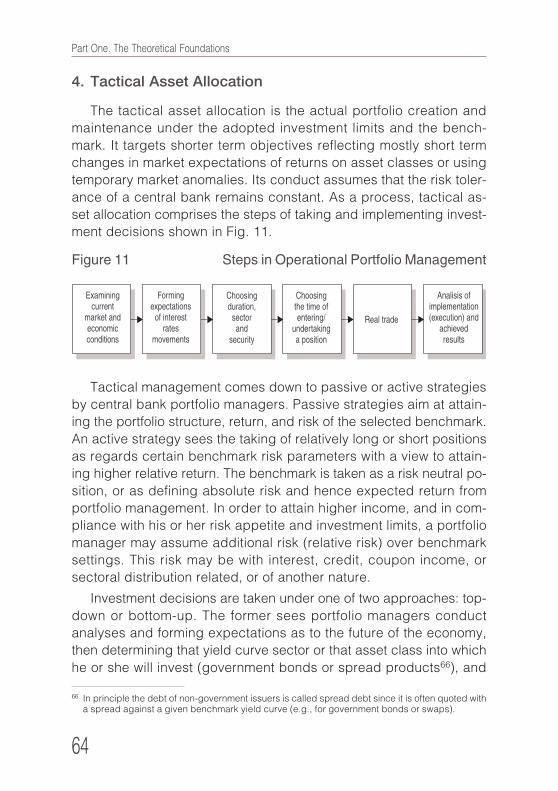
64
Part One. The Theoretical Foundations
4. Tactical Asset Allocation
The tactical asset allocation is the actual portfolio creation and
maintenance under the adopted investment limits and the bench-
mark. It targets shorter term objectives reflecting mostly short term
changes in market expectations of returns on asset classes or using
temporary market anomalies. Its conduct assumes that the risk toler-
ance of a central bank remains constant. As a process, tactical as-
set allocation comprises the steps of taking and implementing invest-
ment decisions shown in Fig. 11.
Tactical management comes down to passive or active strategies
by central bank portfolio managers. Passive strategies aim at attain-
ing the portfolio structure, return, and risk of the selected benchmark.
An active strategy sees the taking of relatively long or short positions
as regards certain benchmark risk parameters with a view to attain-
ing higher relative return. The benchmark is taken as a risk neutral po-
sition, or as defining absolute risk and hence expected return from
portfolio management. In order to attain higher income, and in com-
pliance with his or her risk appetite and investment limits, a portfolio
manager may assume additional risk (relative risk) over benchmark
settings. This risk may be with interest, credit, coupon income, or
sectoral distribution related, or of another nature.
Investment decisions are taken under one of two approaches: top-
down or bottom-up. The former sees portfolio managers conduct
analyses and forming expectations as to the future of the economy,
then determining that yield curve sector or that asset class into which
he or she will invest (government bonds or spread products66), and
Figure 11 Steps in Operational Portfolio Management
66 In principle the debt of non-government issuers is called spread debt since it is often quoted witha spread against a given benchmark yield curve (e.g., for government bonds or swaps).

Chapter 3. Process Organization
65
67 From a portfolio manager’s standpoint, these are long term investment decisions.68 From a portfolio manager’s standpoint, these are short term investment decisions.69 A long position against benchmark duration means that portfolio duration is longer than bench-
mark; short portfolio positions are shorter than benchmark.
finally defining the actual paper he would buy. The bottom-up ap-
proach sees portfolio managers focus primarily on analyzing and
forming expectations as to future bond yield, with less significance
assigned to economic conditions.
Choosing one of the two approaches depends upon the manag-
er’s strategy. An active position on duration primarily calls for the top-
down approach, while a passive strategy may rest on a bottom-up
approach. The two approaches may be applied simultaneously, for
instance in combining an active strategy as regards duration and
relative trading (buying bonds seen as underpriced and selling ones
seen as overpriced).
Tactical positioning of bond portfolios combines investment deci-
sions with horizons of between one day67 and one or more weeks68.
Adopting short or long term positions depends on expectations as to
interest rate levels and temporary market anomalies. As new informa-
tion on the economy or the market becomes known, portfolio structure
scenarios are reviewed. Possible repositioning follows, given accept-
able transaction costs, with a view to utilizing any new investment
opportunities.
In taking long or short positions vis-a-vis benchmark69, tactical
management assigns greater importance to interest rate changes
than to reinvestment risk, since the latter has bigger effect under long
term (over one year). Future interest rate movements depend on a
multitude of factors as shown in Chapter Two: economic conditions,
new debt offers, technical factors, market fluctuations and the readi-
ness of market participants to assume risk. Future interest rate levels
may be glimpsed from, inter alia, forward interest rates (as seen in
Chapter Two); information on positions and cashflows between mar-
ket participants; market expectations; relationships between forex,
equity, and bond markets; and macroeconomic models of interest
rates.

66
Part One. The Theoretical Foundations
70 See Зви Боди, Алекс Кейн, Алън Маркъс. Инвестиции, Натурела, 2000, p. 4.71 The greater the positive spread versus swap (in spread products) or the smaller the negative
spread (in government bonds), the cheaper a given paper is considered to be, and vice versa.72 The greater this difference, the cheaper the paper is deemed to be, and vice versa.73 The greater the standard deviation (a generally accepted value is over 1.5 standard deviations),
the cheaper a paper is deemed, and vice versa.74 This is expressed as attaining a simultaneous increase in income and decrease in risk, or attain-
ing higher income while retaining risk levels, as well as cutting overall portfolio risk while retain-ing expected return.
75 Swaps involve swapping fixed interest for floating interest debt; see Зви Боди, Алекс Кейн, АлънМаркъс, Инвестиции, Натурела, 2000, p. 617.
The next step is determining the desired relative portfolio position
regarding the yield curve. Long relative (higher weight) positions tend
to be taken, in sectors seen as underpriced, and appreciation is
awaited with frequent technical or collective analyses. Short or lower
weight positions are taken in sectors seen as overpriced, their depre-
ciation awaited in line with other sectors.
The next step in the investment process concerns the choice of
specific paper. Buying or selling a given paper also involves assess-
ing it as either rich with a potential fall, or cheap with a potential rise.
Whether the paper is rich or cheap depends upon:
• its spread vis-a-vis the swap curve70: a measure of the cost of
financing a position in this paper71;
• the difference between its theoretical price (derived by dis-
counting future flows by using a yield curve based on zero
coupon bonds) and current market price72;
• using z-scores (degree of standard deviation) or other similar
models based on the assumption that interest levels tend to
return to a mean level73.
When choosing paper, its liquidity risk is taken into account, since
lower liquidity leads to higher transaction costs, expressed as a
larger bid offer spread.
Achieving a better diversification effect74 often calls for making use
of investment opportunities in the spread product trade. In principle,
debt by non-sovereign issuers is called spread debt since it is quoted
with a spread vis-a-vis one benchmark yield curve or another (of gov-
ernment bonds or swaps75). More and more this debt tends to be
Chapter 3. Process Organization
67
measured as a movement against the swap curve, and hence ex-
pected movements in this curve are seen as highly influential on the
prices of these bonds. In turn, spread movements within a given
class of paper may depend upon changes in anticipated sector cred-
itworthiness, increased market sensitivity to worse general solvency
in the economy as a whole, or changes in the methods of calculating
some bond parameters within a sector (say a new benchmark curve
or changing supply and demand conditions).
Once a given security is seen to fall within the set investment lim-
its (as regards, inter alia, interest, credit risk, structure, and type),
transaction timing is defined. Positioning the portfolio too early vis-a-
vis anticipated market changes may hit overall relative portfolio yield.
Attaining higher or lower relative overall yield is linked mainly with the
vigor and duration of one of these: price changes, coupon income,
and reinvestment income. Thus where interest rate cuts are antici-
pated, taking a relatively long position earlier may deny us higher
reinvestment income, cutting overall relative income. A positive yield
curve slope (where long term interest is higher than short term) is
taken to show expectations of future interest rate hikes. Where inter-
est rates are rising, shorter durations are better maintained. Taking up
short durations, however, means occupying the short end of the yield
curve, meaning lower incomes until maturity. If the interest rate hike
is delayed or fails to take place, the end result of such a position
would be lower relative income.
Comparing actual income and assumed risk with those of the re-
lated benchmark is an indicator of successful portfolio management.
Where the portfolio structure fails to bring the expected results or new
investment opportunities arise, the above process is repeated.

68
International Foreign Exchange Reserves
PART TWO
EXPERIENCE OF THE BNB
IN MANAGING FOREIGN
EXCHANGE RESERVES
UNDER CURRENCY
BOARD ARRANGEMENT

70
Part Two. Experience of the BNB in Managing Foreign Exchange Reserves under Currency Board Arrangement
Chapter 4. The Nature and Significance of Foreign Reserves under a Currency Board Arrangement
71
Chapter Four
The Nature and Significance of Foreign Reserves
under a Currency Board Arrangement
1. The Definition of International Foreign Exchange
Reserves in the Law on the BNB of 1997
The Law on the BNB of 1997 (the LBNB) is very precise and con-
crete in defining foreign reserves and in licensing operations with
them. The law also provisions the general framework of transparency
and accountability in which the BNB operates, also introducing con-
trol mechanisms. The instrument limits the scope of subjective man-
agement decisions, introducing a rule-based approach which man-
ages reserves with a high degree of automatism. The quality of the
legal definition makes reserve management predictable to market
participants and observers, rendering central bank policy less likely
to be volatile over a long term. These features of the definition of for-
eign reserves are an important factor supporting confidence in the
currency board and the Bank.
Article 28, paragraph 3 of the law states that the gross interna-
tional reserves of the Bulgarian National Bank shall be equal to the
market value of the following assets of the Bank:
1. banknotes and coins held in freely convertible foreign cur-
rency;
2. funds in freely convertible foreign currency held by the Bulgar-
ian National Bank on accounts with foreign central banks or
with other foreign financial institutions, whereof obligations are
assigned one of the two highest ratings by two internationally
recognized credit rating agencies;
3. the Special Drawing Rights (SDRs) of the International Mon-
etary Fund held by the Bulgarian National Bank;

72
Part Two. Experience of the BNB in Managing Foreign Exchange Reserves under Currency Board Arrangement
4. debt instruments held by the Bulgarian National Bank and is-
sued by foreign countries, central banks, other foreign financial
institutions or international financial organizations, whereof ob-
ligations are assigned one of the two highest ratings by two
internationally recognized credit rating agencies, and which are
payable in freely convertible foreign currency with the excep-
tion of debt instruments given or received as collateral;
5. the balance on accounts receivable and accounts payable on
forward or repurchase agreements of the Bulgarian National
Bank, concluded with or guaranteed by foreign central banks,
public international financial organizations or other foreign fi-
nancial institutions, whose obligations are assigned one of the
two highest ratings by two internationally recognized credit
agencies, as well as futures and options of the Bulgarian Na-
tional Bank, binding foreign persons and payable in freely con-
vertible foreign currency;
6. the monetary gold.
The fact that the above definition has remained unchanged for
almost eight years shows the precision and lack of ambiguity in the
original 1997 draft. Amendments to the Law on the BNB in 2005 made
but two changes reflecting growing confidence in the currency board,
changes in global financial markets, and the Bank’s growing institu-
tional capacity and knowledge.
The first amendment (to Article 28, paragraph 3, item 6) intro-
duced mark-to-market valuation to accounting and reporting mon-
etary gold at the close of each day, instead of the former value cap
of 500 Deutsche marks per ounce. Since at the time of the amend-
ment the market price of gold was significantly higher than the pre-
vious nominal price, this constituted a positive valuation reserve form-
ing an additional stability buffer for the currency board. The second
amendment in the definition of foreign reserves (Article 28, paragraph
3, item 5) inserted greater precision into the BNB’s entitlement to use
futures contracts in response to financial market impetus and to ap-
ply its accumulated knowledge.
The definition of foreign reserves in the 1997 LBNB and subse-
quent amendments coincides with the theoretical meaning of the
Chapter 4. The Nature and Significance of Foreign Reserves under a Currency Board Arrangement
73
term. First, the Law very clearly defined and classified the rights and
duties of the BNB Issue Department as part of Bulgaria’s monetary
authorities, authorizing to it the management of foreign reserves. The
BNB received the legal mandate for managing cash equivalents, de-
posits, and other foreign currency assets on the balance sheet. Effec-
tively all of Bulgaria’s foreign assets on the date of the Law’s prom-
ulgation appeared on the BNB balance sheet. Second, the definition
of foreign reserves called on the BNB to be proactive in pursuing very
high asset liquidity and marketability. This followed from the Law’s
calling for cash, deposit accounts, and debt instruments to be:
• denominated in foreign currency;
• issued by central banks, governments and public or private
foreign financial institutions with very high credit ratings.
Article 31, paragraph 3 of the Law introduced an additional re-
quirement for “high marketability” linked to the restriction on currency
mismatch between assets and liabilities for currencies other than the
reserve currency (the euro) and the Bulgarian lev. The Law stipulated
that currency mismatch in assets shall not exceed 2 per cent with
respect to liabilities in the same foreign currency. The 2005 amend-
ment redrafted the Article more tightly, the Issue Department being
obliged to maintain the whole asset/liability mismatch in currencies
other than the euro, lev, Special Drawing Rights, and monetary gold,
at less than 2 per cent. The law was tighter with respect to the euro
because that currency is the reserve of the Bulgarian currency board.
It also reflected the growing use of the euro in asset management and
international trade76 and underlined the strategic Bulgarian goal of
euro area accession. BNB adherence to the rule constrains currency
risk in foreign reserve management.
The Article 31 requirement for high marketability and matching in
the currency structure of balance sheet assets and liabilities states
that foreign reserves may be invested only into the most developed
European and United States’ markets. Consequently, the currencies
of denomination for foreign assets are the euro and the US dollar.
Empirical evidence on the marketability of BNB foreign reserve assets
76 See also Table 1 in Part 1.
74
Part Two. Experience of the BNB in Managing Foreign Exchange Reserves under Currency Board Arrangement
77 Prior to lev denomination in 1999, the fixed exchange rate was BGL 1000 to DEM 1; see the Lawon Redenomination of the Bulgarian Lev, Darjaven Vestnik, issue 20 of 5 March 1999, amendedand re-enacted in issues 35 and 60 of 1999.
78 LBNB (the Law on the BNB) Article 29 (1997, amended and re-enacted 1998, 1999, 2001, 2002and 2005).
79 LBNB Article 30 (1997, amended and re-enacted 1998, 1999, 2001, 2002 and 2005).80 LBNB Article 28, paragraph 3 and Article 28, paragraph 2 (1997, amended and re-enacted 1998,
1999, 2001, 2002 and 2005).81 LBNB Article 28, paragraph 1 (1997, amended and re-enacted 1998, 1999, 2001, 2002 and
2005).
follows below in the discussion on the specific features of the Bulgar-
ian currency board and the description of the investment process at
the Bank.
2. Peculiarities of the Bulgarian Currency Board
as a Monetary and Foreign Exchange Regime
As is widely known, Bulgarian monetary and foreign exchange
policy changed acutely in June 1997 following an economic and fi-
nancial crisis. In place of discretionary central banking and a floating
exchange rate, the BNB was legally obliged to adopt a currency
board. The legal framework of the currency board was introduced by
the Law on the BNB promulgated in the Darjaven Vestnik, issue 46 of
10 June 1997 and came into force on the same day.
A government policy of full liberalisation of the movement of capital
accompanied the change in monetary regime. The major move in this
direction was the adoption of the Currency Law in September 1999.
The Bulgarian currency board shared some typical features with
traditional currency boards. The local currency was legally pegged to
a stable foreign currency (the anchor currency); in this case the
Deutsche mark and later the euro, at the fixed exchange rate of one
lev (BGL) to one mark77. The Law on the BNB foresaw an automatic
transition to the euro when it became legal tender in 1999, based on
the rate between it and the Deutsche mark at that instant78. The BNB
was legally bound to exchange local for foreign currency at the fixed
exchange rate and vice versa on demand79. The Law80 precisely
defined what constituted BNB foreign reserves and monetary liabili-
ties, setting a minimum coverage rate of 100 per cent of BNB mon-
etary liabilities with foreign reserves81.
Chapter 4. The Nature and Significance of Foreign Reserves under a Currency Board Arrangement
75
The Bulgarian currency board also had certain features which
were not typical of this type of monetary regime as adopted else-
where earlier. First, BNB monetary liabilities included (alongside
banknotes in circulation) other balances, including banking reserve
accounts and fiscal deposits and accounts except IMF liabilities82.
Second, the strategic goal of political and economic convergence
with the EU drove the choice of the Deutsche mark (and later the
euro) as the reserve currency, unlike many other currency boards
where this choice reflected economic agents’ preferences in unoffi-
cial currency substitution or else the dominant currency of foreign
trade. Indeed, research in 1997 showed that arguments for adopting
the US dollar as the anchor currency in Bulgaria were dominant83.
The 1997 Law on the BNB did not provide any legal mechanism
for changing the currency board. Indeed, on the eve of board launch,
a dominant view among its most prominent supporters was that in-
serting it into the Constitution84 would be the ultimate safeguard of
confidence in the currency system; the National Assembly deemed it
sufficient to introduce the currency board through the Law on the
BNB.
The main function of the currency board was to be performed by
the Issue Department of the BNB85. The Department was to be
headed by a Deputy Governor elected by parliament for a six-year
term at the nomination of the BNB Governor. The Deputy Governor
was also to be a member of the BNB Governing Council86. Accord-
ing to the Law on the BNB, the main duty of the Issue Department
was to maintain full coverage of BNB monetary liabilities with foreign
reserves and to manage these reserves effectively.
82 LBNB Article 28, paragraph 2, item 2 (2005).83 See Манчев, Михайлов. Паричен съвет, перспективи за растеж на икономиката и избор на
разменно съотношение на лева, Информационен бюлетин на БНБ, 4/1997.84 See Schuler, K., “The Importance of Being Orthodox,” The Hong Kong Baptist University’s Inter-
national Workshop on Currency Boards, 9 October 1999.85 LBNB Article 19, paragraph 1 and Article 20, paragraph 1 (1997, amended and re-enacted 1998,
1999, 2001, 2002 and 2005).86 LBNB Article 10, Article 11, paragraph 1 and Article 12, paragraphs 2, 4 and 5 (1997, amended
and re-enacted 1998, 1999, 2001, 2002 and 2005).
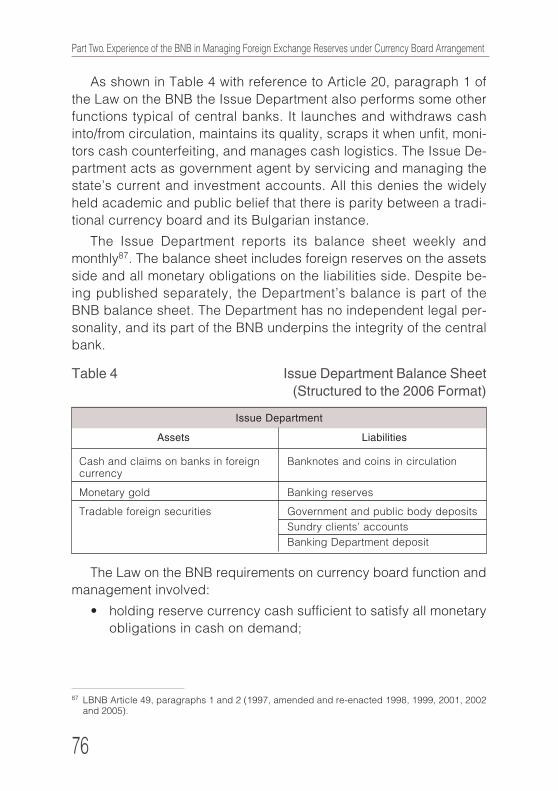
76
Part Two. Experience of the BNB in Managing Foreign Exchange Reserves under Currency Board Arrangement
87 LBNB Article 49, paragraphs 1 and 2 (1997, amended and re-enacted 1998, 1999, 2001, 2002and 2005).
As shown in Table 4 with reference to Article 20, paragraph 1 of
the Law on the BNB the Issue Department also performs some other
functions typical of central banks. It launches and withdraws cash
into/from circulation, maintains its quality, scraps it when unfit, moni-
tors cash counterfeiting, and manages cash logistics. The Issue De-
partment acts as government agent by servicing and managing the
state’s current and investment accounts. All this denies the widely
held academic and public belief that there is parity between a tradi-
tional currency board and its Bulgarian instance.
The Issue Department reports its balance sheet weekly and
monthly87. The balance sheet includes foreign reserves on the assets
side and all monetary obligations on the liabilities side. Despite be-
ing published separately, the Department’s balance is part of the
BNB balance sheet. The Department has no independent legal per-
sonality, and its part of the BNB underpins the integrity of the central
bank.
Table 4 Issue Department Balance Sheet(Structured to the 2006 Format)
Issue Department
Assets Liabilities
Cash and claims on banks in foreign Banknotes and coins in circulationcurrency
Monetary gold Banking reserves
Tradable foreign securities Government and public body deposits
Sundry clients’ accounts
Banking Department deposit
The Law on the BNB requirements on currency board function and
management involved:
• holding reserve currency cash sufficient to satisfy all monetary
obligations in cash on demand;
Chapter 4. The Nature and Significance of Foreign Reserves under a Currency Board Arrangement
77
• guaranteeing free and unlimited exchange on demand be-
tween leva and the reserve currency at the fixed exchange rate
and vice versa on an account-account basis;
• guaranteeing and servicing all government obligations in the
reserve and other currencies on demand at the fixed exchange
rate (for the reserve currency) or at market exchange rates vis-
a-vis the reserve currency (Article 31, paragraph 3);
• banning any BNB lending to the government or any govern-
ment-related body, exept when borrowing from the IMF under
Article 45;
• limiting any BNB lending to commercial banks domiciled in Bul-
garia (Article 33, paragraph 1), exept under the strictly defined
circumstances (Article 20, paragraph 2, Article 33, paragraph 2
and Article 34) of a systemic liquidity crisis when the Banking
Department may lend against collateral. The Banking Depart-
ment, however, could lend to banks only up to the amount of
deposits placed with the Issue Department under Ordinance
No 6 on lending to commercial banks against security.
• banning BNB participation in open market operations (Arti-
cle 56).
The market value excess of Issue Department assets against li-
abilities is equal to the balance of the Banking Department deposit.
In practice, this is the net asset value of the currency board. This
value comprises the excess cover of monetary obligations with for-
eign assets. It is this excess which may be employed for the above-
mentioned secured lending to commercial banks in a crisis. The
Banking Department deposit is the link between the balance sheets
of those two relatively independent BNB departments; consolidated,
they represent the BNB balance sheet.
The main duty of the Bulgarian currency board is to cover 100 per
cent or more of the monetary base and government and public body
reserve accounts with foreign reserves. The Issue Department has no
rights and duties involving similar BNB liabilities. Under the Law on
the BNB, the Issue Department and the Governing Council of the BNB
share the conduct of monetary policy under a currency board.
78
Part Two. Experience of the BNB in Managing Foreign Exchange Reserves under Currency Board Arrangement
88 For details, see Манчев, Цв. Особености на паричния съвет в България, Информационенбюлетин на БНБ, 8/1997.
At the same time, the Law on the BNB left government the option
of quasi-monetary operations between its accounts and commercial
banks through the liabilities of the Issue Department88. The above
specifics of the Bulgarian currency board render the BNB Governing
Council and government the twin pillars of monetary stability and for-
eign reserve management. This invalidates the view of some academ-
ics and the public that foreign reserve management is the sole re-
sponsibility of the Issue Department Deputy Governor. Those specif-
ics provide a certain balance between the entitlements of relevant
bodies (the BNB and the Ministry of Finance) in managing foreign
reserves.
3. Objectives and Major Functions of Foreign Reserves
in the 1997 Law on the Bulgarian National Bank
The objects of holding and issuing foreign reserves are immanent
in the above definition and in the specific legal features of the Bulgar-
ian currency board. They comply with the theoretical objectives of all
monetary and foreign exchange regimes reviewed in Part I. First, the
obligation of the BNB to exchange leva for the reserve currency au-
tomatically on demand at the fixed exchange rate calls for foreign re-
serves to sustain that fixed exchange rate. Second, the structure of
BNB monetary liabilities offers the opportunity of simultaneous attain-
ment of the other object of foreign reserves: that of a buffer to finance
foreign payment imbalances. The currency board ensures that all
economic agents who own notes and coins issued by the central
bank, or have cash at the BNB, may convert them into the reserve
currency at the fixed exchange rate to service foreign liabilities. The
third object of foreign reserves is to preserve the nation’s wealth
through investing fiscal reserves (the government deposit).
The central and most important function of Bulgaria’s foreign re-
serves under the currency board has been to perpetuate the legal lev
to Deutsche mark/euro peg since entry into force of the 1997 Law on

Chapter 4. The Nature and Significance of Foreign Reserves under a Currency Board Arrangement
79
the BNB. Another very important function of foreign reserves is to
curb vulnerability from external shocks and serve as a crisis shield.
This is implicit in the rule that BNB monetary liabilities should never
exceed the lev equivalent of foreign reserves89.
The Law on the BNB assigns significantly lower priorities to the
other theoretical functions of foreign reserves under a currency
board. Since the BNB may not wage monetary policy and therefore
cannot generate income from monetary instruments (as typical of
other monetary policy regimes), its foreign reserves are its prime
source of income. However, the Law on the BNB does not put prior-
ity on this Bank function: a significant circumstance in the Governing
Council’s setting of investment objectives and risk tolerance, as shall
be seen in Chapter 7.
In a currency board, the extent, dynamics, and adequacy of for-
eign reserves are endogenous macroeconomic variables. They de-
pend only on the desire of resident and non-resident agents to buy
or sell national currency at the fixed exchange rate. As is clear from
the distinctions between a currency board and other monetary re-
gimes, the BNB cannot take any discretionary decisions on the extent
of foreign reserves. Thus, their function as a liquidity buffer and bol-
ster of stability and confidence in local financial markets depends on
overall national economic policy.
At the same time, foreign reserve levels are determined to an ex-
tent by political will through government deposits at the BNB: pre-
dominantly prerogatives of the Finance Minister and the cabinet.
Considering the importance of foreign reserve adequacy under a
currency board, government decisions that could affect the foreign
reserve are coordinated with the BNB under Article 3 of the Law on
the BNB to safeguard the foreign exchange regime’s normal function.
89 LBNB Article 28, paragraph 1 (1997, amended and re-enacted 1998, 1999, 2001, 2002, and 2005).
80
Part Two. Experience of the BNB in Managing Foreign Exchange Reserves under Currency Board Arrangement
Chapter Five
BNB Policy in Managing Monetary Gold
In late 2007 BNB monetary gold comprised some 39.8 tonnes/
1296 million troy ounces (ozt) or 6 per cent of overall foreign reserves.
This amount has been accumulated since BNB establishment in
1879. The Bank’s attitude to gold has reflected the prevailing world
trends and national policy on participation in international financial
markets and world trade. During the Gold Standard era until the end
of the Second World War, gold had a monetary function and served
as a holding and backing reserve for money issue90. This was the
BNB’s most active period of monetary gold operations, measured by
transaction numbers and effect on the bank’s balance sheet.
In the Socialist era, the BNB held a satte monopoly on handling the
gold reserve, though it rarely did operations on international markets.
A portion of the national wealth was kept in gold, and the Bank occa-
sionally used this to regulate the currency or else financial relations
within the Council for Mutual Economic Assistance (Comecon). Data
on gold operations and national stocks were not publicly available
during the period. At the close of 1990 the BNB gold reserve91 com-
prised 34.1 tonnes (1097ozt), 92.7 per cent of which was monetary
gold.
When the National Assembly adopted the 1991 Law on the BNB,
it recognized gold as part of foreign reserves and the Bank resumed
regular reporting of gold holdings in Annual Reports and Information
Bulletins92. Gold owned by the BNB was not, however, in the form
90 For further details, see inter alia, 120 Years Bulgarian National Bank, 1879-1999, the BNB, 1999.91 The BNB Annual Report, 1990.92 See the BNB Information Bulletin issued biweekly between May 1991 and 1994. Later data ap-
peared in monthly Bulletins, Semiannual and Annual Reports. This information is currently updatedmonthly on the BNB website.
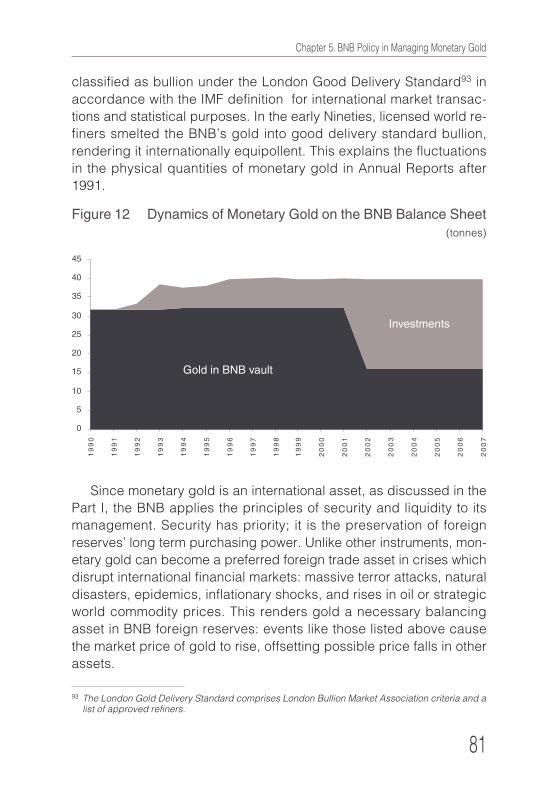
Chapter 5. BNB Policy in Managing Monetary Gold
81
classified as bullion under the London Good Delivery Standard93 in
accordance with the IMF definition for international market transac-
tions and statistical purposes. In the early Nineties, licensed world re-
finers smelted the BNB’s gold into good delivery standard bullion,
rendering it internationally equipollent. This explains the fluctuations
in the physical quantities of monetary gold in Annual Reports after
1991.
Figure 12 Dynamics of Monetary Gold on the BNB Balance Sheet(tonnes)
Since monetary gold is an international asset, as discussed in the
Part I, the BNB applies the principles of security and liquidity to its
management. Security has priority; it is the preservation of foreign
reserves’ long term purchasing power. Unlike other instruments, mon-
etary gold can become a preferred foreign trade asset in crises which
disrupt international financial markets: massive terror attacks, natural
disasters, epidemics, inflationary shocks, and rises in oil or strategic
world commodity prices. This renders gold a necessary balancing
asset in BNB foreign reserves: events like those listed above cause
the market price of gold to rise, offsetting possible price falls in other
assets.
93 The London Gold Delivery Standard comprises London Bullion Market Association criteria and alist of approved refiners.
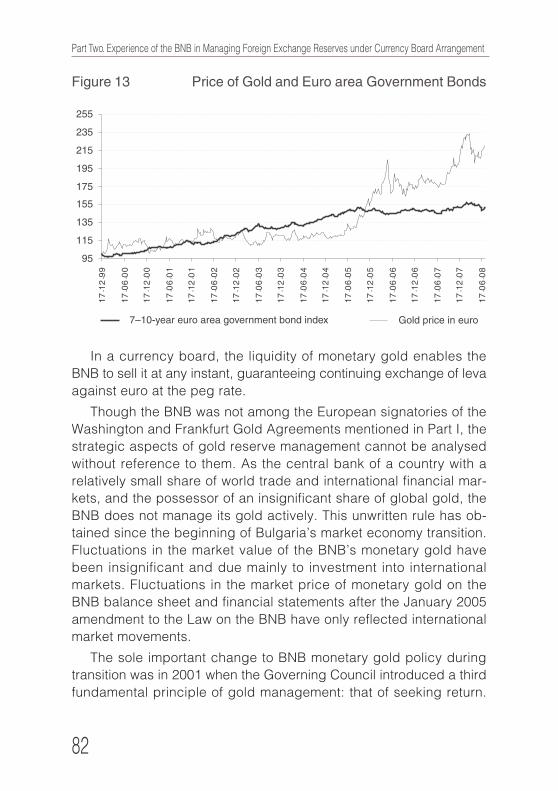
82
Part Two. Experience of the BNB in Managing Foreign Exchange Reserves under Currency Board Arrangement
Figure 13 Price of Gold and Euro area Government Bonds
In a currency board, the liquidity of monetary gold enables the
BNB to sell it at any instant, guaranteeing continuing exchange of leva
against euro at the peg rate.
Though the BNB was not among the European signatories of the
Washington and Frankfurt Gold Agreements mentioned in Part I, the
strategic aspects of gold reserve management cannot be analysed
without reference to them. As the central bank of a country with a
relatively small share of world trade and international financial mar-
kets, and the possessor of an insignificant share of global gold, the
BNB does not manage its gold actively. This unwritten rule has ob-
tained since the beginning of Bulgaria’s market economy transition.
Fluctuations in the market value of the BNB’s monetary gold have
been insignificant and due mainly to investment into international
markets. Fluctuations in the market price of monetary gold on the
BNB balance sheet and financial statements after the January 2005
amendment to the Law on the BNB have only reflected international
market movements.
The sole important change to BNB monetary gold policy during
transition was in 2001 when the Governing Council introduced a third
fundamental principle of gold management: that of seeking return.
Chapter 5. BNB Policy in Managing Monetary Gold
83
The Council set a limit to ensure that a policy change would not boost
credit risk substantially. Eligible instruments were also constrained by
the Law. The balance of risk and return versus discretion was attained
by splitting monetary gold into two approximately equal parts. Expos-
ing one to credit risk counterbalanced the lack of credit risk (yet zero
return) from the other, within limits set by the Law. Under this arrange-
ment long term returns from gold investment approximately covered
the cost of maintaining vault gold in a merchantable state. Annual
reviews of the effectiveness of this change show its sustainability over
a long run, taking into account international gold market trends and
their impact on the net market value of Issue Department assets.
Since this change the BNB has owned three types of monetary
gold instrument. The first, monetary gold (as a physical asset in
vaults), is not a source of credit risk since it does not constitute a
claim on the BNB and cannot be blocked or withdrawn in a hypotheti-
cal debt moratorium. At present this amounts to some 513,000ozt or
42 per cent of the Bank’s total monetary gold.
The second instrument, deposits denominated in physical gold, is
deposited (as if it were cash) with highly-rated private commercial
banks abroad for fixed terms, yielding interest on maturity dates. The
deposits are usually negotiated on the London interbank bullion mar-
ket, with delivery and settlement in Bank of England vaults. At the end
of 2005, 609,000ozt were thus invested: 51 per cent of the Bank’s
monetary gold. During substantial market fluctuations such as that
since October 2007, operations with gold deposits are temporarily
suspended and the metal is stored at the Bank of England due to
tighter credit risk constraints.
The third instrument, into which some 7 per cent of BNB gold was
invested between 2003 and 2007, are debt securities denominated in
gold. These are issued by international financial institutions and some
highly-rated private foreign banks. Essentially, they entail an uncon-
ditional obligation to pay the principal in physical gold at maturity94,
plus fixed coupons payable semiannually. For the gold-denominated
bonds into which the BNB has invested, the coupon has been pay-
94 According to London Good Delivery Standard.
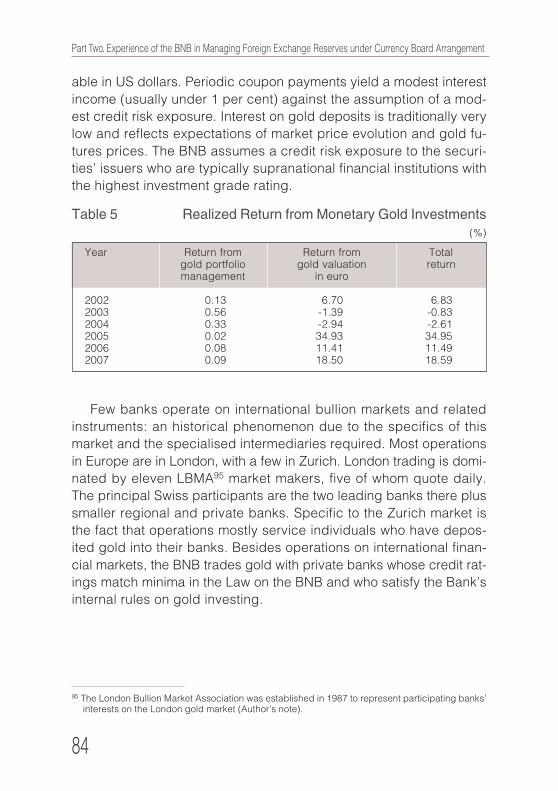
84
Part Two. Experience of the BNB in Managing Foreign Exchange Reserves under Currency Board Arrangement
able in US dollars. Periodic coupon payments yield a modest interest
income (usually under 1 per cent) against the assumption of a mod-
est credit risk exposure. Interest on gold deposits is traditionally very
low and reflects expectations of market price evolution and gold fu-
tures prices. The BNB assumes a credit risk exposure to the securi-
ties’ issuers who are typically supranational financial institutions with
the highest investment grade rating.
Table 5 Realized Return from Monetary Gold Investments(%)
Year Return from Return from Totalgold portfolio gold valuation returnmanagement in euro
2002 0.13 6.70 6.832003 0.56 -1.39 -0.832004 0.33 -2.94 -2.612005 0.02 34.93 34.952006 0.08 11.41 11.492007 0.09 18.50 18.59
Few banks operate on international bullion markets and related
instruments: an historical phenomenon due to the specifics of this
market and the specialised intermediaries required. Most operations
in Europe are in London, with a few in Zurich. London trading is domi-
nated by eleven LBMA95 market makers, five of whom quote daily.
The principal Swiss participants are the two leading banks there plus
smaller regional and private banks. Specific to the Zurich market is
the fact that operations mostly service individuals who have depos-
ited gold into their banks. Besides operations on international finan-
cial markets, the BNB trades gold with private banks whose credit rat-
ings match minima in the Law on the BNB and who satisfy the Bank’s
internal rules on gold investing.
95 The London Bullion Market Association was established in 1987 to represent participating banks’interests on the London gold market (Author’s note).
Chapter 6. Institutional Arrangements of the Investment Process at the BNB
85
Chapter Six
Institutional Arrangements
of the Investment Process at the BNB
1. Organisational Structure
The introduction of a currency board by the 1997 Law on the Bul-
garian National Bank (the LBNB) entailed an abrupt change in Bank
structure. The establishment of the Issue Department with the legally-
granted authority of taking “the actions necessary to manage interna-
tional currency reserves in an efficient manner”96 created conditions
for the emergence and gradual institutionalisation of a contemporary
standard investment process at the Bank. Another important factor
promoting this process after the 1997 LBNB adoption was the trend
for foreign reserves to grow as a result of national macroeconomic
and financial stability. After 1998 reserves passed the levels neces-
sary to maintain “full currency coverage of the total amount of BNB
liabilities” operationally on a daily basis.
Since the above core function of the Issue Department is legally
delegated to the Deputy Governor heading that Department,97 the
Deputy Governor plays a key role not only in maintaining the pegged
exchange rate regime, but also in structuring the management of the
foreign reserve. It depends entirely on the Deputy Governor whether
the Governing Council opinion is sought and to what extent the Coun-
cil determines the investment objectives and “the maximum risk ap-
petite” (Bank risk tolerance). It depends on the Deputy Governor
whether the public policy aspects of the LBNB concerning foreign
reserve management would be regarded and assessed by the pub-
lic as Bank policy or else as a matter of his or her personal choice
and responsibility.
96 LBNB Article 19.97 LBNB Article 18, paragraph 1.
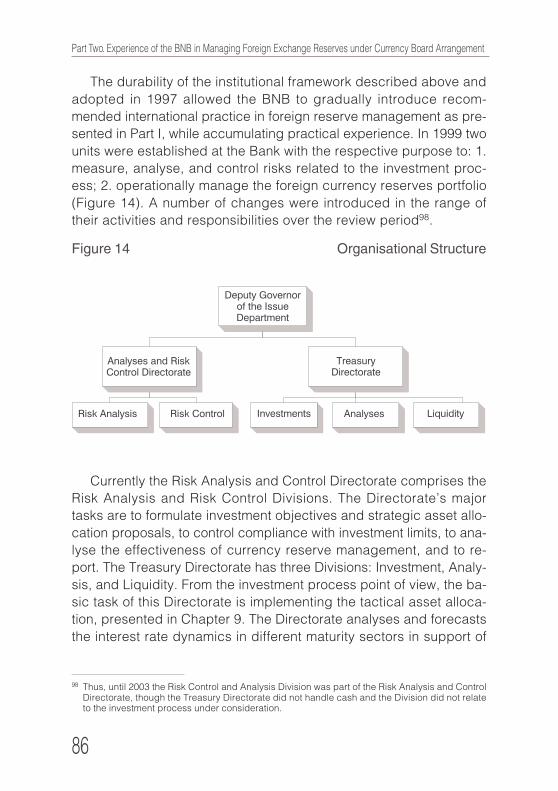
86
Part Two. Experience of the BNB in Managing Foreign Exchange Reserves under Currency Board Arrangement
The durability of the institutional framework described above and
adopted in 1997 allowed the BNB to gradually introduce recom-
mended international practice in foreign reserve management as pre-
sented in Part I, while accumulating practical experience. In 1999 two
units were established at the Bank with the respective purpose to: 1.
measure, analyse, and control risks related to the investment proc-
ess; 2. operationally manage the foreign currency reserves portfolio
(Figure 14). A number of changes were introduced in the range of
their activities and responsibilities over the review period98.
Figure 14 Organisational Structure
Currently the Risk Analysis and Control Directorate comprises the
Risk Analysis and Risk Control Divisions. The Directorate’s major
tasks are to formulate investment objectives and strategic asset allo-
cation proposals, to control compliance with investment limits, to ana-
lyse the effectiveness of currency reserve management, and to re-
port. The Treasury Directorate has three Divisions: Investment, Analy-
sis, and Liquidity. From the investment process point of view, the ba-
sic task of this Directorate is implementing the tactical asset alloca-
tion, presented in Chapter 9. The Directorate analyses and forecasts
the interest rate dynamics in different maturity sectors in support of
98 Thus, until 2003 the Risk Control and Analysis Division was part of the Risk Analysis and ControlDirectorate, though the Treasury Directorate did not handle cash and the Division did not relateto the investment process under consideration.
Chapter 6. Institutional Arrangements of the Investment Process at the BNB
87
portfolios’ tactical positioning against the benchmark over the invest-
ment horizon. It also forecasts the dynamics of liability components
of the Issue Department balance sheet in support of investment ob-
jective setting and strategic asset allocation.
The Risk Analysis Division develops methodologies for determin-
ing and measuring BNB foreign reserve investment management
objectives. The division also creates methologies on which SAA is
based. The main methodologies are: 1. risk measurement99; 2. quan-
tifying currency reserve investment limits, risk budgets, and optimum
benchmark; 3. assessing expected risk factor values and covariance
structure. Benchmark and investment limits are selected on these
grounds. Once allocated to investment portfolios, they set the scope
of tactical asset management. An important methodology being de-
veloped by Division risk managers will enable reserve management
effectiveness to be measured through multiple indicators and return
and market risk to be attributed by source100.
The Risk Control Division exercises operational control over the in-
vestment process. The Division also develops the basic principles
and rules for selecting, reviewing, and updating the list of foreign fi-
nancial institutions – BNB counterparties and methodologies for set-
ting counterparty, asset class and other credit limits. New financial in-
struments and asset classes in which to invest are analysed and pro-
posed independently or jointly with the Risk Analysis Division. Another
core function of the Division is to distribute to the society, the Govern-
ing Council of the BNB and the Deputy Governor of the Issue Depart-
ment regular analyses and periodic reporting on credit exposure, the
use of counterparty credit limits, and counterparty trading volumes by
types of instruments etc. The Division also reports any limit violations
to the Bank’s management. Another important Division function is to
develop and establish procedures and rules for limiting operational
risk. The Division also double checks Treasury Directorate Liquidity
Division SWIFT messages for all currency operations related to the
BNB portfolio management and to the larger payment operations of
the BNB clients.
99 Credit ratings assigned by leading credit agencies are used as a basic measure of credit risk.100 Yield and risk attribution involves using models to quantify the effects of risk factors.
88
Part Two. Experience of the BNB in Managing Foreign Exchange Reserves under Currency Board Arrangement
101 See Chapter 9.
The Investment Division invests the foreign reserve assets by im-
plementing the tactical asset allocation. The Division comprises
teams of portfolio managers, each managing individual portfolios. The
core task of each team is to obtain higher return than the respective
benchmark within the allocated tactical risk budget and other relative
to the benchmark limits. An associated goal is to achieve higher re-
turn per unit of assumed relative risk. Depending on their expecta-
tions, the portfolio managers prepare short-term market factor fore-
casts and assume or refrain from active exposures against the
benchmark in pursuit of these objectives.
Core functions of the Analyses Division are to monitor and analyse
financial markets and market expectations and forecast changes in
market variables such as interest rates, exchange rates, the gold
price and other. The forecasts are produced through econometric
and other models and are presented to a broad range of users: the
Issue Department Deputy Governor, the Investment Committee, and
portfolio managers in the form of investment recommendations. These
recommendations underpin adequate behavioural strategies against
the benchmark for some days to some weeks ahead. The Governing
Council and the Issue Department Deputy Governor decisions on in-
vestment objectives, risk tolerance, strategic asset allocation, and the
BNB position rest on longer-range forecasts (quarters, years). The In-
vestment Committee discusses these decisions before approval.
The Analyses Division specialists have developed methodology for
forecasting the liquidity necessary to support the banking sector in
Bulgaria, in case of a systemic liquidity crisis emerges. This variable
is used in determining the foreign reserve investment limits. The av-
erage value and expected currency composition of the Issue Depart-
ment liabilities for a set period (a quarter, an year) for which the
benchmark is valid is also forecast and used as input information in
the optimisation model for benchmark determination101.
The Analyses Division also prepares daily and weekly bulletins
that review and analyze the key events influencing changes in the
market value of Issue Department assets. The bulletins are publicly

Chapter 6. Institutional Arrangements of the Investment Process at the BNB
89
available and are posted on the BNB website. In addition, the Division
takes part in preparing publications and the BNB evaluations on in-
ternational financial markets and world economic development. The
Head of the Analyses Division is BNB representative on the ESCB
Market Monitoring Working Group.
The Liquidity Division is responsible for the settlement of all foreign
reserve transactions and for the necessary document finalization. An
important task of the Division is to forecast BNB liquidity by currency
types for daily payments execution purposes. When all details
needed to settle a transaction are filled-in, the Division performs pre-
liminary (so called: preliminary control) documentary checks for po-
tential errors. This errors are removed as detected. SWIFT messages
are transmitted after double (final) checking by the Risk Control Divi-
sion.
The operations of risk control and analysis of international cur-
rency reserves management effectiveness are carried out by the Risk
Analysis and Control Directorate. Its authority is to keep the fulfillment
of every action, described in the “Manual with Currency Reserves
Management Business Procedures”, and the compliance with all in-
vestment restrictions under surveillance. The Directorate has devel-
oped and is applying a Methodology for Measuring International Cur-
rency Reserve Management Effectiveness, approved by the Deputy
Governor. The internal rules for foreign reserve management and the
Manual allow the Director to report results from the risk control activ-
ity directly to the BNB Governing Council. This independence of the
Risk Analysis and Control Directorate and its head stem from a 2000
Governing Council resolution according to which the Director is ap-
pointed directly by the Governing Council.
Foreign reserve management (Figure 15) is unthinkable without
constant cooperation and exchange of information between the two
Directorates. This process is regulated in detail in the BPM (Business
Procedures Mannual) adopted by the Governing Council in 2004. The
document was developed with De Nederlandsche Bank experts un-
der a bilateral programme and embodies modern practice in foreign
reserve risk management. The BPM describes the authorities and re-
sponsibilities of each executive in the two Directorates as regards
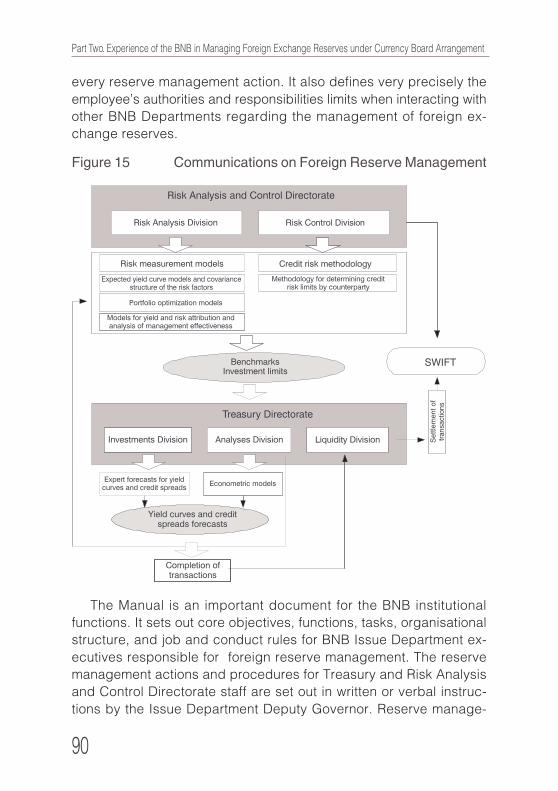
90
Part Two. Experience of the BNB in Managing Foreign Exchange Reserves under Currency Board Arrangement
every reserve management action. It also defines very precisely the
employee’s authorities and responsibilities limits when interacting with
other BNB Departments regarding the management of foreign ex-
change reserves.
Figure 15 Communications on Foreign Reserve Management
The Manual is an important document for the BNB institutional
functions. It sets out core objectives, functions, tasks, organisational
structure, and job and conduct rules for BNB Issue Department ex-
ecutives responsible for foreign reserve management. The reserve
management actions and procedures for Treasury and Risk Analysis
and Control Directorate staff are set out in written or verbal instruc-
tions by the Issue Department Deputy Governor. Reserve manage-

Chapter 6. Institutional Arrangements of the Investment Process at the BNB
91
ment procedures for staff from other Bank departments fall outside
the scope of the BPM. By using the Manual the two Directorates’ staff,
the auditors, and the Bank management handle and constrain opera-
tional risk more effectively.
The BPM is the basis for formulating foreign reserve management
efficiency and effectiveness and consequently for unambiguous as-
sessments by internal and/or external auditors. It also delineates in-
dividual Divisions’ and executives’ duties with respect to foreign re-
serve management. The document assists the adaptation of new
Treasury and Risk Analysis and Control Directorate staff and their
compliance with rules and procedures when operating with the for-
eign reserve.
The BPM is prepared and kept up-to-date by Treasury and Risk
Analysis and Control Directorate staff. The Issue Department Deputy
Governor endorses proposed changes in the manual. The changes to
actions and procedures which require BNB Governing Council ap-
proval are clearly defined. The Manual is kept in paper and electronic
formats. One employee from each Directorate compiles proposals for
accepting new procedures or updating existing ones and redrafts the
Manual on an ongoing basis. Employees investigate the need for
amendments, coordinate them between the Divisions, describe pro-
cedures, and update the BPM after approval by the Issue Department
Deputy Governor.
Each procedure (process, operation, and action) is assigned a
name and brief description (textual, graphic, and tabular) as to pur-
pose and sequence. Detailed work instructions have been developed
to comprehensively describe the process implementation techniques
and basic actions of foreign reserve management. These instructions
are systematised in a uniform document obviating contradiction or
repetition and ensuring compatibility. The result is that operational risk
is kept to a minimum.
2. Decision Making and Compliance Control
After 1997 the process of making important foreign reserve man-
agement decisions gradually assumed the sequence shown in Figure
92
Part Two. Experience of the BNB in Managing Foreign Exchange Reserves under Currency Board Arrangement
16. This forms part of the 2005 BNB Gross International Reserve
Management Internal Rules.
The BNB investment policy is formulated at the highest manage-
ment level: the Governing Council. The Council approves the
optimisation model and sets maximum risk tolerance annually. The
Investment objectives stem to a considerable extent from the Law on
the BNB. The Law, however, can neither specify income from foreign
reserve management, nor set a value on market risk. It is the Govern-
ing Council which sets the expected return in line with the reserve
size and structure, the Issue Department balance sheet leverage, and
market expectations for a year ahead.
The personal discretion which the 1997 LBNB grants the Issue
Department Deputy Governor with regard to the foreign reserve re-
flects public sentiment after the political, economic, and financial cri-
sis of late 1996 and early 1997. At the same time, the Law strikes a
balance between that Deputy Governor’s powers and duties. Thus,
the Bank Chief Auditor (the Comptroller) appraises the utilisation of
means and makes recommendations to the Governing Council where
necessary. The Issue Department Deputy Governor is nominated by
the BNB Governor for selection by the National Assembly. Both ex-
ecutives have identical terms in office which may generally be as-
sumed to start and end at the same time, unlike those of other Gov-
erning Council members.
The Issue Department Deputy Governor sets the investment ob-
jectives and limits in consultation with other BNB units. While he or
she may determine the Department’s management style, it has to rest
on approved rules or practices which cover every contingency.
The Investment Committee also plays an important role in BNB for-
eign reserve management. Created as an advisory body in 1997 un-
der BNB Governor Ordinance 200-001344/7.10.1997, it is chaired by
the Issue Department Deputy Governor. Initially the Committee com-
prised six representatives from the Risk Analysis and Control and
Treasury Directorates, plus experts from the Deputy Governor’s of-
fice. In early 2004 the Governing Council approved a proposal from
the Issue Department Deputy Governor for an increase in Committee
membership which gave senior managers from outside the Issue De-

Chapter 6. Institutional Arrangements of the Investment Process at the BNB
93
partment the right to vote. These executives are nominated by the
Governor and the other Deputy Governors and provide a balance vis-
a-vis Issue Department representatives. The Issue Department
Deputy Governor continues to chair the Committee but has no vote.
This reorganisation utilised BNB analytical and expert capacity bet-
ter in preparing decisions on foreign reserve management. The Gov-
erning Council now receives a greater volume of more timely and
more detailed information on the investment process and enjoys
greater involvement in fixing investment objectives and setting the
Bank’s risk tolerance.
The Investment Committee has an advisory role in result assess-
ments, the definition of strategies for international currency asset
management, and risk factors related to Bank asset and liability man-
agement. The Committee’s composition and changes in it are en-
dorsed by the Governor upon proposal by the Issue Department
Deputy Governor. The Committee comprises representatives of the
Governor’s office and of the Banking and Banking Supervision De-
partments, the Treasury Director, the Risk Analysis and Control Direc-
tor, the Economic Research and Forecasting Director, the Heads of
the Treasury Directorate Analysis and Investment Divisions, and the
Heads of the Risk Analysis and Control Directorate Control and Analy-
sis Divisions. The Chair may invite other Bank executives to sit on the
Committee with no voting rights.
The Committee deliberates and adopts: A. strategic asset alloca-
tion from the Risk Analysis and Control Directorate; B. financial mar-
ket reviews and expectations from the Treasury Directorate Analysis
Division; C. quarterly and yearly foreign reserve management reports
from the Risk Analysis and Control Directorate (on effectiveness) and
the Treasury Directorate (on management reviews); D. counterparty
reviews from the Risk Analysis and Control Directorate.
The Committee’s Terms of Reference define its scope and organi-
sation and its members’ powers and duties, resolving a priori a
number of procedural issues and improving its effectiveness. The
Heads of the Internal Audit and Accounting Directorates are invited
on the Committee as observers.
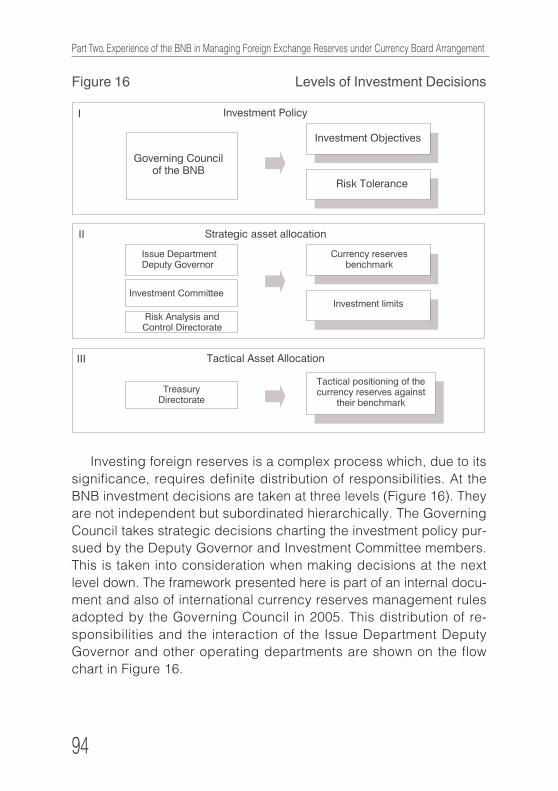
94
Part Two. Experience of the BNB in Managing Foreign Exchange Reserves under Currency Board Arrangement
Figure 16 Levels of Investment Decisions
Investing foreign reserves is a complex process which, due to its
significance, requires definite distribution of responsibilities. At the
BNB investment decisions are taken at three levels (Figure 16). They
are not independent but subordinated hierarchically. The Governing
Council takes strategic decisions charting the investment policy pur-
sued by the Deputy Governor and Investment Committee members.
This is taken into consideration when making decisions at the next
level down. The framework presented here is part of an internal docu-
ment and also of international currency reserves management rules
adopted by the Governing Council in 2005. This distribution of re-
sponsibilities and the interaction of the Issue Department Deputy
Governor and other operating departments are shown on the flow
chart in Figure 16.

Chapter 6. Institutional Arrangements of the Investment Process at the BNB
95
Strategic asset allocation (SAA) takes place at the second man-
agement level. SAA turns the investment objectives and market risk
limits set by the Governing Council into practical rules for optimal
portfolio management and aggregate risk limits. The optimal portfo-
lio, or benchmark in professional jargon, is really a choice of weights
of various permitted asset classes which form a structure that ought
to generate maximum return. The risk tolerance set by the Governing
Council is key input information in SAA. This is nothing more or less
than a core investment limit and is the most influential consideration
in determining the selection of optimal asset classes. As reviewed in
Part I, the choice of a benchmark portfolio in practice determines 90
per cent of risk and return.
The second task of SAA is to define the investment objectives in
detail. This turns the overall investment limit set by the Governing
Council into specific investment limits at the asset class and portfo-
lio levels.
At the technical level, benchmark selection proposals are pre-
pared quarterly by the Risk Analysis and Control Directorate. They
are presented before the Investment Committee which reports its
opinion to the Deputy Governor alongside a motivated benchmark se-
lection proposal. The Deputy Governor expresses an opinion on the
Committee proposals and tables them before the BNB Governing
Council.
It is the Treasury Directorate which implements the Deputy Gov-
ernor’s decision on benchmark structure while adhering to set risk
limits. This is the third stage of the reserve management decision
making: tactical asset allocation (TAA). It is at this stage that reserves
are invested against the benchmark. Because the benchmark is se-
lected over a comparatively long period102, however, it may no longer
be optimal, having deviated with market movements. TAA allows port-
folio managers to interpret fresh information in adopting relative po-
sitions vis-a-vis the benchmark, thus generating higher return than it
over three-month investment horizons, while staying within set risk
limits. The decisions at this level can be individual, by one or a team
of portfolio managers.
102 At the BNB SAA is performed quarterly.
96
Part Two. Experience of the BNB in Managing Foreign Exchange Reserves under Currency Board Arrangement
The Treasury Director and the Head of the Investment Division
control TAA, consulting where necessary the Risk Analysis and Con-
trol Director and the Risk Analysis Division Head. TAA is covered
thoroughly in Chapter 9.
The LBNB assigns the BNB’s Internal Auditor independent control
over the currency reserve management. The Internal Auditor reports
to the BNB Governing Council. His or her powers and independence
are guaranteed additionally through election by the BNB Governing
Council upon approval by the Chair of the Republic of Bulgaria Na-
tional Audit Office.
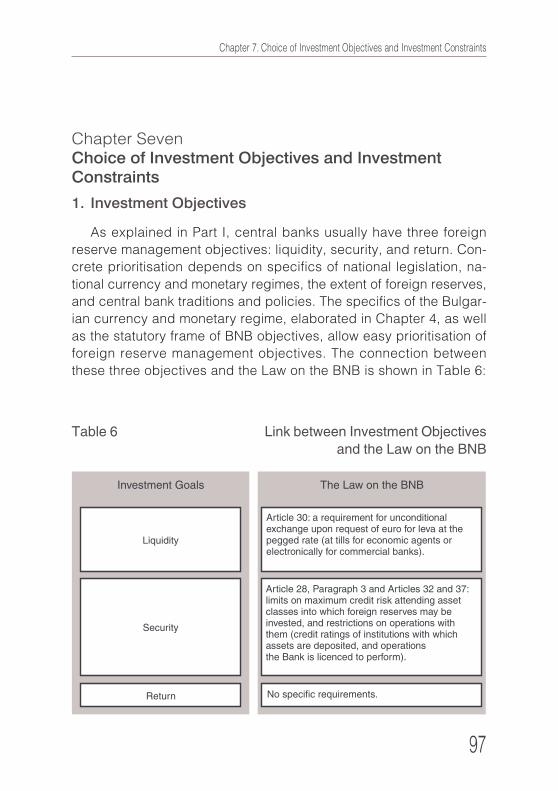
Chapter 7. Choice of Investment Objectives and Investment Constraints
97
Chapter SevenChoice of Investment Objectives and Investment
Constraints
1. Investment Objectives
As explained in Part I, central banks usually have three foreign
reserve management objectives: liquidity, security, and return. Con-
crete prioritisation depends on specifics of national legislation, na-
tional currency and monetary regimes, the extent of foreign reserves,
and central bank traditions and policies. The specifics of the Bulgar-
ian currency and monetary regime, elaborated in Chapter 4, as well
as the statutory frame of BNB objectives, allow easy prioritisation of
foreign reserve management objectives. The connection between
these three objectives and the Law on the BNB is shown in Table 6:
Table 6 Link between Investment Objectivesand the Law on the BNB
98
Part Two. Experience of the BNB in Managing Foreign Exchange Reserves under Currency Board Arrangement
103 The Law on the BNB also places the requirement that, in such a case, the use of foreign reservesbe only against highly liquid collateral assets deposited by the commercial banks, and the col-lateral assets must comply with the same quality requirements that the Law imposes on the for-eign assets held by the BNB itself.
Thus, the 1997 Law on the BNB unquestionably assigns priority to
foreign reserve liquidity. The stipulation that leva and euro be freely
exchangeable at the peg rate on request is explicit, regardless of how
the foreign reserve may be managed. It is precisely this stipulation –
fundamental to a currency board regime – that is one of the two para-
mount duties assigned the BNB by the Law. Attainment of this goal
underwrites trust in the peg rate and the chosen monetary regime.
The second important goal of the BNB when managing the foreign
reserves is security. As noted in Chapter Four, in Article 28, para-
graph 3 of the Law on the BNB, explicitly are listed constraints re-
garding the asset classes and issuers with which the foreign reserves
are to be invested. They show that the legislative body definitively and
particularly requires that the BNB invest in financial assets with very
low credit risk and engage in operations with no higher than moder-
ate market risk. For ensuring the level of security in the management
process, the legislative body has passed additional limitations. In
Article 20, paragraphs 1 and 2 it is explicitly stated that only after the
liquidity of the foreign reserves has been attained, i.e. the amount of
reserves necessary for the normal at least 100% coverage of the
monetary liabilities of the BNB at the fixed exchange rate, part of the
reserves (up to the amount of the deposit of the Banking Department
in the Issue Department) can be used to avert a liquidity banking cri-
sis.103
Last on the priority list according to the Law on the BNB is the goal
of return on the foreign reserves. The legislative body is least specific
on that goal. On one hand the Law does not point to a reference
index (benchmark) that should serve as a guideline what return from
the management of the foreign reserves is to be expected in
principle. On the other hand, unlike the constraints for taking up credit
risk, the Law does not specify the maximal acceptable market risk at
which the foreign reserves could be exposed. The latter delegates
upon the management of the Bank the opportunity to determine the
Chapter 7. Choice of Investment Objectives and Investment Constraints
99
investment policy of the Bank as a function of its risk tolerance104. At
the same time, the freedom given by the Law in this respect calls for
the Bank to develop and announce its policy for achieving this goal
in an unequivocal manner in order to avoid misunderstanding on the
part of society and the government, which eventually would cause un-
solicited pressure upon the institution.
A basic principle upon which the investment of the foreign re-
serves is based is the subordination of the goal of attaining return to
the first two objectives, i.e. liquidity and security. In other words, the
attainment of higher return is pursued only within the framework of in-
ternally imposed restrictions for maximal credit and market risk, which
provide for the accomplishment of the first two objectives, and in
compliance with all legal requirements. Because of this, it is appro-
priate to consider the third goal as fine tuning of the investment policy
of the Bank for achieving maximal efficiency within the framework of
the given constraints.
In finance, maximal efficiency is usually understood as reaching
maximal return subject to a constraint for the maximal allowed level
of risk. The two main types of optimization models solving this prob-
lem were described in Chapter Three, and the concrete realization for
the BNB is the subject of the next chapter. For the choice of optimi-
zation model for the Bank though a number of peculiarities should be
taken into consideration, the latter arising from the Law on the BNB,
the accepted accounting policy following from the Law, and the meth-
odology for accounting the financial results from securities operations
that follow from this policy.
According to the Law on the BNB, the Central Bank is the sole and
full proprietor of the foreign reserves but the BNB has the discretion
to give the Ministry of Finance (MF) up to 75% of the income received
from the management of the reserves according to Article 8, para-
graph 4. The sum paid to the Ministry is written in the annual financial
result in the Income Statement (IS) of the BNB. At the same time, Ar-
ticle 36 of the Law on the BNB requires all unrealized profits as a re-
sult of the market revaluation of the assets to be entered into a spe-
104 As known from Part I of this book, the risk tolerance is the maximal acceptable risk that the man-agement of the Bank deems reasonable to run in order to achieve a higher return.
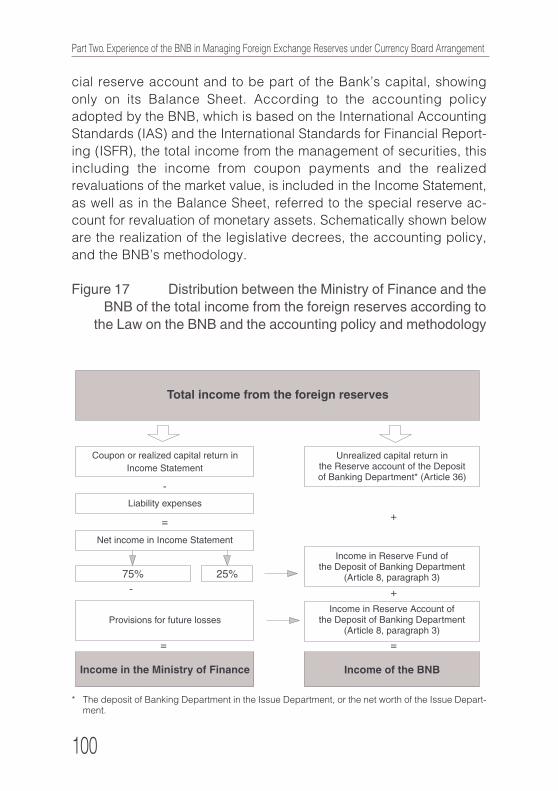
100
Part Two. Experience of the BNB in Managing Foreign Exchange Reserves under Currency Board Arrangement
cial reserve account and to be part of the Bank’s capital, showing
only on its Balance Sheet. According to the accounting policy
adopted by the BNB, which is based on the International Accounting
Standards (IAS) and the International Standards for Financial Report-
ing (ISFR), the total income from the management of securities, this
including the income from coupon payments and the realized
revaluations of the market value, is included in the Income Statement,
as well as in the Balance Sheet, referred to the special reserve ac-
count for revaluation of monetary assets. Schematically shown below
are the realization of the legislative decrees, the accounting policy,
and the BNB’s methodology.
Figure 17 Distribution between the Ministry of Finance and theBNB of the total income from the foreign reserves according to
the Law on the BNB and the accounting policy and methodology
* The deposit of Banking Department in the Issue Department, or the net worth of the Issue Depart-ment.
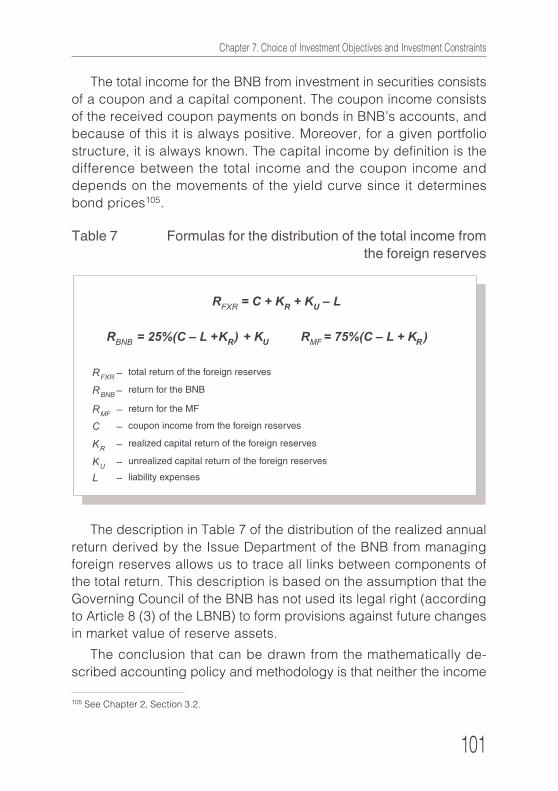
Chapter 7. Choice of Investment Objectives and Investment Constraints
101
The total income for the BNB from investment in securities consists
of a coupon and a capital component. The coupon income consists
of the received coupon payments on bonds in BNB’s accounts, and
because of this it is always positive. Moreover, for a given portfolio
structure, it is always known. The capital income by definition is the
difference between the total income and the coupon income and
depends on the movements of the yield curve since it determines
bond prices105.
105 See Chapter 2, Section 3.2.
Table 7 Formulas for the distribution of the total income fromthe foreign reserves
The description in Table 7 of the distribution of the realized annual
return derived by the Issue Department of the BNB from managing
foreign reserves allows us to trace all links between components of
the total return. This description is based on the assumption that the
Governing Council of the BNB has not used its legal right (according
to Article 8 (3) of the LBNB) to form provisions against future changes
in market value of reserve assets.
The conclusion that can be drawn from the mathematically de-
scribed accounting policy and methodology is that neither the income
102
Part Two. Experience of the BNB in Managing Foreign Exchange Reserves under Currency Board Arrangement
of the BNB, nor the income of the MF is proportional to the total in-
come from the foreign reserves. Hence the important observation
that, except for some special cases, each of the three types of in-
come would be maximized for different structures of the foreign re-
serves. Furthermore, by analogical consideration follows that the dis-
tribution of risks between the BNB and the MF is not proportional to
the risk of the foreign reserves either. As can be seen from the real
data example given in Box 3, the same structure of the foreign re-
serves leads to different level of risk for the two institutions and to
different (and sometimes with opposite sign) expected return. A cor-
ollary of the above is the fact that an constraint for the total risk of the
foreign reserves does not entail a simultaneous constraint for the risk
of the net worth of the BNB. Similarly, the maximization of the ex-
pected return from the foreign reserves does not entail a simultane-
ous maximization of the expected return for the BNB. This embedded
incongruity between income and risk is depicted in a stylized fashion
in Figure 18.106
From the above interpretation, it becomes clear why the solution
of the optimization problem that the BNB faces related to the quanti-
tative definition of the investment goal is a non-trivial one and goes
beyond the classical portfolio management theory. According to that
theory, one expected return is maximized subject to one risk con-
straint. In BNB’s case, three potentially contradictory returns could be
eventually optimized, subject to three types of complexly intertwined
risk. Such an optimization problem can be solved, but it is necessary
to prioritize the expectations for the return on the foreign reserves
(EFXR), for the income for the BNB (EBNB), and the income for the MF
(EMF
). Formally, the optimization problem can be described as shown
in Figure 19 by setting different weights for the three types of return.
In the target function of the optimization problem, all three types
of return are maximized, but they are weighted with λ1, λ
2 and λ
3.
They are called weights figuratively because their sum need not be
equal to one; what matters are their ratios – λ1/λ
2, λ
1/λ
3 and λ
2/λ
3.
Through them the different priorities of the respective objectives are
106 Instead of the letter R, which stood for return, in this figure the letter E is used in order to under-score the fact that we are discussing the expected return, in the mathematical sense of the word“expected.”
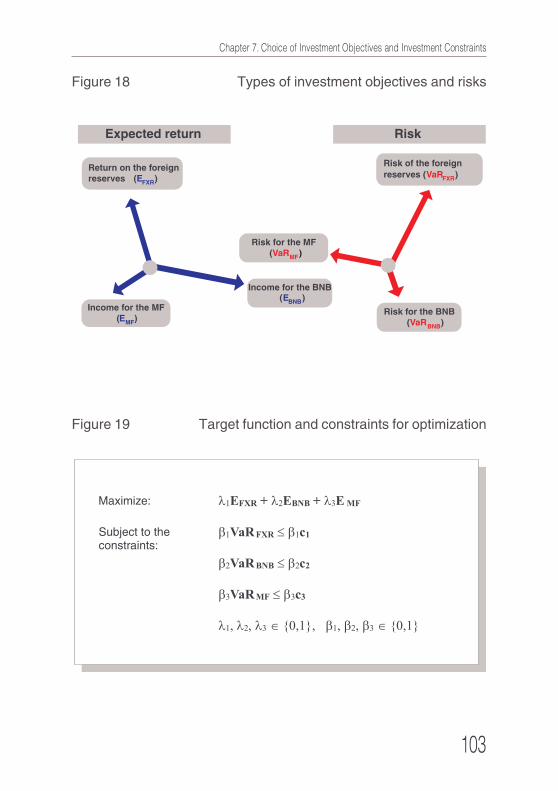
Chapter 7. Choice of Investment Objectives and Investment Constraints
103
Figure 18 Types of investment objectives and risks
Figure 19 Target function and constraints for optimization

104
Part Two. Experience of the BNB in Managing Foreign Exchange Reserves under Currency Board Arrangement
expressed. Although these weights can take all values, it will be as-
sumed that λ1, λ2 and λ3 can only take values of 0 or 1107. In the con-
straints of the optimization problem, the coefficients β1, β
2 and β
3
show whether we wish to impose some constraint on the risk of not
achieving the respective goal108. For λi and βi, i = 1, 2, 3, all kinds of
combinations of the values 0 and 1 are possible. For the optimization
problem to be meaningful, it is necessary that at least one coefficient
λi and at least once coefficient вi be different from 0. Each combina-
tion of λi and β
i, i = 1, 2, 3 represents a particular optimization model.
In this respect, the optimization problem shown in Figure 19 is a gen-
eralized presentation of the optimization problem that we are facing
and contains within itself a multitude of particular optimization mod-
els.
The number of different optimization models given that there exist
at least one goal and at least one constraint is 42. Fortunately, it is not
necessary to review all of them and choose a model because it is
possible to exclude a considerable number of models in advance for
their being inappropriate. For easier interpretation the models under
consideration are group according to the types of risk (VaR) that are
controlled.
None of the presented models are fully comparable with each
other since all of them differ either in terms of the target function (i.e.
the combination of objectives maximized) or in terms of the risk con-
straints. Hence, if, for example, one model outperforms relative to
another model with respect to a given goal is due either to the fact
that the former model exerts less control over a given type of risk
compared to the latter model, or that the latter outperforms the former
in terms of some other type of expected return. In this line of thought,
the choice of whichever model achieves a lower level for some goal
or has laxer control over some risk. It is also important to note that the
maximization of any single return leads to suboptimal values for the
other two types of return. The conclusion that can be drawn from the
107 For example, the combination λ1=1, λ2=0, and λ3=0 means that the only goal we pursued with thechoice of an optimal benchmark is the maximum expected return from the foreign reserves.
108 For example, β1=0, β2=1, and β3=0 means that the only risk we wish to control when choosing abenchmark is the risk for BNB’s net worth.
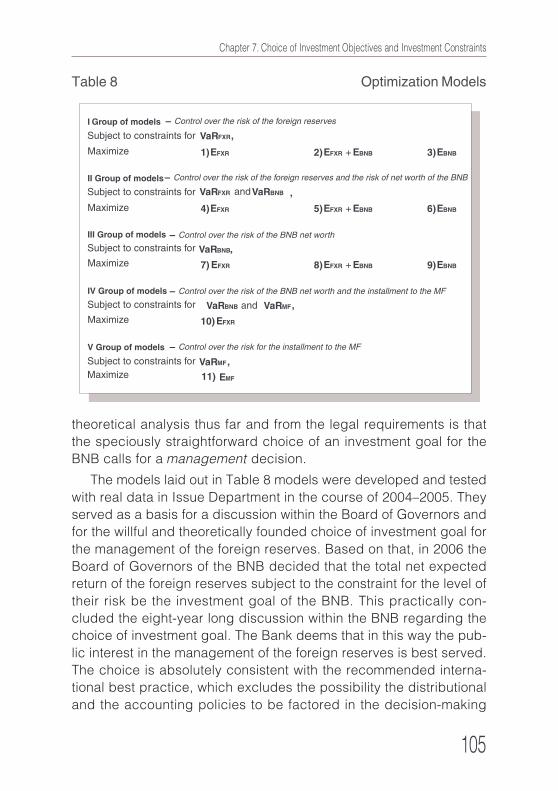
Chapter 7. Choice of Investment Objectives and Investment Constraints
105
theoretical analysis thus far and from the legal requirements is that
the speciously straightforward choice of an investment goal for the
BNB calls for a management decision.
The models laid out in Table 8 models were developed and tested
with real data in Issue Department in the course of 2004–2005. They
served as a basis for a discussion within the Board of Governors and
for the willful and theoretically founded choice of investment goal for
the management of the foreign reserves. Based on that, in 2006 the
Board of Governors of the BNB decided that the total net expected
return of the foreign reserves subject to the constraint for the level of
their risk be the investment goal of the BNB. This practically con-
cluded the eight-year long discussion within the BNB regarding the
choice of investment goal. The Bank deems that in this way the pub-
lic interest in the management of the foreign reserves is best served.
The choice is absolutely consistent with the recommended interna-
tional best practice, which excludes the possibility the distributional
and the accounting policies to be factored in the decision-making
Table 8 Optimization Models
106
Part Two. Experience of the BNB in Managing Foreign Exchange Reserves under Currency Board Arrangement
process concerning the reserve management and the positioning on
the international financial markets. In this way, the maximum possible
degree of autonomy of the reserve management process is guaran-
teed as well as its efficiency in the interest of the community. With its
choice, the BNB clearly signals society that it recognizes the respon-
sibility invested in the Bank as an institution independent of the Gov-
ernment.
At the same time the BNB is fully aware of the risk that any real-
ized negative financial result from a fall in the prices of the investment
grade fixed income government bonds would be absorbed against its
net worth. This is done in order to guarantee the attainment of optimal
total expected return with respect to the foreign reserves for their
level of total risk. The risk of loss of part of the BNB’s capital cannot
be ignored, though. In order to contain it, the Bank’s management
has decided that it is more appropriate to avail itself of its legal right
to make additional provisions in order to increase the capital before
transferring its yearly installments to the MF. The aim is to compen-
sate for the possible realization of the aforementioned negative effect.
Thus in the course of the last five years a total of 342 million levs were
provisioned in a specially created by a decision of the Governing
Council Fund for Protection from Capital Losses. This policy protects
from ex-post reduction of BNB’s net worth. At the same time it does
not preliminarily impose any theoretically unfounded additional con-
straints either on the determination of the Bank’s investment goal or
on the making of ex-ante decisions regarding the strategic asset al-
location that would not be fully in line with the public interest.
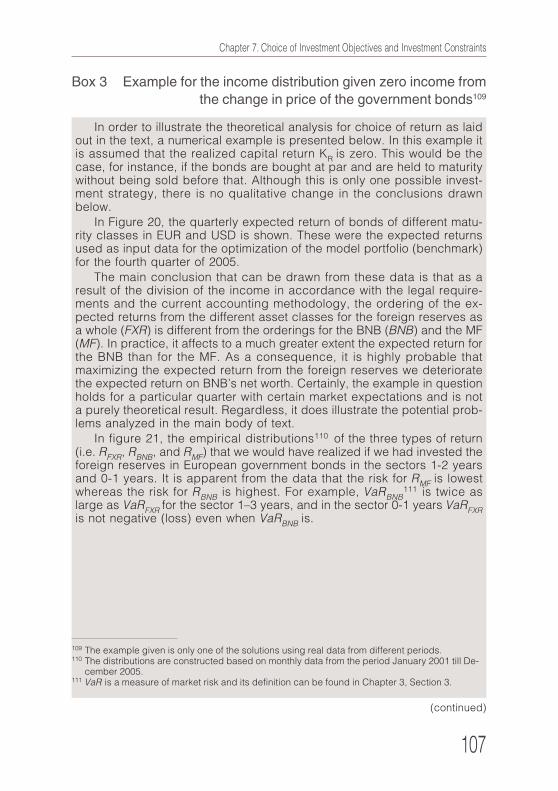
Chapter 7. Choice of Investment Objectives and Investment Constraints
107
109 The example given is only one of the solutions using real data from different periods.110 The distributions are constructed based on monthly data from the period January 2001 till De-
cember 2005.111 VaR is a measure of market risk and its definition can be found in Chapter 3, Section 3.
(continued)
Box 3 Example for the income distribution given zero income fromthe change in price of the government bonds109
In order to illustrate the theoretical analysis for choice of return as laidout in the text, a numerical example is presented below. In this example itis assumed that the realized capital return K
R is zero. This would be the
case, for instance, if the bonds are bought at par and are held to maturitywithout being sold before that. Although this is only one possible invest-ment strategy, there is no qualitative change in the conclusions drawnbelow.
In Figure 20, the quarterly expected return of bonds of different matu-rity classes in EUR and USD is shown. These were the expected returnsused as input data for the optimization of the model portfolio (benchmark)for the fourth quarter of 2005.
The main conclusion that can be drawn from these data is that as aresult of the division of the income in accordance with the legal require-ments and the current accounting methodology, the ordering of the ex-pected returns from the different asset classes for the foreign reserves asa whole (FXR) is different from the orderings for the BNB (BNB) and the MF(MF). In practice, it affects to a much greater extent the expected return forthe BNB than for the MF. As a consequence, it is highly probable thatmaximizing the expected return from the foreign reserves we deterioratethe expected return on BNB’s net worth. Certainly, the example in questionholds for a particular quarter with certain market expectations and is nota purely theoretical result. Regardless, it does illustrate the potential prob-lems analyzed in the main body of text.
In figure 21, the empirical distributions110 of the three types of return(i.e. R
FXR, R
BNB, and R
MF) that we would have realized if we had invested the
foreign reserves in European government bonds in the sectors 1-2 yearsand 0-1 years. It is apparent from the data that the risk for R
MF is lowest
whereas the risk for RBNB
is highest. For example, VaRBNB
111 is twice as
large as VaRFXR
for the sector 1–3 years, and in the sector 0-1 years VaRFXR
is not negative (loss) even when VaRBNB
is.
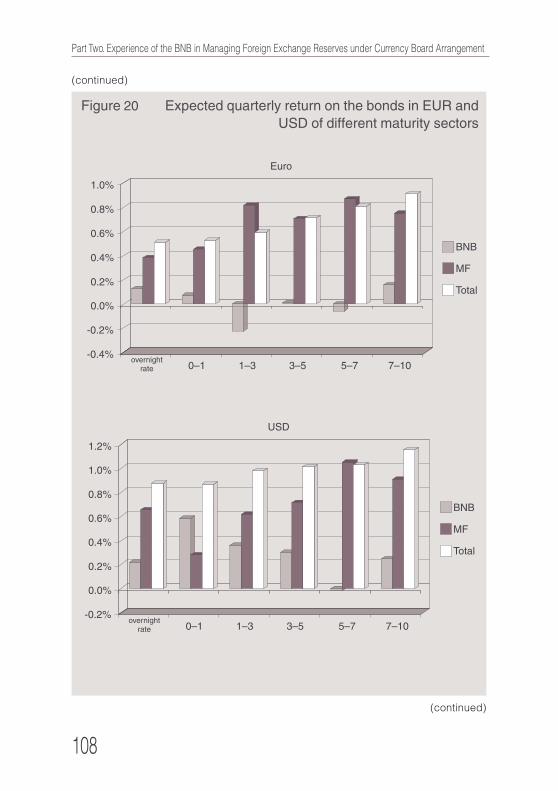
108
Part Two. Experience of the BNB in Managing Foreign Exchange Reserves under Currency Board Arrangement
Figure 20 Expected quarterly return on the bonds in EUR andUSD of different maturity sectors
(continued)
(continued)
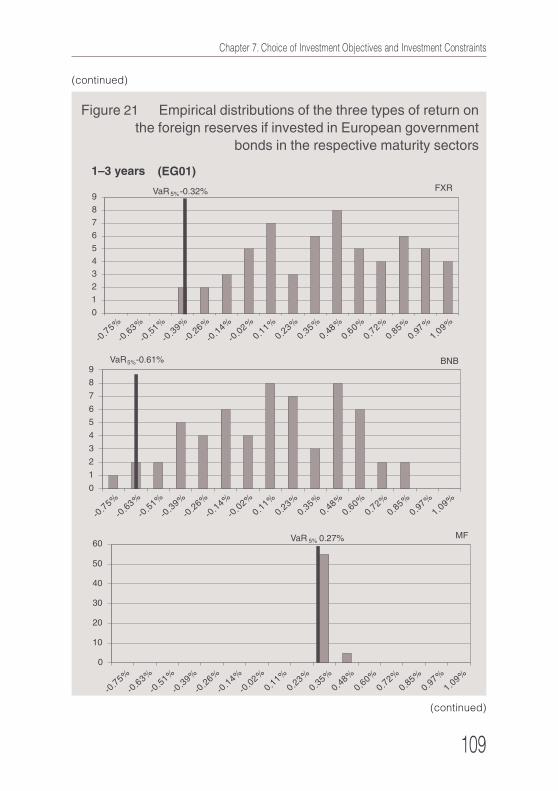
Chapter 7. Choice of Investment Objectives and Investment Constraints
109
(continued)
Figure 21 Empirical distributions of the three types of return onthe foreign reserves if invested in European government
bonds in the respective maturity sectors
(continued)
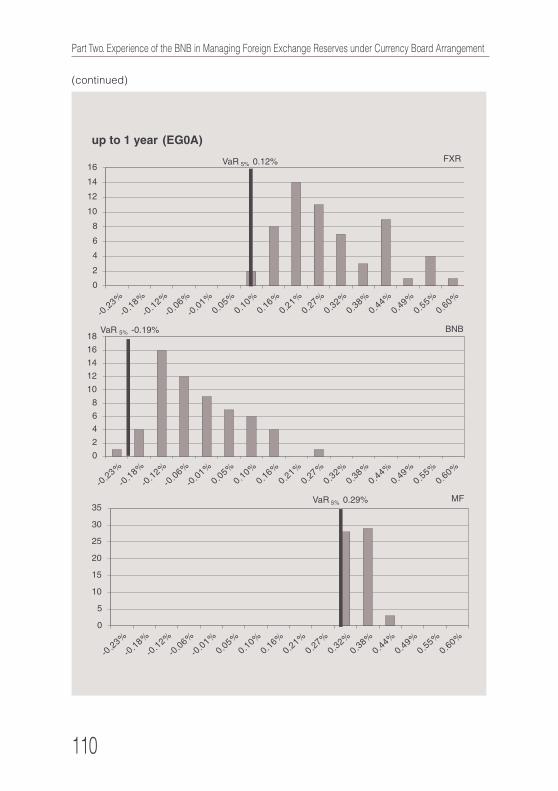
110
Part Two. Experience of the BNB in Managing Foreign Exchange Reserves under Currency Board Arrangement
(continued)
Chapter 7. Choice of Investment Objectives and Investment Constraints
111
2. Risk Management Limits and Investment Guidelines
of the BNB
The investment limits for the portfolio managers’ team of the BNB,
who manage the foreign reserves, are formed on three levels:
• Law on the BNB
• Board of Governors and Deputy Governor managing Issue
Department
• Risk Analysis and Control Directorate (risk management opera-
tives)
A leading principle informing the whole arsenal of investment lim-
its is that the limits given at a lower level should not contradict or re-
peal the limits given at a higher level. Certainly, the limits written in the
Law on the BNB hold the highest priority. They are followed by the
limits determined by the Governing Council or the Deputy Governor
managing Issue Department when formulating the investment objec-
tives or the structural asset allocation.
Since 1999, the investment limits are systematized in a document
with limited internal circulation named “Investment Limits and Bench-
marks for the management of the Gross Foreign Reserve of the BNB.”
The document is updated after any change in the Law on the BNB, the
investment objectives of the bank, changes in the structural asset al-
location or after an intervention of the Risk Analysis and Control Direc-
torate. It is endorsed by the Deputy Governor managing Issue Depart-
ment. Mandatory appendices to the document are the full lists of per-
missible issuers of debt securities, commercial paper, and covered
European bonds, as well as the lists of BNB’s counterparties.
The imposition of investment limits aims to restrict the impact of the
different types of risk (risk factors) to a level acceptable both for the
legislator and the management of the bank before the actual invest-
ment of the foreign reserves. Some limits refer to the joint impact of
two or more risk factors. The risk factors are identified in the descrip-
tion of the business processes systematized in the aforementioned
“Business Procedures Manual for Managing Foreign Reserves” of the
BNB. It depicts methods for identification of all types of risk, and it is
also the main tool for the management and containment of operational
risk within the BNB.
112
Part Two. Experience of the BNB in Managing Foreign Exchange Reserves under Currency Board Arrangement
The compliance with the limits and procedures is constantly moni-
tored, analyzed, and reported by the Risk Analysis and Control Direc-
torate. The directorate is also responsible for the continual updating
of the document. The existence of this document is the basis for the
development of lucid criteria for the valuation of the risk management
process within the BNB by the internal and external audit of the Bank
and by the Court of Auditors of the Republic of Bulgaria.
The investment limits and procedures predominantly elaborate on
the legally defined limits for the market (interest rate and foreign ex-
change) and credit risk. In the Law on the BNB there is no explicit
legal limit for the interest rate risk, so this risk is controlled for by the
means of а limit architecture at the lower level. By With a decision of
the Investment Committee, the foreign reserves are divided into sev-
eral portfolios by currency, with each portfolio serving a specific in-
vestment goal. For each portfolio a benchmark is defined and a limit
of the maximum deviation of the modified duration of the portfolio from
that of the benchmark is set, which is one of the main limits for inter-
est rate risk by portfolio. Moreover, as a restriction on maturity risk,112
limits for the maximum remaining time to maturity are set for the dif-
ferent asset classes. The latter jointly contains the interaction of the
interest rate and credit risk. Thirdly, as part of the restriction on inter-
est rate (incl. spread) risk, a limit for the maximum permissible rela-
tive loss is set for each of the portfolios. It is reported cumulatively
since the beginning of each year and is valid within a given year. If
reached, the portfolio managers revert to passive replication of the
benchmark, i.e. they automatically lose their right to take active man-
agement positions with respect to the benchmark.113
For each financial institution, as is the case with the BNB, the main
source of foreign exchange risk is the difference between the cur-
rency structures of the assets and the liabilities. The legislature has
reduced to minimum the foreign exchange risk for the Bank. Accord-
ing to the amended Article 31, paragraph 3 of the Law on the BNB
from the year 2005 “the market value of the gross foreign currency
reserves, excluding those under Article 28, paragraph 3, Section 3
112 A type of market risk and a subdivision of the interest rate risk. For more details see Chapter 2.113 See Chapter 6 of Part 2.
Chapter 7. Choice of Investment Objectives and Investment Constraints
113
(SDR) and Section 6 (gold bullion reserve), which are denominated in
currencies different from Euro cannot be larger in absolute term than
2% of all monetary liabilities of the BNB denominated in these respec-
tive currencies. The compliance with this rule is monitored intraday
and, in case of larger than the legally stipulated deviations, corrective
measures are undertaken – i.e. immediate purchase or sale of the
necessary amount of the given currency in order to bring the devia-
tion within the limits postulated by law.
The freely convertible currencies in which BNB can invest its re-
serves are determined with a decision of the Governing Council. As
explained in the Part 1 of this publication and Chapter 4, at present
except for the reserve currency (Euro) open positions are allowed in
a few other freely convertible currencies (US dollar, British pound,
Swiss frank, and Japanese yen) of countries with the highest credit
rating, in gold bullion, and in special drawing rights.
If necessary, the risk managers additionally restrict the foreign
exchange risk resulting from the operational activities of the bank by
imposing stricter limits for open currency positions intraday. At the
end of the working day, every open currency position is closed. An-
other restriction on this level is given by the so-called stop loss114
limit, which, if reached, requires that the position be closed by the
portfolio manager.
The credit risk is limited by Article 28 of the Law on the BNB, which
states that the foreign reserves can be invested in instruments115
holding one of the two highest ratings given by at least two interna-
tionally recognized credit rating agencies. There, the possible issu-
ers, for which the aforementioned minimum credit rating restriction
holds as well, are also enumerated. The legal requirement is speci-
fied in three leading limits set by the Deputy Governor managing Is-
sue Department:116
114 The maximum loss threshold for a given open position.115 Cash in freely convertible currency, debt securities, and forward contracts.116 In accordance with Article 28, paragraph 3 of the Law on the BNB, the Bank uses the ratings of
the following three international agencies when assessing the credit rating – Standard & Poor’s,Moody’s, and Fitch Ratings. These agencies provide the international investors with the maximallyindependent and objective rating both for the debt issuer and the debt issued itself. Moreover,they offer ratings for the broadest spectrum of financial institutions with which the Bank could havebusiness interaction.
114
Part Two. Experience of the BNB in Managing Foreign Exchange Reserves under Currency Board Arrangement
1. The issuers of debt securities should hold a long-term credit
rating which is given by at least two of the three rating agencies
and is not lower than AA- by Standard & Poor’s and Fitch Rat-
ings or the respective rating by Moody’s.
2. The counterparties of the BNB for deposits in currency or gold
and for foreign exchange trades should hold a long-term credit
rating which is given by at least two of the three rating agencies
and is not lower than AA- by Standard & Poor’s and Fitch Rat-
ings or the respective rating by Moody’s.
3. The issues of the debt securities should hold a long-term credit
rating which is given by at least two of the three rating agencies
and is not lower than AA- by Standard & Poor’s and Fitch Rat-
ings or the respective rating by Moody’s.
The types of financial instruments in which the BNB currently
trades are bonds denominated in currency or gold with fixed or float-
ing coupon without an embedded call option; short term deposits in
currency or gold; currency denominated commercial paper; and de-
mand deposits in currency or gold. In accordance with the policy for
constant gradual improvement of the spectrum of financial instru-
ments for the management of the foreign reserves, in 2005 bond and
interest rate futures contracts were allowed. Furthermore, in the last
two years, the BNB became part of three securities lending programs.
These are relatively new products developed by BNB’s custodian
bank or the bank operating the securities lending. The aforemen-
tioned credit rating limits also hold for the new products.
Foreign exchange (Forex) operations are rarely used for risk man-
agement purposes, which to a great extent follows from the legal re-
strictions on foreign exchange risk elaborated above. According to
the requirements of the Law on the BNB, the Bank is not allowed to
invest in corporate debt securities issued by non-financial institutions,
irrespective of the credit rating of the issuer or the issue. The law
does not allow investment on company equity or shares, which is a
rule for most central banks. Table 9 below gives the differentiation by
asset class and instrument, for each of which minimum credit rating
requirement must hold.
Chapter 7. Choice of Investment Objectives and Investment Constraints
115
From all issuers mentioned above, the credit risk of a country’s
government is deemed lowest as all the assets in this class hold the
guarantee of the respective state. In pursuit of maximal restriction of
the liquidity risk and, subsequently, ensuring the liquidity and secu-
rity of the foreign reserves, the Deputy Governor of the BNB manag-
ing Issue Department sets a limit for minimum exposure in govern-
ment debt securities as the most riskless asset class. Thus the BNB
constantly invests a sizeable part of the foreign reserves in assets
with the highest credit quality (AAA by Standard & Poor’s or the re-
spective rating by the other two agencies). As an additional restric-
tion on the government risk (now as part of the credit risk) by recom-
mendation of the Risk Analysis and Control Directorate a list of coun-
tries, central banks and government guaranteed financial institutions
in whose debt securities the portfolio managers are allowed to invest
has been endorsed and constantly updated. All of them comply with
the legal requirement for minimum permissible long-term credit rating.
The supranational institutions in which the BNB invests the foreign
reserves are international public financial organizations like the Bank
for International Settlements in Basel, the World Bank, the European
Investment Bank, etc. All of them hold at least the minimum credit
rating required by law.
The European covered bonds and the agency bonds are relatively
new instruments for the debt securities market on which the BNB
operates. They are issued in a number of European countries and are
regulated by respective special legislative acts. These instruments
feature either prime mortgages or claims on the government (public)
sector receipts as collateral. This collateral provides not only addi-
tional security for the investors but also high credit rating for the is-
suers, which renders them legally permissible for the BNB investment
universe. The government guarantees of the issuers and the prime
dealers, as well as the considerable amount outstanding of the issues
provide both for market depth and high liquidity of the financial instru-
ments. Usually covered bonds trade with some spread to the govern-
ment bonds of a given country, which, given the aforementioned
guarantees for security and liquidity of the issues, allows the portfo-
lio investors to earn extra return. As an additional limit for the credit

116
Part Two. Experience of the BNB in Managing Foreign Exchange Reserves under Currency Board Arrangement
risk, BNB has adopted the practice to consider the long-term credit
rating of the issuer and not of the issue. The latter, due to the prime
quality of the collateral usually has a higher credit rating than the is-
suer.
The trades with all debt securities in which the BNB invests are
done only at the delivery versus payment condition, which is also an
international standard, in order to limit the credit and liquidity risk.
This is a relatively conservative trading approach imposed by the
Risk Analysis and Control Directorate and endorsed by the Deputy
Governor managing Issue Department. With this limit, the credit risk
with respect to the counterparty is eliminated, i.e. the probability of
the BNB meeting its part of a contracted deal and not receiving the
contracted asset from the counterparty is practically nil. The
counterparties for securities trading must hold a short-term credit
Table 9 Investment limits by asset class
Asset class Instruments Amount of thetotal volume
Governments
Banks
Supranationalinstitutions
Europeancoveredbonds
Agencies
- currency or gold deposits and investmentprograms within central banks
- debt securities and commercial paper issuedby the state, central banks, or financialinstitutions with an explicit governmentguarantee
- currency or gold deposits with foreign banks- foreign exchange operations- commercial paper issued by banks.
- currency or gold deposits,- commercial paper and debt securities.
- bonds of the type Jumbo Pfandbriefe(Germany)
- bonds of the type Obligations Foncieres(France)
- bonds of the type Irish Asset CoveredSecurities (Ireland)
- bonds issued by financial agencies without agovernment guarantee – Freddie Mac,Fannie Mae, etc.
Min 50%
Max 30%
Max 20%
Max 30%
Max 20%
Chapter 7. Choice of Investment Objectives and Investment Constraints
117
rating given by at least two of the three rating agencies which is no
less than A-1 by Standard & Poor’s or the respective ratings by
Moody’s and Fitch Ratings. This requirement is introduced chiefly for
the containment of settlement risk of securities trades as part of the
procedures for the management of liquidity and operational risk.
In order to further reduce the credit, liquidity and operational risk,
the Deputy Governor managing Issue Department, after a delibera-
tion in the Investment Committee, endorsed the document “Policy on
the BNB’s Counterparties in the Management of the Foreign Currency
Reserve.” The document, developed by the Risk Analysis and Con-
trol Directorate, aims to set clear and transparent criteria and to re-
duce subjectivity in the process of reviewing, changing, or selecting
new members of the counterparty list. Based on the criteria set, the
present and future business partners of the Bank for the management
of the foreign reserves are contacted on a regular basis. All partners
are promptly informed for the leading principles in BNB’s policy re-
garding its counterparties and for the changes that have occurred.
The foreign financial institutions which are counterparties of the
BNB in operations with the gross foreign currency reserve can be
divided into two groups. The first group comprises all the foreign fi-
nancial institutions to which the Bank can have credit exposure. A
leading criterion for inclusion in this group is a credit rating that meets
the requirements of the Law on the BNB, i.e. rating higher than or
equal to AA- by Standard and Poor’s and/or Fitch Ratings and Aa3 by
Moody’s given by at least two of the three agencies. For the sake of
a more precise delineation of the credit limits for maximum individual
exposure to the financial institutions of this group, the Risk Control
Unit has developed and maintains a detailed methodology for inter-
nal ratings in numerical value, which elaborate the long-term credit
ratings by the aforementioned agencies and are calculated based on
the information on the financial institutions which is available on the
market. The individual credit limit is determined as percent of the core
capital of the respective institution depending on the internal rating
awarded to it – i.e. the higher the capital of a given financial institu-
tion and its internal rating, the larger its limit for credit exposure en-
joyed by the portfolio managers. The methodology also stipulates
118
Part Two. Experience of the BNB in Managing Foreign Exchange Reserves under Currency Board Arrangement
criteria for optimizing the number of counterparties in Group One. The
counterparties in Group One can also be listed in Group Two.
Group Two consists of the financial institution with which the BNB
in securities under the delivery versus payment condition. A leading
criterion for inclusion in this group is short-term rating higher than or
equal to A-1 by Standard & Poor’s, F-1 by Fitch Ratings or P-1 by
Moody’s. This rating must be given by at least two of the three agen-
cies. Within the methodology governing this group there also exist
criteria ensuring optimal balance between necessary and the possi-
ble number of counterparties.
In accordance with the endorsed “Policy on the BNB’s
Counterparties in the Management of the Foreign Reserves”, the
counterparties are assessed and ranked for a given unit of time
based on a set of objective criteria – chiefly but not limited to the re-
alized turnover, the number of trades with the given counterparty, and
the incidence of settlement problems and operational risk. The ones
scoring lowest in each group are replaced: based on some additional
criteria at least two of the lowest scoring institutions are selected for
exclusion from each group. They can be superseded, if necessary,
by other financial institutions that have shown interest in becoming
BNB’s counterparties for a given type of operations.
The assessment and subsequent updating of the counterparty list
are done at least once per year at a meeting of the Investment Com-
mittee and are subject to endorsement by the Deputy Governor man-
aging Issue Department. After the completion of the annual review,
each counterparty is informed of the result and state of the bilateral
business relations and its rank in the respective group. The
counterparties that have been excluded at a given annual review can
apply again for inclusion but cannot be included prior to the next
annual review. The financial institutions which no longer comply with
the requirements of the Law on the BNB due to credit rating down-
grades are immediately notified and automatically excluded from the
counterparty list.
For the foreign financial institutions that have never been BNB’s
counterparties and wish to do business with the Bank, a set of formal
criteria has been compiled. An integral part of it is their giving BNB

Chapter 7. Choice of Investment Objectives and Investment Constraints
119
access to their market quotes, analyses, and forecasts. Based on
that, the most appropriate institutions are sifted. It has been organ-
ized internally that the list of these institutions is maintained and up-
dates constantly, which facilitates its supplementing with
counterparties from the groups looked into detail above. If necessary,
a procedure for on-the-run inclusion of new counterparties has been
provided for, prior to the annual regular update.
In order to limit the credit and liquidity risk, the Risk Analysis and
Control Directorate, after endorsement by the Deputy Governor man-
aging Issue Department, can impose further restrictions. Firstly, apart
from the aforementioned requirement for minimum exposure to gov-
ernment or government guaranteed securities or securities issued or
guaranteed by central banks, as well as deposits with central
banks117, before the tactical asset allocation, the directorate sets for
the portfolio managers the maximum permissible exposure to each of
the other asset classes as outlined in Table 9. These limits are set on
the balance sheet level, i.e. for the foreign reserve portfolio as a
whole, and are subsequently translated into particular limits for each
individual portfolio. Secondly, at this stage of the management of the
foreign reserves a maximum permissible maturity of the currency and
gold deposits is set for each counterparty. Thirdly, again at this stage
of the management of the foreign reserves, a limit for maximum per-
missible exposure as a percentage of the market value of the total
assets of the BNB in any given moment is set for each counterparty.
Fourthly, again at this stage of the foreign reserve management, a
minimum amount outstanding of each issue of a security that com-
plies with all the aforementioned limits is set, since the issues with a
larger amount outstanding are less affected by adverse market
moves. This ensures good liquidity and ensures the securities are
representative of the market in any given time. Thus the BNB also lim-
its its reputational risk.
The compliance with the limits is monitored and controlled daily by
the Risk Analysis and Control Directorate. A control mechanism has
been set up to ensure that the sum total exposure to each particular
instrument/asset class in the individual portfolios does not exceed the
117 For more information see Table 9, page 116, raw 2 “Governments”.
120
Part Two. Experience of the BNB in Managing Foreign Exchange Reserves under Currency Board Arrangement
limits set for the foreign reserve portfolio as a whole.
Particular attention on the part of the BNB is required when man-
aging the liquidity risk given the chosen monetary regime (see Chap-
ter 4) and the commitment of the central bank to constantly bolster
the trust invested in it as set in the Management and Development
Strategy till 2009. Firstly, in order to guarantee liquidity limits for mini-
mum daily availability of highly liquid assets by currency are set. They
are determined through a methodology based on the historical
trends. However, in order to be on the safe side, the values for the
limits are adjusted upward with a factor reflecting the volatility given
shocks on the domestic currency market.
The predominant part of the instruments in which the foreign re-
serves are invested, as pointed out in this chapter, traditionally enjoy
high liquidity, i.e. in the need of cash, they can be easily sold and/or
used as collateral at any time with virtually no additional cost. The
short term deposits in currency or gold with banks as well as the gold
bullion reserve held in the Bank’s vaults enjoy lower liquidity. The
short term deposits can and should be converted to cash before their
maturity only given extraordinary circumstances – urgent need of
cash. In ordinary times such a usage leads to opportunity cost as well
as additional costs incurred. The gold bullion reserve in the BNB’s
vaults, as clarified in the analysis above, is the least liquid component
of the foreign reserves. It can be sold on the market in the course of
a few days to a few weeks. For reputational reasons, however, the
BNB has not forfeited its policy to physically keep part of its foreign
reserves in gold bullion.
Secondly, in order to ensure liquidity, as well as to limit the opera-
tional risk, limits for the maximum amount of a single transaction per-
taining to the management of the foreign reserves have been set.
These limits are a function of the type of transaction, the post of the
Bank employee who contracts the transaction, and the currency of
denomination of the transaction. These limits are set by the Risk
Analysis and Control Directorate and are endorsed by the Deputy
Governor managing Issue Department. They are monitored and re-
ported on a daily basis.
Chapter 8. Strategic Asset Allocation
121
Chapter Eight
Strategic Asset Allocation
Strategic asset allocation or SAA is the next stage in the hierarchy
of investment decisions which follows investment policy definition
(see Chapter 3 and Figure 16). Its primary point is to select a bench-
mark for foreign reserves. The benchmark is a model portfolio which
expresses the chosen investment policy as articulated through invest-
ment objectives and risk tolerance. The benchmark is of paramount
importance: a number of studies118 show that over 90 per cent of a
portfolio’s return is down to its benchmark. The benchmark has a
similar contribution to the risk characteristics of a portfolio.
For SAA purposes the BNB has developed an optimisation model
which maximises expected return on net capital value (i.e., the de-
posit of the Banking Department) subject to a set risk constraint. The
model is Type 2 according to the optimisation models classification
in Chapter 3, Section 3.
The SAA process and its relationship to the Law on the BNB are
shown diagrammatically in Figure 22. In general, the process com-
prises input data, optimisation model, and output data. All three con-
stituents of the process shall be clarified in this sequence below.
118 See for instance Ibbotson, Roger G., Paul D. Kaplan, “Does Asset Allocation Policy Explain 40,90, or 100 Percent of Performance?”, Financial Analysts Journal, January/February 2000.

122
Part Two. Experience of the BNB in Managing Foreign Exchange Reserves under Currency Board Arrangement
Figure 22 The Strategic Asset Allocation Process
1. Input Data
Input data in the optimisation model are: the specified risk toler-
ance, the expected leverage of the Issue Department, and expected
returns of different asset classes.
1.1. Risk Tolerance
The most important element from the input data for the
optimisation model is the permissible level of risk. It follows directly
from the risk tolerance set by the Board of Governors and represents
its “risk appetite.” This inclination of the Bank’s leadership depends
both on its members’ individual attitudes to risk and on the external
priorities dictated by the Law on the BNB regarding investment goal
attainment. As noted in Chapter 7, the Law on the BNB sets priorities
by the objectives of liquidity and security. To guarantee their attain-
ment, the Board of Governors has to reinterpret them in the form of
specific quantitative risk limits for the different portfolios. This is ac-
complished through explicit risk tolerances for market and credit risk
(Figure 23).
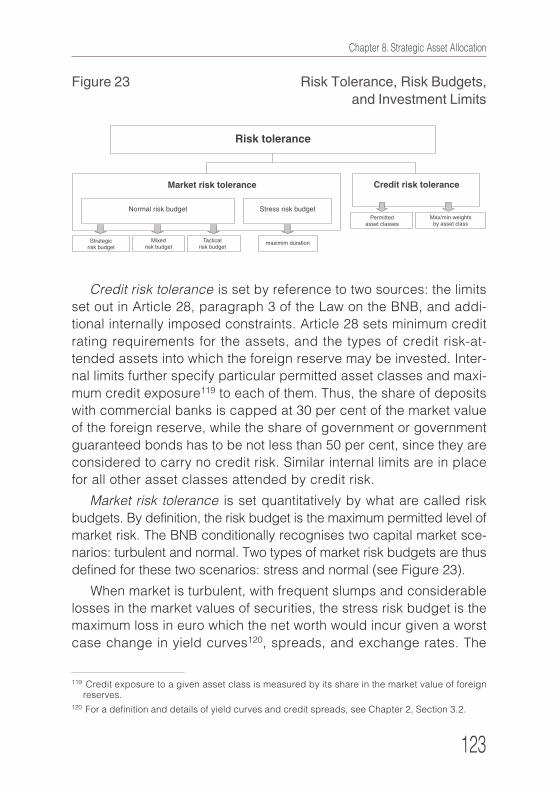
Chapter 8. Strategic Asset Allocation
123
Figure 23 Risk Tolerance, Risk Budgets,and Investment Limits
Credit risk tolerance is set by reference to two sources: the limits
set out in Article 28, paragraph 3 of the Law on the BNB, and addi-
tional internally imposed constraints. Article 28 sets minimum credit
rating requirements for the assets, and the types of credit risk-at-
tended assets into which the foreign reserve may be invested. Inter-
nal limits further specify particular permitted asset classes and maxi-
mum credit exposure119 to each of them. Thus, the share of deposits
with commercial banks is capped at 30 per cent of the market value
of the foreign reserve, while the share of government or government
guaranteed bonds has to be not less than 50 per cent, since they are
considered to carry no credit risk. Similar internal limits are in place
for all other asset classes attended by credit risk.
Market risk tolerance is set quantitatively by what are called risk
budgets. By definition, the risk budget is the maximum permitted level of
market risk. The BNB conditionally recognises two capital market sce-
narios: turbulent and normal. Two types of market risk budgets are thus
defined for these two scenarios: stress and normal (see Figure 23).
When market is turbulent, with frequent slumps and considerable
losses in the market values of securities, the stress risk budget is the
maximum loss in euro which the net worth would incur given a worst
case change in yield curves120, spreads, and exchange rates. The
119 Credit exposure to a given asset class is measured by its share in the market value of foreignreserves.
120 For a definition and details of yield curves and credit spreads, see Chapter 2, Section 3.2.
124
Part Two. Experience of the BNB in Managing Foreign Exchange Reserves under Currency Board Arrangement
worst case scenario is constructed in such a way that the twin objec-
tives of liquidity and security are attained, even given a market slump.
Indeed, even if a worst case scenario were to obtain in market vari-
ables (yield curves and foreign exchange rates) alongside a liquid-
ity crisis on the domestic interbank market, the BNB would still be
statutorily mandated to convert levs against euro freely at the peg
rate, and to be in a position to discharge its duties as lender of last
resort. A limit on the maximum acceptable interest rate exposure of
the foreign reserves (their maximum duration121) ensures compliance
with the stress risk budget.
It should also be noted that it is very hard if not impossible to de-
termine what the worst possible scenario for the market variables may
be. Because of this, certain assumptions based on historical data
need to be made. The methods for determining the maximum permis-
sible duration of assets and the worst case scenario used by the BNB
are described in Box 4 at the end of this Chapter.
A normal market is one where customary volatility levels obtain
most of the time. The normal risk budget is the maximum percentage
loss that the net worth of the Issue Department would incur at 95 per
cent confidence level: what is called value at risk122.
Following the diagram in Figure 23, the normal risk budget can be
decomposed into three distinct risk budgets: strategic, mixed, and
tactical. The strategic risk budget is linked to the structure of the
benchmark and represents the absolute risk: the outcome of the
optimisation model. The mixed risk budget covers risk brought about
from variance between the tactical portfolio (TAA123) and benchmark
(SAA) on the one hand, and from variance between the tactical port-
folio (TAA) and balance sheet liabilities on the other. Since this risk
cannot be fully accounted for, a conservative assumption is made of
it. The tactical risk budget is explicitly stated and limits relative port-
121 At present this budget equals 2.8 years of duration of the foreign reserves.122 For definition and more details regarding the value at risk market risk measure, see Chapter 3,
Section 3. At present this risk budget equals zero total negative return on the net worth.123 TAA or tactical asset allocation is also called active management. TAA represents positioning by
portfolio managers which is different to benchmark and aims to obtain higher returns than bench-mark. TAA is addressed in detail in Chapter 9.
Chapter 8. Strategic Asset Allocation
125
folio risk124. Relative risk stems from TAA-induced deviations between
the portfolio and benchmark. Given a certain assumption125, it may be
interpreted as foreign reserve yield in the interval of plus/minus one
tactical risk budget of benchmark yield.
The motive for assuming risk and budgeting for it can be illus-
trated with the following example: were the elimination of all market
risk desired, it would be possible to invest the whole foreign reserve
into commercial bank current accounts. This solution would, however,
be undesirable for two reasons. First, such an investment, though
immune from market risk, would involve great credit risk, which a
central bank would be unwilling to assume. Second, the absence of
market risk would be costly since in the long term deposits carry
lower return than government bonds. Investing in government bonds,
on the other hand, carries market risk but no credit risk. For this very
reason most central banks tend to invest over half of their foreign
reserves into government debt and are willing to assume a measure
of market risk. For the sake of comparison it is useful to note that other
institutional investors such as mutual or pension funds assume much
greater market risk than central banks. This also explains why in the
long run they receive higher returns than central banks. A mere com-
parison of returns for these two types of institutional investors would
be spurious, however, since it does not account for the different lev-
els of market risk assumed.
1.2. Liabilities and Leverage
Balance sheet data are an input parameter in the optimisation
model and comprise three components: liabilities by instrument, li-
abilities by currency, and leverage. These data are necessary since
they influence both expected return and risk to the net worth (the Is-
sue Department balance).
124 Relative risk is the risk that the actual portfolio return may be lower than benchmark as a resultof active management.
125 The assumption is that differences between portfolio and benchmark yields (relative yield) arenormally distributed at zero mathematical probability and standard deviation equal to the tacti-cal risk budget. The accepted term for the tactical risk budget is tracking error.
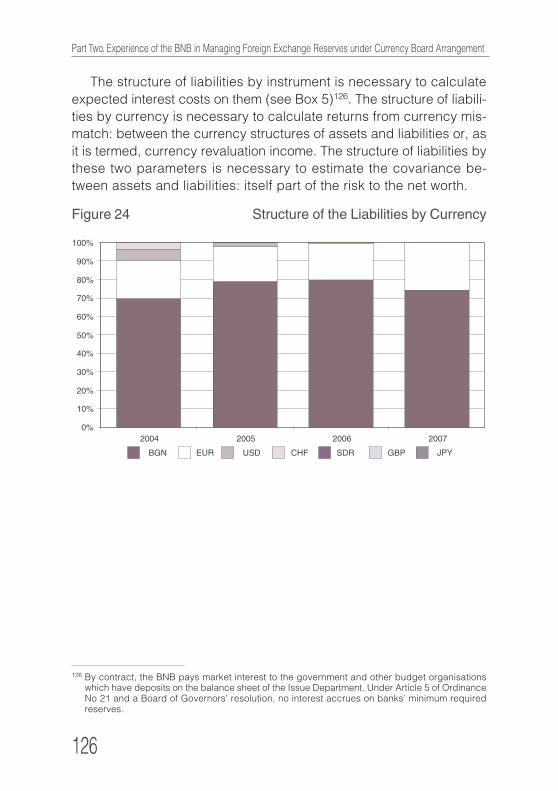
126
Part Two. Experience of the BNB in Managing Foreign Exchange Reserves under Currency Board Arrangement
The structure of liabilities by instrument is necessary to calculate
expected interest costs on them (see Box 5)126. The structure of liabili-
ties by currency is necessary to calculate returns from currency mis-
match: between the currency structures of assets and liabilities or, as
it is termed, currency revaluation income. The structure of liabilities by
these two parameters is necessary to estimate the covariance be-
tween assets and liabilities: itself part of the risk to the net worth.
Figure 24 Structure of the Liabilities by Currency
126 By contract, the BNB pays market interest to the government and other budget organisationswhich have deposits on the balance sheet of the Issue Department. Under Article 5 of OrdinanceNo 21 and a Board of Governors’ resolution, no interest accrues on banks’ minimum requiredreserves.
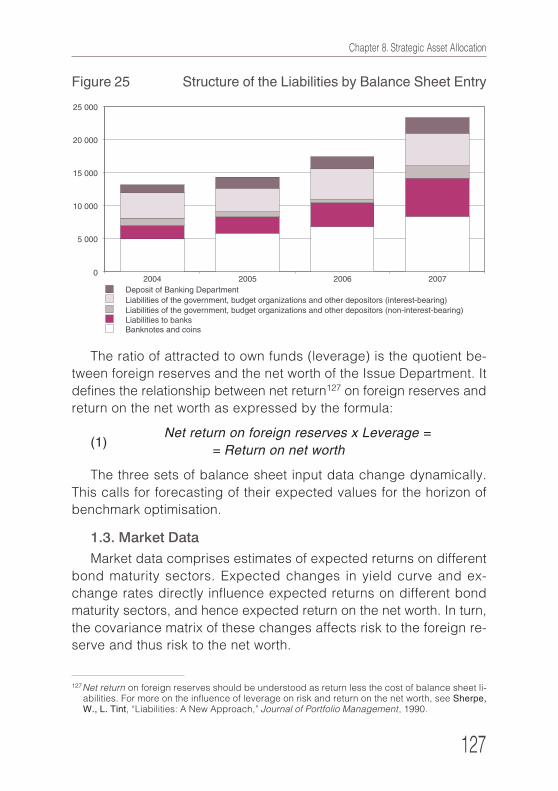
Chapter 8. Strategic Asset Allocation
127
Figure 25 Structure of the Liabilities by Balance Sheet Entry
The ratio of attracted to own funds (leverage) is the quotient be-
tween foreign reserves and the net worth of the Issue Department. It
defines the relationship between net return127 on foreign reserves and
return on the net worth as expressed by the formula:
(1)Net return on foreign reserves x Leverage =
= Return on net worth
The three sets of balance sheet input data change dynamically.
This calls for forecasting of their expected values for the horizon of
benchmark optimisation.
1.3. Market Data
Market data comprises estimates of expected returns on different
bond maturity sectors. Expected changes in yield curve and ex-
change rates directly influence expected returns on different bond
maturity sectors, and hence expected return on the net worth. In turn,
the covariance matrix of these changes affects risk to the foreign re-
serve and thus risk to the net worth.
127 Net return on foreign reserves should be understood as return less the cost of balance sheet li-abilities. For more on the influence of leverage on risk and return on the net worth, see Sherpe,W., L. Tint, “Liabilities: A New Approach,” Journal of Portfolio Management, 1990.
128
Part Two. Experience of the BNB in Managing Foreign Exchange Reserves under Currency Board Arrangement
Market data are the most critical input item, since the solution to
the optimisation problem is highly sensitive to them. Small changes in
these data lead to large changes in output data (the optimum bench-
mark). Moreover, sensitivity as regards yield curve changes and ex-
change rates is much higher than as regards the covariance ma-
trix128. Unlike risk tolerance, which reflects subjective inclination to as-
sume risk, market data has to be forecast. Practitioners and academ-
ics have not agreed on any general principle for assessing yield
curve changes, similar to those for assessing the covariance matrix.
The BNB applies one of the possible approaches: that of no expected
change in yield curves, which assumes that current yield is the best
predictor of future yields. The arguments for this approach, and an
overview of other possible approaches, are presented in Box 5.
2. The Optimisation Model
The optimisation model is at the core of strategic asset allocation.
Each optimisation model comprises two parts: target function, and
constraints. The target function shows what is being optimised, what
variables are used, and how the function depends on them. The con-
straints determine the set of feasible solutions among which the op-
timum must be sought. The target which has to be maximised by
using the foreign reserve benchmark selection model is expected
total return on the net worth (Figure 26). It is a function of the ex-
pected returns on different bond and deposit maturity sectors scaled
by balance sheet leverage and weighed according to their market
weights in foreign reserves. Formula (1) on p. 127 shows that as to-
tal expected return on the net worth is maximised, so is total return on
the foreign reserve.
128See for example Chopra, V.K., W.T. Ziemba, “The Effects of Errors in Means, Variances, andCovariances on Optimal Portfolio Choice,” Journal of Portfolio Management, 1993.
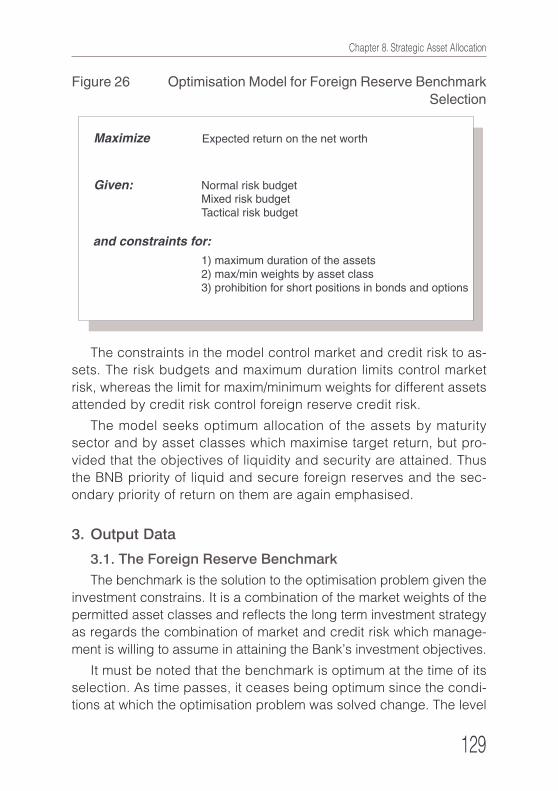
Chapter 8. Strategic Asset Allocation
129
Figure 26 Optimisation Model for Foreign Reserve BenchmarkSelection
The constraints in the model control market and credit risk to as-
sets. The risk budgets and maximum duration limits control market
risk, whereas the limit for maxim/minimum weights for different assets
attended by credit risk control foreign reserve credit risk.
The model seeks optimum allocation of the assets by maturity
sector and by asset classes which maximise target return, but pro-
vided that the objectives of liquidity and security are attained. Thus
the BNB priority of liquid and secure foreign reserves and the sec-
ondary priority of return on them are again emphasised.
3. Output Data
3.1. The Foreign Reserve Benchmark
The benchmark is the solution to the optimisation problem given the
investment constrains. It is a combination of the market weights of the
permitted asset classes and reflects the long term investment strategy
as regards the combination of market and credit risk which manage-
ment is willing to assume in attaining the Bank’s investment objectives.
It must be noted that the benchmark is optimum at the time of its
selection. As time passes, it ceases being optimum since the condi-
tions at which the optimisation problem was solved change. The level
130
Part Two. Experience of the BNB in Managing Foreign Exchange Reserves under Currency Board Arrangement
129 Since the tactical risk budget is initially defined in terms of the net worth, it has to be weighed bybalance sheet leverage before being distributed.
of risk may thus exceed the strategic risk budget and breach the risk
tolerance set by the Board of Governors. Conversely, market risk may
fall below permitted levels set by the strategic risk budget. This out-
come is also undesirable, for lower risk translates into lower return in
the long run. For these reasons, the benchmark has to be rebalanced
periodically into line with set risk budgets. This is accomplished by
solving the optimisation problem again using updated input data. At
present the BNB does this quarterly.
Within a given quarter, however, the structure of the benchmark
remains unchanged and it is possible for it to be sub-optimal with
regard to fresh market data. During this period portfolio managers are
allowed to deviate from the structure of the benchmark when invest-
ing foreign reserves, thus making use of this data. This is one of the
leading roles of the tactical asset allocation, whose aim is to take
advantage of any inefficiency in the benchmark in order for the for-
eign reserve to attain yet higher return. The extent to which foreign
reserve investment deviates from benchmark is controlled for by
means of the tactical risk budget. The latter limits the relative risk
which portfolio managers may assume through deviating from bench-
mark and thus constrains the degree of possible underperformance
of reserves vis-a-vis benchmark.
3.2. Benchmark Portfolios
Once chosen at balance sheet level, the benchmark is distributed
into the different portfolios in which BNB assets are distributed for
management by different teams and managers. This distribution is a
function of the weights of individual portfolios in the market value of
reserves. It is conducted so that the benchmark is weighed by port-
folio, thus preserving its optimum structure as attained when solving
the optimisation model.
As benchmark is distribution by portfolio, so tactical risk also
needs to be distributed129. As in the prior step of benchmark distribu-
tion, portfolio weights are again applied to determine portfolios’ risk
budgets. Unlike benchmarks, however, risk budgets are not
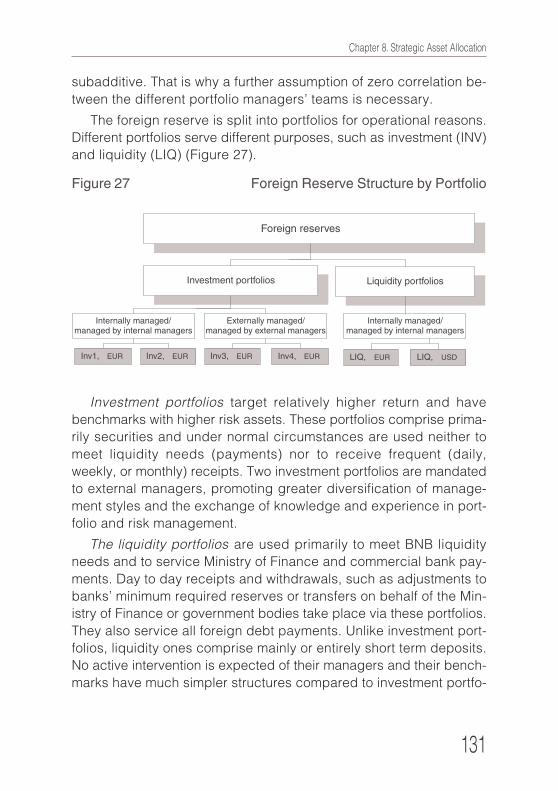
Chapter 8. Strategic Asset Allocation
131
subadditive. That is why a further assumption of zero correlation be-
tween the different portfolio managers’ teams is necessary.
The foreign reserve is split into portfolios for operational reasons.
Different portfolios serve different purposes, such as investment (INV)
and liquidity (LIQ) (Figure 27).
Figure 27 Foreign Reserve Structure by Portfolio
Investment portfolios target relatively higher return and have
benchmarks with higher risk assets. These portfolios comprise prima-
rily securities and under normal circumstances are used neither to
meet liquidity needs (payments) nor to receive frequent (daily,
weekly, or monthly) receipts. Two investment portfolios are mandated
to external managers, promoting greater diversification of manage-
ment styles and the exchange of knowledge and experience in port-
folio and risk management.
The liquidity portfolios are used primarily to meet BNB liquidity
needs and to service Ministry of Finance and commercial bank pay-
ments. Day to day receipts and withdrawals, such as adjustments to
banks’ minimum required reserves or transfers on behalf of the Min-
istry of Finance or government bodies take place via these portfolios.
They also service all foreign debt payments. Unlike investment port-
folios, liquidity ones comprise mainly or entirely short term deposits.
No active intervention is expected of their managers and their bench-
marks have much simpler structures compared to investment portfo-
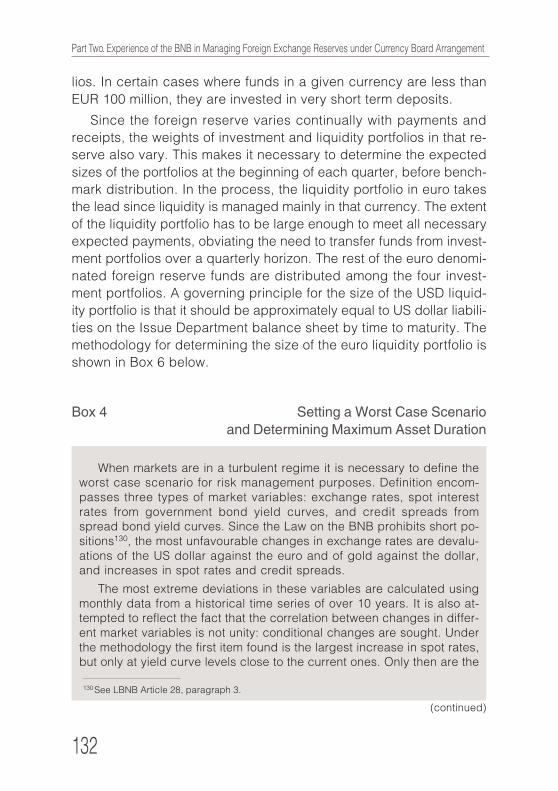
132
Part Two. Experience of the BNB in Managing Foreign Exchange Reserves under Currency Board Arrangement
lios. In certain cases where funds in a given currency are less than
EUR 100 million, they are invested in very short term deposits.
Since the foreign reserve varies continually with payments and
receipts, the weights of investment and liquidity portfolios in that re-
serve also vary. This makes it necessary to determine the expected
sizes of the portfolios at the beginning of each quarter, before bench-
mark distribution. In the process, the liquidity portfolio in euro takes
the lead since liquidity is managed mainly in that currency. The extent
of the liquidity portfolio has to be large enough to meet all necessary
expected payments, obviating the need to transfer funds from invest-
ment portfolios over a quarterly horizon. The rest of the euro denomi-
nated foreign reserve funds are distributed among the four invest-
ment portfolios. A governing principle for the size of the USD liquid-
ity portfolio is that it should be approximately equal to US dollar liabili-
ties on the Issue Department balance sheet by time to maturity. The
methodology for determining the size of the euro liquidity portfolio is
shown in Box 6 below.
Box 4 Setting a Worst Case Scenarioand Determining Maximum Asset Duration
When markets are in a turbulent regime it is necessary to define theworst case scenario for risk management purposes. Definition encom-passes three types of market variables: exchange rates, spot interestrates from government bond yield curves, and credit spreads fromspread bond yield curves. Since the Law on the BNB prohibits short po-sitions130, the most unfavourable changes in exchange rates are devalu-ations of the US dollar against the euro and of gold against the dollar,and increases in spot rates and credit spreads.
The most extreme deviations in these variables are calculated usingmonthly data from a historical time series of over 10 years. It is also at-tempted to reflect the fact that the correlation between changes in differ-ent market variables is not unity: conditional changes are sought. Underthe methodology the first item found is the largest increase in spot rates,but only at yield curve levels close to the current ones. Only then are the
130 See LBNB Article 28, paragraph 3.
(continued)
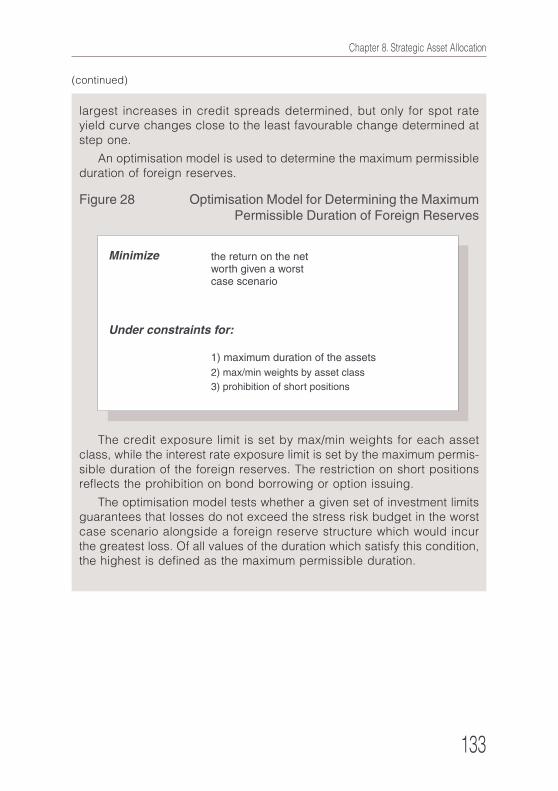
Chapter 8. Strategic Asset Allocation
133
largest increases in credit spreads determined, but only for spot rateyield curve changes close to the least favourable change determined atstep one.
An optimisation model is used to determine the maximum permissibleduration of foreign reserves.
Figure 28 Optimisation Model for Determining the MaximumPermissible Duration of Foreign Reserves
The credit exposure limit is set by max/min weights for each assetclass, while the interest rate exposure limit is set by the maximum permis-sible duration of the foreign reserves. The restriction on short positionsreflects the prohibition on bond borrowing or option issuing.
The optimisation model tests whether a given set of investment limitsguarantees that losses do not exceed the stress risk budget in the worstcase scenario alongside a foreign reserve structure which would incurthe greatest loss. Of all values of the duration which satisfy this condition,the highest is defined as the maximum permissible duration.
(continued)
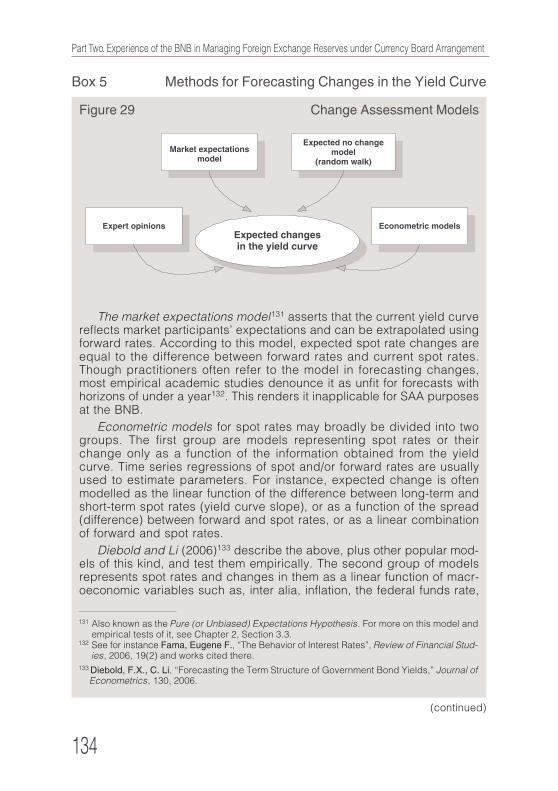
134
Part Two. Experience of the BNB in Managing Foreign Exchange Reserves under Currency Board Arrangement
Box 5 Methods for Forecasting Changes in the Yield Curve
Figure 29 Change Assessment Models
The market expectations model131 asserts that the current yield curvereflects market participants’ expectations and can be extrapolated usingforward rates. According to this model, expected spot rate changes areequal to the difference between forward rates and current spot rates.Though practitioners often refer to the model in forecasting changes,most empirical academic studies denounce it as unfit for forecasts withhorizons of under a year132. This renders it inapplicable for SAA purposesat the BNB.
Econometric models for spot rates may broadly be divided into twogroups. The first group are models representing spot rates or theirchange only as a function of the information obtained from the yieldcurve. Time series regressions of spot and/or forward rates are usuallyused to estimate parameters. For instance, expected change is oftenmodelled as the linear function of the difference between long-term andshort-term spot rates (yield curve slope), or as a function of the spread(difference) between forward and spot rates, or as a linear combinationof forward and spot rates.
Diebold and Li (2006)133 describe the above, plus other popular mod-els of this kind, and test them empirically. The second group of modelsrepresents spot rates and changes in them as a linear function of macr-oeconomic variables such as, inter alia, inflation, the federal funds rate,
(continued)
131 Also known as the Pure (or Unbiased) Expectations Hypothesis. For more on this model andempirical tests of it, see Chapter 2, Section 3.3.
132 See for instance Fama, Eugene F., “The Behavior of Interest Rates”, Review of Financial Stud-ies, 2006, 19(2) and works cited there.
133 Diebold, F.X., C. Li, “Forecasting the Term Structure of Government Bond Yields,” Journal ofEconometrics, 130, 2006.
Chapter 8. Strategic Asset Allocation
135
(continued)
economic indices, exchange rates. Mixed models also exist where ex-pected spot rate changes are modelled as a function of themselves andsome macroeconomic variables. For more information on them and fur-ther references, see Diebold, Rudebusch and Aruoba (2006)134.
The expected no change model or random walk model is the simplestrepresentative of the first group of econometric models. It is shown sepa-rately in Figure 29 since it is the model which the BNB currently uses tocalculate expected spot rate changes.
According to this model, the best predictor of the future yield curve isthe current one: expected change in spot rates is always zero135. The rea-son for selecting this model as part of the SAA methodology is that ityields much better predictions. It is comparable with much more complexmodels, and is often better than them. Because of that it is used in mosttests of new models, being rather hard to beat, especially for short-termforecasts, e.g. up to six months. Diebold & Li (2006) subject this claim tocomparative analysis and uphold it. The simplicity and predictive powerof this model make it widely used in practice and recommended for cen-tral bank foreign reserves management136.
Expert opinions are an alternative to quantitative models for forecast-ing and usually represent the subjective opinion of experts with signifi-cant experience of debt market. This helps them offer informed predic-tions based on available macroeconomic, market, and other data. It turnsout, however, that the subjective forecasts even of leading economistshardly beat the expected no change model. Brooks and Gray (2004)137
are among the many confirming this. They look into the long history138 ofconsensus (e. g., average) forecasts by eminent economists whose longterm interest rate predictions on the American yield curve appear in theWall Street Journal every six months. The authors conclude that the ex-pected no change model performs better. Indeed, consensus forecastshave been in the wrong direction 65 per cent of the time. Another recentpaper on the topic is by Mitchell and Pearce (2005)139. On the whole, re-
134 Diebold, F.X., G.D. Rudebusch and B. Aruoba, “The Macroeconomy and the Yield Curve: ADynamic Latent Factor Approach,” Journal of Econometrics, 131, 2006.
135 The model does not assert that changes are nil, but that expected (in the sense of mathemati-cal expectation, e. g., average) change is nil.
136 See for example “Total Return Management of Central Bank Reserves,” Fixed Income Re-search, Lehman Brothers, January 2005.
137 Brooks, R., J.B. Gray, “History of the Forecasters,” Journal of Portfolio Management, Fall 2004.138 More precisely 43 forecasts.139 Mitchell, Karlyn, Douglas K. Pearce, Professional Forecasts of Interest Rates and Exchange
Rates: Evidence from The Wall Street Journal’s Panel of Economists, Working Paper, Depart-ment of Economics, North Carolina State University.
(continued)
136
Part Two. Experience of the BNB in Managing Foreign Exchange Reserves under Currency Board Arrangement
(continued)
search shows that expert forecasts are best for the most short term rateswhich are almost entirely driven by the monetary policy of central banksand are thus predictable to some extent.
The analyses and works cited show that in the long run the capitalmarkets for debt securities are highly efficient and thus to a large extentunpredictable. In other words, the current yield curve reflects the entiretyof publicly available market information and the expected no changemodel is a success for this reason. The role of experts, however, is toknow the assumptions behind the models used and to make decisionsdifferent from the models when these assumptions change or the marketsare in a short-lived phase of inefficiency. In this sense, experts’ judgmentwill always be necessary, as no model gives good predictions all thetime, and it is the experts’ who can determine when this obtains.
Box 6 Methodology for Determining the Sizeof the Liquidity Portfolio in Euro
Each quarter optimum, minimum, and maximum sizes of the liquidityportfolio in euro are determined as follows140:
Minimum: this is determined from a net external cash flow time seriesbeginning 1 January 2003 and is defined as the minimum of the cumu-lative net external cash flow within a calendar quarter. To avoid the regu-lar fluctuations at the end of each calendar month caused by adjustmentsof minimum reserves by commercial banks (large external cash inflowsat the close of one month followed by external cash outflows of a similarmagnitude at the beginning of the next), the accumulation of net cashflows begins with a five day offset between the sixth business day of onequarter to the sixth business day of the next.
Maximum: this is determined as the minimum size plus 5 per cent ofthe expected amount of euro-denominated assets for the quarter.
Optimum: this is determined as the sum of:
The minimum size plus a third of the difference between maximumand minimum sizes.
(continued)
140 The practice that the sizes are multiples of 10 million has been adopted, which may result inrounding.

Chapter 8. Strategic Asset Allocation
137
The market value of the liquidity portfolio can exceed the maximum orbe less than the minimum for not longer than five consecutive businessdays. When the forecast net cash flow is expected to exceed the limitsize of the liquidity portfolio the Director of the Treasury head may rule forthis cash to be:
1) Either fully or partially transferred into euro investment portfolios;
2) Or transferred to or from euro investment portfolios as appropriateto bring the euro liquidity portfolio back to its optimum size.
To cut transaction costs funds in the liquidity portfolio may currentlybe invested only into deposits ranging from overnight to one week andinto interest rate or bond futures.
(continued)
138
Part Two. Experience of the BNB in Managing Foreign Exchange Reserves under Currency Board Arrangement
Chapter Nine
BNB Tactical Asset Allocation
This chapter focuses on the stage of the investment process which
follows the choice of benchmark and the setting of investment guide-
lines and limits. As indicated in Part I, foreign reserves are actually
invested at the tactical asset allocation stage. This boils down to daily
buying and selling eligible classes of assets: fixed income securities,
money market instruments, and futures on interest rates and bonds.
At this stage, investment decisions rest mainly on current expecta-
tions of return on an asset class within the investment horizon or on
finding and exploiting price anomalies. Tactical asset allocation (TAA)
is said141 to contribute 5 to 10 per cent of returns. This can largely be
explained by constraints on deviation from the benchmark imposed
on portfolio managers.
As explained in Chapter 8, the benchmark has an optimum struc-
ture at the beginning of an investment horizon. Significant short term
changes or deviations from market equilibrium may occur within that
horizon, even if it were just one quarter. Thus, a major TAA goal is to
change portfolio structure dynamically as market conditions and ex-
pectations evolve. The purpose is to attain optimum allocation and
higher-than-benchmark returns within SAA limits.
Other objectives set at the TAA level are to maintain close contacts
with the Bank’s counterparties and gain market knowledge, experi-
ence, and skill; these can be critical at junctures when Bank assets
may have to be sold rapidly as part of Law on the BNB Article 31 op-
erations, or to assist adherence to investment objectives amid sharp
market fluctuations.
141 Ibbotson, Roger G., Paul D. Kaplan, “Does Asset Allocation Policy explain 40, 90 or 100 Percentof Performance?,” Financial Analysts Journal, CFA Institute, January/February 2000.
Chapter 9. BNB Tactical Asset Allocation
139
BNB portfolio managers follow the general TAA framework de-
scribed in Part I. This combines investment decisions with horizons of
a day to several weeks with ones from a month to a quarter. Top-
down or bottom-up analyses may be applied when adopting invest-
ment decisions (the former starts at the macroeconomic level, de-
scending through particular sectors to particular asset classes or
securities; the latter focuses on specific assets or securities).
Different strategies may be implemented depending on market
conditions and portfolio managers’ expectations. Some address idi-
osyncratic risk142, others systemic risk, and yet others combinations
of both.
Table 10 BNB Investment Strategies
1. BNB Active Portfolio Management Strategies
When managing BNB foreign reserves the active approach usually
aims at higher relative returns at acceptable risk levels. It assumes
that portfolio managers and financial analysts are able to pinpoint
market anomalies, determine risk factors vis-a-vis which an exposure
may to be opened, and pick the right time for such openings.
142 Risk stemming from factors other than interest rate changes and usually inherent to a particularissuer or security.
Passive Strategy
Some securities in thebenchmark are pur-chased to match majorbenchmark riskcharacteristics: duration,convexity, creditexposure
Low Relative Risk
Active Strategy withDeviations from MainRisk Factors (excludingDuration)
1. Open positions in“rich” or “cheap”maturity sectors2. Utilisation of tempo-rary market anomalies3. Credit diversification
Moderately HighRelative Risk
Active Strategy withDeviations from MainRisk Factors (includingDuration)
1. Deviations frombenchmark durationand/or convexity2. Yield curve openpositions3. Open positions tocredit
High Relative Risk
140
Part Two. Experience of the BNB in Managing Foreign Exchange Reserves under Currency Board Arrangement
1.1. Active Positions as regards Duration, Convexity, YieldCurve, and Credit Spread
Since the greater part of foreign reserves is invested into fixed
income securities, interest rate risk measured by modified duration is
the leading risk factor monitored by portfolio managers. Depending
on managers’ expectations, portfolio duration may be:
а) different from benchmark (shorter or longer)
b) equal to benchmark (neutral).
For example, where a general interest rate drop is expected within
the investment horizon, portfolio duration may be extended by com-
parison with the benchmark, or vice versa: if interest rate rises are
expected, portfolio duration is drawn down on the benchmark. All
changes in modified duration render portfolio market value more or
less sensitive to interest rate changes. Depending on the quality of
portfolio managers’ forecasts, all relative duration positions contribute
to higher or lower portfolio return relative to benchmark. When port-
folio managers are uncertain of future interest rate movements, they
usually adopt a neutral position, i. e., a duration position equal to that
of the benchmark.
Another factor which can greatly impact relative performance is
interest rate volatility, usually measured by convexity. When high vola-
tility is expected, higher convexity is preferred, usually implemented
through a barbell strategy. In this case, portfolio managers invest in
the short sector (two years) and the long sector (ten years) of the
yield curve and sell or avoid the medium sector (five to seven years).
Where portfolio managers also wish to express a view on future inter-
est rate movements, they may combine their convexity positions with
the modified duration position.
Since the above risk factors have the greatest effect on return, the
adoption of positions on them is deemed the mark of a strongly ex-
pressed active strategy. Important to such a strategy is not only the
direction and magnitude of interest rate changes, but also their tim-
ing. The strategy is characterised by greater return volatility; it has
higher standard deviation of relative performance (tracking error).
Relative positions to the benchmark may also be based on expec-
tations of future maturity sector yields, changes in different asset
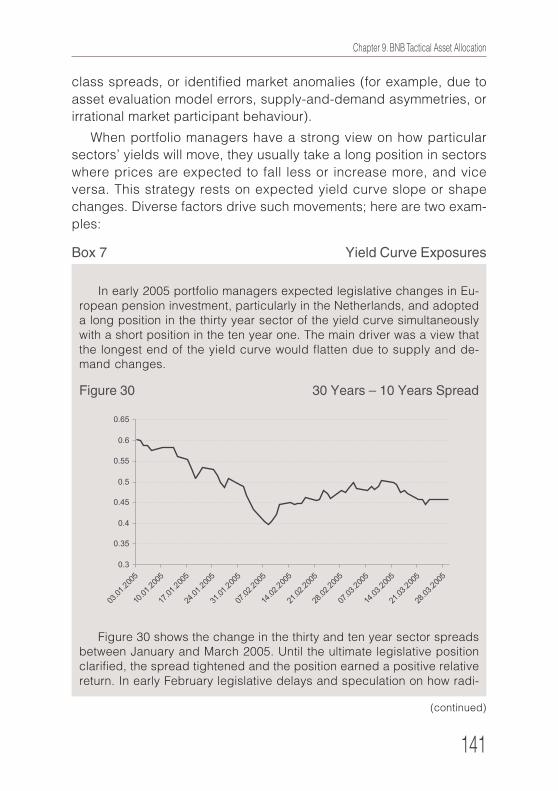
Chapter 9. BNB Tactical Asset Allocation
141
(continued)
class spreads, or identified market anomalies (for example, due to
asset evaluation model errors, supply-and-demand asymmetries, or
irrational market participant behaviour).
When portfolio managers have a strong view on how particular
sectors’ yields will move, they usually take a long position in sectors
where prices are expected to fall less or increase more, and vice
versa. This strategy rests on expected yield curve slope or shape
changes. Diverse factors drive such movements; here are two exam-
ples:
Box 7 Yield Curve Exposures
In early 2005 portfolio managers expected legislative changes in Eu-ropean pension investment, particularly in the Netherlands, and adopteda long position in the thirty year sector of the yield curve simultaneouslywith a short position in the ten year one. The main driver was a view thatthe longest end of the yield curve would flatten due to supply and de-mand changes.
Figure 30 30 Years – 10 Years Spread
Figure 30 shows the change in the thirty and ten year sector spreadsbetween January and March 2005. Until the ultimate legislative positionclarified, the spread tightened and the position earned a positive relativereturn. In early February legislative delays and speculation on how radi-
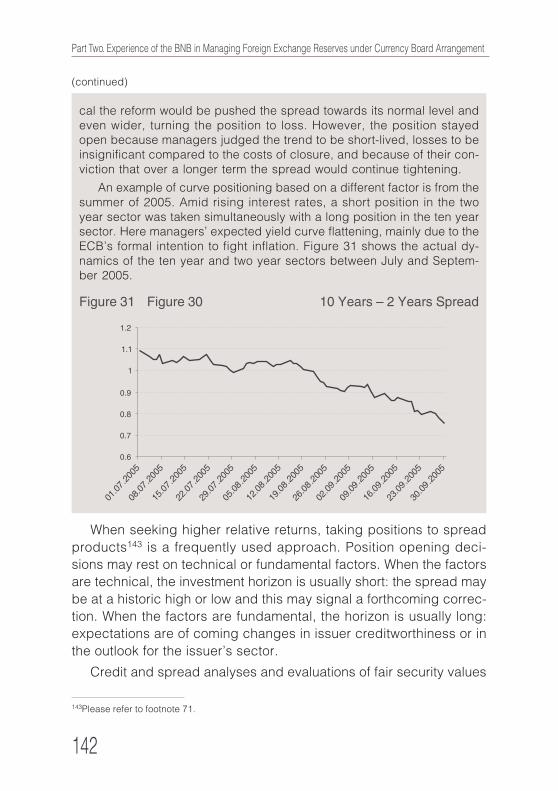
142
Part Two. Experience of the BNB in Managing Foreign Exchange Reserves under Currency Board Arrangement
(continued)
143Please refer to footnote 71.
cal the reform would be pushed the spread towards its normal level andeven wider, turning the position to loss. However, the position stayedopen because managers judged the trend to be short-lived, losses to beinsignificant compared to the costs of closure, and because of their con-viction that over a longer term the spread would continue tightening.
An example of curve positioning based on a different factor is from thesummer of 2005. Amid rising interest rates, a short position in the twoyear sector was taken simultaneously with a long position in the ten yearsector. Here managers’ expected yield curve flattening, mainly due to theECB’s formal intention to fight inflation. Figure 31 shows the actual dy-namics of the ten year and two year sectors between July and Septem-ber 2005.
Figure 31 Figure 30 10 Years – 2 Years Spread
When seeking higher relative returns, taking positions to spread
products143 is a frequently used approach. Position opening deci-
sions may rest on technical or fundamental factors. When the factors
are technical, the investment horizon is usually short: the spread may
be at a historic high or low and this may signal a forthcoming correc-
tion. When the factors are fundamental, the horizon is usually long:
expectations are of coming changes in issuer creditworthiness or in
the outlook for the issuer’s sector.
Credit and spread analyses and evaluations of fair security values
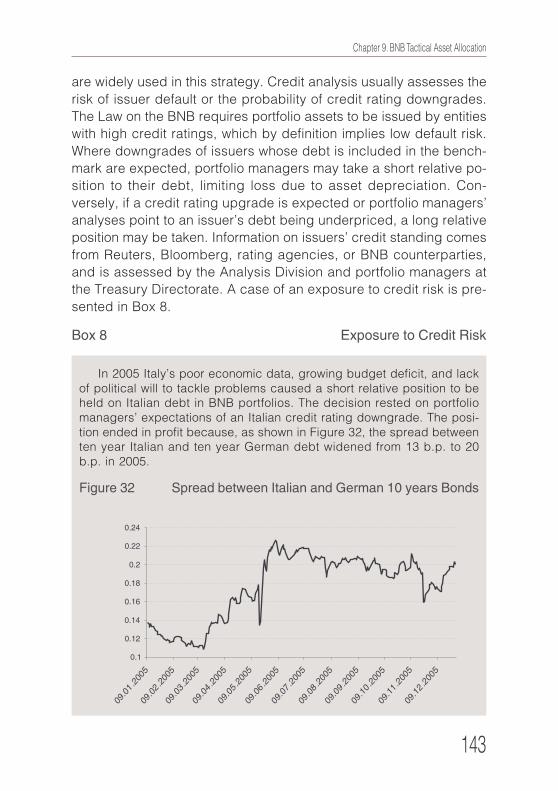
Chapter 9. BNB Tactical Asset Allocation
143
are widely used in this strategy. Credit analysis usually assesses the
risk of issuer default or the probability of credit rating downgrades.
The Law on the BNB requires portfolio assets to be issued by entities
with high credit ratings, which by definition implies low default risk.
Where downgrades of issuers whose debt is included in the bench-
mark are expected, portfolio managers may take a short relative po-
sition to their debt, limiting loss due to asset depreciation. Con-
versely, if a credit rating upgrade is expected or portfolio managers’
analyses point to an issuer’s debt being underpriced, a long relative
position may be taken. Information on issuers’ credit standing comes
from Reuters, Bloomberg, rating agencies, or BNB counterparties,
and is assessed by the Analysis Division and portfolio managers at
the Treasury Directorate. A case of an exposure to credit risk is pre-
sented in Box 8.
Box 8 Exposure to Credit Risk
In 2005 Italy’s poor economic data, growing budget deficit, and lackof political will to tackle problems caused a short relative position to beheld on Italian debt in BNB portfolios. The decision rested on portfoliomanagers’ expectations of an Italian credit rating downgrade. The posi-tion ended in profit because, as shown in Figure 32, the spread betweenten year Italian and ten year German debt widened from 13 b.p. to 20b.p. in 2005.
Figure 32 Spread between Italian and German 10 years Bonds
144
Part Two. Experience of the BNB in Managing Foreign Exchange Reserves under Currency Board Arrangement
1.2. Active Positions based on Quantitative Methods
An approach often applied in BNB reserve management in search
of higher relative return is to open positions based on expected future
movements of the spread between two securities. Here the assump-
tion is that, other things being equal, the spread between two secu-
rities would tend to revert to its mean level. For this reason, if the
spread was above its mean, it is seen as “cheap” and good for buy-
ing; if it was below its mean, it is considered “rich” and good for sell-
ing. If we have two securities with similar risk characteristics and their
spread is above its historical mean it is good to buy the “cheap” pa-
per (that with the higher yield) and sell the “rich” paper (that with the
lower yield) expecting the spread to return to its mean level; the faster
the move to the mean, the higher the return from the position. A very
important factor to be considered when deciding to open a position
is the reason behind the deviation of the spread from its mean. Is it
due to purely technical reasons, or to fundamental ones? If the latter
prevail, the probability of the deviation lasting longer is very high. This
can turn the position to loss or to lower than expected earnings. An
example of active positions based on quantitative methods is given
in Box 9.
1.3. Active Positions utilising Peculiarities of the FixedIncome Market
Positions may also be opened for reasons other than expected
interest rate movements. Here, a higher relative return is sought by
utilising the peculiarity of the fixed income market that yields fall with
declining bond maturity (“riding the yield curve”). The steep part of
the curve is used, or else funds from low yield sectors are used to fi-
nance purchases of higher yield sectors (“carry trade”). Some spread
products may be added for a measure of credit diversification. The
latter often involves products at the short end of the yield curve (up
to two years) at the expense of government securities. Other things
being equal, the spread risk in this part of the curve is low and rela-
tive return from is higher.
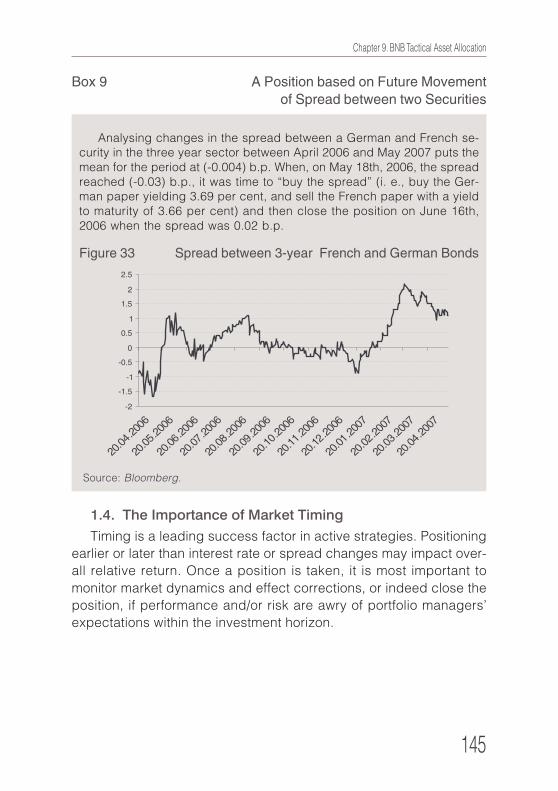
Chapter 9. BNB Tactical Asset Allocation
145
Box 9 A Position based on Future Movementof Spread between two Securities
Analysing changes in the spread between a German and French se-curity in the three year sector between April 2006 and May 2007 puts themean for the period at (-0.004) b.p. When, on May 18th, 2006, the spreadreached (-0.03) b.p., it was time to “buy the spread” (i. e., buy the Ger-man paper yielding 3.69 per cent, and sell the French paper with a yieldto maturity of 3.66 per cent) and then close the position on June 16th,2006 when the spread was 0.02 b.p.
Figure 33 Spread between 3-year French and German Bonds
Source: Bloomberg.
1.4. The Importance of Market Timing
Timing is a leading success factor in active strategies. Positioning
earlier or later than interest rate or spread changes may impact over-
all relative return. Once a position is taken, it is most important to
monitor market dynamics and effect corrections, or indeed close the
position, if performance and/or risk are awry of portfolio managers’
expectations within the investment horizon.
146
Part Two. Experience of the BNB in Managing Foreign Exchange Reserves under Currency Board Arrangement
2. New Instruments Used in Active Strategies
Reserve management is a dynamic, continuously evolving proc-
ess and the BNB constantly evaluates different approaches and
methods to boost efficiency. In late 2004 the Bank began using inter-
est rate and bond futures. Compared with securities, these instru-
ments offered a rapid and more economical route to attaining desired
exposure duration, yield and spread. This made them preferable in
certain strategies. They are widely used in opening positions with
horizons ranging from mere hours to a day or up to a week and rest-
ing on technical analyses or portfolio managers’ expectations of data
announcements. They may also be used in medium or long-term
strategies such as ones resting on expectations of yield curve flatten-
ing in the two to ten year sectors. In the latter case, a short position
in two year bond futures is taken simultaneously with ten year bond
futures; the position may express some duration view or may be du-
ration-neutral. Information systems are used intensively to determine
the exact number of contracts to trade. Due to recent years’ market
depth in these instruments, liquidity risk is very close to that attend-
ing fixed income instruments.
3. Passive Strategies
If portfolio managers do not have a clear view on future market
movements, or the risk budget is exhausted, a passive reserve man-
agement approach applies. No deviations from benchmark risk char-
acteristics are made, the aim being to achieve a return very close to
benchmark. There are different ways to proceed:
1. To buy the benchmark: all securities in the benchmark are
bought, with the same weight as they have in it. Portfolio return
is identical to benchmark and transaction costs are least due
to low turnover. This is often hard to implement: the benchmark
may contain many securities, some of which may be very
illiquid.
2. Stratification: securities in the benchmark are grouped to cer-
tain criteria. Each group is presented in the portfolio by one or
Chapter 9. BNB Tactical Asset Allocation
147
more securities. Again the aim is to achieve the same risk char-
acteristics as benchmark. Transaction costs are low again, but
tracking error is greater due to the inherent presence of model
error in grouping.
3. Buying some of the securities in the benchmark and attempt-
ing to emulate its major risk characteristics. This strategy is
used more often at the BNB. The choice of securities is ran-
dom, yet diverse methods of identifying “rich” or “cheap” secu-
rities are often applied. While transaction costs and tracking
error are low, they are higher than in the above strategies.
Moreover, there is the possibility of error in the quantitative
methods used to evaluate securities. Valuation methods often
applied at the BNB are based on swap curve or z-scores.
Box 10 Passive Strategy Implementation
New investment guidelines and a new benchmark for euro investmentportfolios were introduced in late 2003 and early 2004. Starting to buildthe new portfolio, managers selected duration and convexity equal tothose of the benchmark and low tracking error as their main objectives.
Due to huge transaction numbers and traded amounts, portfolio re-structuring took three days. The instant to buy or sell securities oftendepended on portfolio managers’ expectations of future market develop-ments, mostly signalled by technical analysis. Different analyses werecombined in choosing a particular security and determining if it was“rich” or “cheap”: spread against swap curve, fair value, and z-scores.Particular attention was paid to transaction costs to achieve an optimumresult, with bigger or smaller purchases of different securities and care-ful investment and divestment timing.
When the new structure was complete, portfolio managers graduallyturned to active strategies pursuing the objective of investment portfolios(achieving higher relative returns). This involved opening positions toduration, convexity and spread movements between different euro areasovereign debts or particular securities and spread products.
Systems developed by the Investment Division and the Risk Analy-
sis and Control Directorate provide continuous monitoring and evalu-
ation of investment results. These are compared to benchmark and

148
Part Two. Experience of the BNB in Managing Foreign Exchange Reserves under Currency Board Arrangement
where they may fall short, or depending on market developments and
managers’ expectations, active positions may be closed or strategies
changed. This may be with respect to assumed risks or absolute or
relative exposure sizes. Control is examined in detail in Chapter 11.
Chapter 10. BNB Foreign Reserve Management Results
149
Chapter 10
BNB Foreign Reserve Management Results
The results from the management of BNB’s foreign exchange re-
serves are reported to the public in Annual and Semiannual Reports.
Performance reviews over periods of more than a year provide an op-
portunity to reinforce comprehension of the specific terminology
used, of all theoretical approaches, and of various relationships within
the overall process of reserves management. It also allows better in-
depth understanding of the economic purpose of foreign currency
reserves and the significance of time in the overall process. This is
why information on reserves here is structured differently to Annual
and Semiannual Reports.
As explained in Chapter 7, the process of foreign exchange re-
serve management must be, and in the case of the BNB is, independ-
ent of the Bank’s profit allocation policy. Therefore, the interpretation
of the results of foreign reserve management does not include profit
distribution and analyses of annual transfers to government. The lat-
ter is specified in Article 36 and Article 8 of the Law on the BNB and
done as soon as the outcomes of reserve management are available.
Returns for the 2000 to 2007 period are presented below. The rea-
sons why the entire period after currency board launch is not covered
are:
• The ECB and the euro exist since 1999 and the former pres-
ence of a wide range of European currencies in the BNB’s port-
folio complicates analysis;
• BNB’s awareness of best international practice in foreign re-
serves improved by degrees, with benchmarks being intro-
duced in April 1999;
• Data on prior periods are restricted, due to the fall that the
spicialized foreign reserve management information system
went live in early 2000.
150
Part Two. Experience of the BNB in Managing Foreign Exchange Reserves under Currency Board Arrangement
1. Impact of the Market Environment on Reserve
Management Returns
The BNB is not an institutional investor whose strategy centres on
maximizing return; it is a central bank operating a currency board. Its
primary goal is to maintain the stability of the national currency: for-
eign asset liquidity and security have priority. As explained in Chap-
ter 7, the objective of optimum returns stems entirely from these pri-
orities and is neither quantitatively nor legally set. This calls on the
BNB to operate in money and fixed income markets with the lowest
risk and highest liquidity, and in relatively short term and highly liq-
uid sub-sectors of the government bond, state-guaranteed instru-
ment, and covered bond markets. As a rule, conditions in these mar-
ket segments depend very largely on changes in the monetary and
interest rate policy of the two major central banks: the ECB and the
Federal Reserve. Thus, monetary policy awareness is essential in
managing foreign reserves as it has a direct effect on the portfolio
performance.
As evident from the figures below, the nine years since the euro
launch comprise two tightening (rising repo rate) and one easing cy-
cles (falling repo rate). For two and a half years, between mid-2003
and late 2005, the ECB conducted expansionary monetary policy by
maintaining the key rate at historical lows. Thereafter, a discrepancy
arose between ECB announcements and decisions. Official and un-
official ECB statements in October and November 2005 did not indi-
cate explicit intentions to change monetary policy stance. However,
in December the Bank surprised market participants by raising the
repo rate without signalling a new interest rate cycle. In advance in a
similar manner, the Bank halted monetary policy easing in mid-2007
to alleviate the growing liquidity crisis on financial markets, without
signalling the change beforehand.
At the outset of the same period the Federal Reserve Bank cut the
fed funds rate more aggressively, keeping their target rate at the low-
est possible level until mid-2004. Thereafter the Federal Open Market
Committee raised interest in several consecutive steps by 25 basis
points at each monetary policy meeting. To avoid potential yield curve

Chapter 10. BNB Foreign Reserve Management Results
151
Figure 34 ECB Interest Rate Policy (Repo Rate)and Market Yield to Maturity of 1–3 Year
and 7–10 Year European Government Bonds *
* The market yield of instruments maturing in under a year is very close to the repo rate and is notshown here.
Figure 35 Federal Reserve Bank Interest Rate Policy(Federal Funds’ Target Rate) and Market Yield
to Maturity of 1–3 Years and 7–10 Year Treasury Securities
1999 2000 2001 2002 2003 2004 2005 2006 20071.0%
1.5%
2.0%
2.5%
3.0%
3.5%
4.0%
4.5%
5.0%
5.5%
6.0%
Repo rate 1–3 years 7–10 years
1999 2000 2001 2002 2003 2004 2005 2006 20070.0%
1.0%
2.0%
3.0%
4.0%
5.0%
6.0%
7.0%
8.0%Fed funds rate 1–3 years 7–10 years
152
Part Two. Experience of the BNB in Managing Foreign Exchange Reserves under Currency Board Arrangement
144 Based on daily figures on the European government bond market, compiled by Merrill Lynch andBloomberg. The indices, composed of various government bond issues with specified maturity,are representative for risk (credit and interest rate risk) and market return in that segment overspecific period of time.
volatility (see Figure 35), these steps were announced in advance.
The cycle of interest rises ended in June 2006 when the key rate
reached 5.25 per cent. At the very beginning of the financial crisis in
August 2007, the Federal Reserve took decisive steps towards low-
ering the key rate in line with stated intentions and market expecta-
tions.
Short-term target rate levels determined by the ECB and the Fed
directly influence interest on short-term interbank deposits, for exam-
ple ones with maturities of up to a month. Historically low interest on
the interbank market between mid-2003 and mid-2006 caused rela-
tively low returns in this market segment. On the other hand, the finan-
cial crisis after summer 2007 inflated credit risk in this segment to un-
precedented levels. This immediately hit major multinational banks
where high degrees of risk were concentrated, primarily due to their
securitising of US sub-prime lending. This caused the BNB to restrict
its exposure to such banks’ credit risk further, and to limit deposit
durations. This cut risk, yet lowered return.
Since public debt restructuring in 2002 and 2003 in line with Law
on the BNB Article 31, the BNB’s portfolio has comprised almost ex-
clusively euro assets. For this reason, the analysis of the market en-
vironment and its influence on returns from foreign reserve manage-
ment is deliberately limited to euro denominated instruments.
As stated Part I, the other key factor determining return on the
BNB reserve portfolio is how the low risk fixed income market for
short-term government and state-guaranteed instruments interprets
the two leading central banks’ signals on monetary policy stance.144
Other than expected short-term interest rates, yields on government
bonds depend on evolving investor risk appetite: preferences for the
relative safety of fixed income instruments or for alternative invest-
ment segments featuring higher risk but promising higher returns. The
actual dynamics of coupon and market yield to maturity on fixed in-
come instruments maturing in under a year and of ones maturing in
one to three years are shown below.
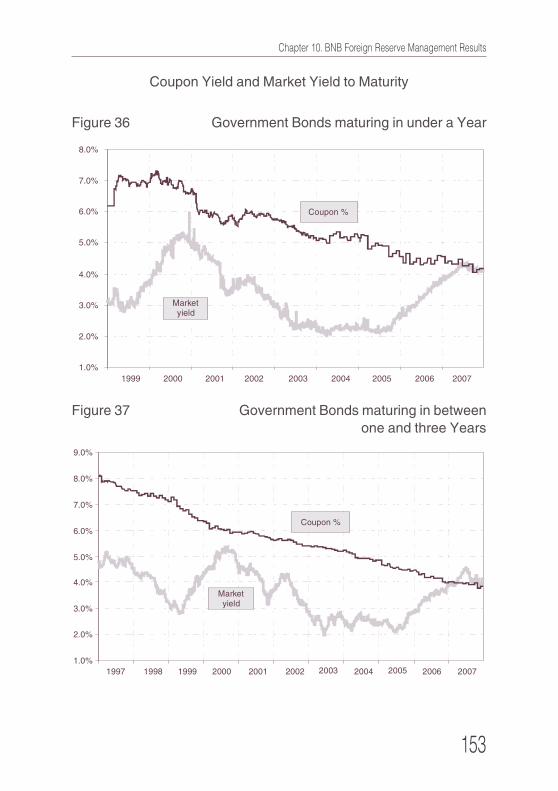
Chapter 10. BNB Foreign Reserve Management Results
153
Coupon Yield and Market Yield to Maturity
Figure 36 Government Bonds maturing in under a Year
Figure 37 Government Bonds maturing in betweenone and three Years
200720062005200420032002200120001999
Coupon %
Market yield
1.0%
2.0%
3.0%
4.0%
5.0%
6.0%
7.0%
8.0%
20071999 2000 2001 2002 2003 2004 2005 200619981997
1.0%
2.0%
3.0%
4.0%
5.0%
6.0%
7.0%
8.0%
9.0%
Coupon %
Market yield
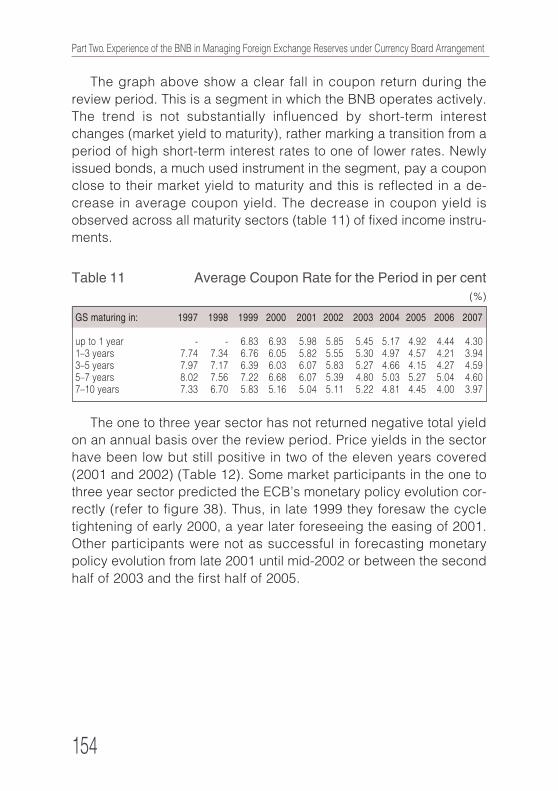
154
Part Two. Experience of the BNB in Managing Foreign Exchange Reserves under Currency Board Arrangement
The graph above show a clear fall in coupon return during the
review period. This is a segment in which the BNB operates actively.
The trend is not substantially influenced by short-term interest
changes (market yield to maturity), rather marking a transition from a
period of high short-term interest rates to one of lower rates. Newly
issued bonds, a much used instrument in the segment, pay a coupon
close to their market yield to maturity and this is reflected in a de-
crease in average coupon yield. The decrease in coupon yield is
observed across all maturity sectors (table 11) of fixed income instru-
ments.
The one to three year sector has not returned negative total yield
on an annual basis over the review period. Price yields in the sector
have been low but still positive in two of the eleven years covered
(2001 and 2002) (Table 12). Some market participants in the one to
three year sector predicted the ECB’s monetary policy evolution cor-
rectly (refer to figure 38). Thus, in late 1999 they foresaw the cycle
tightening of early 2000, a year later foreseeing the easing of 2001.
Other participants were not as successful in forecasting monetary
policy evolution from late 2001 until mid-2002 or between the second
half of 2003 and the first half of 2005.
Table 11 Average Coupon Rate for the Period in per cent(%)
GS maturing in: 1997 1998 1999 2000 2001 2002 2003 2004 2005 2006 2007
up to 1 year - - 6.83 6.93 5.98 5.85 5.45 5.17 4.92 4.44 4.301–3 years 7.74 7.34 6.76 6.05 5.82 5.55 5.30 4.97 4.57 4.21 3.943–5 years 7.97 7.17 6.39 6.03 6.07 5.83 5.27 4.66 4.15 4.27 4.595–7 years 8.02 7.56 7.22 6.68 6.07 5.39 4.80 5.03 5.27 5.04 4.607–10 years 7.33 6.70 5.83 5.16 5.04 5.11 5.22 4.81 4.45 4.00 3.97
Chapter 10. BNB Foreign Reserve Management Results
155
The aggregate annual yield on bonds maturing in more than three
years was negative in at least one calendar year.
Figure 38 Average Coupon Rate and Aggregate Returns onBonds maturing in 1-3 Years
Table 12 Aggregate Yield over the Period(%)
Notes: Average values for the period are derived by computing the geometric mean of the particulardata set. Due to data shortages, average values for individual sectors combining maturitiesof up to a year are based on figures for the 1999 to 2007 period.
Maturity sector 1997 1998 1999 2000 2001 2002 2003 2004 2005 2006 2007 average
Deposits up to1 month 4.26 4.21 2.82 4.21 4.41 3.31 2.35 1.93 2.08 2.84 4.05 3.11up to 1 year(discount bills) - - 2.77 4.14 4.57 3.50 2.43 2.12 2.06 2.80 3.99 3.15up to 1 year - - 2.93 4.18 5.03 4.15 2.59 2.17 2.06 2.75 4.03 3.321–3 years 5.29 6.53 1.79 4.83 5.86 5.92 3.31 3.32 2.07 1.76 3.82 3.623–5 years 6.63 9.75 -0.50 6.13 5.94 8.70 3.87 5.64 2.83 0.51 3.45 4.035–7 years 8.89 12.39 -2.31 7.31 5.81 10.67 4.22 7.60 4.11 -0.36 2.98 4.387–10 years 11.12 15.23 -4.69 8.51 5.23 11.85 4.54 9.40 6.01 -1.13 1.87 4.50
156
Part Two. Experience of the BNB in Managing Foreign Exchange Reserves under Currency Board Arrangement
A more thorough overview of historical data suggests that the sec-
tor combining maturities of up to a year has never delivered negative
aggregate returns, not even on a quarterly basis, unlike other sectors
such as the one to three years (in two of 44 quarters), three to five
years (in 11 of 44 quarters), five to seven years (in 12 of 44 quarters),
and seven to ten years (in 13 of 44 quarters). However, due to the
higher coupon rate vis-а-vis prevailing market yield to maturity in the
sector, negative price yields obtained in 102 of the 108 months re-
viewed.
Historical market data on European investment grade bonds thus
reinforces the theoretical assertion that in the long term relative to risk
assets (here with shorter maturities) deliver lower returns against
higher risk assets (here with longer maturities). The emphasis on the
investment horizon is not accidental: it is obvious that there are cer-
tain periods in which yields on instruments carrying longer maturities
have been significantly higher, and this is certainly no exception. The
greater market risk (modified duration) in longer maturity term struc-
tures explains the greater dispersion (or risk) of investor-realised
yield. The latter justifies the BNB’s additional strategic positioning
conservatism where greater price volatility is expected.
When ECB’s and Fed’s key rates reached historical lows in 2002
and 2003, analysts’ uncertainty of future interest policy and of the
length of new interest rate cycles increased considerably. At such
junctures, re-evaluating investor risk tolerance is worthwhile. In early
2004 the BNB adopted a more conservative strategic asset allocation
policy. The duration was also cut from a year to three months. The
conservative practice was resumed in April 2006 when the ECB com-
menced a new cycle of interest rises signalled in advance to market
participants. Amid financial market distress in August 2007 the Bank
adopted additional safeguards against credit and interest rate risk.
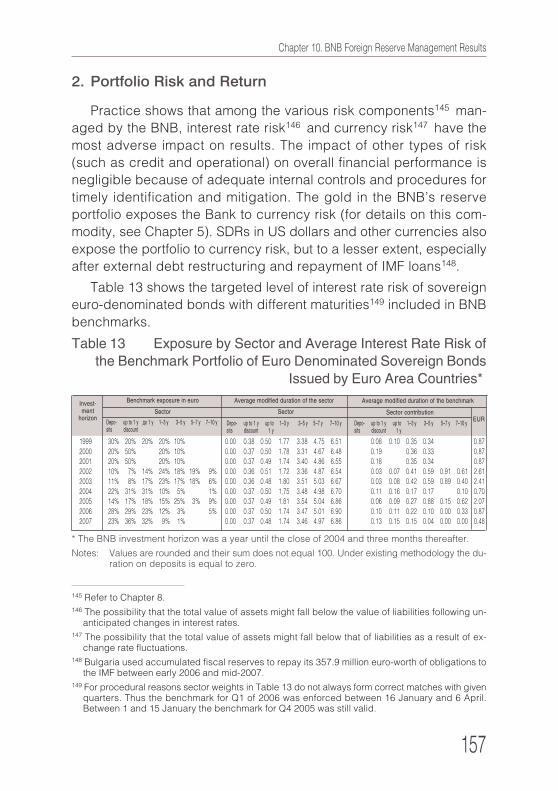
Chapter 10. BNB Foreign Reserve Management Results
157
2. Portfolio Risk and Return
Practice shows that among the various risk components145 man-
aged by the BNB, interest rate risk146 and currency risk147 have the
most adverse impact on results. The impact of other types of risk
(such as credit and operational) on overall financial performance is
negligible because of adequate internal controls and procedures for
timely identification and mitigation. The gold in the BNB’s reserve
portfolio exposes the Bank to currency risk (for details on this com-
modity, see Chapter 5). SDRs in US dollars and other currencies also
expose the portfolio to currency risk, but to a lesser extent, especially
after external debt restructuring and repayment of IMF loans148.
Table 13 shows the targeted level of interest rate risk of sovereign
euro-denominated bonds with different maturities149 included in BNB
benchmarks.
145 Refer to Chapter 8.146 The possibility that the total value of assets might fall below the value of liabilities following un-
anticipated changes in interest rates.147 The possibility that the total value of assets might fall below that of liabilities as a result of ex-
change rate fluctuations.148 Bulgaria used accumulated fiscal reserves to repay its 357.9 million euro-worth of obligations to
the IMF between early 2006 and mid-2007.149 For procedural reasons sector weights in Table 13 do not always form correct matches with given
quarters. Thus the benchmark for Q1 of 2006 was enforced between 16 January and 6 April.Between 1 and 15 January the benchmark for Q4 2005 was still valid.
Table 13 Exposure by Sector and Average Interest Rate Risk ofthe Benchmark Portfolio of Euro Denominated Sovereign Bonds
Issued by Euro Area Countries*
1999 30% 20% 20% 20% 10% 0.00 0.38 0.50 1.77 3.38 4.75 6.51 0.08 0.10 0.35 0.34 0.87
2000 20% 50% 20% 10% 0.00 0.37 0.50 1.78 3.31 4.67 6.48 0.19 0.36 0.33 0.87
2001 20% 50% 20% 10% 0.00 0.37 0.49 1.74 3.40 4.86 6.55 0.18 0.35 0.34 0.87
2002 10% 7% 14% 24% 18% 19% 9% 0.00 0.36 0.51 1.72 3.36 4.87 6.54 0.03 0.07 0.41 0.59 0.91 0.61 2.61
2003 11% 8% 17% 23% 17% 18% 6% 0.00 0.36 0.48 1.80 3.51 5.03 6.67 0.03 0.08 0.42 0.59 0.89 0.40 2.41
2004 22% 31% 31% 10% 5% 1% 0.00 0.37 0.50 1.75 3.48 4.98 6.70 0.11 0.16 0.17 0.17 0.10 0.70
2005 14% 17% 18% 15% 25% 3% 9% 0.00 0.37 0.49 1.81 3.54 5.04 6.86 0.06 0.09 0.27 0.88 0.15 0.62 2.07
2006 28% 29% 23% 12% 3% 5% 0.00 0.37 0.50 1.74 3.47 5.01 6.90 0.10 0.11 0.22 0.10 0.00 0.33 0.87
2007 23% 36% 32% 9% 1% 0.00 0.37 0.48 1.74 3.46 4.97 6.86 0.13 0.15 0.15 0.04 0.00 0.00 0.48
Depo- up to 1 y до 1 y 1–3 y 3–5 y 5–7 y 7–10 ysits discount
Depo- up to 1 y up to 1–3 y 3–5 y 5–7 y 7–10 ysits discount 1 y
Depo- up to 1 y up to 1–3 y 3–5 y 5–7 y 7–10 ysits discount 1 y
EURSector contributionSectorSector
Benchmark exposure in euro Average modified duration of the sector Average modified duration of the benchmarkInvest-ment
horizon
* The BNB investment horizon was a year until the close of 2004 and three months thereafter.
Notes: Values are rounded and their sum does not equal 100. Under existing methodology the du-ration on deposits is equal to zero.
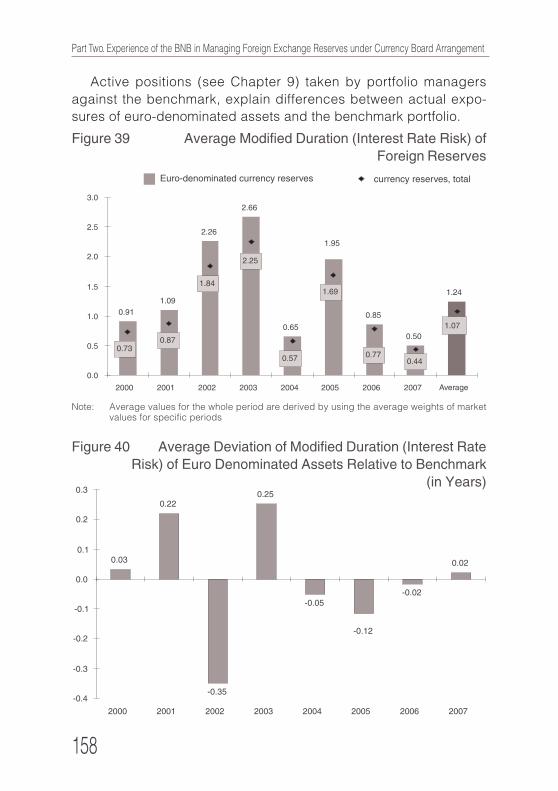
158
Part Two. Experience of the BNB in Managing Foreign Exchange Reserves under Currency Board Arrangement
Figure 40 Average Deviation of Modified Duration (Interest RateRisk) of Euro Denominated Assets Relative to Benchmark
(in Years)
Active positions (see Chapter 9) taken by portfolio managers
against the benchmark, explain differences between actual expo-
sures of euro-denominated assets and the benchmark portfolio.
Figure 39 Average Modified Duration (Interest Rate Risk) ofForeign Reserves
Note: Average values for the whole period are derived by using the average weights of marketvalues for specific periods
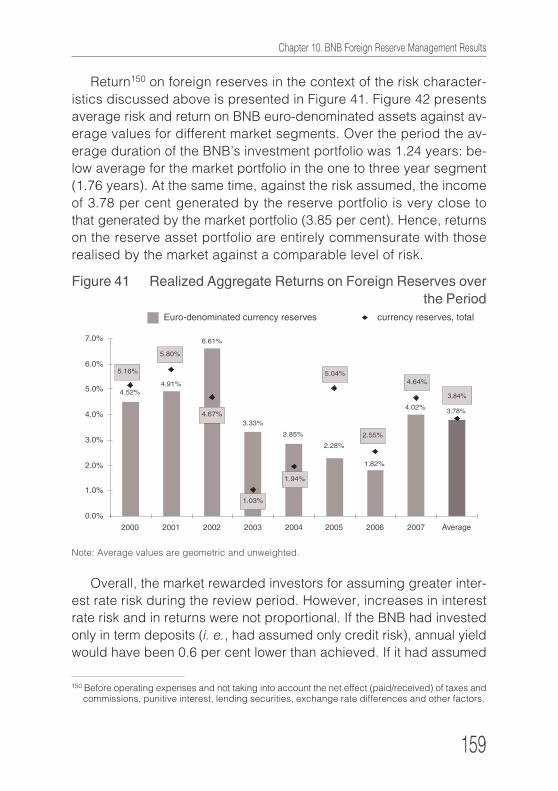
Chapter 10. BNB Foreign Reserve Management Results
159
Return150 on foreign reserves in the context of the risk character-
istics discussed above is presented in Figure 41. Figure 42 presents
average risk and return on BNB euro-denominated assets against av-
erage values for different market segments. Over the period the av-
erage duration of the BNB’s investment portfolio was 1.24 years: be-
low average for the market portfolio in the one to three year segment
(1.76 years). At the same time, against the risk assumed, the income
of 3.78 per cent generated by the reserve portfolio is very close to
that generated by the market portfolio (3.85 per cent). Hence, returns
on the reserve asset portfolio are entirely commensurate with those
realised by the market against a comparable level of risk.
Figure 41 Realized Aggregate Returns on Foreign Reserves overthe Period
Note: Average values are geometric and unweighted.
Overall, the market rewarded investors for assuming greater inter-
est rate risk during the review period. However, increases in interest
rate risk and in returns were not proportional. If the BNB had invested
only in term deposits (i. e., had assumed only credit risk), annual yield
would have been 0.6 per cent lower than achieved. If it had assumed
150 Before operating expenses and not taking into account the net effect (paid/received) of taxes andcommissions, punitive interest, lending securities, exchange rate differences and other factors.
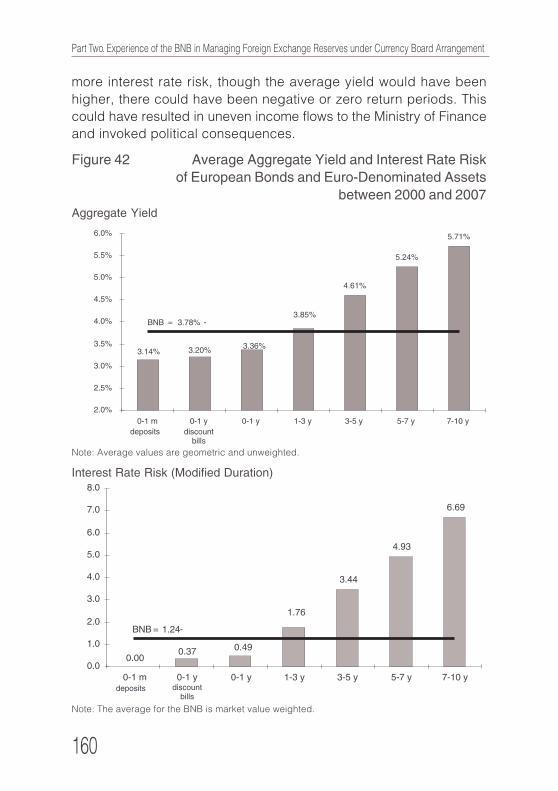
160
Part Two. Experience of the BNB in Managing Foreign Exchange Reserves under Currency Board Arrangement
Figure 42 Average Aggregate Yield and Interest Rate Riskof European Bonds and Euro-Denominated Assets
between 2000 and 2007Aggregate Yield
Note: Average values are geometric and unweighted.
Interest Rate Risk (Modified Duration)
Note: The average for the BNB is market value weighted.
more interest rate risk, though the average yield would have been
higher, there could have been negative or zero return periods. This
could have resulted in uneven income flows to the Ministry of Finance
and invoked political consequences.
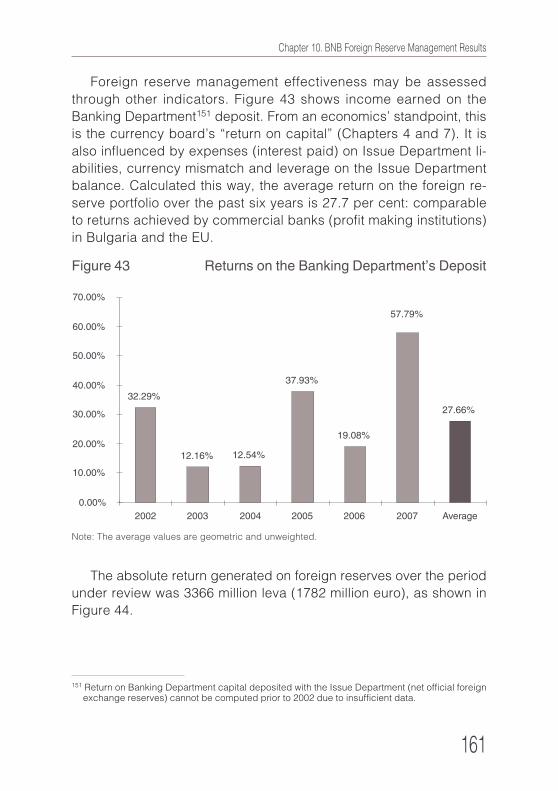
Chapter 10. BNB Foreign Reserve Management Results
161
Foreign reserve management effectiveness may be assessed
through other indicators. Figure 43 shows income earned on the
Banking Department151 deposit. From an economics’ standpoint, this
is the currency board’s “return on capital” (Chapters 4 and 7). It is
also influenced by expenses (interest paid) on Issue Department li-
abilities, currency mismatch and leverage on the Issue Department
balance. Calculated this way, the average return on the foreign re-
serve portfolio over the past six years is 27.7 per cent: comparable
to returns achieved by commercial banks (profit making institutions)
in Bulgaria and the EU.
Figure 43 Returns on the Banking Department’s Deposit
The absolute return generated on foreign reserves over the period
under review was 3366 million leva (1782 million euro), as shown in
Figure 44.
Note: The average values are geometric and unweighted.
151 Return on Banking Department capital deposited with the Issue Department (net official foreignexchange reserves) cannot be computed prior to 2002 due to insufficient data.
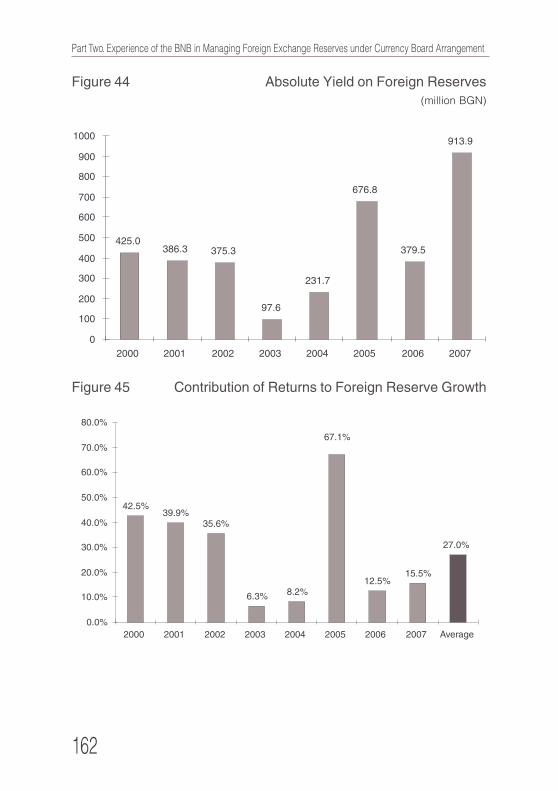
162
Part Two. Experience of the BNB in Managing Foreign Exchange Reserves under Currency Board Arrangement
Figure 44 Absolute Yield on Foreign Reserves(million BGN)
Figure 45 Contribution of Returns to Foreign Reserve Growth
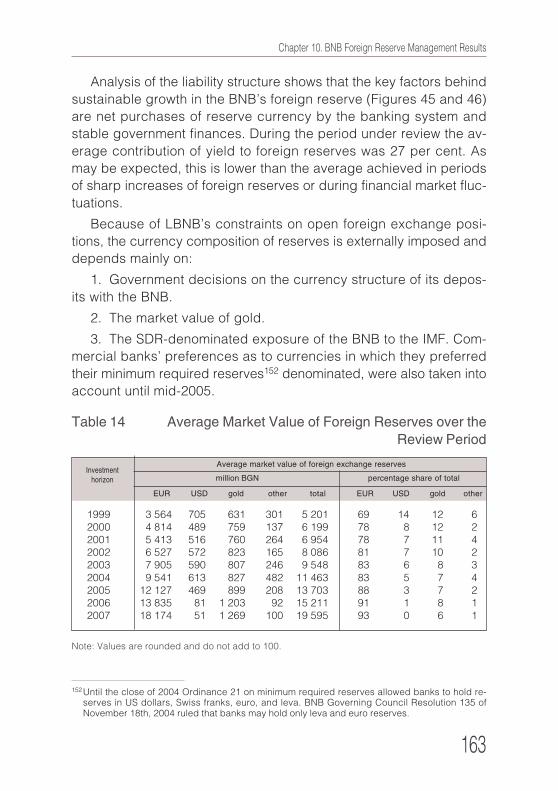
Chapter 10. BNB Foreign Reserve Management Results
163
Analysis of the liability structure shows that the key factors behind
sustainable growth in the BNB’s foreign reserve (Figures 45 and 46)
are net purchases of reserve currency by the banking system and
stable government finances. During the period under review the av-
erage contribution of yield to foreign reserves was 27 per cent. As
may be expected, this is lower than the average achieved in periods
of sharp increases of foreign reserves or during financial market fluc-
tuations.
Because of LBNB’s constraints on open foreign exchange posi-
tions, the currency composition of reserves is externally imposed and
depends mainly on:
1. Government decisions on the currency structure of its depos-
its with the BNB.
2. The market value of gold.
3. The SDR-denominated exposure of the BNB to the IMF. Com-
mercial banks’ preferences as to currencies in which they preferred
their minimum required reserves152 denominated, were also taken into
account until mid-2005.
Table 14 Average Market Value of Foreign Reserves over theReview Period
Note: Values are rounded and do not add to 100.
1999 3 564 705 631 301 5 201 69 14 12 62000 4 814 489 759 137 6 199 78 8 12 22001 5 413 516 760 264 6 954 78 7 11 42002 6 527 572 823 165 8 086 81 7 10 22003 7 905 590 807 246 9 548 83 6 8 32004 9 541 613 827 482 11 463 83 5 7 42005 12 127 469 899 208 13 703 88 3 7 22006 13 835 81 1 203 92 15 211 91 1 8 12007 18 174 51 1 269 100 19 595 93 0 6 1
Investment
horizon
Average market value of foreign exchange reserves
million BGN percentage share of total
EUR USD gold other total EUR USD gold other
152 Until the close of 2004 Ordinance 21 on minimum required reserves allowed banks to hold re-serves in US dollars, Swiss franks, euro, and leva. BNB Governing Council Resolution 135 ofNovember 18th, 2004 ruled that banks may hold only leva and euro reserves.
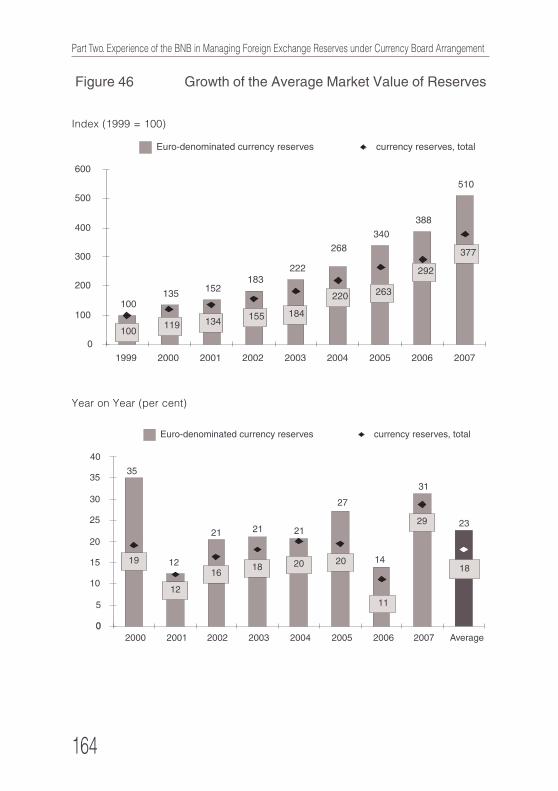
164
Part Two. Experience of the BNB in Managing Foreign Exchange Reserves under Currency Board Arrangement
Figure 46 Growth of the Average Market Value of Reserves
Index (1999 = 100)
Year on Year (per cent)
Chapter 11. Accountability
165
Chapter ElevenAccountability
Reporting, control, and communication are important aspects of
investing. Reporting is part of each stage. It enables operational
analysis and inspection and keeps the Deputy Governor in Charge of
the Issue Department abreast of developments. Reports about risk
assumed and results obtained go to the National Assembly and the
public semiannually. As shown in Figure 8, reporting and control
close the loop of foreign reserve management. They are a basic
means of limiting operational risk in foreign reserve management and
an important means of retaining and boosting public confidence in
the BNB and the monetary and foreign exchange regime.
1. Reporting
Reports of diverse scope and frequency, intended for different
readerships, emerge at each stage of the investment process shown
in Figure 8. Figure 47 below represents them diagrammatically. By
frequency, they are immediate, daily, weekly, quarterly, semiannual,
and annual. Except immediate reports, each covers a set level of
detail, yet contains not less than: 1. currency, maturity structure by
instruments in the reserve overall or in individual portfolios; 2.
counterparty exposure; 3. portfolio and benchmark risk exposure and
return; 4. analyses of markets, constraints and management effective-
ness.
Immediate reports occupy the lowest, or operational, level and
comprise technical data on each transaction’s risk and return, plus
changes to portfolio characteristics. These reports allow ongoing
analysis of legal and operational constraints as regards currencies,
instruments and counterparties, and of the current market environ-
ment, and thus offer the basis of continuous control over constraints
by the head of the Investment Department and the Treasury and Risk
Control and Analysis directors.
166
Part Two. Experience of the BNB in Managing Foreign Exchange Reserves under Currency Board Arrangement
Daily reports are also at the operational level. Their purpose is to
enable control by the BNB’s senior operational executives. They
cover both statutory and operational constraints and tactical invest-
ment decisions.
These two report types cover limited scopes of information and are
mainly for the Bank’s operational management. Under internal BNB
rules, Governing Council and Investment Committee Members also
have access to them.
Unlike immediate and daily reports, weekly and quarterly reports
carry information on each of the four areas listed above. They are
more general, however, and daily information or details of individual
deals needs to amplify them for analysis purposes.
The BNB Semiannual and Annual Reports contain special analy-
ses of foreign reserve management processes and outcomes. The
Governing Council adopts them before formal tabling for deliberation
by the National Assembly. The public has access to them and they
are a statutory channel of communication between Bank, National
Assembly, and public, offering public control over the BNB and pro-
moting public confidence in the Bank and the monetary and foreign
exchange regime.
The above makes it clear that different reports have different
readerships. Portfolio managers use mostly immediate and daily re-
ports because they provide technical detail on portfolio risk charac-
teristics, yield, and incipient changes on a deal-by-deal basis. Risk
managers also generate and use immediate and daily reports on: 1.
individual asset class exposures; 2. credit risk limits; and 3. individual
counterparties. This, along with Analysis Division studies and assess-
ments on the state and trends of international financial markets, helps
the decision process at portfolio manager teams.
Senior and middle operational executives (the Governor, the
Deputy Governor in Charge of the Issue Department, the Treasury
Director and the Director of Risk Analysis and Control) use weekly
reports. They comprise details of, inter alia, portfolio risk and yield,
important accounting information, information on larger cashflows
over the past day, data on operational errors, omissions, and excur-
sions beyond limits, and document processing and settlement issues.
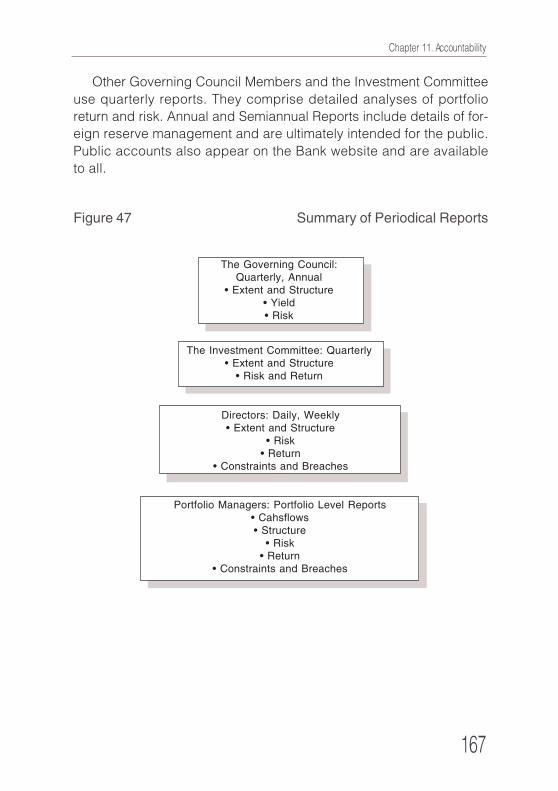
Chapter 11. Accountability
167
Other Governing Council Members and the Investment Committee
use quarterly reports. They comprise detailed analyses of portfolio
return and risk. Annual and Semiannual Reports include details of for-
eign reserve management and are ultimately intended for the public.
Public accounts also appear on the Bank website and are available
to all.
Figure 47 Summary of Periodical Reports
The Governing Council:Quarterly, Annual
• Extent and Structure• Yield• Risk
The Investment Committee: Quarterly• Extent and Structure
• Risk and Return
Directors: Daily, Weekly• Extent and Structure
• Risk• Return
• Constraints and Breaches
Portfolio Managers: Portfolio Level Reports• Cahsflows• Structure
• Risk• Return
• Constraints and Breaches
168
Part Two. Experience of the BNB in Managing Foreign Exchange Reserves under Currency Board Arrangement
2. Control
Control over foreign reserve management at the BNB addresses
several matters: investment constraints, documentation and settle-
ment, and internal rules and procedures. The National Audit Office
and the National Assembly Budgetary and Finance Committee exer-
cise their own control over legal matters.
As the reporting pattern described above suggests, continuous
control over investment constraints set by law or during strategic
asset allocation is a basic part of the process of investing the BNB’s
foreign reserves. Investment constraints shape the frame of tactical
asset allocation and portfolio management within which operational
management acts. The avoidance of investment limit breaches in tac-
tical asset allocation ensures the greatest degree of attainment of
investment objectives within set risk tolerance and investment hori-
zons.
Control over investment limits is the direct duty of the Risk Control
Division, the Director of Risk Analysis and Control and the Deputy
Governor in Charge of the Issue Department. Upon each transaction,
officers check statutory credit and interest exposures and exposures
determined at strategic asset allocation, in addition to monitoring
them for each portfolio and for the Bank’s general foreign reserve
portfolio. A dedicated information module monitors Bank exposure to
each counterparty. There is also a mechanism for direct control over
constraints which affect BNB securities investment.
The internal document Investment Guidelines and Benchmarks in
Gross International Foreign Exchange Reserve Management is a de-
tailed and systematic description of investment constraints. Issued
since 1999, it is updated after each amendment to the LBNB or to
Bank investment objectives, changes in strategic asset allocation,
and inputs from the Risk Control and Analysis Directorate. The docu-
ment contains comprehensive schedules of issuers of licensed secu-
rities, commercial securities, Eurobonds, and schedules of BNB
counterparties in securities and deposits. Chapter 7 has a summary
of the major investment constraints in BNB foreign reserve manage-
ment and the types of risk to which they relate.
Chapter 11. Accountability
169
As regards documentation and settlement, long established Bank
practice entails the checking of foreign reserve transactions at sev-
eral levels, with a balance struck between security, time, and opera-
tional spending. First level checks take place immediately after com-
pletion of each transaction and are by the Investment Department
Manager or his/her Deputies. The basic parameters of all primary
transaction documents are checked immediately afterwards by em-
ployees of the Liquidity and Risk Control Divisions. The former tally
documents against relevant standards and settlement regulations,
while the latter check them against legal and internal risk limits. This
is prior to SWIFT settlement notices. The final check (payment authori-
sation) is at the Risk Control Division. Bearing in mind the hierarchi-
cal structure of these offices, the process guarantees complete sepa-
ration between entering into transactions and settling the bill.
To limit legal risk in document processing and settlement, the BNB
adheres strictly to accepted international standards and conventions
on transaction conduct. In individual cases the Bank may agree with
counterparties in advance on whether deals will be under Bulgarian,
US or EU/Swiss financial law. The BNB works largely with US and
European issuers who have credit ratings which meet or exceed
statutory minima. If new instruments are introduced or new issues are
launched, the BNB may facilitate document processing and settle-
ment by instructing reputable international law practices who service
world markets to represent it under framework representation con-
tracts.153
It is important for control to be sequenced properly and conducted
continuously across all stages of the investment process, with clear
divisions of responsibility. The BNB manual described above guaran-
tees this. It has detailed descriptions of each stage of investing, the
responsibilities of individual employees, the constraints imposed, and
control forms and organisation, all with a view to managing the di-
verse types of risk. The exceptional degree of liquidity which the law
requires of the BNB foreign reserve is best attained by following pro-
153 A legal consultant is also employed at the office of the Deputy Governor in Charge of the IssueDepartment. In addition, since 2004 the Investment Committee has co-opted BNB executives withsenior qualifications in international law.
170
Part Two. Experience of the BNB in Managing Foreign Exchange Reserves under Currency Board Arrangement
cedures154. They provide rule-based foreign reserve management
which is accountable to the Governing Council, internal and external
BNB auditors, the Republic of Bulgaria Audit Office, international fi-
nancial institutions, and the public.
A basic tenet in the manual is to ensure thorough compatibility
between procedures at different levels. Procedures stemming directly
from the LBNB have the greatest precedence. Next come procedures
set by the Governing Council or the Deputy Governor in Charge of the
Issue Department in formulating investment objectives and strategic
asset allocation. Thus, procedures are hierarchical and each Bank
employee who deals with the foreign reserve is assured of working in
an environment free of ambiguities.
3. Communication
As stated above, BNB Annual and Semiannual Reports are the
basic means of communicating the process of investing the foreign
reserve to the public. Publishing them is a statutory duty of the BNB,
and their contents match or improve the financial understanding of
the public. This means that ordinary people receive regular advice on
foreign reserve management coached in accessible language which
enables them to exercise their sovereign right of controlling Bank
performance subject to currency board rules.
The Governing Council has set the structure, form, and contents
of those parts of Annual and Semiannual Reports which deal with for-
eign reserve management by reference to recommended interna-
tional practice for similar documents. Most generally, these parts
describe the current extent of the foreign reserve, changes in it, risk
and yield characteristics of individual portfolios, results of the invest-
ment process, and analyses of its efficiency to internationally adopted
criteria and indicators. BNB Reports state the Governing Council’s
standpoints on the issues above and are tabled before the National
154 The Investment Constraints and Benchmarks in Gross International Foreign Exchange ReserveManagement manual cannot be published for security reasons lest potential international finan-cial market developments lead to procedures in it being subverted in speculative attacks on thelev, on national monetary policy, or on the foreign exchange regime. This is entirely in line with rec-ommended international investment practice and does not indicate any lack of transparency.
Chapter 11. Accountability
171
Assembly for deliberation and adoption. They are published on the
BNB website within the statutory time span of 120 days from the end
of each accounting period. This enables public debate on BNB
policy, while international comparability of results helps BNB integra-
tion into international financial bodies and the ESCB.
Another statutory form of external communication is the weekly
publication of the Issue Department balance sheet which contains
specific information on foreign reserve liquidity and the structure of
monetary obligations covered by it. To support and boost confidence
in the currency board, this weekly balance is posted on the BNB
website and national newspapers each Monday.
The third form of external communication involves exchanging in-
formation with BNB counterparties. BNB policy on the matter is set out
in an internal document which details the types of information the
Bank discloses and requires to and from counterparties, and at what
frequencies. Daily communication with counterparties is via the Risk
Control Division.
Formal internal communication on foreign reserve management is
through immediate, daily, weekly, monthly, and quarterly reports, and
through Investment Committee opinions. That Committee sets the
form and contents of these opinions subject to approval by the
Deputy Governor in Charge of the Issue Department.
Weekly, monthly, and quarterly reports circulate to Governing
Council and Investment Committee Members. Further to these re-
ports, over recent years the Deputy Governor in Charge of the Issue
Department has presented personal quarterly analyses of foreign
reserve management to the Council for advice and deliberation.
These analyses usually publish in the month following calendar quar-
ter months.
Since 2004 the Deputy Governor in Charge of the Issue Depart-
ment has, prior to each calendar quarter, presented to the Governing
Council for deliberation a personal report on expected international
financial market developments, and Investment Committee recom-
mendations as to benchmarks and portfolio horizons. This aims to
improve Governing Council awareness of the Deputy’s operational
172
Part Two. Experience of the BNB in Managing Foreign Exchange Reserves under Currency Board Arrangement
decision making under LBNB Article 12, paragraph 2 and Article 20,
paragraph 1.
Investment Committee deliberations of quarterly reports on foreign
reserve management and Committee recommendations on bench-
marks and portfolio horizons are important stages in internal commu-
nications. The Risk Control and Analysis Directorate develops and ta-
bles opinions, with the Committee seeking consensus in forwarding
recommendations to the Deputy Governor. Discussion is also an im-
portant part of the training of BNB employees whose duties are not di-
rectly linked with reserve management.
Since information on the foreign reserve is publicly and market
sensitive, the Bank considers that it ought not to be aired at irregular
and informal fora such as press conferences, media interviews or
articles to avoid unconscientious, hostile, or incompetent interpreta-
tions. Only the Governor or the Deputy Governor in Charge of the
Issue Department may release such information. Where third parties
may handle it, they are expected to cite precise sources. For the
purposes of communication, the BNB manual specified degrees of
information classification and access rules by individual employee.
Matters not covered there are subject to the general ethics of BNB
staff.
Chapter 12. IT Aspects of BNB Foreign Reserve Management
173
Chapter 12IT Aspects of BNB Foreign Reserve Management
Effective foreign reserve management to recommended interna-
tional theory and practice is impossible in today’s international finan-
cial markets without modern information systems. In 2005 the Bulgar-
ian National Bank had the opportunity of choosing from three informa-
tion system alternatives: one developed in-house, one off-the-shelf
from a reputable supplier, or one combining elements of both. Each
option had pros and cons.
A system developed in-house would best match the Bank’s spe-
cific needs. Development would, however, be prolonged since soft-
ware writing is not a Bank core strength and there could be a paucity
of human resources for such a complex task. An off-the-shelf system
would save time and perform professionally, yet could fail to address
the Bank’s specific requirements. In addition, it would be expensive
and its future development might not match the needs of any particu-
lar bank. An external main system combined with custom modules
and subsystems developed in-house could be the most functional
compromise, yet it carried the risk of diluted integrity. The BNB tra-
versed a long road in search of an optimum IT platform solution for its
foreign reserve.
1. An In-House Developed Information System
After careful study of the pros and cons of different approaches,
in 1999 the BNB decided in principle to buy an off-the-shelf informa-
tion system for its reserve management from a supplier of good inter-
national standing. Shortages of trained personnel and developed in-
vestment routines soon after currency board launch presented diffi-
culties, however, especially in drawing up precise specifications. This
stayed the Bank from proceeding quickly with the purchase. Instead,
in 1999 a small team of three software specialists and risk managers
174
Part Two. Experience of the BNB in Managing Foreign Exchange Reserves under Currency Board Arrangement
came together to design an in-house system.
The team’s immediate goal was to describe the structure of proc-
esses and information flows and design a system capable of basic
risk and performance measuring and reporting. Another important
objective was to analyse and define the information needs of differ-
ent BNB units involved in managing foreign reserves. The ultimate ob-
jective was to ensure effective risk management in line with the 1997
Law on the BNB.
Development of the in-house system continued until late 2005. By
then, its functionality covered practically all basic information needs
of units involved in managing foreign reserves. Meanwhile, through
participating in the World Bank Treasury’s RAMP training programme,
the BNB accumulated considerable knowledge of foreign reserve
management theory and practice, as well as of relevant IT systems
and their capacity for managing risk in real time. In 2005 the BNB
obtained European System of Central Banks observer status, gaining
opportunities to increase knowledge and experience of reserve man-
agement IT platforms used by EU central banks, including access to
qualified expert opinions on such platforms.
2. The Trema Information System
Once it was satisfied that the Bank has sufficient reserve manage-
ment knowledge, a developed investment policy and procedures,
and experienced staff capable of briefing potential suppliers, in 2005
the Governing Council decided to proceed with the selection of an
off-the-shelf IT system. The motives for the decision highlighted the
expected benefits of the external versus the in-house system:
• Ability to measure risk exposures and control compliance with
risk limits in real time;
• Ability to offer Straight-Through Processing (STP);
• Ability to use a wide range of new financial instruments whose
inclusion into the existing system would be prolonged;
• Speed and reliability;
• Elimination of reputation and operational risks which may arise
Chapter 12. IT Aspects of BNB Foreign Reserve Management
175
if the developers of the in-house system left the Bank.
Selection of the system involved two stages involving a public ten-
der announcement in 2005 and detailed selection. First, the BNB
studied information systems used by other EU central banks, identi-
fying three systems suited to the needs of foreign reserve manage-
ment under a currency board and to Eurosystem requirements. Sec-
ond, vendors were invited to tender with details on functionality, tech-
nical features, user support, and price. Responses were evaluated on
the basis of pre-announced criteria by an expert committee repre-
senting all BNB units involved in foreign reserves management. The
final evaluation was presented with an opinion to the BNB Governing
Council for decision.
The Finance KIT system by Trema (Europe) of Sweden155 was
deemed best suited to the BNB’s functional and technical require-
ments, both as regards the currency board and future Eurosystem
participation. The system was most widely used by Eurosystem cen-
tral banks, including the European Central Bank. It took ten months
from early 2006 for the system to go live. The preparatory period in-
volved parallel use with the existing system from early 2007.
The selection of an information system used by many European
System of Central Banks (ESCB) members offers opportunities for
further cooperation and synergy. By joining forces these banks can
attain a better relationship with the vendor, improving financial and
other conditions for future versions of the system.
Finance KIT is an integrated system for financial institutions. It in-
cludes various portfolio management modules and supports a wide
range of financial instruments with processing and settlement, risk
management, and accounting modules. Individual modules may be
purchased and incorporated separately to specific user require-
ments. The solution purchased by the BNB has a user configuration
specific to the Bank. It reflects experience gained by a number of
central banks and is consistent with the principles of foreign reserve
management.
155 When the US company Wall Street Systems took over Trema in July 2006, all elements of the Sup-port and Service Agreements were transferred without any consequences for the Bank.
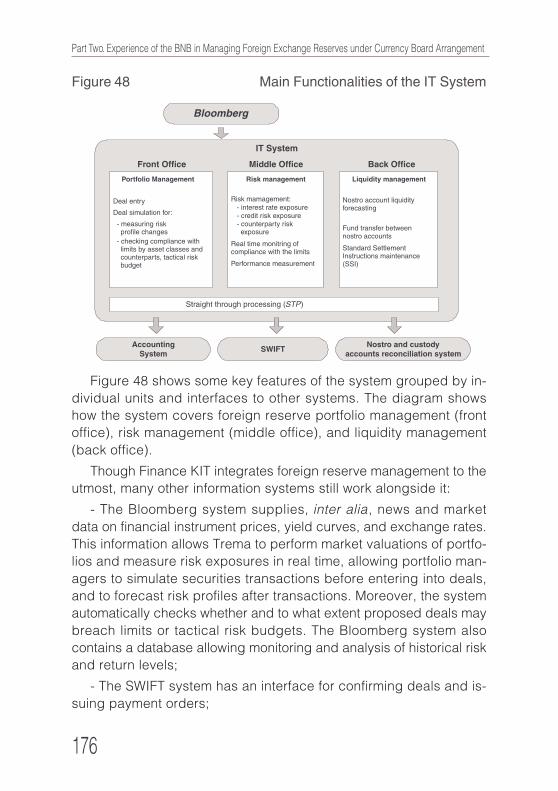
176
Part Two. Experience of the BNB in Managing Foreign Exchange Reserves under Currency Board Arrangement
Figure 48 shows some key features of the system grouped by in-
dividual units and interfaces to other systems. The diagram shows
how the system covers foreign reserve portfolio management (front
office), risk management (middle office), and liquidity management
(back office).
Though Finance KIT integrates foreign reserve management to the
utmost, many other information systems still work alongside it:
- The Bloomberg system supplies, inter alia, news and market
data on financial instrument prices, yield curves, and exchange rates.
This information allows Trema to perform market valuations of portfo-
lios and measure risk exposures in real time, allowing portfolio man-
agers to simulate securities transactions before entering into deals,
and to forecast risk profiles after transactions. Moreover, the system
automatically checks whether and to what extent proposed deals may
breach limits or tactical risk budgets. The Bloomberg system also
contains a database allowing monitoring and analysis of historical risk
and return levels;
- The SWIFT system has an interface for confirming deals and is-
suing payment orders;
Figure 48 Main Functionalities of the IT System
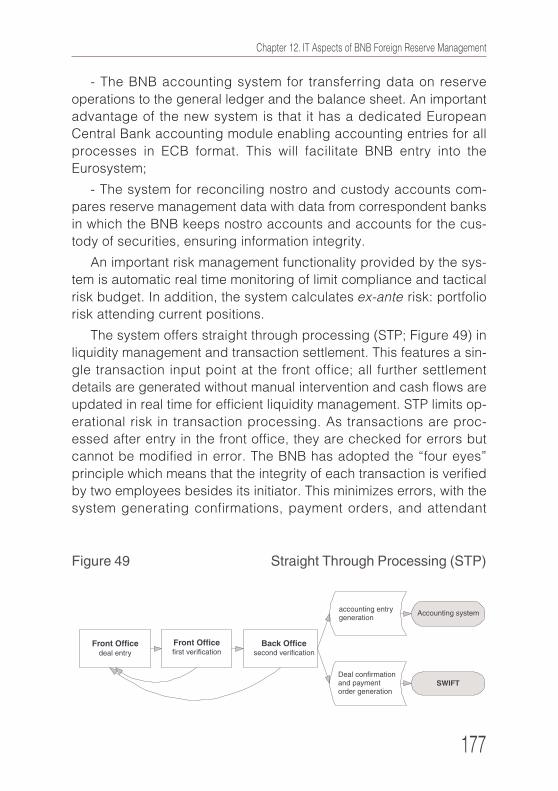
Chapter 12. IT Aspects of BNB Foreign Reserve Management
177
Figure 49 Straight Through Processing (STP)
- The BNB accounting system for transferring data on reserve
operations to the general ledger and the balance sheet. An important
advantage of the new system is that it has a dedicated European
Central Bank accounting module enabling accounting entries for all
processes in ECB format. This will facilitate BNB entry into the
Eurosystem;
- The system for reconciling nostro and custody accounts com-
pares reserve management data with data from correspondent banks
in which the BNB keeps nostro accounts and accounts for the cus-
tody of securities, ensuring information integrity.
An important risk management functionality provided by the sys-
tem is automatic real time monitoring of limit compliance and tactical
risk budget. In addition, the system calculates ex-ante risk: portfolio
risk attending current positions.
The system offers straight through processing (STP; Figure 49) in
liquidity management and transaction settlement. This features a sin-
gle transaction input point at the front office; all further settlement
details are generated without manual intervention and cash flows are
updated in real time for efficient liquidity management. STP limits op-
erational risk in transaction processing. As transactions are proc-
essed after entry in the front office, they are checked for errors but
cannot be modified in error. The BNB has adopted the “four eyes”
principle which means that the integrity of each transaction is verified
by two employees besides its initiator. This minimizes errors, with the
system generating confirmations, payment orders, and attendant

178
Part Two. Experience of the BNB in Managing Foreign Exchange Reserves under Currency Board Arrangement
accounting entries automatically. Where an error may be found by the
two controllers, the system returns the transaction to its initial phase
for correction.
Chapter 13. Foreign Reserve Management under a Currency Board amid Integration into ...
179
Chapter 13Foreign Reserve Management under a Currency
Board amid Integration into the European System of
Central Banks
This chapter aims to present the process of managing foreign re-
serves in the Eurosystem156. We elaborate on the tasks of central
banks in that system and on the integration objectives of the Bulgar-
ian National Bank. The starting point for the analysis is the require-
ment for the BNB to work consistently towards full membership in the
Eurosystem: one of the main duties set out in Maastricht Treaty Chap-
ter 122 on the single European currency.
1. Foreign Reserve Management in the Eurosystem
The foreign reserves of the Eurosystem comprise those of the ECB
and of the central banks in that system. At the close of 2007 they
came to 347.4 billion euro, including 138.2 billion in foreign reserves
and 209.2 billion euro in gold, Special Drawing Rights and reserve
positions at the IMF.
ECB portfolio managers manage three portfolios with strictly de-
fined (and different) investment objectives and risk tolerances. At the
end of 2007 the foreign reserve portfolio had a market value of around
42.8 billion euro of which 32.1 billion euro were in USD and JPY and
10.7 billion euro were in gold, Special Drawing Rights and reserve
positions at the IMF. The portfolio of the ECB’s own funds had a mar-
ket value of some 9.3 billion euro, and the pension fund portfolio was
worth 161.2 million euro157.
156 The Eurosystem comprises the European Central Bank and the national central banks of euro areamember states.
157 The ECB pension fund portfolio comprises pension payments by ECB employees. The investmentgoal of that portfolio is to maximize the market value of assets and minimize the risk of liabilitieson the balance sheet exceeding assets. The portfolio is managed by external managers selectedby the ECB through procurement procedures.

180
Part Two. Experience of the BNB in Managing Foreign Exchange Reserves under Currency Board Arrangement
Figure 50 Structure of the foreign reserves of the Eurosystem
Figure 51 ECB portfolio management
Chapter 13. Foreign Reserve Management under a Currency Board amid Integration into ...
181
The three portfolios of ECB reserves are managed in different
ways and by different portfolio management teams, subject to several
common objectives:
• The primary objective is to achieve the highest possible return
on managed assets, taking into account the specific objectives
and functions of the separate portfolios.
• Strictly defined rules have the object of avoiding the exercise
of influence on financial markets. ECB portfolio managers are
allowed to trade only highly liquid fixed income instruments
whose prices cannot be affected by single transactions.
• A strict code of professional ethics defined by an ECB code of
conduct and professional rules of confidentiality have the ob-
ject of preventing trading based on inside information.
• A meticulous division or “Great Wall” separates portfolio man-
agers from other Bank personnel, halting access by portfolio
mangers to information from other Bank divisions to prevent
conflicts of interest.
Risk management and accounting processing of ECB transactions
are centralized. The object is to monitor precisely what market risks
are assumed by ECB portfolio managers and by national central bank
managers acting on behalf of the ECB. Risk management rules in-
clude strict fulfilment of predefined risk limits, applying the mark-to-
market approach of profit and loss measurement, and assessing
performance against a model-based strategic benchmark. To ex-
clude conflicts of interest, critical risk management items such as
strategic benchmark approval and profitability or loss indicators are
reported directly to the ECB Governing Council.
The ECB has developed distinct approaches to managing the dif-
ferent portfolios. The foreign reserve portfolio was created by the
transfer of foreign reserve assets by national central banks to the
ECB. Its market value reflects the market values of its constituent
assets and the outcomes of gold and foreign exchange operations.
The primary goal of the portfolio is to make available sufficient liquid
assets in currencies other than the euro for rapid interventions on
foreign exchange markets. To date the ECB has not intervened on
182
Part Two. Experience of the BNB in Managing Foreign Exchange Reserves under Currency Board Arrangement
these markets which fluctuate in line with market forces of supply and
demand. Foreign reserve portfolio managers follow three objectives
ranked by importance: liquidity; security; high return. They follow a
decentralized approach involving setting a strategic and a tactical
benchmark, and also involving licensing portfolio managers at na-
tional central banks to achieve higher returns than these benchmarks.
The goal of ECB reserve portfolio managers is to attain higher re-
turns than the strategic benchmark. This benchmark is structured to
a proposal from ECB Risk Management Department and approved by
the ECB Governing Council. The strategic benchmark reflects ECB
long term risk tolerance and the Bank’s view on the expected return
on the foreign assets in the portfolio. Portfolio managers propose the
assumption of tactical trading positions within predefined risk limits,
the goal being higher returns than the strategic benchmark. It is these
trading positions which comprise the aforementioned tactical bench-
mark, defined in its turn by the ECB Investment Committee and ap-
proved by the Executive Board. This tactical benchmark represents
ECB risk tolerance and short-to-medium term return expectations.
The mandate of portfolio managers at national central banks, who
are responsible for the operational management of foreign reserves,
is to pursue higher return than the tactical benchmark. It is these
managers who are the actual participants on financial markets on
behalf of the ECB and the settlement of all transactions is executed
at Eurosystem national central banks. The ECB foreign reserve man-
agement information system accumulates and analyses data from all
transactions at the Bank’s head office in Frankfurt.
A “specialization model” implemented in 2006 has increased ECB
foreign reserve management effectiveness. This allows each national
central bank to specialise in managing a single portfolio denominated
in USD or JPY. In January 2007 the Slovenian and Luxembourgeoise
central banks combined efforts by pooling their foreign reserve port-
folios. They were followed by the Maltese and Cypriot central banks
which joined the Eurosystem on 1 January 2008.
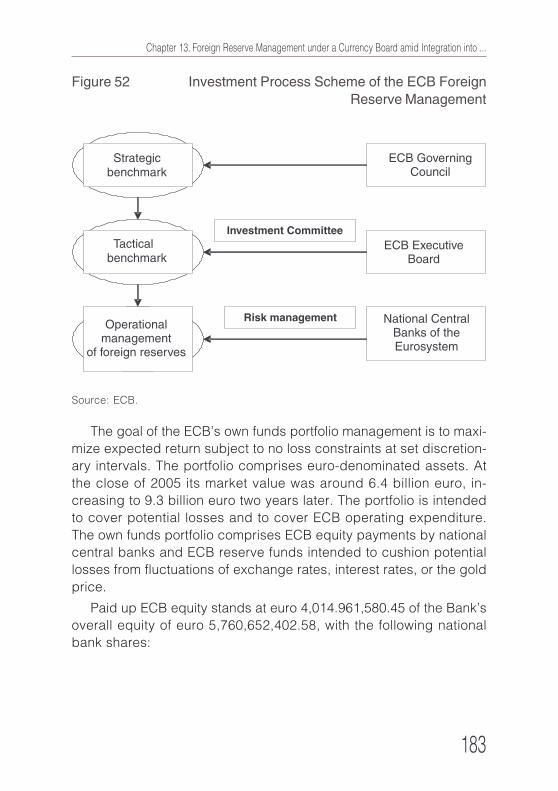
Chapter 13. Foreign Reserve Management under a Currency Board amid Integration into ...
183
Figure 52 Investment Process Scheme of the ECB ForeignReserve Management
Source: ECB.
The goal of the ECB’s own funds portfolio management is to maxi-
mize expected return subject to no loss constraints at set discretion-
ary intervals. The portfolio comprises euro-denominated assets. At
the close of 2005 its market value was around 6.4 billion euro, in-
creasing to 9.3 billion euro two years later. The portfolio is intended
to cover potential losses and to cover ECB operating expenditure.
The own funds portfolio comprises ECB equity payments by national
central banks and ECB reserve funds intended to cushion potential
losses from fluctuations of exchange rates, interest rates, or the gold
price.
Paid up ECB equity stands at euro 4,014.961,580.45 of the Bank’s
overall equity of euro 5,760,652,402.58, with the following national
bank shares:
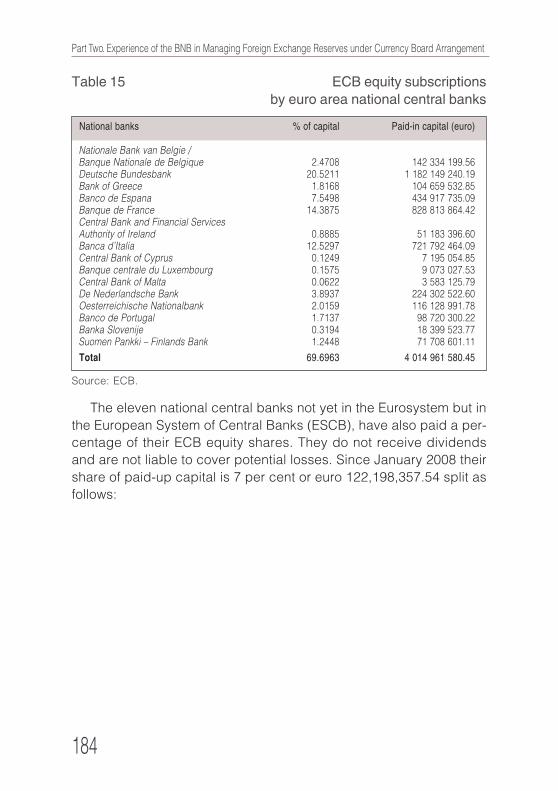
184
Part Two. Experience of the BNB in Managing Foreign Exchange Reserves under Currency Board Arrangement
The eleven national central banks not yet in the Eurosystem but in
the European System of Central Banks (ESCB), have also paid a per-
centage of their ECB equity shares. They do not receive dividends
and are not liable to cover potential losses. Since January 2008 their
share of paid-up capital is 7 per cent or euro 122,198,357.54 split as
follows:
Table 15 ECB equity subscriptionsby euro area national central banks
National banks % of capital Paid-in capital (euro)
Nationale Bank van Belgie /Banque Nationale de Belgique 2.4708 142 334 199.56Deutsche Bundesbank 20.5211 1 182 149 240.19Bank of Greece 1.8168 104 659 532.85Banco de Espana 7.5498 434 917 735.09Banque de France 14.3875 828 813 864.42Central Bank and Financial ServicesAuthority of Ireland 0.8885 51 183 396.60Banca d’Italia 12.5297 721 792 464.09Central Bank of Cyprus 0.1249 7 195 054.85Banque centrale du Luxembourg 0.1575 9 073 027.53Central Bank of Malta 0.0622 3 583 125.79De Nederlandsche Bank 3.8937 224 302 522.60Oesterreichische Nationalbank 2.0159 116 128 991.78Banco de Portugal 1.7137 98 720 300.22Banka Slovenije 0.3194 18 399 523.77Suomen Pankki – Finlands Bank 1.2448 71 708 601.11
Total 69.6963 4 014 961 580.45
Source: ECB.
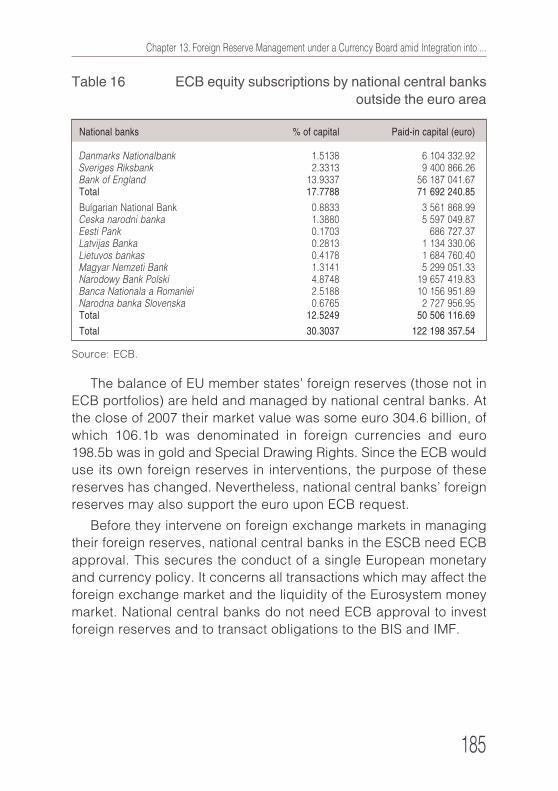
Chapter 13. Foreign Reserve Management under a Currency Board amid Integration into ...
185
The balance of EU member states’ foreign reserves (those not in
ECB portfolios) are held and managed by national central banks. At
the close of 2007 their market value was some euro 304.6 billion, of
which 106.1b was denominated in foreign currencies and euro
198.5b was in gold and Special Drawing Rights. Since the ECB would
use its own foreign reserves in interventions, the purpose of these
reserves has changed. Nevertheless, national central banks’ foreign
reserves may also support the euro upon ECB request.
Before they intervene on foreign exchange markets in managing
their foreign reserves, national central banks in the ESCB need ECB
approval. This secures the conduct of a single European monetary
and currency policy. It concerns all transactions which may affect the
foreign exchange market and the liquidity of the Eurosystem money
market. National central banks do not need ECB approval to invest
foreign reserves and to transact obligations to the BIS and IMF.
Table 16 ECB equity subscriptions by national central banksoutside the euro area
National banks % of capital Paid-in capital (euro)
Danmarks Nationalbank 1.5138 6 104 332.92Sveriges Riksbank 2.3313 9 400 866.26Bank of England 13.9337 56 187 041.67Total 17.7788 71 692 240.85
Bulgarian National Bank 0.8833 3 561 868.99Ceska narodni banka 1.3880 5 597 049.87Eesti Pank 0.1703 686 727.37Latvijas Banka 0.2813 1 134 330.06Lietuvos bankas 0.4178 1 684 760.40Magyar Nemzeti Bank 1.3141 5 299 051.33Narodowy Bank Polski 4.8748 19 657 419.83Banca Nationala a Romaniei 2.5188 10 156 951.89Narodna banka Slovenska 0.6765 2 727 956.95Total 12.5249 50 506 116.69
Total 30.3037 122 198 357.54
Source: ECB.
186
Part Two. Experience of the BNB in Managing Foreign Exchange Reserves under Currency Board Arrangement
2. Forthcoming Obligations of the BNB
The Bulgarian National Bank is part of the European System of
Central Banks and owns equity in the ECB. In accordance with the
Statute of the European System of Central Banks’ Chapter 29, the
algorithm for participation in ECB equity is the weighted average of
the share of the particular country in EU population and GDP, both
variables given equal weight. The capital key is recalculated
quinquennually and at each EU enlargement, with last recalculation
in January 2007 when Bulgaria and Romania joined. In accordance
with Statute Chapter 49.3 ESCB enlargement also increased ECB
capital from euro 5,565,000,000 to euro 5,760,652,402.58. The BNB
equity is 0.8833 per cent or euro 50,883,842.67. With Bulgarian ac-
cession on 1 January 2007 the BNB paid down 7 per cent of this, or
euro 3,561.868.99. Under Statute Chapter 49 the BNB has to pay the
balance of ECB equity or euro 47,321.973.68 on joining the
Eurosystem. The payment will be into the ECB own funds portfolio,
managed by ECB portfolio managers.
In addition Statute Chapter 30 requires national central banks to
transfer part of their foreign reserves to the ECB upon Eurosystem
accession. These funds become part of the ECB foreign reserve port-
folio and are calculated on the basis of banks’ ECB capital keys and
the value of national foreign reserves. The ECB foreign reserve port-
folio continues to be managed by portfolio managers at national cen-
tral banks and comprises USD and JPY denominated securities (de-
pending on specialisation) and gold. The durations of securities trans-
ferred to the ECB foreign reserve portfolio ought not to deviate from
the predefined limits of tactical benchmark durations. On the day of
transfer national central banks need to advise their custodians of the
securities’ changed titles. Since 2006 national central banks have
been able to cede foreign reserve portfolio management to the ECB
or to seek joint management with other central banks.
Overall, Bulgarian accession to the Eurosystem would not call for
profound change in the operational framework of BNB foreign reserve
management. The Bulgarian National Bank has established a flexible
infrastructure for this management, and one similar to that of the ECB.
Chapter 13. Foreign Reserve Management under a Currency Board amid Integration into ...
187
Advanced foreign reserve management IT systems are in place and
the Bank’s portfolio managers are highly trained and experienced.
The Bank invests constantly into increasing the knowledge and skills
of employees involved in foreign reserve operational management.
Upon Eurosystem accession BNB portfolio managers would ex-
change experience with colleagues in charge of managing ECB for-
eign reserves at other national central banks. Two BNB portfolio man-
agers have already had the opportunity of working at the ECB for dif-
ferent periods.
The BNB would continue managing Bulgarian foreign reserves
outside the ECB balance sheet, to rules identical to those prior to
Eurosystem entry, and the Bank would continue to exercise discretion
in determining the currency structure of its reserve. The selection of
a benchmark for Bulgarian foreign reserve management would con-
tinue to be the prerogative of the BNB Investment Committee and
Governing Council.
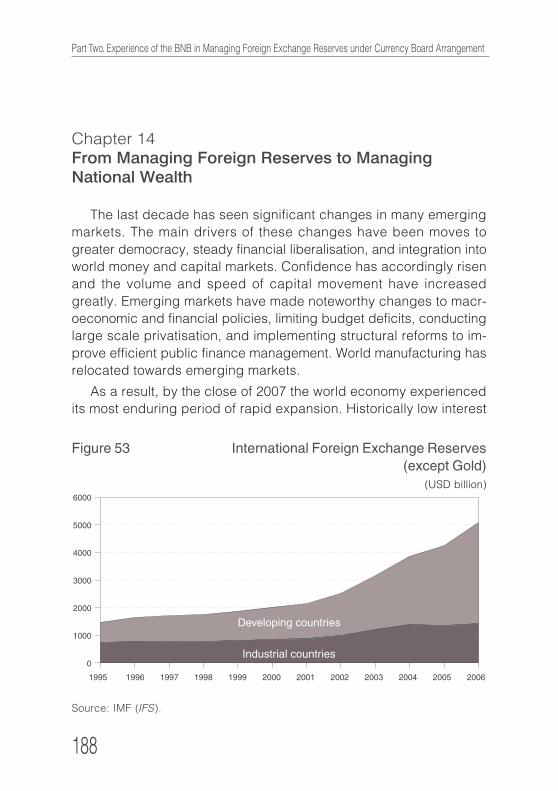
188
Part Two. Experience of the BNB in Managing Foreign Exchange Reserves under Currency Board Arrangement
Figure 53 International Foreign Exchange Reserves(except Gold)
(USD billion)
Source: IMF (IFS).
Chapter 14From Managing Foreign Reserves to Managing
National Wealth
The last decade has seen significant changes in many emerging
markets. The main drivers of these changes have been moves to
greater democracy, steady financial liberalisation, and integration into
world money and capital markets. Confidence has accordingly risen
and the volume and speed of capital movement have increased
greatly. Emerging markets have made noteworthy changes to macr-
oeconomic and financial policies, limiting budget deficits, conducting
large scale privatisation, and implementing structural reforms to im-
prove efficient public finance management. World manufacturing has
relocated towards emerging markets.
As a result, by the close of 2007 the world economy experienced
its most enduring period of rapid expansion. Historically low interest
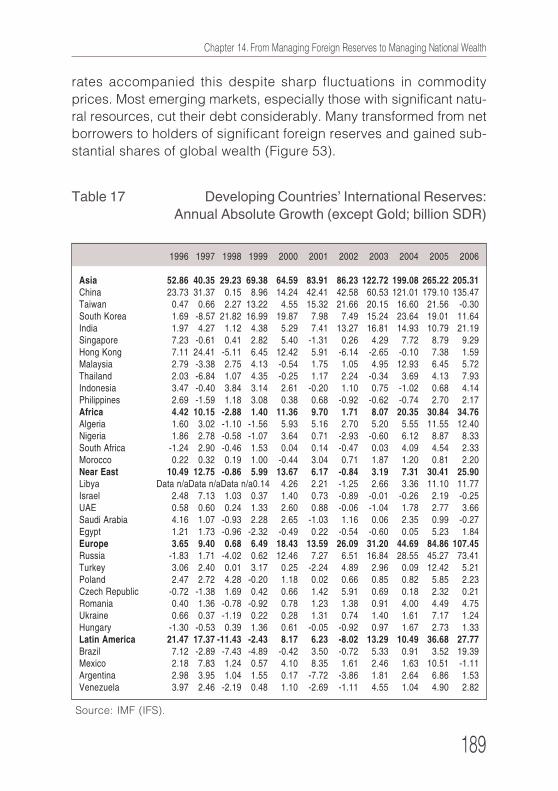
Chapter 14. From Managing Foreign Reserves to Managing National Wealth
189
rates accompanied this despite sharp fluctuations in commodity
prices. Most emerging markets, especially those with significant natu-
ral resources, cut their debt considerably. Many transformed from net
borrowers to holders of significant foreign reserves and gained sub-
stantial shares of global wealth (Figure 53).
Table 17 Developing Countries’ International Reserves:Annual Absolute Growth (except Gold; billion SDR)
1996 1997 1998 1999 2000 2001 2002 2003 2004 2005 2006
Asia 52.86 40.35 29.23 69.38 64.59 83.91 86.23 122.72 199.08 265.22 205.31
China 23.73 31.37 0.15 8.96 14.24 42.41 42.58 60.53 121.01 179.10 135.47
Taiwan 0.47 0.66 2.27 13.22 4.55 15.32 21.66 20.15 16.60 21.56 -0.30
South Korea 1.69 -8.57 21.82 16.99 19.87 7.98 7.49 15.24 23.64 19.01 11.64
India 1.97 4.27 1.12 4.38 5.29 7.41 13.27 16.81 14.93 10.79 21.19
Singapore 7.23 -0.61 0.41 2.82 5.40 -1.31 0.26 4.29 7.72 8.79 9.29
Hong Kong 7.11 24.41 -5.11 6.45 12.42 5.91 -6.14 -2.65 -0.10 7.38 1.59
Malaysia 2.79 -3.38 2.75 4.13 -0.54 1.75 1.05 4.95 12.93 6.45 5.72
Thailand 2.03 -6.84 1.07 4.35 -0.25 1.17 2.24 -0.34 3.69 4.13 7.93
Indonesia 3.47 -0.40 3.84 3.14 2.61 -0.20 1.10 0.75 -1.02 0.68 4.14
Philippines 2.69 -1.59 1.18 3.08 0.38 0.68 -0.92 -0.62 -0.74 2.70 2.17
Africa 4.42 10.15 -2.88 1.40 11.36 9.70 1.71 8.07 20.35 30.84 34.76
Algeria 1.60 3.02 -1.10 -1.56 5.93 5.16 2.70 5.20 5.55 11.55 12.40
Nigeria 1.86 2.78 -0.58 -1.07 3.64 0.71 -2.93 -0.60 6.12 8.87 8.33
South Africa -1.24 2.90 -0.46 1.53 0.04 0.14 -0.47 0.03 4.09 4.54 2.33
Morocco 0.22 0.32 0.19 1.00 -0.44 3.04 0.71 1.87 1.20 0.81 2.20
Near East 10.49 12.75 -0.86 5.99 13.67 6.17 -0.84 3.19 7.31 30.41 25.90
Libya Data n/aData n/aData n/a0.14 4.26 2.21 -1.25 2.66 3.36 11.10 11.77
Israel 2.48 7.13 1.03 0.37 1.40 0.73 -0.89 -0.01 -0.26 2.19 -0.25
UAE 0.58 0.60 0.24 1.33 2.60 0.88 -0.06 -1.04 1.78 2.77 3.66
Saudi Arabia 4.16 1.07 -0.93 2.28 2.65 -1.03 1.16 0.06 2.35 0.99 -0.27
Egypt 1.21 1.73 -0.96 -2.32 -0.49 0.22 -0.54 -0.60 0.05 5.23 1.84
Europe 3.65 9.40 0.68 6.49 18.43 13.59 26.09 31.20 44.69 84.86 107.45
Russia -1.83 1.71 -4.02 0.62 12.46 7.27 6.51 16.84 28.55 45.27 73.41
Turkey 3.06 2.40 0.01 3.17 0.25 -2.24 4.89 2.96 0.09 12.42 5.21
Poland 2.47 2.72 4.28 -0.20 1.18 0.02 0.66 0.85 0.82 5.85 2.23
Czech Republic -0.72 -1.38 1.69 0.42 0.66 1.42 5.91 0.69 0.18 2.32 0.21
Romania 0.40 1.36 -0.78 -0.92 0.78 1.23 1.38 0.91 4.00 4.49 4.75
Ukraine 0.66 0.37 -1.19 0.22 0.28 1.31 0.74 1.40 1.61 7.17 1.24
Hungary -1.30 -0.53 0.39 1.36 0.61 -0.05 -0.92 0.97 1.67 2.73 1.33
Latin America 21.47 17.37 -11.43 -2.43 8.17 6.23 -8.02 13.29 10.49 36.68 27.77
Brazil 7.12 -2.89 -7.43 -4.89 -0.42 3.50 -0.72 5.33 0.91 3.52 19.39
Mexico 2.18 7.83 1.24 0.57 4.10 8.35 1.61 2.46 1.63 10.51 -1.11
Argentina 2.98 3.95 1.04 1.55 0.17 -7.72 -3.86 1.81 2.64 6.86 1.53
Venezuela 3.97 2.46 -2.19 0.48 1.10 -2.69 -1.11 4.55 1.04 4.90 2.82
Source: IMF (IFS).
190
Part Two. Experience of the BNB in Managing Foreign Exchange Reserves under Currency Board Arrangement
These developments in the world economy have legitimately
posed the question of how to manage newly accumulated assets
more effectively. Growing attention to foreign reserve management by
researchers and the public has brought about evolution in social and
political discourse. Advances in research and changes in investment
objectives have gradually overturned the broad consensus at interna-
tional financial institutions and elsewhere that foreign reserves ought
to be invested only in highly liquid short term low risk assets issued
by industrialised countries. Today most agree (thought some do not)
that portions of foreign reserves which are not needed for monetary
policy purposes by national central banks ought to be invested with
the objective to increase wealth.
Under pressure from the international financial community and lo-
cal public opinion a number of countries have also redirected “ex-
cess” foreign reserves (those not needed for monetary policy pur-
poses or to maintain exchange rates) to public projects or deposits
in private banks. Governments have started to demand higher in-
come from central bank foreign reserve management and to monitor
whether national wealth is invested rationally and effectively, accord-
ing to the law, and in response to changes in markets.
A number of countries have channelled portions of foreign re-
serves investment funds intended to manage national wealth: sover-
eign wealth funds (Table 18). Their assets may also comprise rev-
enue from the sale of natural resources, privatisation, or budget sur-
pluses. Generated income offsets the economic impact of fluctuations
in international commodity prices and hence budget revenues, or is
saved for future balancing of the pension burden among the genera-
tions. There are two types of funds according to their use of re-
sources: stabilisation and savings.
The emergence of sovereign wealth funds posed new challenges
to government and central bank macroeconomic and reserve man-
agement policy. As described in Chapter 1, the traditional role of
central banks is to maintain banking, financial system, and financial
market stability and thus attain price stability. This implies that cen-
tral banks continue to focus mainly on monetary policy and foreign
reserve management. Each additional risk assumed by them in
Chapter 14. From Managing Foreign Reserves to Managing National Wealth
191
search of higher income is at odds with the objective of monetary
policy, regardless of the choice of monetary and exchange rate re-
gime. This exposes central banks to political pressure and can under-
mine confidence in them. To avoid such conflict, legislators can chan-
nel some resource into separate sovereign wealth funds with invest-
ment objectives and strategic asset allocations distinct from those of
central banks. Government or a body mandated by it can manage
sovereign funds even where central or private banks marshall their re-
sources tactically.
On the other hand, finance ministries or government bodies man-
dated with managing sovereign wealth funds – most often govern-
ment debt management agencies – may lack the required knowhow.
Incentives to seek additional income and control return on investment
are absent from the traditional duties of government and from civil
servants’ motivation packages. This impinge on the development of
investment management skills by them. Financial market develop-
ment, financial innovation, and the emergence of sovereign wealth
funds require people who are continually abreast of the latest in stra-
tegic asset allocation and portfolio risk management.
These challenges have engendered different expert opinions of
sovereign wealth funds and a large group of forthright critics of them.
For instance, Davis, Owsowski, and Barnet (2001) conclude that
such funds (especially stabilisation ones) are not a panacea for struc-
tural fiscal problems in countries dependent on oil exports: they influ-
ence only budget revenue and not expenditure, and hence have no
bearing on the consolidated budget deficit. Following this logic, mar-
shalling part of oil importing countries’ budget revenues into sover-
eign wealth funds pursuing public objectives through savings is inef-
ficient if government continues to generate deficit and accumulate
debt. The authors observe that in two cases examined by them there
are changes to the absolute amount of the consolidated government
budget, but that the budget balance is maintained in the end.
The proposed example illustrates the thesis that debate on sover-
eign wealth funds should develop as part of debate on national eco-
nomic policy and long term national balance sheet management: it
goes far beyond the mandate of any cabinet or central bank gover-
192
Part Two. Experience of the BNB in Managing Foreign Exchange Reserves under Currency Board Arrangement
nor. Everything thus far presumes and requires great political respon-
sibility when taking a putative decision to establish a Bulgarian sov-
ereign wealth fund. Fraught with long term effects, this political deci-
sion ought to be deeply considered and embodied in special legis-
lation.
The objective of what follows is to offer support for the process of
taking such a strategic decision. The study addresses three important
questions: what is an adequate level of foreign reserves for Bulgaria
in the long run; how to define the objectives and principles of a sov-
ereign wealth fund (provided the answer to the first question licences
one); how to manage a sovereign wealth fund properly.
1. Determining an Adequate Level of Foreign Reserves
for Bulgaria
As stressed in Chapter 4, existing currency board legislation in
Bulgaria renders foreign reserve adequacy largely an endogenous
variable. This stems from the full liberalisation of capital movements.
Hence, it is more reasonable for Bulgaria to apply the Greenspan-
Guidotti rule for assessing foreign reserve adequacy.
Even if one applied the indicators in Chapter 4, as traditionally
used for quantitative assessments of foreign reserve adequacy
(buffer-stock models), one would see that in the ten year existence of
the currency board, Bulgaria has traditionally maintained more foreign
reserves than the theoretical recommendation, irrespective of the
academic concept applied. Hence, the current amount of foreign re-
serves does not expose Bulgaria to the risk of their becoming insuf-
ficient to maintain the currency board and the pegged lev euro rate.
Bulgaria lacks economically significant natural resources and
does not produce commodities with a significant effect on the bal-
ance of trade or current account. Hence, macroeconomic policy is
particularly important for the future level and dynamics of foreign re-
serves. In the currency board as described in Chapter 5, the mix of
fiscal policy, government debt management, and structural reform
are particularly important. The analysis shows convincingly that for
the past ten years those three factors have formed the basis of the
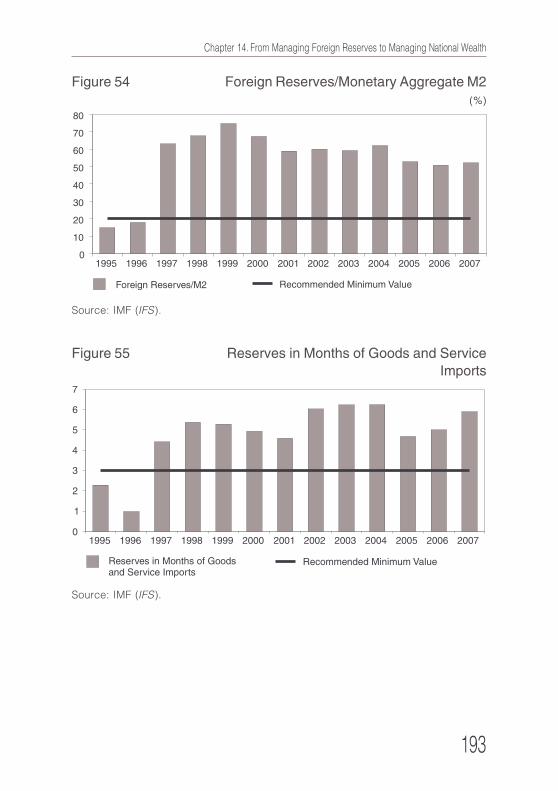
Chapter 14. From Managing Foreign Reserves to Managing National Wealth
193
Figure 54 Foreign Reserves/Monetary Aggregate M2(%)
Figure 55 Reserves in Months of Goods and ServiceImports
Source: IMF (IFS).
Source: IMF (IFS).
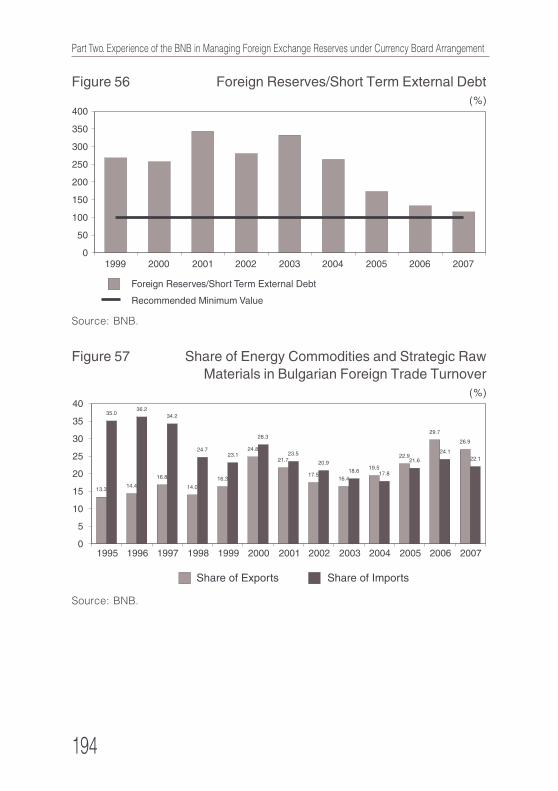
194
Part Two. Experience of the BNB in Managing Foreign Exchange Reserves under Currency Board Arrangement
Figure 56 Foreign Reserves/Short Term External Debt(%)
Source: BNB.
Figure 57 Share of Energy Commodities and Strategic RawMaterials in Bulgarian Foreign Trade Turnover
(%)
Source: BNB.
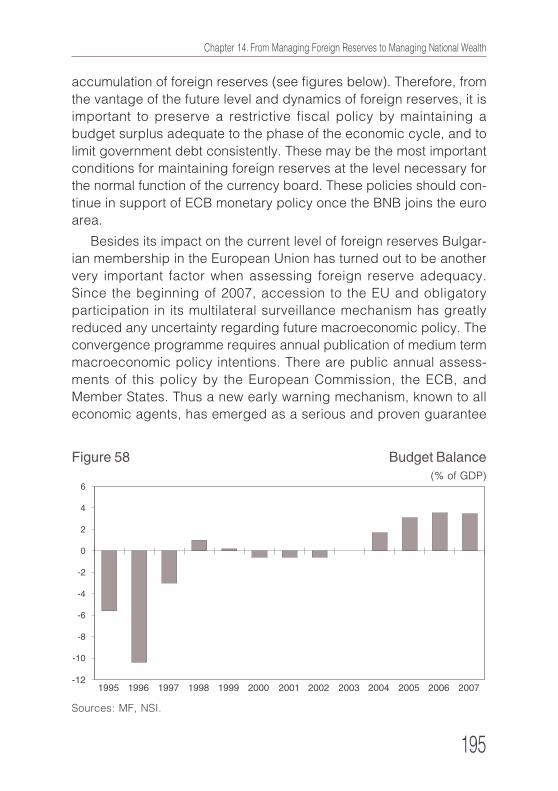
Chapter 14. From Managing Foreign Reserves to Managing National Wealth
195
Figure 58 Budget Balance(% of GDP)
Sources: MF, NSI.
accumulation of foreign reserves (see figures below). Therefore, from
the vantage of the future level and dynamics of foreign reserves, it is
important to preserve a restrictive fiscal policy by maintaining a
budget surplus adequate to the phase of the economic cycle, and to
limit government debt consistently. These may be the most important
conditions for maintaining foreign reserves at the level necessary for
the normal function of the currency board. These policies should con-
tinue in support of ECB monetary policy once the BNB joins the euro
area.
Besides its impact on the current level of foreign reserves Bulgar-
ian membership in the European Union has turned out to be another
very important factor when assessing foreign reserve adequacy.
Since the beginning of 2007, accession to the EU and obligatory
participation in its multilateral surveillance mechanism has greatly
reduced any uncertainty regarding future macroeconomic policy. The
convergence programme requires annual publication of medium term
macroeconomic policy intentions. There are public annual assess-
ments of this policy by the European Commission, the ECB, and
Member States. Thus a new early warning mechanism, known to all
economic agents, has emerged as a serious and proven guarantee
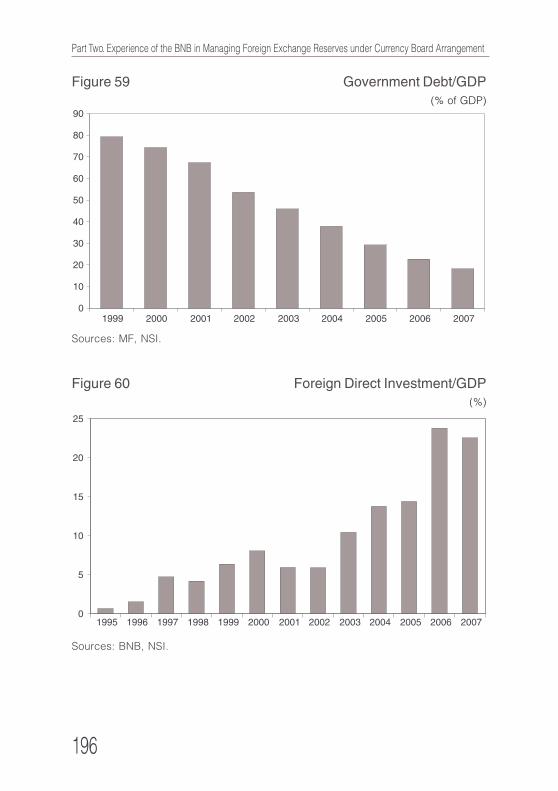
196
Part Two. Experience of the BNB in Managing Foreign Exchange Reserves under Currency Board Arrangement
Figure 59 Government Debt/GDP(% of GDP)
Sources: MF, NSI.
Figure 60 Foreign Direct Investment/GDP(%)
Sources: BNB, NSI.
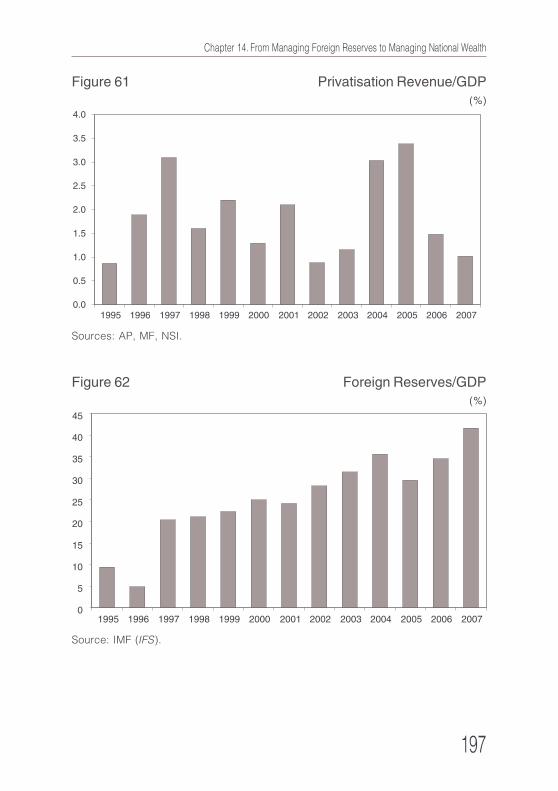
Chapter 14. From Managing Foreign Reserves to Managing National Wealth
197
Figure 61 Privatisation Revenue/GDP(%)
Sources: AP, MF, NSI.
Figure 62 Foreign Reserves/GDP(%)
Source: IMF (IFS).
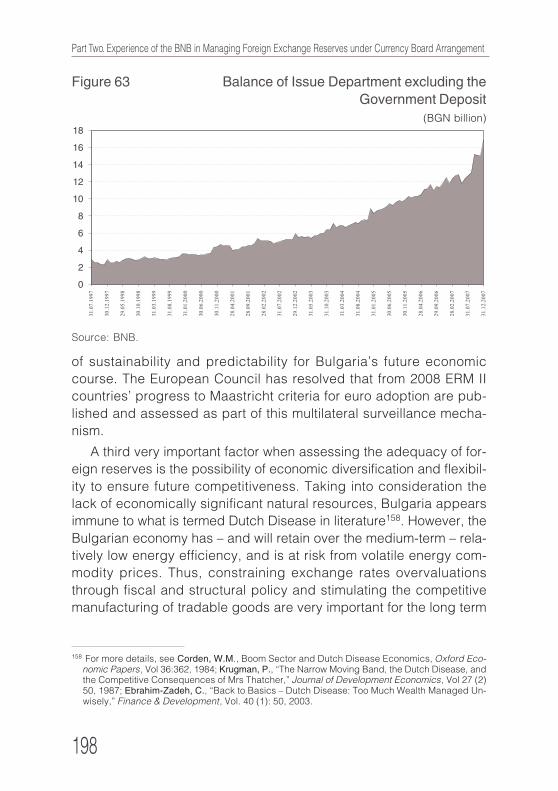
198
Part Two. Experience of the BNB in Managing Foreign Exchange Reserves under Currency Board Arrangement
Figure 63 Balance of Issue Department excluding theGovernment Deposit
(BGN billion)
Source: BNB.
of sustainability and predictability for Bulgaria’s future economic
course. The European Council has resolved that from 2008 ERM II
countries’ progress to Maastricht criteria for euro adoption are pub-
lished and assessed as part of this multilateral surveillance mecha-
nism.
A third very important factor when assessing the adequacy of for-
eign reserves is the possibility of economic diversification and flexibil-
ity to ensure future competitiveness. Taking into consideration the
lack of economically significant natural resources, Bulgaria appears
immune to what is termed Dutch Disease in literature158. However, the
Bulgarian economy has – and will retain over the medium-term – rela-
tively low energy efficiency, and is at risk from volatile energy com-
modity prices. Thus, constraining exchange rates overvaluations
through fiscal and structural policy and stimulating the competitive
manufacturing of tradable goods are very important for the long term
158 For more details, see Corden, W.M., Boom Sector and Dutch Disease Economics, Oxford Eco-nomic Papers, Vol 36:362, 1984; Krugman, P., “The Narrow Moving Band, the Dutch Disease, andthe Competitive Consequences of Mrs Thatcher,” Journal of Development Economics, Vol 27 (2)50, 1987; Ebrahim-Zadeh, C., “Back to Basics – Dutch Disease: Too Much Wealth Managed Un-wisely,” Finance & Development, Vol. 40 (1): 50, 2003.

Chapter 14. From Managing Foreign Reserves to Managing National Wealth
199
adequacy of foreign reserves. Given the political choice of a currency
board (to be replaced by ECB monetary policy), plus the free move-
ment of capital, and relatively low flat rate taxation, labour market
policy159 remains the paramount and theoretically sole instrument of
economic policy. Though imperceptibly, this is becoming an impor-
tant long term factor in foreign reserve adequacy and the choice of
objectives of any putative Bulgarian sovereign wealth fund.
The adequacy of foreign reserves to date offers grounds for as-
suming that government funds at the BNB (the government deposit
with the Issue Department: the fiscal reserve) could be channelled
into a sovereign wealth fund without leaving the BNB short of mon-
etary policy means in the medium term, assuming that the currency
board and countercyclical macroeconomic policy endure.
2. Determining the Objectives of a Sovereign Wealth
Fund
Channelling some foreign reserves into a sovereign wealth fund
would not change the objectives of managing public wealth: liquidity,
security, and profitability. Assets in the sovereign wealth fund would
continue to be part of public wealth. However, their management
would pursue the objective of an expected return at a certain level of
security: the sole change would be in priorities. The purposes of such
a fund and the occasions on which it would be dispensed would de-
fine its required degree of liquidity. Therefore, it would be very impor-
tant for the objectives of profitability and/or security to be defined
precisely in law.
Sovereign wealth funds are generally supposed to have only one
objective. Having a single objective from the very beginning would
avoid conflicts between purposes and guarantee maximum transpar-
ency and accountability, as well as assisting an adequate and effec-
tive institutional setup. For instance, an objective for a future Bulgar-
159 For an analysis of the transmission mechanism of economic policy in Bulgaria under the currencyboard, see for instance Nenovsky, N., K. Hristov, “Financial Repression and Credit Rationing un-der a Currency Board Arrangement for Bulgaria,” BNB Discussion Papers, No 2, 1998.
200
Part Two. Experience of the BNB in Managing Foreign Exchange Reserves under Currency Board Arrangement
ian sovereign wealth fund may be to generate an annual income of X,
e.g. over a horizon of up to 2016 to support future annual pension
spending of Z as dictated by population aging. In this particular case,
it would be possible and necessary to determine the year from which
the fund would commence disbursing money into the social insurance
system: e.g. year Y+1.
Legal resolutions to both issues would give the opportunity of us-
ing optimisation models in fund management and of structuring the
investment process as described in Part I. They would also provide
a clear and precise definition of the priority of extracting income from
the fund. Such an approach would cost the government some flexibil-
ity when using public money, yet would establish long term confi-
dence and guarantee the sustainability of certain public disburse-
ments: pensions in this case.
Another way to settle the issue of objectives is to take a course
similar to that taken by the Law on the BNB and firmly delineate issu-
ers, financial instruments, and currencies into which the fund may
invest assets. This would assist investment process structuring and
stress the importance of safety as a priority. Such an approach would
simplify fund management and accountability and provide flexibility
to government as regards using money, yet in this case, government
and fund managers would bear greater and constant political respon-
sibility to demonstrate fund profitability and efficiency to the public
and the Parliament.
In the one-purpose-one-fund approach it is particularly important
to balance the marginal benefits and marginal costs of sovereign
wealth funds by assigning definite purposes to them. The limited ex-
tent of national reserves against the total amount of financial assets
on the market is an objective constraint which restrains governments
from establishing more than one sovereign wealth fund in practice.
Chapter 14. From Managing Foreign Reserves to Managing National Wealth
201
3. The Institutional Setup of a Sovereign Wealth Fund
The relationship between factors influencing the adequacy of Bul-
garia’s foreign reserves and challenges faced by bodies implement-
ing macroeconomic policy as indicated above in this Chapter, shows
that the institutional setup of a sovereign wealth fund is of consider-
able import. Long term cross-party consensus on the institutional
aspects of such a fund is necessary in parliament from the outset.
World practice shows that there is no uniform institutional organi-
sation for sovereign wealth funds. The table below shows the general
practice of creating structures through set legislation. Central banks
of advanced industrialised countries are totally focused on managing
foreign reserves and most of these countries have no sovereign
wealth funds. Only some of them – for instance Norway and Switzer-
land – set aside portions of foreign reserves in funds or manage them
separately to different (long term) benchmarks seeking higher prof-
itability as a primary objective. Their central banks and governments
set investment targets individually or jointly. This shows confidence in
the institutional durability of these central banks and stems from the
relatively high risk tolerance afforded them by law. These central
banks face no legal restrictions on issuers, currencies, or assets into
which they may invest their foreign reserves.
The experience of countries with sovereign wealth funds160 shows
that a clear-cut legislative solution to the institutional issues discussed
below and division of responsibility between governments, central
banks, finance ministries and some specialized ministries161 and
regulators162 is crucial to creating confidence, lowering operational
risk, and attaining fund objectives.
First, when establishing such a fund, it is recommended and even
required to eliminate any possibility of future transfers of resources
between it and foreign reserves. In the Bulgarian case, only such
elimination would assure both strict observance of the currency board
160 See for instance Johnson-Calari, J., Sovereign Wealth Management, Central Banking Publica-tions, 2007.
161 This is most valid for countries with economically significant natural resources.162 For instance the Court of Auditors or the National Audit Office.
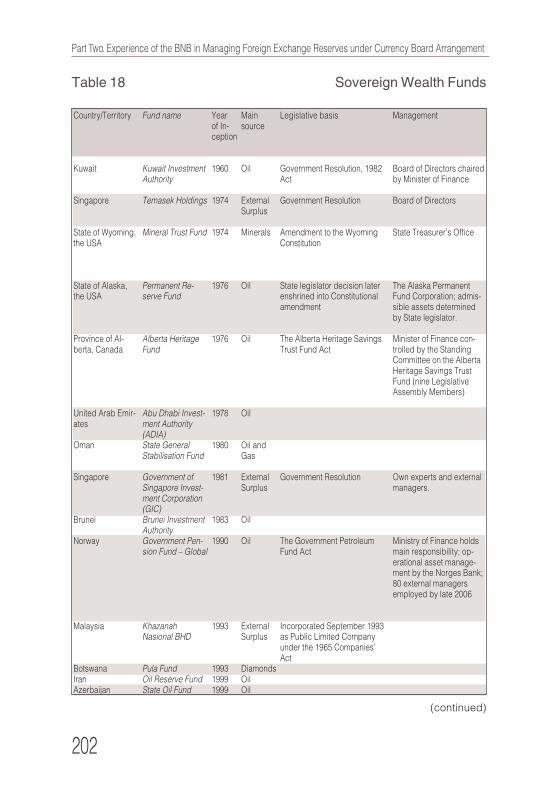
202
Part Two. Experience of the BNB in Managing Foreign Exchange Reserves under Currency Board Arrangement
Table 18 Sovereign Wealth Funds
Country/Territory
Kuwait
Singapore
State of Wyoming,the USA
State of Alaska,the USA
Province of Al-berta, Canada
United Arab Emir-ates
Oman
Singapore
Brunei
Norway
Malaysia
BotswanaIranAzerbaijan
Fund name
Kuwait InvestmentAuthority
Temasek Holdings
Mineral Trust Fund
Permanent Re-serve Fund
Alberta HeritageFund
Abu Dhabi Invest-ment Authority(ADIA)State GeneralStabilisation Fund
Government ofSingapore Invest-ment Corporation(GIC)Brunei InvestmentAuthorityGovernment Pen-sion Fund – Global
KhazanahNasional BHD
Pula FundOil Reserve FundState Oil Fund
Yearof In-ception
1960
1974
1974
1976
1976
1978
1980
1981
1983
1990
1993
199319991999
Mainsource
Oil
ExternalSurplus
Minerals
Oil
Oil
Oil
Oil andGas
ExternalSurplus
Oil
Oil
ExternalSurplus
DiamondsOilOil
Legislative basis
Government Resolution, 1982Act
Government Resolution
Amendment to the WyomingConstitution
State legislator decision laterenshrined into Constitutionalamendment
The Alberta Heritage SavingsTrust Fund Act
Government Resolution
The Government PetroleumFund Act
Incorporated September 1993as Public Limited Companyunder the 1965 Companies’Act
Management
Board of Directors chairedby Minister of Finance
Board of Directors
State Treasurer’s Office
The Alaska PermanentFund Corporation; admis-sible assets determinedby State legislator.
Minister of Finance con-trolled by the StandingCommittee on the AlbertaHeritage Savings TrustFund (nine LegislativeAssembly Members)
Own experts and externalmanagers.
Ministry of Finance holdsmain responsibility; op-erational asset manage-ment by the Norges Bank;80 external managersemployed by late 2006
(continued)
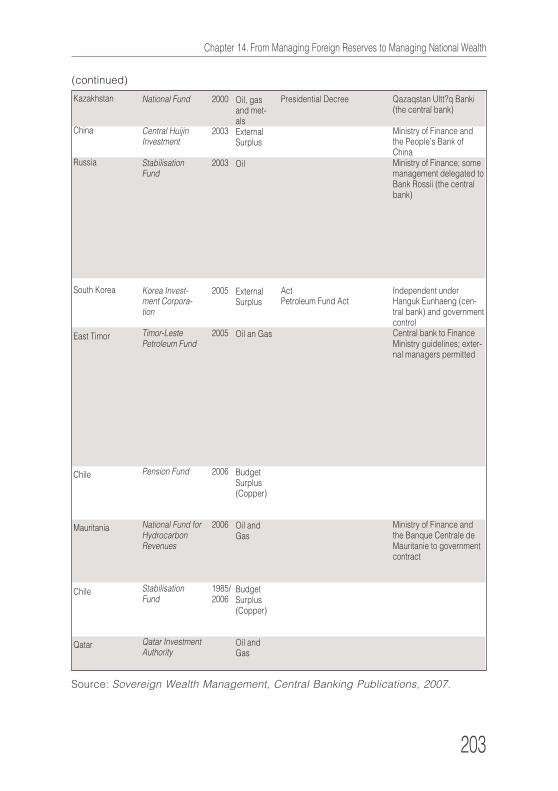
Chapter 14. From Managing Foreign Reserves to Managing National Wealth
203
National Fund
Central HuijinInvestment
StabilisationFund
Korea Invest-ment Corpora-tion
Timor-LestePetroleum Fund
Pension Fund
National Fund forHydrocarbonRevenues
StabilisationFund
Qatar InvestmentAuthority
2000
2003
2003
2005
2005
2006
2006
1985/2006
Qazaqstan Ultt?q Banki(the central bank)
Ministry of Finance andthe People’s Bank ofChinaMinistry of Finance; somemanagement delegated toBank Rossii (the centralbank)
Independent underHanguk Eunhaeng (cen-tral bank) and governmentcontrolCentral bank to FinanceMinistry guidelines; exter-nal managers permitted
Ministry of Finance andthe Banque Centrale deMauritanie to governmentcontract
Source: Sovereign Wealth Management, Central Banking Publications, 2007.
(continued)
Presidential Decree
ActPetroleum Fund Act
Kazakhstan
China
Russia
South Korea
East Timor
Chile
Mauritania
Chile
Qatar
Oil, gasand met-alsExternalSurplus
Oil
ExternalSurplus
Oil an Gas
BudgetSurplus(Copper)
Oil andGas
BudgetSurplus(Copper)
Oil andGas
204
Part Two. Experience of the BNB in Managing Foreign Exchange Reserves under Currency Board Arrangement
rules which have governed the BNB for a decade, and eliminate any
restriction to BNB institutional and financial independence. It would
correspond with the desire to achieve maximum transparency and
accountability under the separate mandates for managing foreign
reserves and sovereign wealth.
Second, and similar to the point above, the possibility of using the
fund for any purposes other than those for which it was set up ought
to be legally removed. This would remove the option of political tam-
pering with the fickle balance of savings, benefits, and generations.
Another important reason for such a prohibition is to ensure from the
outset that the investment process and the control mechanism for
achieving the fund’s objectives over time are well structured.
Third, the fund ought to be legally denied the right to invest into
assets issued by the Bulgarian government or Bulgarian business,
even if those assets were denominated in permitted convertible cur-
rencies and were freely traded on international markets. Besides rais-
ing the possibility of bypassing currency board rules, such invest-
ment would create a connection (albeit indiscernible) with the Bulgar-
ian economy, transgressing the division between foreign reserves
and a sovereign wealth fund.
Fourth, the sovereign wealth fund’s sources ought to be legally
defined. In the Bulgarian case (taking into account monetary and
exchange regimes and the lack of economically significant natural
resources) yield on its own investment and transfers of budget sur-
pluses may be appropriate sources of revenue. The latter would elimi-
nate any speculation as to the purpose to which budget surpluses are
put. Indeed, most critics of sovereign wealth funds stress the fact that
their existence does not stop governments financing them for politi-
cal reasons, or else financing chronic current deficits using them.
Fifth, the possibility of hiring private managers to manage fund
assets and related procedures ought to be legally defined.
Sixth, the institutional structure of fund management ought to be
legally settled, it being particularly important to define powers and
duties with regard to investment objectives, propensity to risk, and
strategic and tactical asset allocation at each hierarchical level. The
Chapter 14. From Managing Foreign Reserves to Managing National Wealth
205
independence of risk management from operational management
ought to be guaranteed categorically at this stage.
Seventh, a legal spending cap ought to be imposed on the sover-
eign wealth fund: it could be one linked with the attainment of objec-
tives, including financial ones.
Eighth, the fund’s profit distribution policy ought to be legally de-
termined in a way corresponding to its objectives and guaranteeing
clarity of relations with the government budget, should any such re-
lations arise.
Ninth, it ought to be legally guaranteed that the sovereign wealth
fund’s executives are as institutionally, personally, and financially in-
dependent of any political pressure as are central bank executives.
Tenth, a mechanism of overseeing the fund which excludes any
possibility of its use as a political tool ought to be legally constructed.
The attainment of the purpose of the fund would be guaranteed to
the fullest degree solely through clear legislative settlement of these,
and many other, issues. The framework should also set a mechanism
for public control over the fund and its disbursement.

206
Part Two. Experience of the BNB in Managing Foreign Exchange Reserves under Currency Board Arrangement
International Foreign Exchange Reserves
Translated by the authors
Format 1/16/70х90, 206 pp.Design, pre-press, printing and binding:Bulgarian National Bank Publications