
International Energy Outlook 2010 With Projections to 2035.
21
International Energy Outlook 2010 With Projections to 2035
-
Upload
edgar-bennett -
Category
Documents
-
view
222 -
download
0
Transcript of International Energy Outlook 2010 With Projections to 2035.
International Energy Outlook 2010 With Projections to 2035

Non-OECD countries account for 86% of the increase in global energy use
0
200
400
600
800
2007 2015 2020 2025 2030 2035
Non-OECDOECD
495543
590639
687739
50%
62%
50% 38%
energy consumptionquadrillion Btu
Source: EIA, International Energy Outlook 2010

Renewables are the fastest growing energy source (but from a relatively small base)
0
50
100
150
200
250
1990 1995 2000 2005 2010 2015 2020 2025 2030 2035
Liquids (including biofuels)
Renewables (excluding biofuels)
Natural gas
Coal
Nuclear
History Projections
35%
27%
23%
10%
5%
30%
28%
22%
14%
6%
Share of world total
world primary energy consumptionquadrillion Btu
Source: EIA, International Energy Outlook 2010

Economic activity and population drive increases in energy use; energy intensity improvements moderate this trend
-3
-2
-1
0
1
2
3
4
5
6
UnitedStates
OECDEurope
Japan SouthKorea
China India Brazil MiddleEast
Africa Russia
GDPPopulationEnergy use per GDP
average annual change (2007-2035)percent per year
Source: EIA, International Energy Outlook 2010

The IEO reflects uncertainty in oil prices through a wide set of price cases
0
25
50
75
100
125
150
175
200
225
1990 1995 2000 2005 2010 2015 2020 2025 2030 2035
$210
$133
$51
High Oil Price case
Reference case
Low Oil Price case
ProjectionsHistory
light, sweet crude oil price 2008 dollars per barrel
Source: EIA, International Energy Outlook 2010

OPEC producers maintain an approximate 40% share of total liquids production in the Reference case
0
20
40
60
80
100
120
1990 1995 2000 2005 2010 2015 2020 2025 2030 2035
45
111
13
OPEC conventional
Total
Unconventional
ProjectionsHistory
52Non-OPEC conventional
85
48
34
3
liquids production million barrel per day
Source: EIA, International Energy Outlook 2010

Growth in OPEC production of conventional liquids comes primarily from Saudi Arabia and Iraq
0
2
4
6
8
10
12
14
16
Saudi Arabia Iran Iraq Other MiddleEast OPEC
Africa South America
2007 2020 2035
Source: EIA, International Energy Outlook 2010
conventional liquids productionmillion barrels per day

Brazil, Russia, Kazakhstan, and U.S. lead increases in non-OPEC conventional supplies
0
2
4
6
8
10
12
14
16
Russia UnitedStates
Brazil Kazakhstan OECDEurope
Mexico Canada
2007 2020 2035
Source: EIA, International Energy Outlook 2010
conventional liquids productionmillion barrels per day
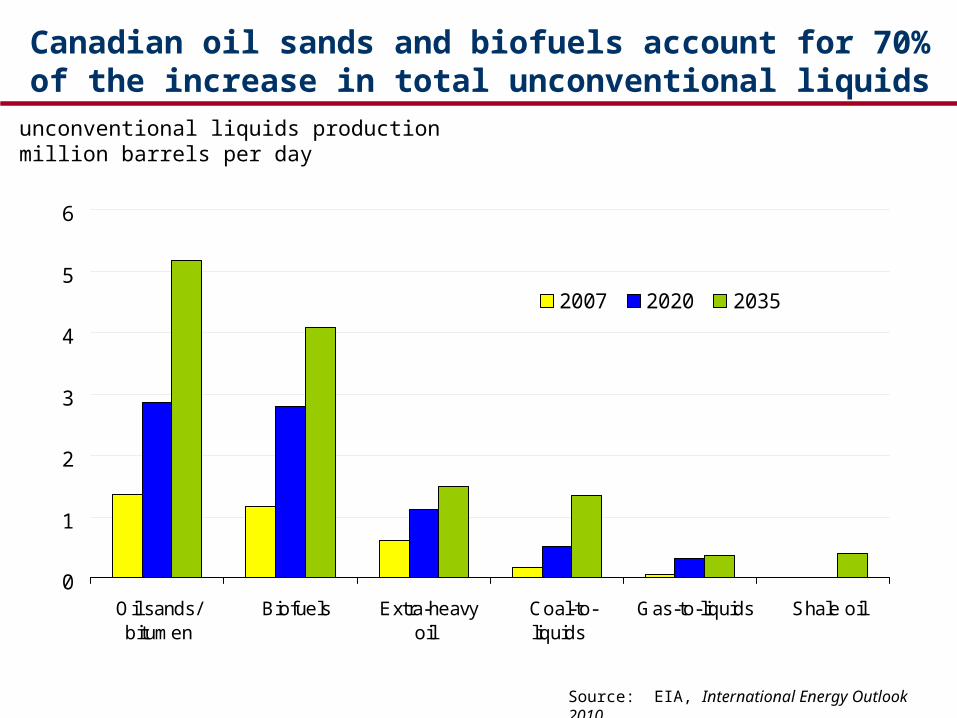
Canadian oil sands and biofuels account for 70% of the increase in total unconventional liquids
0
1
2
3
4
5
6
Oil sands/bitumen
Biofuels Extra-heavyoil
Coal-to-liquids
Gas-to-liquids Shale oil
2007 2020 2035
Source: EIA, International Energy Outlook 2010
unconventional liquids productionmillion barrels per day

The high oil price case assumes much lower production from key oil exporters
15
64
22
13
75
39
11
43
15
96 6
42
0
5
10
15
20
25
30
35
40
45
SaudiArabia
Iraq Iran OtherOPEC
Russia Brazil China Other Non-OPEC
Reference case High Oil Price case
OPEC Non-OPEC
Source: EIA, International Energy Outlook 2010
liquids production in 2035million barrels per day

Non-OECD Asia accounts for 35% of increasednatural gas use
0
20
40
60
80
100
120
140
160
2007 2015 2020 2025 2030 2035
Non-OECD Asia
Middle East
Other OECD
Central/South America
Africa
Non-OECDEurope/Eurasia
US
108
125
136145
150156
Source: EIA, International Energy Outlook 2010
natural gas consumptiontrillion cubic feet

The Middle East accounts for almost one-third the increase in global gas production
-4 -2 0 2 4 6 8 10 12 14 16 18
Middle East
Non-OECD Asia
Africa
Non-OECD Europe/Eurasia
Central and South America
United States
Australia/New Zealand
Other OECD
PercentChange
2007-2035
-9%
164%
22%
101%
21%
104%
75%
125%
natural gas productiontrillion cubic feet
Source: EIA, International Energy Outlook 2010

Tight gas, shale gas, and coalbed methane drive supply growth in China, Canada, and the U.S
0
5
10
15
20
25
2007 2035 2007 2035 2007 2035
Tight gas, shale gas, and coalbed methane
All other gas
China Canada United States
natural gas productiontrillion cubic feet
Source: EIA, International Energy Outlook 2010

Virtually all growth in global coal use occurs in non-OECD Asian nations, especially China and India
0
20
40
60
80
100
120
140
160
1990 1995 2000 2005 2010 2015 2020 2025 2030 2035
Rest of the world
North America
ProjectionsHistory
Non-OECD Asia
world coal consumptionquadrillion Btu
Source: EIA, International Energy Outlook 2010

Renewables are fastest growing, but coal still fuels the largest share of the world’s electricity in 2035
0
10
20
30
40
2007 2015 2020 2025 2030 2035
Liquids Nuclear Other renewablesHydroelectricity Natural gas Coal
42%
21%
43%
19%
16%
15%
2%
5%
7%
14% 13% 2%
world electricity generationtrillion kilowatt hours
Source: EIA, International Energy Outlook 2010

Non-OECD transportation fuel use surpasses almost flat OECD fuel use by 2025
0
20
40
60
80
100
2005 2010 2015 2020 2025 2030 2035
OECD
ProjectionsHistory
Non-OECD
Source: EIA, International Energy Outlook 2010
transportation sector energy consumptionquadrillion Btu

Freight energy use increases faster than passenger energy use
0
10
20
30
40
50
60
70
80
2007 2020 2035 2007 2020 2035
OECD Non-OECD
Freight
Passenger
transportation energy consumptionquadrillion Btu
Source: EIA, International Energy Outlook 2010

Assuming no policy changes, energy-related carbon dioxide emissions grow 43% from 2007 to 2035
0
5
10
15
20
25
30
35
40
45
2007 2015 2020 2025 2030 2035
Non-OECDOECD
30 3234
36
3942
53%
67%
47% 43%
energy CO2 emissionsbillion metric tons
Source: EIA, International Energy Outlook 2010

Key trends from 2007 to 2035
• In the IEO2010 Reference case, global marketed energy consumption grows by 49 percent– Most of this growth occurs in non-OECD Asia and the Middle East
• With no policy changes that would limit their use, fossil fuels provide nearly 80 percent of world energy consumption in 2035 – Petroleum liquids remain the world’s single largest energy source even
as their share of total energy use declines – Renewable energy gains a growing share of total energy use, as its
absolute growth in use from 2007 to 2035, outstrips that of petroleum liquids despite starting from a much lower level
• Energy-related carbon dioxide emissions are projected to rise from 30 billion metric tons in 2007 to 42 billion metric tons in 2035 under current laws and policies
• Meeting the projected increase in world liquids demand will require increases in conventional and unconventional supplies of 25.8 million barrels per day– Oil prices reach $133 per barrel in 2035 (real 2008 dollars per barrel)

Key Trends from 2007 to 2035 (continued)
• Natural gas consumption increases 44%
– Developing Asia accounts for 35% of the increase in world consumption
– The Middle East accounts for 32% of the increase in production
• Coal use grows 56%
– China and India alone account for 85% of the increase
• Nuclear power generation increases 74%
• Total renewable energy use, including liquid biofuels, grows 111%

For more information
U.S. Energy Information Administration home page
www.eia.gov
Short-Term Energy Outlook www.eia.gov/emeu/steo/pub/contents.html
Annual Energy Outlook
www.eia.gov/oiaf/aeo/index.html
International Energy Outlook
www.eia.gov/oiaf/ieo/index.html
Monthly Energy Review
www.eia.gov/emeu/mer/contents.html
National Energy Information Center
(202) 586-8800
Live expert from 9:00 AM – 5:00 p.m. EST
Monday – Friday (excluding Federal holidays)
email: [email protected]


![+9-7>79 (Effi) BP 2010 2015 2020 2025 2030 2035 2040 Energy Future SUPPLY AND DEMAND PROJECTIONS TO 2040] 201 2040¥) 92005 2010 2015 2020 2025 2030 2035 2040 EIA Energy Outlook 2ffr](https://static.fdocuments.net/doc/165x107/5fe02966a84f7a4d132d5036/9-779-effi-bp-2010-2015-2020-2025-2030-2035-2040-energy-future-supply-and.jpg)