International Corporation Air Sciences - sfport.com · September 2005 Final Report...
86
International Corporation Air Sciences Final Report Shoreside Power Feasibility Study for Cruise Ships Berthed at Port of San Francisco Prepared for Port of San Francisco Pier 1 San Francisco, CA 94111 Prepared by ENVIRON International Corporation Seaworthy Systems, Inc. Han-Padron Associates and YEI Engineers September 13, 2005 101 Rowland Way, Suite 220, Novato, CA 94945 415.899.0700
Transcript of International Corporation Air Sciences - sfport.com · September 2005 Final Report...

International Corporation Air Sciences
Final Report
Shoreside Power Feasibility Study for Cruise Ships Berthed at Port of San Francisco
Prepared for
Port of San Francisco Pier 1
San Francisco, CA 94111
Prepared by
ENVIRON International Corporation Seaworthy Systems, Inc. Han-Padron Associates
and YEI Engineers
September 13, 2005
101 Rowland Way, Suite 220, Novato, CA 94945 415.899.0700

September 2005 Final Report
H:\POSF\Report\Final_091205\Final\DISCLAIMER-final.doc
DISCLAIMER This is a final report as submitted by ENVIRON International Corporation. The opinions and conclusions expressed or implied in this report are those of ENVIRON International Corporation. They are not necessarily those of the Port of San Francisco.

September 2005 Final Report
H:\POSF\Report\Final_091205\Final\Acknowledgments-final.doc
ACKNOWLEDGEMENTS ENVIRON International wants to acknowledge several participants in this study that were especially helpful. The Port of San Francisco, especially John Doll, contributed continued comments and insight on the workings of the port and cruise lines. The Cruise Terminal Environmental Advisory Committee (CTEAC) members for their continued comments throughout the project. The cruise lines, especially Tom Dow of Princess Lines, were very forthcoming with information on the visiting ships and their experience in other ports on the West Coast. Pacific Gas & Electric, especially William Zeller, for his review of the design and cost estimates of a conceptual power distribution and transmission infrastructure for shoreside power as well as inputs on the electrical rates for shoreside power. Our subcontractors, Han-Padron Associates, Seaworthy Systems, Inc., and YEI Engineers, Inc., for their professional and high caliber contributions.

September 2005 Final Report
i
TABLE OF CONTENTS
Page 1. INTRODUCTION................................................................................................................ 1-1 1.1 Background................................................................................................................ 1-1 1.2 Objectives and Scope of the Study ............................................................................ 1-1 1.3 Caveats....................................................................................................................... 1-2 1.4 Report Organization................................................................................................... 1-3 2. SELECTION OF POTENTIAL CRUISE SHIPS FOR SHORESIDE POWER .......... 2-1
2.1 Data Gathering For Cruise Ship Selection................................................................. 2-1 2.2 Port Call Data Analysis.............................................................................................. 2-1 2.3 Vessel Engine/Generator Data................................................................................... 2-4 2.4 Candidate Cruise Ship Recommendations................................................................. 2-5
3. HOTELLING MODE POWER DEMAND ANALYSIS ................................................. 3-1 3.1 Princess Cruises Shoreside Power Facility Juneau, Alaska....................................... 3-1 3.2 Dockside Load Data for Selected Cruise Ships ......................................................... 3-2 3.3 Existing Estimated Dockside Power Demand ........................................................... 3-3 3.4 Future Estimated Dockside Power Demand .............................................................. 3-4
4. AUXILLARY MODE EMISSION ANALYSIS................................................................ 4-1
4.1 Port Call Data Summary ............................................................................................ 4-1 4.2 Emission Factors for Marine Generator Engines....................................................... 4-2 4.3 2004 Transit and Berthing Auxiliary Engine Emission Estimates ............................ 4-4 4.4 Shoreside Power Emission Reduction Estimates..................................................... 4-11 4.5 Net Shoreside Power Emission Reduction Estimates.............................................. 4-12 4.6 Projected 2020 Shoreside Power Emission Estimates ............................................. 4-13
5. CONCEPTUAL DESIGN OF A SHORESIDE POWER SYSTEM............................... 5-1
5.1 Overview of Juneau Shoreside Power System for Princess Cruise Lines ................. 5-1 5.2 Electrical Power Infrastructure Conceptual Design at the Port of San Francisco ..... 5-2 5.3 Overview of Power Transmission/Distribution to the Ships ..................................... 5-3 5.4 Energy and Transmission Distribution to Terminals ................................................. 5-3 5.5 Power Delivery within the Terminals ........................................................................ 5-9 5.6 Summary of the Terminal Infrastructure, and Operating Costs............................... 5-10 5.7 Shipboard Alteration Analysis................................................................................. 5-14 5.8 Description of Proposed Shore Power Operations at the Port of San Francisco Cruise Ship Terminal............................................................ 5-21 5.9 Shipboard Cost Estimates for Using Shoreside Power ............................................ 5-23 5.10 Summary and Recommendations ............................................................................ 5-26

September 2005 Final Report
ii
6. ALTERNATIVE CONTROL TECHNOLOGIES ........................................................... 6-1
6.1 New Engines and Engine Modifications.................................................................... 6-2 6.2 Engine Exhaust After-treatment Systems .................................................................. 6-4 6.3 Fuel Modifications and Alternative Fuels.................................................................. 6-6 6.4 Advanced Technologies........................................................................................... 6-12 6.5 Summary .................................................................................................................. 6-12 7. COST-EFFECTIVENESS ANALYSIS ............................................................................. 7-1
7.1 Costs Summary .......................................................................................................... 7-1 7.2 Cost-Effectiveness Summary..................................................................................... 7-3
8. CONCLUSIONS AND RECOMMENDATIONS............................................................. 8-1
8.1 Assumptions............................................................................................................... 8-1 8.2 Conclusions................................................................................................................ 8-2 8.3 Recommendations for Further Study ......................................................................... 8-5
9. REFERENCES..................................................................................................................... 9-1
APPENDICES Appendix A: Data Gathering Survey of Cruise Ships Appendix B: Lloyd’s Vessel and Generator Data Appendix C: Photographs of General Conditions of the Visible Distribution Lines and Underground Vaults in the Area of the Mission and Embarcadero Substations. Appendix D: Breakdown Cost Estimates for a Shoreside Power System Appendix E: PG&E E-20 Rate Schedules Appendix F: Responses to Comments on Draft Final Report for the PoSF Shoreside Power Feasibility Project, August 8, 2005
TABLES Table 2-1. Cruise ship port call data at the Port of San Francisco in 2004 ........................... 2-2 Table 2-2. General vessel data for cruise ships called at the Port of San Francisco in 2004.............................................................................. 2-3 Table 2-3. 2005 Port call data and general vessel data for DAWN PRINCESS................... 2-4 Table 2-4. Vessel engine and generator data extracted from the Lloyd’s database for the recommended candidate cruise ships. .......................... 2-5 Table 3-1. Summary of generator engine and fuel data for selected cruise ships provided by the ship operators ......................................................... 3-3 Table 3-2. Nominal shoreside power consumption for selected cruise ships provided by the ship operators ......................................................... 3-3 Table 4-1. Summary of port call data for selected cruise ships. ........................................... 4-1 Table 4-2. US EPA (1999b, 2003) baseline emission factors for marine engines. ............... 4-2 Table 4-3. Emission factors for auxiliary engines used in the
September 2005 Final Report
iii
PoLA emission inventory report.......................................................................... 4-2 Table 4-4. Emission factors found in the IVL 2004 report for average 1999 conditions. .... 4-3 Table 4-5. Gas turbine engines.............................................................................................. 4-4 Table 4-6. Vessel calls and average berthing (hotelling) time for 2004. .............................. 4-6 Table 4-7. Operator provided or estimated auxiliary load for cruise ships........................... 4-7 Table 4-8. Vessel auxiliary engine types............................................................................... 4-8 Table 4-9. 2004 annual auxiliary power transit and berthing emission estimates ................ 4-9 Table 4-10. 2004 per call auxiliary power emission estimates ............................................. 4-10 Table 4-11. Annual shoreside power fuel consumption and emission estimates for the selected candidate cruise ships ............................................... 4-12 Table 4-12. Shoreside power fuel consumption and emission estimates per port call for the selected candidate cruise ships........................................... 4-12 Table 4-13. Powerplant emission factors .............................................................................. 4-12 Table 4-14. Berthing emissions, net shoreside power emission reduction estimates, and percent emission reductions for the selected candidate cruise ships. .............................................................. 4-13 Table 4-15. 2004 load-weighted average per call berthing and transit emissions associated with auxiliary loads, and projected 2020 berthing and transit emissions................................................................... 4-14 Table 5-1. Possible power source and distribution distance. ................................................ 5-7 Table 5-2. Preliminary opinion of construction costs for possible power sources................ 5-8 Table 5-3. Summary of cost estimates for a conceptual shoreside power system for cruise ships berthed at the Port of San Francisco.................. 5-14 Table 5-4. Summary of annual operating cost estimates for operating the conceptual reel towers.................................................................................. 5-14 Table 5-5. Classification societies for the three selected cruise ships without shoreside power capability ................................................................... 5-15 Table 5-6. Proposed sequence of events for connections of shoreside power .................... 5-21 Table 5-7. Proposed sequence of events for termination of shoreside power..................... 5-22 Table 5-8. Sample vessel and 4-vessel cohort load demands for energy cost estimates..... 5-25 Table 5-9 Annual fuel savings for selected ships............................................................... 5-26 Table 6-1. Engine modification alternatives ......................................................................... 6-3 Table 6-2. Potential exhaust after-treatment alternatives...................................................... 6-4 Table 6-3. Fuel specifications for the four vessels studied. .................................................. 6-6 Table 6-4. Summary cost and effectiveness for alternative control measures for 4-vessel cohort.............................................................................. 6-13 Table 7-1. Cost Summary for individual vessels and vessel cohorts (2 vessels DAWN and REGAL PRINCESS, 3 vessels add MERCURY) ........................... 7-2 Table 7-2. Emission reduction and cost-effectiveness summary (2 vessels DAWN and REGAL PRINCESS, 3 vessels add MERCURY). .......................... 7-3 Table 8-1. Summary of emission benefits and cost-effectiveness results of shoreside power.................................................................................... 8-4 Table 8-2. Summary of costs, emission reductions, and cost effectiveness of alternative control measures for four-vessel cohort scenario .......................... 8-5

September 2005 Final Report
iv
FIGURES Figure 4-1. Schematic map of study area ............................................................................... 4-5 Figure 4-2. Comparison of 2004 and 2020 berthing emissions............................................ 4-15 Figure 4-3. Comparison of 2004 and 2020 transit emissions. .............................................. 4-15 Figure 5-1. A schematic illustrating the PG&E substations within the local electric transmission system.................................................................. 5-5 Figure 5-2. A schematic illustrating the three candidate power sources and routes for a distribution and transmission infrastructure for shoreside power.............................................................................................. 5-6 Figure 5-3. Conceptual plan of a one-berth shoreside power system for the Port of San Francisco ............................................................................. 5-11 Figure 5-4. Conceptual plan of a two-berth shoreside power system for the Port of San Francisco ............................................................................. 5-12 Figure 5-5. Conceptual design of a cable reel tower for a shoreside power system............. 5-13

September 2005 Final Report
H:\POSF\Report\Final_091205\Final\Sec 1.doc` 1-1
1. INTRODUCTION 1.1 Background The Port of San Francisco has entered into a development and lease agreement with a developer to build a mixed use/cruise terminal facility at Piers 30-32. The cruise terminal will be named the James R. Herman International Cruise Terminal and will become the primary cruise terminal for San Francisco. The existing terminal at Pier 35 does not efficiently meet the current and anticipated increases in cruise ship port calls due to a boom in the cruise industry of the past few years, according to a study funded by the Port1. As part of the implementation of a Mitigation, Monitoring and Reporting Program resulting from the adoption of the California Environmental Quality Act (CEQA) Environmental Impact Report (EIR), the Port Commission established an air and water quality advisory group called the Cruise Terminal Environmental Advisory Committee (CTEAC) to review and recommend additional feasible mitigation measures that could address air and water impacts of cruise ship activity. One of the potential mitigation measures for reducing air pollution impacts is the use of technologies such as shoreside electrical power to reduce hotelling emissions from cruise ships while at berth, by way of allowing the ships to turn off their self generating electrical units2. Alternatives to shoreside power for air emission reduction could include the use of low sulfur fuels and new engine technologies that would reduce emissions not only at berth but also throughout a cruise ship voyage. In October 2004, the Port retained ENVIRON International Corporation (ENVIRON) to lead a team consisting of ENVIRON, Han-Padron Associates, Seaworthy Systems, Inc., and YEI Engineers, Inc., to conduct a study to assess the feasibility and cost-effectiveness of shoreside power and alternative air emission control technologies for cruise ships berthed at the new cruise terminal. This document reports the findings of that study. 1.2 Objectives and Scope of the Study The objectives of the study were to 1) analyze the current and planned vessel operations and berth facilities, 2) identify potential candidate cruise ships to evaluate the feasibility, emissions benefits and associated costs of the use of shoreside power and 3) explore alternative air emissions control technologies while ships are at berth at the cruise terminal to reduce hotelling emissions, as well as other measures that may affect emissions during ship transit in the Bay Area.
The project tasks included:
Selecting candidate cruise ships for shoreside power;
Estimating hotelling power demand;
1 “Alternative Sites for the James Herman Cruise Ship Terminal,” Discussion Draft Report to the Port Commission, Port of San Francisco, CA, September 2, 1998. 2 This is sometimes called “cold ironing”. The phrase is from the period when ships were steam powered, and turning off the boilers that made the steam was called “cold ironing”, because the boilers (“iron”) were no longer generating heat and steam.
September 2005 Final Report
H:\POSF\Report\Final_091205\Final\Sec 1.doc` 1-2
Estimating hotelling mode and transit mode emissions;
Developing conceptual design and cost estimates for a shoreside power system.
Performing cost-effectiveness and feasibility analyses of shoreside power systems and alternative air emissions control technologies; and
Reporting and presenting results of the study.
1.3 Caveats In carrying out this project, several assumptions were necessarily made. In addition, some portions of the analyses could not be carried out in further depth due to either project design uncertainties and/or limitations in the resources available for this project. Aesthetics - The aesthetics of the waterfront in San Francisco are critically important. Because the port is not a typical industrial port, such as the Port of Oakland or the Port of Los Angeles, additional considerations will have to be made regarding the aesthetics of the shoreside power design. The material provided here gives the reader a general understanding of the visual impacts of the shoreside power equipment. Artists’ renderings and such will further facilitate assuring that the equipment for shoreside power is aesthetically acceptable. Candidate ships - Four candidate ships were selected for this study, representing the likely mix of visiting ships in future years. Actual ships and frequency of visits will be different. Nevertheless, this selection of ships is likely a reasonable approximation of the minimum port use patterns, and thus the most conservative assumption for cost-effectiveness evaluations. Cost of ship modification - A related assumption is that the cost of the ship modifications needed for shoreside power are assigned as if the Port of San Francisco were the only port at which the ships used shoreside power. Costs are NOT amortized over several ports. For this study, we assumed that the ships needing such conversion were doing so only because of the San Francisco program. However, if, for example, a single ship uses shoreside power at a port other than the Port of San Francisco, shipside modification costs should be halved for the purpose of this study. Thus, the results presented here are a “worst case” or conservative estimate of the cost effectiveness. Electrical Energy Provider – In assessing the overall cost effectiveness of shoreside electrification, the provider of the energy, the cost rate of that energy, and the allocation of the construction and operating costs for the shoreside portion of the project design needs to be eventually determined. In carrying out this work, we could not, and did not establish firm electrical rates, nor did we determine who would likely bear the costs of various shoreside infrastructures. A range of rate structures estimated by PG&E for one vessel, and four-vessel cohort scenarios utilizing shoreside power were used in this study. Feasibility, not design and implementation – As noted previously, this is a feasibility study. If, upon the basis of this report and other information, it is decided to proceed with shoreside power provisions, full engineering design and cost analyses are yet to be carried out. Some of that would be done by the electricity provider, some by the transmission provider, some by the developer, and some by the ship owners.
September 2005 Final Report
H:\POSF\Report\Final_091205\Final\Sec 1.doc` 1-3
Safety – Installations elsewhere, in both cruise and industrial port areas have shown that safe movement of goods and people are not negatively affected by the shoreside power equipment. Service level – A characteristic of the Port of San Francisco is that many ships (and cruise lines) visit, but only a few visit often. The shoreside projects in Juneau, Alaska and Seattle, Washington, involve mainly one cruise line and a high number of ship calls. Shoreside infrastructure costing – Because this is a “conceptual” or “feasibility study”, it was beyond the scope of this project to do detailed engineering design. Nevertheless, we did carry out general engineering design, based on similar installations elsewhere, to arrive at costs and general descriptions of the proposed facility. A significant uncertainty in this study relates to how the shoreside infrastructure cost in bringing electricity to the pier(s) should be allocated between the pier (concession operations, etc.) and the ship electricity demands through shoreside power. A careful examination of this requires a full scale power provider study to reconcile. 1.4 Report Organization Section 2 presents the recommendations on candidate cruise ships for shoreside power at the new cruise ship terminal. Sections 3 and 4 discuss the results of the hotelling mode power demand and emission analyses, respectively, for the selected cruise ships, as well as estimates for other cruise ships in the 2004 port call data. Section 5 presents a conceptual design and cost estimates for a shoreside power system. Section 6 discusses alternative control technologies for cruse ships to reduce hotelling and transit emissions. Section 7 presents the results of cost-effectiveness analyses of the shoreside power system and alternative control technologies for reducing emissions, as well as some discussion on potential funding sources for shoreside power. Section 8 presents the conclusions of the study. Section 9 provides references cited in the report. Several appendices contain back up data used in the study, as well as responses to comments received on the draft final report.

September 2005 Final Report
H:\POSF\Report\Final_091205\Final\Sec 2.doc 2-1
2. SELECTION OF POTENTIAL CRUISE SHIPS FOR SHORESIDE POWER This section presents the recommendations on candidate cruise ships for shoreside power at the new cruise ship terminal. The recommendations were based on the review of the 2004 and proposed/estimated 2005 port call data provided by the Port (PoSF, 2004)1 for cruise ships berthed at the Port’s cruise ship terminal, as well as vessel engine/generator information obtained from the Lloyd’s database (Lloyd, 2004) for those cruise ships. 2.1 Data Gathering For Cruise Ship Selection As part of the data gathering effort in the cruise ship selection task, ENVIRON developed a two-phase data gathering questionnaire to facilitate the cruise ship selection. The first phase was to collect from the Port the past 12-month vessel call records for all ships that berthed at the Port’s existing cruise ship terminal. PoSF, 2004, included the following information:
• Vessel name • Vessel IMO ID • Vessel type code • Vessel gross tonnage • Vessel date of build • Arrival dates/times • Departure dates/times • Flag • Operator’s name • Agent name
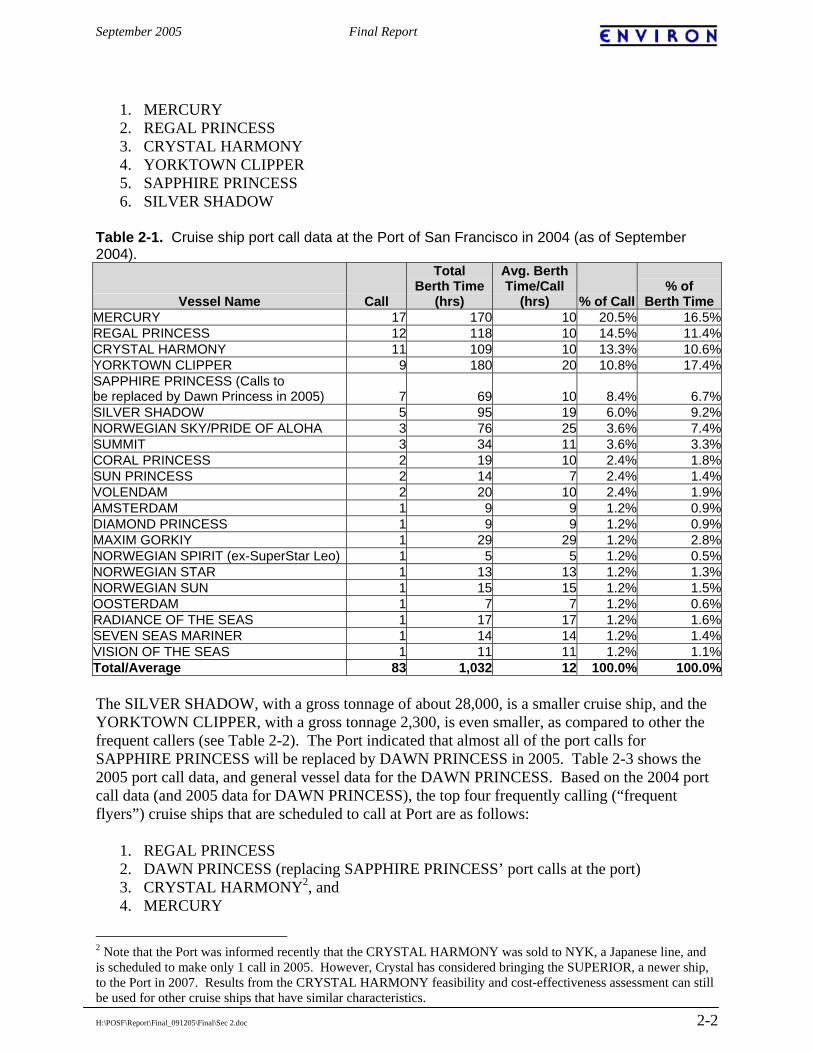
In addition, the Port also provided the 2005 port call schedule (PoSF, 2004) for cruise ships that are scheduled to call at the Port’s cruise ship terminal. Based on these 2004 and 2005 port call data, as well as available vessel engine/generator data from the Lloyd’s database, ENVIRON recommended four vessels as potential candidate cruise ships to be studied for cost and feasibility of shoreside power to reduce hotelling emissions while at berth. After receiving approval from the Port on the recommended candidate cruise ships, the Port assisted ENVIRON in gathering detailed ship and machinery data required for the shoreside power analysis from operators of the selected cruise ships. The data gathering questionnaire is attached with this report as Appendix A. 2.2 Port Call Data Analysis Table 2-1 summarizes the PoSF, 2004 port call data. As shown in Table 2-1, there was a total of 83 port calls in 2004 for a total of 1,032 hours of berth time from 21 cruise ships, with an average berth time of about 12 hours for the 2004 vessel fleet. The top six most frequently calling cruise ships at the Port’s cruise ship terminal in 2004 were as follows: 1 The 2004 and 2005 port call data were provided by the Port in September 2004, and these port call data or schedule might have been revised since then.
September 2005 Final Report
H:\POSF\Report\Final_091205\Final\Sec 2.doc 2-2
1. MERCURY 2. REGAL PRINCESS 3. CRYSTAL HARMONY 4. YORKTOWN CLIPPER 5. SAPPHIRE PRINCESS 6. SILVER SHADOW
Table 2-1. Cruise ship port call data at the Port of San Francisco in 2004 (as of September 2004).
Vessel Name Call
Total Berth Time
(hrs)
Avg. Berth Time/Call
(hrs) % of Call % of
Berth TimeMERCURY 17 170 10 20.5% 16.5%REGAL PRINCESS 12 118 10 14.5% 11.4%CRYSTAL HARMONY 11 109 10 13.3% 10.6%YORKTOWN CLIPPER 9 180 20 10.8% 17.4%SAPPHIRE PRINCESS (Calls to be replaced by Dawn Princess in 2005) 7 69 10 8.4% 6.7%SILVER SHADOW 5 95 19 6.0% 9.2%NORWEGIAN SKY/PRIDE OF ALOHA 3 76 25 3.6% 7.4%SUMMIT 3 34 11 3.6% 3.3%CORAL PRINCESS 2 19 10 2.4% 1.8%SUN PRINCESS 2 14 7 2.4% 1.4%VOLENDAM 2 20 10 2.4% 1.9%AMSTERDAM 1 9 9 1.2% 0.9%DIAMOND PRINCESS 1 9 9 1.2% 0.9%MAXIM GORKIY 1 29 29 1.2% 2.8%NORWEGIAN SPIRIT (ex-SuperStar Leo) 1 5 5 1.2% 0.5%NORWEGIAN STAR 1 13 13 1.2% 1.3%NORWEGIAN SUN 1 15 15 1.2% 1.5%OOSTERDAM 1 7 7 1.2% 0.6%RADIANCE OF THE SEAS 1 17 17 1.2% 1.6%SEVEN SEAS MARINER 1 14 14 1.2% 1.4%VISION OF THE SEAS 1 11 11 1.2% 1.1%Total/Average 83 1,032 12 100.0% 100.0% The SILVER SHADOW, with a gross tonnage of about 28,000, is a smaller cruise ship, and the YORKTOWN CLIPPER, with a gross tonnage 2,300, is even smaller, as compared to other the frequent callers (see Table 2-2). The Port indicated that almost all of the port calls for SAPPHIRE PRINCESS will be replaced by DAWN PRINCESS in 2005. Table 2-3 shows the 2005 port call data, and general vessel data for the DAWN PRINCESS. Based on the 2004 port call data (and 2005 data for DAWN PRINCESS), the top four frequently calling (“frequent flyers”) cruise ships that are scheduled to call at Port are as follows:
1. REGAL PRINCESS 2. DAWN PRINCESS (replacing SAPPHIRE PRINCESS’ port calls at the port) 3. CRYSTAL HARMONY2, and 4. MERCURY
2 Note that the Port was informed recently that the CRYSTAL HARMONY was sold to NYK, a Japanese line, and is scheduled to make only 1 call in 2005. However, Crystal has considered bringing the SUPERIOR, a newer ship, to the Port in 2007. Results from the CRYSTAL HARMONY feasibility and cost-effectiveness assessment can still be used for other cruise ships that have similar characteristics.
September 2005 Final Report
H:\POSF\Report\Final_091205\Final\Sec 2.doc 2-3
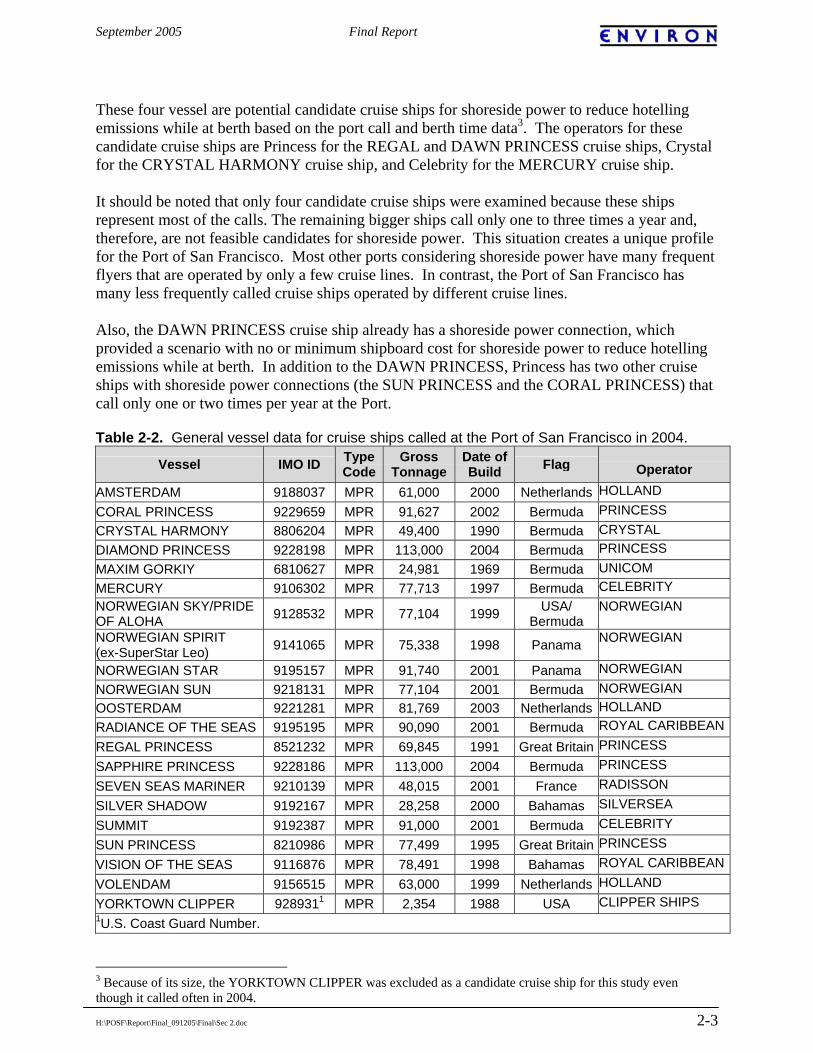
These four vessel are potential candidate cruise ships for shoreside power to reduce hotelling emissions while at berth based on the port call and berth time data3. The operators for these candidate cruise ships are Princess for the REGAL and DAWN PRINCESS cruise ships, Crystal for the CRYSTAL HARMONY cruise ship, and Celebrity for the MERCURY cruise ship. It should be noted that only four candidate cruise ships were examined because these ships represent most of the calls. The remaining bigger ships call only one to three times a year and, therefore, are not feasible candidates for shoreside power. This situation creates a unique profile for the Port of San Francisco. Most other ports considering shoreside power have many frequent flyers that are operated by only a few cruise lines. In contrast, the Port of San Francisco has many less frequently called cruise ships operated by different cruise lines. Also, the DAWN PRINCESS cruise ship already has a shoreside power connection, which provided a scenario with no or minimum shipboard cost for shoreside power to reduce hotelling emissions while at berth. In addition to the DAWN PRINCESS, Princess has two other cruise ships with shoreside power connections (the SUN PRINCESS and the CORAL PRINCESS) that call only one or two times per year at the Port. Table 2-2. General vessel data for cruise ships called at the Port of San Francisco in 2004.
Vessel IMO ID Type Code
Gross Tonnage
Date of Build Flag
Operator
AMSTERDAM 9188037 MPR 61,000 2000 Netherlands HOLLAND CORAL PRINCESS 9229659 MPR 91,627 2002 Bermuda PRINCESS CRYSTAL HARMONY 8806204 MPR 49,400 1990 Bermuda CRYSTAL DIAMOND PRINCESS 9228198 MPR 113,000 2004 Bermuda PRINCESS MAXIM GORKIY 6810627 MPR 24,981 1969 Bermuda UNICOM MERCURY 9106302 MPR 77,713 1997 Bermuda CELEBRITY NORWEGIAN SKY/PRIDE OF ALOHA 9128532 MPR 77,104 1999 USA/
Bermuda NORWEGIAN
NORWEGIAN SPIRIT (ex-SuperStar Leo) 9141065 MPR 75,338 1998 Panama NORWEGIAN
NORWEGIAN STAR 9195157 MPR 91,740 2001 Panama NORWEGIAN NORWEGIAN SUN 9218131 MPR 77,104 2001 Bermuda NORWEGIAN OOSTERDAM 9221281 MPR 81,769 2003 Netherlands HOLLAND RADIANCE OF THE SEAS 9195195 MPR 90,090 2001 Bermuda ROYAL CARIBBEANREGAL PRINCESS 8521232 MPR 69,845 1991 Great Britain PRINCESS SAPPHIRE PRINCESS 9228186 MPR 113,000 2004 Bermuda PRINCESS SEVEN SEAS MARINER 9210139 MPR 48,015 2001 France RADISSON SILVER SHADOW 9192167 MPR 28,258 2000 Bahamas SILVERSEA SUMMIT 9192387 MPR 91,000 2001 Bermuda CELEBRITY SUN PRINCESS 8210986 MPR 77,499 1995 Great Britain PRINCESS VISION OF THE SEAS 9116876 MPR 78,491 1998 Bahamas ROYAL CARIBBEANVOLENDAM 9156515 MPR 63,000 1999 Netherlands HOLLAND YORKTOWN CLIPPER 9289311 MPR 2,354 1988 USA CLIPPER SHIPS 1U.S. Coast Guard Number. 3 Because of its size, the YORKTOWN CLIPPER was excluded as a candidate cruise ship for this study even though it called often in 2004.

September 2005 Final Report
H:\POSF\Report\Final_091205\Final\Sec 2.doc 2-4
Table 2-3. 2005 Port call data and general vessel data for DAWN PRINCESS.
Vessel Name Call Total Berth Time (hrs)
Avg. Berth Time/Call
(hrs) % of Call % of Berth
Time 12 125 10 16.4% 16.0%
IMO ID Type Code Gross Tonnage
Date of Build
Flag & Operator DAWN PRINCESS
9103996 MPR 77,499 1997 Bermuda;
PRINCESS 2.3 Vessel Engine/Generator Data In addition to port call and berth time, the emissions from hotelling also depend on the type of vessel engines/generators that are used to generate power for hotelling. For instance, gas turbine engines generally produce lower criteria emissions, especially NOx and PM emissions, than conventional diesel engines. However, the fuel costs for turbines can be significant because the turbines are less efficient (consume 40% more than a diesel engine) and the fuel costs are much higher. Table 2-4 shows the vessel engine and generator data extracted from the Lloyd’s database for the potential candidate cruise ships4. Appendix B tabulates the vessel engine/generator data for all the cruise ships that called at the Port in 2004, except the smallest cruise ship berthed at the Port, YORKTOWN CLIPPER, as there was no information available from the Lloyd’s database for this vessel. As shown in Table 2-4, all four of these candidate cruise ships use diesel engines to generate 6.6 kV, 3-phase, 60 Hz power for hotelling while at berth. Also, all of the candidate cruise ships, except the MERCURY cruise ship, use four main diesel engines driving four generators to deliver 6.6 kV, 3-phase, 60 Hz power. In addition to the main generators, the CRYSTAL HARMONY also has 2 smaller auxiliary diesel engines and an auxiliary generator to deliver 6.6 kV, 3-phase, 60 Hz power, and the DAWN PRINCESS also has a smaller auxiliary generator to deliver 400 volt, 3-phase, 60 Hz power for low voltage applications. The MERCURY has two main propulsion diesel engines, four bigger auxiliary diesel engines driving four generators to deliver 6.6 kV, 3-phase, 60 Hz power, and a smaller auxiliary diesel engine driving an auxiliary generator for low voltage applications.
4 These Lloyd data were considered as preliminary data, and were used along with the port call data for candidate cruise selection purposes only. Actual engine and generator data for the selected cruise ships were collected from the Phase 2 data gathering effort.

September 2005 Final Report
H:\POSF\Report\Final_091205\Final\Sec 2.doc 2-5
Table 2-4. Vessel engine and generator data extracted from the Lloyd’s database for the recommended candidate cruise ships.
Main Engine Main Generator Vessel
Units Maker Model kW Units Maker Model kW Voltage Frequency
CRYSTAL HARMONY 4 MAN/Mitsubishi 8L58/64 8640 4 Stromberg N/K 8250 6600 60
DAWN PRINCESS 4 Fincantieri/Sulzer 16ZAV40S 11650 4 Not Reported
Not Reported 11128 6600 60
2 MAN B&W 6L48/60 6300MERCURY
2 MAN B&W 9L48/60 9450
Not Applicable
REGAL PRINCESS 4 MAN B&W 8L58/64 9720 4 Not Reported
Not Reported 9410 6600 60
Auxiliary Engine Auxiliary Generator
Vessel Units Maker Model kW Units Maker Model kW Voltage Frequency
1 Wartsila 8R32E 3240CRYSTAL HARMONY 1 Detroit Diesel USA 8163-7305 612
1 Stromberg NA 3000 6600 60
DAWN PRINCESS 1 Not Reported 1 NA NA 600 440 60
4 MAN B&W DIESELGEU 6L-40/54 4420 4 KAICK DIDBN 4100 6600 60
MERCURY 1 CUMMINSUSA KTA-50G2 1007 1 KAICK DSG 840 660 60
REGAL PRINCESS 0 Not Applicable 0 Not Applicable
2.4 Candidate Cruise Ship Recommendations Based on the port call and the vessel engine/generator data, ENVIRON recommended the following vessels as candidate cruse ships for shoreside power feasibility and cost-effectiveness analyses to reduce hotelling emissions while at berth at the Port’s cruise ship terminals.
1. REGAL PRINCESS 2. DAWN PRINCESS 3. CRYSTAL HARMONY, 4. MERCURY
After receiving approval from the Port on these recommended cruise ships, ENVIRON worked with the Port to conduct Phase 2 of the data gathering effort to gather detailed engine vessel and machinery data from the operators of these cruise ships. These data were used in the power demand and emission analyses, as well as in the assessment of anticipated shipside alteration needs to accommodate the shoreside power system.

September 2005 Final Report
H:\POSF\Report\Final_091205\Final\Sec 3.doc 3-1
3. HOTELLING MODE POWER DEMAND ANALYSIS This section presents the results of the hotelling power demand analysis for the selected cruise ships based on the data received from their operators and from port call data provided by the Port. For comparison purposes, the shoreside power facility at Juneau, Alaska was reviewed and summarized in this section. Other available and applicable information and data for shoreside power projects at other ports while this study was conducted were also used and/or referenced in the report. Again, the cruise ship fleet profile for the Port has many less frequently calling cruise ships that are operated by various cruise lines. This makes the Port unique and different from other ports, which have many frequently calling ships that are operated by one or a small number of cruise lines (i.e., solitary usage of cruise lines). Also, it should be noted that the Port is the only cruise terminal facility contemplating the feasibility of a shoreside power facility that may serve a range of cruise lines. As discussed in Section 2, four candidate vessels were selected for a feasibility study of shoreside power at the James R. Herman International Cruise Terminal, Piers 30-32, Port of San Francisco, based on a detailed analysis of cruise ship activity at the Port. The selected ships are the CELEBRITY MERCURY, CRYSTAL HARMONY, DAWN PRINCESS, and REGAL PRINCESS. The DAWN PRINCESS was previously modified to receive shoreside hotelling power at Juneau, Alaska. The other three ships are not currently equipped to receive shoreside hotelling power. 3.1 Princess Cruises Shoreside Power Facility Juneau, Alaska The Princess Cruises Shoreside Power facility at Juneau, Alaska is a unique installation. It uses a nearby hydroelectric power station to supply both hotelling electricity and an electrically generated heating steam (from a land based steam generator) to the ship. The hydroelectric plant produces zero emissions and arguably represents an environmentally ideal renewable energy source. Construction of the facility and the initiation of operations with the ship were expeditiously accomplished in six months. Due to the twenty-foot tidal action at Juneau, a substantial structure and facility are required to position and support the hotelling power supply cables and steam heat connections between the ship and shore. A 135-foot long, 25-foot high gantry and festoon system provide the flexibility in cable and hose connections required to accommodate tidal action and other ship movements at dockside. However, no construction of this magnitude should be required at the Port of San Francisco because tidal action in the San Francisco Bay is generally less than ten feet1, and no steam connections are required. The Juneau, Alaska system is rated to deliver 16.25 mega watts (MW) of ship hotelling electricity, with estimated 7 to 11 MW of ship hotelling electrical loads, and 4 to 6 MW of ship steam loads. Four 3-inch electric power cables connect the ship and shore substation, using quick acting plugs and receptacles developed for the mining industry. These shore power cables
1 http://sfports.wr.usgs.gov/cgi-bin/TS-Plot.cgi

September 2005 Final Report
H:\POSF\Report\Final_091205\Final\Sec 3.doc 3-2
and the steam heating system hoses are routed through a watertight door on the port side of the ship. A new steel bulkhead has been installed adjacent to the shipboard cable run in order to comply with high voltage fire protection requirements. An onboard power management system (PMS) automatically synchronizes the shore power supply with the ship electrical generators. All shore power functions aboard Princess Cruise Lines cruise ships with shoreside power capability (e.g., the DAWN PRINCESS) are managed under the direct supervision of ship engineering officers. It is anticipated that the Port of San Francisco’s conceptual shore power system will likely follow along the same lines, with similar shipboard engineering design and operating considerations. As an example, all four of the selected vessels are fitted with 6.6 kV, 60 Hertz electric systems. However, no shore supply of steam heat at the Port of San Francisco cruise ship terminal is currently under consideration. As noted earlier the Port served nine cruise lines and 21 different ships in 2004. Since the Juneau facility only serves Princess Cruise Lines and no other cruise lines, it is unique and may or may not serve as an industry-wide model or a model for the Port of San Francisco. 3.2 Dockside Load Data for Selected Cruise Ships The feasibility and cost effectiveness of reducing hotelling emissions via a shore power system or alternative control technologies are dependent upon, among others, the dockside load profile, safety requirements, and marine engineering design specifications of the ships in question. The proposed shore power supply would be used in lieu of shipboard diesel electric generators to furnish ship energy requirements at dockside. As discussed in Section 2, each of the four selected cruise ships has a different combination of propulsion and electric power generating equipment. On the REGAL PRINCESS, DAWN PRINCESS, and CRYSTAL HARMONY, diesel electric propulsion/auxiliary engine generators are used to furnish hotel power at dockside. On the CELEBRITY MERCURY, dockside hotel power is provided by on-board ship service diesel generator sets (also called “gensets”). For the purpose of this study, the information of primary significance concerns the unit (or units) used to generate the hotel power at dockside, specifically the manufacturer, model, power rating in kiloWatts (kW) and type of fuel. These data are tabulated in Table 3-1. Table 3-2 shows the nominal shoreside power consumption data for each of the four selected ships. This information was provided by the cruise ship operators. As shown in Table 3-1, the engine and generator data provided by the cruise ship operators were slightly different from those found in the Lloyd’s database (Table 2-4).

September 2005 Final Report
H:\POSF\Report\Final_091205\Final\Sec 3.doc 3-3
Table 3-1. Summary of generator engine and fuel data for selected cruise ships provided by the ship operators.
Vessel Name
Gross
Tonnage
Number of Generator
Engines Used
Make & Model
Rated Power
(kW)
Diesel Fuel
CELEBRITY MERCURY 77713 3 MAN B&W 6L-40/54
4,320 IFO 380
CRYSTAL HARMONY 49400 1 MHI-MAN B&W 8L58/64
8,640 MDO, 1SO DMB
DAWN PRINCESS 77499 1 WARTSILA SULZER
16ZAV40S
11,650 IFO 380
REGAL PRINCESS 69845 1 MAN B&W 8L58/64
9,410 IFO 380/IFO 180 (Alaska)
Table 3-2. Nominal shoreside power consumption for selected cruise ships provided by the ship operators.
Vessel Name
Average Load (kW)
Load Fluctuation (kW)
CELEBRITY MERCURY 9,500 200 CRYSTAL HARMONY 6,000 1,000 to 2,000 DAWN PRINCESS 6,800 200 to 300 REGAL PRINCESS 6,700 200 to 300 3.3 Existing Estimated Dockside Power Demand The reported ship electrical loads in Table 3-2 are considered reasonable. The magnitudes and fluctuations are within expectations considering the major hotel loads of cruise ships, such as air conditioning, ventilation (dependent upon ambient temperature and humidity conditions), and lighting (day versus night). Based upon the furnished data, a dockside power connection capable of delivering at least 10 MW at the ship main switchboard will be adequate for the selected cruise ships. Since ships operate with a power factor of 0.8, a 12.5 MW shore power supply will be required as the minimum to effectively serve all of the selected cruise ships. For purposes of comparison, the Juneau, Alaska, shore facility, which was constructed and initially operated with the DAWN PRINCESS, has a power capacity of 16.25 MW, with estimated 7 to 11 MW for shoreside power. The Port of Seattle was completing a shore power installation to serve the new DIAMOND PRINCESS and SAPPHIRE PRINCESS cruise ships, which requires about 100 MW of shoreside power per call with a nine hour stay2, or about 11 MW of shoreside power demand per vessel. These ships typically make the round-trip to the Juneau facility. ENVIRON's Cold Ironing Cost Effectiveness Study for the Port of Long Beach (ENVIRON, 2004) suggested consideration of a 7.0 MW shoreside power installation to serve the Carnival cruise ship ECSTASY3, which made 52 port calls at the Port of Long Beach in 2003. Other documented installations, studies, and proposals for supplying shoreside power to various types of ocean going vessels have been completed or are being encouraged/developed by the 2 http://www.westcoastdiesel.org/files/outreach/Seattle%20Sept%2030th%20Fact%20Sheet%2003-11-05.pdf. 3 Note that PRINCESS Cruise Line is a subsidiary of the Carnival Corporation.

September 2005 Final Report
H:\POSF\Report\Final_091205\Final\Sec 3.doc 3-4
California Air Resources Board, Port of Los Angeles, and in Europe. It should be noted that the emphasis of these proposals is shoreside power for cargo ships because they represent the vast majority of ship calls at a port. 3.4 Future Estimated Shoreside Power Demand The shoreside power requirement for cruise ships calling at the Port in future years is difficult to ascertain. The cruise industry allocates capital assets comparable to any other business, on the basis of marketing and sales forecasts. The only way higher shoreside power needs can be effectively estimated is by obtaining information on planned calls of larger vessels at the Port. The Port projected that the port calls would steadily increase to 107 by 2020 from 83 in 2004 (PoSF, 2001). One way to estimate future cruise ship hotelling power requirements is by comparing gross tonnage. Roughly speaking, the greater the gross tonnage, the higher the vessel’s hotelling power consumption for air conditioning, ventilation, lighting, galley, laundry, water services, etc. The four ships selected for this study, at 50,000 to 77,713 tons, are not considered particularly large and their hotelling loads are relatively modest compared to other cruise ships in operation. The DIAMOND PRINCESS and SAPPHIRE PRINCESS, which will be using shoreside power at the Port of Seattle, have a gross tonnage of 113,000. The QUEEN MARY 2, at 150,000 tons, is representative of the largest cruise ships afloat. The hotelling load of such ships can easily be on the order of double what was described, above, for the selected cruise ships. It should be noted that the Port’s new cruise ship terminal at Piers 30-32 will be able to physically accommodate the largest of cruise ships, including the QUEEN MARY 2, on the eastern face of the pier, which will be the primary berth and will not require dredging. However, the northern berth will require an initial and periodic dredging, but should be able to accommodate a 1,000 ft cruise ship. The foregoing 12.5 MW shore power estimate for the proposed shoreside power supply is adequate, but limited to ships with hotelling power demands, not necessary the emissions, equal to or less than CELEBRITY MERCURY, the largest of the four vessels selected for the study.

September 2005 Final Report
H:\POSF\Report\Final_091205\Final\Sec 4.doc 4-1
4. AUXILIARY MODE EMISSION ANALYSIS This section presents the results of the hotelling air pollution emission analysis for the selected cruise ships. These estimates were based on the ships’ port call data, average hotelling power load, and emission factors applicable to the diesel generators in these vessels. 4.1 Port Call Data Summary CRYSTAL HARMONY, CELEBRITY MERCURY, and REGAL PRINCESS berth at the Port of San Francisco cruise ship terminal an average of 10 hours per call based on the 2004 port call data. The DAWN PRINCESS was also scheduled to berth at the cruise ship terminal at an average of 10 hours per call based on the 2005 port call data. It was reported that approximately twenty minutes to two hours per operation are required to handle and connect/disconnect shore power cables and steam supply/return hoses at the Juneau, Alaska facility. For the less demanding Port of San Francisco operation, it is considered reasonable that an average of one hour per call will be required following ship arrival to connect and activate, and then another hour prior to departure to deactivate and disconnect the proposed hotelling electric power supply. As a consequence, the practical maximum duration of a shore power supply per port call will be an average 8 hours for these cruise ships. This average berthing time and the number of port calls were used to estimate the shoreside power emissions for each selected cruise ship. It should be noted that the duration of shoreside power will be greater than the time emissions from the ship diesel generator sets are terminated. As a minimum, restarting idle engines involves a warm-up period prior to the resumption of load. Exhaust emissions during the first minute of less of the engine warmup period are likely order of magnitude higher, as compared to emissions during normal operating conditions. However, the overall contribution of the warm-up emissions is small as compared to the total shoreside power emissions. In order to allow time for diesel engine shutdown and warm-up operations, the actual zero hotelling emissions (cold ironing) times will likely be on the order of two hours less per port call than the duration of the ship at the berth. The number of port calls and average berthing time per call for the four selected cruise ships are summarized in Table 4-1. Table 4-1. Summary of port call data for selected cruise ships.
Vessel Name
Port Call Data Number of
Port Calls
Average Berthing Time
(hrs.) CELEBRITY MERCURY 2004 17 10 CRYSTAL HARMONY 2004 11 10 DAWN PRINCESS 2005 12 10 REGAL PRINCESS 2004 12 10

September 2005 Final Report
H:\POSF\Report\Final_091205\Final\Sec 4.doc 4-2
4.2 Emission Factors for Marine Generator Engines Table 4-2 shows the emission factors estimated by the U.S. EPA for Category 2 and 3 engines (EPA, 1999b, 2003). For the Category 2 engines, the average values shown in Table 4-2 were the average values used to estimate the emission reductions from the new emission standards (Samulski, 1999), and are quite similar to the emission factors for the highest power Category 1 engines. For Category 3 engines, EPA relied on a review of the base emission factors by ENVIRON (2002) based on the available data to date when the study was conducted. Table 4-2. US EPA (1999b, 2003) baseline emission factors for marine engines. Engine Category
HC [g/kW-hr]
NOX [g/kW-hr]
CO [g/kW-hr]
PM [g/kW-hr]
Category 2 (5-30 l/cylinder) 0.134 13.36 2.48 0.32
low sulfur Category 3 Medium Speed (> 300 rpm) (> 30 l/cylinder)
0.5* 16.6 0.7 Fuel sulfur dependence
* Converted from kg/tonne units in Lloyds (1995) using 210 (g/kW-hr) for “medium speed” engines. The term “medium speed” refers to Category 3 engines with rated speeds typically of 300 to 750 (or higher) rpm that are typically 4-stroke diesel engines either geared to the propeller or through generators to an electric motor driving the propeller or could also provide electric power for the ship. Category 2 engines are either 2-stroke (GM-EMD or Fairbanks-Morse engines) or 4-stroke engine designs with rated speeds typically, but not always, above 750 rpm used either for propulsion or auxiliary power. Emission factors for these marine engine types were derived from previous reviews and emission measurement studies [EPA (2000), Environment Canada (1997), Lloyds (1995), ETC (1997), BAH (1991), Environment Canada (1999), and TRC (1989)]. Additional studies related to marine engine emissions have been published, including Cooper (2001 and 2003) and the ENTEC (2002) studies. The emission data from these studies were used in the Port of Los Angeles (PoLA) emission inventory report (Starcrest, 2004). Table 4-3 summarizes emission factors from these studies. Table 4-3. Emission factors for auxiliary engines used in the PoLA emission inventory report. Engine Category HC
[g/kW-hr] CO
[g/kW-hr] NOX
[g/kW-hr] PM
[g/kW-hr] Medium Speed – Residual Oil 0.4 1.1 14.7 0.3
Medium Speed – Gas Oil 0.4 1.1 13.9 0.3
The author of the 2002 ENTEC study later published a report to supplement the emission data compiled in that study for marine engines (IVL, 2004). The emission data used in the IVL 2004 study are summarized in Table 4-4 for engines built prior to the MARPOL (1997) requirements.

September 2005 Final Report
H:\POSF\Report\Final_091205\Final\Sec 4.doc 4-3
Table 4-4. Emission factors found in the IVL 2004 report for average 1999 conditions. Engine Category
BSFC1
[g/kW-hr] HC
[g/kW-hr] CO
[g/kW-hr] NOX
[g/kW-hr] PM
[g/kW-hr] Medium Speed – Residual Oil (2.4% sulfur) 215 0.2 1.1 14.0 0.5
Medium Speed – Gas Oil (0.6% sulfur) 205 0.2 1.1 13.2 0.2
Slow Speed – Residual Oil (2.4% sulfur) 195 0.3 0.5 18.1 1.3
Slow Speed – Gas Oil (0.6% sulfur) 185 0.3 0.5 17.0 0.2
1 BSFC is brake specific fuel consumption in g/kW-hr.
A distinction between Category 2 and 3 medium speed engines was not made in the earlier ENTEC report, and therefore the average NOx emission rate is between the Category 2 and 3 medium-speed NOx emission rates from the EPA sponsored work. The PM emission rate for medium speed engines was well under that for slow speed engines using the same high sulfur heavy (residual) oil without an explanation. The PM measured from engines using high sulfur fuels is largely comprised of sulfate aerosols, so it is likely to be sensitive to the temperature of the particulate collection device and in turn the exhaust temperature. Still, there is no technical reason to think that medium speed engines produce lower particulate emissions than slow speed engines when burning the same fuel. In fact, the particulate emission factors in the ENTEC report are identical for medium and slow speed engine during maneuvering (a lower power and less efficient mode) at 2.4 g/kW-hr. For this study, the IVL emission factors were used except for particulate emissions. The particulate emission factors do not correspond to the expected effect of added sulfur in the fuel, especially comparing the medium and slow speed engine emissions on the higher sulfur fuel. Therefore, it is necessary to correct the PM emissions based on the sulfur level in the fuel. The following equation was determined from test data of PM weight change with a change in the fuel sulfur level in an EPA study (EPA, 2002).
SPM adj = BSFC * 7.0 * 0.02247 * 0.01 * (soxfuel - soxbas) Where
soxbas = 0.4% sulfur in the IVL (2004) soxfuel = % sulfur in fuel
PM (g/kW-hr) = 0.2 + SPM adj The equation is derived by estimating that the fuel sulfur partially converts (2.247%) to SO3 (with the remainder emitted as SO2), which rapidly hydrolyzes in the humid exhaust to hydrated sulfuric acid [H2SO4*(7)H2O] and condenses on other particulates. Hence, the molecular weight adjustment of 7.0 (ratio of hydrated sulfuric acid to elemental sulfur). The figure 0.01 in the equation is to adjust values in percent (%) to fractional values. The results of this estimate are consistent with the results from Fleischer et al. (1998), who tested particulate emissions using a nominally 1.5% sulfur fuel oil and found 40 – 60% of the particulate was due to sulfate and water absorbed by the sulfate and at rates exceeding 1 g/kW-hr indicating high emissions levels in general. The method described in equation 1 results in 0.81 and 0.75 g/kW-hr particulate

September 2005 Final Report
H:\POSF\Report\Final_091205\Final\Sec 4.doc 4-4
emission rates for medium and slow speed engines burning 2.4% sulfur fuel, close to the IVL average PM emission rate for these two engine types. In recent public comments, ARB (2005) indicated that it was using a higher PM emission factor generated in ENVIRON (2002) and shown in the equations below. This rate matched one reported (ARB, 2005) data point from recent emissions data collected on-board a vessel. The emissions rate in ENVIRON was derived from in-use data available through 2000, but primarily available only in units of emission per unit of fuel consumed. The measurement of pollutants compared to fuel consumption is generally easier to perform because the emission rate is compared to the sum of all carbon species (most of it in the form of CO2) converted to fuel consumption using the hydrogen to carbon ratio of the fuel and other components such as sulfur. However, the data used to generate this relationship was derived from one source (Lloyds, 1995) and exhibited a dramatic nonlinear relationship with sulfur (especially significant above 2.5% sulfur) contrary to the conventional wisdom of the effect on PM emissions of fuel sulfur. PM (kg/tonne of fuel) = 0.9016 x exp[0.7238 x (fuel sulfur in %)] PM (g/kW-hr) = 1.7 (at fuel consumption rate of 219 g/kW-hr and 3% sulfur fuel) There remains considerable uncertainty about the particulate emissions rates, especially for engines using high sulfur fuels. The IVL (2004) and ENTEC (2002) estimates indicate that the authors consider the uncertainty in the PM-10 emission rates to be in excess of 50%. This may stem from the method of collection, filter handling, or other factors associated with the hygroscopic nature of the particulate formed from diesel engines burning high sulfur fuels. The particulate emissions rates and sulfur relationship used for this work were not intended to be the final word on the subject, but provide a reasonable range of estimates consistent with the best understanding at this time. Another engine type found is the gas turbine, of the kind usually manufactured by General Electric, Pratt and Whitney, or Rolls Royce. It is often found on tactical military ships and occasionally on other diesel-electric drive vessels such as cruise ships. The emissions data available for these types of engines is shown in Table 4-5. While the ETC (1997) emission data were similar to Cooper (2001), the fuel consumption rates measured by ETC (1997) were extraordinarily high. Gas turbines typically use lower sulfur (<0.2% sulfur) fuels, which are reflected in the lower PM emission rates. However, the CO2 emissions and fuel costs for turbines can be higher because the turbines are less efficient (consume 40% more than a diesel engine) and the fuel costs are much higher. Table 4-5. Gas turbine engines.
Engine/Boiler Type BSFC (g/kW-hr)
NOx (g/kW-hr)
HC (g/kW-hr)
CO (g/kW-hr)
PM (g/kW-hr)
Cooper (2001) 294 6.0 0.07 0.09 0.007 ETC (1997) 446 6.5 0.06 0.59 NA
4.3 2004 Transit and Berthing Auxiliary Engine Emission Estimates The total transit and berthing emissions for the cruise ships calling at the Port of San Francisco were estimated in accordance to similar work (POSF, 2001). The scope of the transit emissions analysis includes emissions within 12.5 nautical miles of the Golden Gate where the Harbor

September 2005 Final Report
H:\POSF\Report\Final_091205\Final\Sec 4.doc 4-5
Pilots board and leave vessels, as shown in Figure 4-1. This analysis follows the basic methodology defined by other studies to describe vessel activity (Arcadis, 1999, ENVIRON 2002, and Starcrest, 2004.) In those studies, four different modes (cruise, reduced speed zone, maneuvering, and hotelling) of vessel operations were defined. However, for this study, the cruise mode was not estimated because it occurs outside of the 12.5-mile limit as defined for this study.
Figure 4-1. Schematic map of study area.
According to the San Francisco Bar Pilots (SFBP, 2005), the reduced speed zone mode occurs between when the pilots board and the Golden Gate Bridge. The pilots board and leave vessels at speeds of 10 knots approximately 12.5 nautical miles from the Golden Gate Bridge, but the period of slow down to pick up the pilots is brief, lasting approximately 10 minutes. Once the pilots are on board, the vessels accelerate but do not exceed the speed limit of 15 knots by the time the vessel passes Mile Rock (see Figure 4-1). Therefore, an average speed of 13.5 knots was projected by the SFBP (2005) and used as the average speed for this period. The pilot (SFBP, 2005) also concurred with POSF (2001) that the maneuvering mode lasts approximately 30 minutes in and out of port between the docks and the Golden Gate Bridge. The approach used to estimate emissions from auxiliary power demands used the following equation. The time in mode was determined from all vessels from the distance and speed for the precautionary zone and the estimated or average time for the maneuvering and berthing/hotelling modes. The load in mode was determined from the surveys of the four sample vessels adjusted up for transit modes to reflect higher in-use loads when guests are on-board the vessels. Emission rates account for the latest estimates in emission factors accounting for the engine type (diesel or gas turbine) and fuel type (sulfur level). Emissions = (Time in mode) x (Load in mode) x (Emission rate)

September 2005 Final Report
H:\POSF\Report\Final_091205\Final\Sec 4.doc 4-6
The time in mode was defined for the three modes in this study using the available data and estimates. The precautionary zone mode time was defined by the SFBP (2005) as approximately 55 minutes and, for inbound vessels, encompasses the time when the vessels drop from the service speed in cruise mode in order to pick up the pilots and continue toward port. The outbound mode in the same spatial region was assumed to be equivalent to the inbound trip. The maneuvering time for both in and outbound trips was estimated as 30 minutes by the SFBP (2005). The berthing time was derived from the average of actual time in berth for calls made in 2004 (and estimated for the DAWN PRINCESS in 2005) and are shown in Table 4-6. Table 4-6. Vessel calls and average berthing (hotelling) time for 2004.1, 2
Vessel ID Vessel Name Call Avg. Berth Time/Call
9103996 DAWN PRINCESS1 12 10.4 9106302 MERCURY 17 10.0 8521232 REGAL PRINCESS 12 9.8 8806204 CRYSTAL HARMONY 11 9.9 928931 CG YORKTOWN CLIPPER 9 20.0 9192167 SILVER SHADOW 5 19.0 9128532 NORWEGIAN SKY 3 25.3 9228186 SAPPHIRE PRINCESS 7 9.9 9192387 SUMMIT 3 11.3 6810627 MAXIM GORKIY 1 29.0 9156515 VOLENDAM 2 10.0 9229659 CORAL PRINCESS 2 9.5 9195195 RADIANCE OF THE SEAS 1 17.0 9218131 NORWEGIAN SUN 1 15.0 9210139 SEVEN SEAS MARINER 1 14.0 8210986 SUN PRINCESS 2 7.0 9195157 NORWEGIAN STAR 1 13.0 9116876 VISION OF THE SEAS 1 11.0 9188037 AMSTERDAM 1 9.0 9228198 DIAMOND PRINCESS 1 9.0 9221281 OOSTERDAM 1 6.5 9141065 NORWEGIAN SPIRIT (ex-SuperStar Leo) 1 5.0
1 DAWN PRINCESS did not call in 2004, and values in the table were based on the 2005 port call data. 2 Those vessels in bold were selected for further evaluation of shoreside power. The auxiliary load on the vessel was provided from surveys of the four subject vessels in this work (DAWN PRINCESS, MERCURY, REGAL PRINCESS, and CRYSTAL HARMONY). For other vessels calling in 2004, most were estimated with the average load of the four vessels where specific data was available. The average load was used because there was a weak correlation between gross tonnage and auxiliary load among the four survey vessels. Though some of the larger vessels, for example the SAPPHIRE PRINCESS, may be underestimated here;, this vessel was replaced in 2005 with a smaller one (DAWN PRINCESS). Three vessels were significantly smaller than the survey vessels and the load was adjusted to account for smaller vessel size. Acknowledging that we note a weak correlation with gross tonnage, the load for the MAXIM GORKIY and SILVER SHADOW was assumed to be half that of the CRYSTAL HARMONY based on an approximate ratio of gross tonnage. The YORKTOWN

September 2005 Final Report
H:\POSF\Report\Final_091205\Final\Sec 4.doc 4-7
CLIPPER was a significantly smaller vessel, so a load of 64% of the installed power was assumed. The estimated average auxiliary engine loads at berth are shown in Table 4-7. Table 4-7. Operator provided or estimated auxiliary load for cruise ships.
Vessel Name
Gross Tonnage In Berth Auxiliary Load
(kW) AMSTERDAM 61,000 7,250 CORAL PRINCESS 91,627 7,250 CRYSTAL HARMONY 49,400 6,000 DIAMOND PRINCESS 113,000 7,250 MAXIM GORKIY 24,981 3,000 MERCURY 77,713 9,500 NORWEGIAN SKY 77,104 7,250 NORWEGIAN SPIRIT (ex-SuperStar Leo) 75,338 7,250 NORWEGIAN STAR 91,740 7,250 NORWEGIAN SUN 77,104 7,250 OOSTERDAM 81,769 7,250 RADIANCE OF THE SEAS 90,090 7,250 REGAL PRINCESS 69,845 6,700 SAPPHIRE PRINCESS 113,000 7,250 SEVEN SEAS MARINER 48,015 7,250 SILVER SHADOW 28,258 3,000 SUMMIT 91,000 7,250 SUN PRINCESS 77,499 7,250 VISION OF THE SEAS 78,491 7,250 VOLENDAM 63,000 7,250 YORKTOWN CLIPPER 2,354 1,506 DAWN PRINCESS 77,499 6,800 Notes: The auxiliary load for those vessels in bold were provided by the operators and were subjected to further evaluation of shoreside power. The other vessels were estimated based on gross tonnage and average load for the four selected vessels or reported installed power for the YORKTOWN CLIPPER. For transit modes (precautionary zone and maneuvering modes), the berthing/hotelling auxiliary loads were scaled up by 25% as estimated by Starcrest (2004). Presumably, the higher auxiliary loads during transit are because the vessels are now fully loaded with passengers demanding higher air conditioning, lights, and other electric loads. Another important aspect with regard to the emission rates estimates is the engine and fuel type used for auxiliary and propulsion power. The engine types found on these vessels include primarily large (EPA categorized Category 3) medium speed and gas turbines and are shown in Table 4-8. Because nearly all the vessels that call at the Port are designed for diesel-electric power where there is no distinction between auxiliary and propulsion power, one engine type was used as the auxiliary engine type. Exceptions to this include the MERCURY, which has separate propulsion and auxiliary engines. However the auxiliary engines on the MERCURY are similar in design to other vessels’ propulsion/auxiliary engines. Other exceptions include the MAXIM GORKIY and
September 2005 Final Report
H:\POSF\Report\Final_091205\Final\Sec 4.doc 4-8
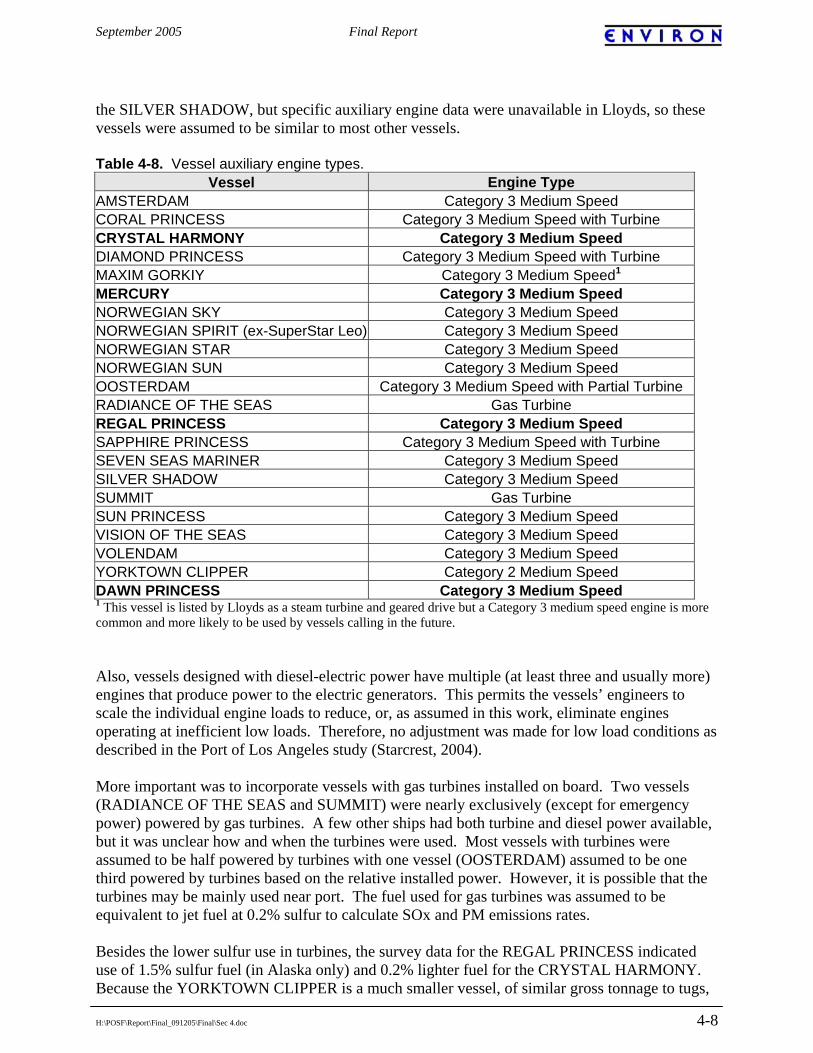
the SILVER SHADOW, but specific auxiliary engine data were unavailable in Lloyds, so these vessels were assumed to be similar to most other vessels. Table 4-8. Vessel auxiliary engine types.
Vessel Engine Type AMSTERDAM Category 3 Medium Speed CORAL PRINCESS Category 3 Medium Speed with Turbine CRYSTAL HARMONY Category 3 Medium Speed DIAMOND PRINCESS Category 3 Medium Speed with Turbine MAXIM GORKIY Category 3 Medium Speed1 MERCURY Category 3 Medium Speed NORWEGIAN SKY Category 3 Medium Speed NORWEGIAN SPIRIT (ex-SuperStar Leo) Category 3 Medium Speed NORWEGIAN STAR Category 3 Medium Speed NORWEGIAN SUN Category 3 Medium Speed OOSTERDAM Category 3 Medium Speed with Partial Turbine RADIANCE OF THE SEAS Gas Turbine REGAL PRINCESS Category 3 Medium Speed SAPPHIRE PRINCESS Category 3 Medium Speed with Turbine SEVEN SEAS MARINER Category 3 Medium Speed SILVER SHADOW Category 3 Medium Speed SUMMIT Gas Turbine SUN PRINCESS Category 3 Medium Speed VISION OF THE SEAS Category 3 Medium Speed VOLENDAM Category 3 Medium Speed YORKTOWN CLIPPER Category 2 Medium Speed DAWN PRINCESS Category 3 Medium Speed 1 This vessel is listed by Lloyds as a steam turbine and geared drive but a Category 3 medium speed engine is more common and more likely to be used by vessels calling in the future. Also, vessels designed with diesel-electric power have multiple (at least three and usually more) engines that produce power to the electric generators. This permits the vessels’ engineers to scale the individual engine loads to reduce, or, as assumed in this work, eliminate engines operating at inefficient low loads. Therefore, no adjustment was made for low load conditions as described in the Port of Los Angeles study (Starcrest, 2004). More important was to incorporate vessels with gas turbines installed on board. Two vessels (RADIANCE OF THE SEAS and SUMMIT) were nearly exclusively (except for emergency power) powered by gas turbines. A few other ships had both turbine and diesel power available, but it was unclear how and when the turbines were used. Most vessels with turbines were assumed to be half powered by turbines with one vessel (OOSTERDAM) assumed to be one third powered by turbines based on the relative installed power. However, it is possible that the turbines may be mainly used near port. The fuel used for gas turbines was assumed to be equivalent to jet fuel at 0.2% sulfur to calculate SOx and PM emissions rates. Besides the lower sulfur use in turbines, the survey data for the REGAL PRINCESS indicated use of 1.5% sulfur fuel (in Alaska only) and 0.2% lighter fuel for the CRYSTAL HARMONY. Because the YORKTOWN CLIPPER is a much smaller vessel, of similar gross tonnage to tugs,

September 2005 Final Report
H:\POSF\Report\Final_091205\Final\Sec 4.doc 4-9
it is likely to use low sulfur fuel, but no adjustment to low sulfur was made for the YORKTOWN CLIPPER. All other vessels (except those with turbines and the CRYSTAL HARMONY) were assumed to use 2.5% sulfur fuel, similar to the reported estimates for the DAWN PRINCESS and MERCURY. From these load and time estimates combined with emission factors specific to the engine and fuel type, emissions were estimated by mode and summed to estimate total emissions for auxiliary loads for these vessels. The emissions estimates for 2004, and those expected in 2005 for the DAWN PRINCESS, are shown in Table 4-9 for annual totals and Table 4-10 per port call. The berthing/hotelling emissions shown in Table 4-9 are higher than those for the emission reductions from shoreside power, which is discussed later in this section, because those estimates subtracted a portion of the time at berth when the electrical loads were transferring to shoreside power. These results show that the berthing-only emissions were between 60 to 90% of the total berthing and transit emissions from auxiliary engines. Table 4-9 also shows that the MERCURY, REGAL PRINCESS, and CRYSTAL HARMONY contributed to more than 50% of the 2004 NOx, PM and SOx emissions estimated for all port call data. If substituting the SAPPHIRE PRINCESS’ emissions with DAWN PRINCESS’ emissions, the selected four cruise ships contributed to more than 60% of the NOx, PM and SOx emissions estimated for all 2004 port call data. Also, the PM and SOx emissions from CRYSTAL HARMONY were significantly lower than other vessels with similar sizes and activities because it used low sulfur (0.2%) lighter fuel. Table 4-9. 2004 annual auxiliary power transit and berthing emission estimates.
Berthing Only (tons/year) Transit Only (tons/year)
Vessel ID Name Calls HC CO NOx PM SOx
Fuel
Cons. HC CO NOx PM SOx
Fuel
Cons.
9103996 DAWN PRINCESS1 12 0.28 0.47 13.12 0.85 9.85 201 0.10 0.16 4.49 0.29 3.37 69
9106302 MERCURY 17 0.53 0.89 24.92 1.62 18.71 383 0.19 0.32 8.88 0.58 6.67 1368521232 REGAL
PRINCESS 12 0.26 0.44 12.20 0.79 9.16 187 0.09 0.16 4.42 0.29 3.32 688806204 CRYSTAL
HARMONY 11 0.22 0.36 9.52 0.10 0.59 151 0.08 0.13 3.42 0.03 0.21 549192167 SILVER
SHADOW 5 0.09 0.16 4.40 0.29 3.30 64 0.02 0.03 0.83 0.05 0.62 11928931 CG YORKTOWN
CLIPPER 9 0.06 0.33 4.18 0.24 3.14 68 0.01 0.06 0.75 0.04 0.56 139128532 NORWEGIAN
SKY 3 0.18 0.30 8.50 0.55 6.38 131 0.03 0.04 1.20 0.08 0.90 189228186 SAPPHIRE
PRINCESS 7 0.10 0.16 5.51 0.25 3.70 140 0.04 0.06 1.99 0.09 1.34 519192387 SUMMIT 3 0.02 0.02 1.63 0.00 0.31 80 0.01 0.01 0.51 0.00 0.10 256810627 MAXIM
GORKIY 1 0.03 0.05 1.34 0.09 1.01 21 0.00 0.01 0.17 0.01 0.12 39156515 VOLENDAM 2 0.05 0.08 2.24 0.15 1.68 34 0.02 0.03 0.80 0.05 0.60 129229659 CORAL
PRINCESS 2 0.03 0.04 1.52 0.07 1.02 39 0.01 0.02 0.57 0.03 0.38 159195195 RADIANCE
OF THE SEAS 1 0.01 0.01 0.81 0.00 0.16 40 0.00 0.00 0.17 0.00 0.03 89218131 NORWEGIAN
SUN 1 0.04 0.06 1.68 0.11 1.26 26 0.01 0.01 0.40 0.03 0.30 69210139 SEVEN SEAS
MARINER 1 0.03 0.06 1.57 0.10 1.18 24 0.01 0.01 0.40 0.03 0.30 68210986 SUN
PRINCESS 2 0.03 0.06 1.57 0.10 1.18 24 0.02 0.03 0.80 0.05 0.60 129195157 NORWEGIAN
STAR1 0.03 0.05 1.45 0.09 1.09 22 0.01 0.01 0.40 0.03 0.30 6

September 2005 Final Report
H:\POSF\Report\Final_091205\Final\Sec 4.doc 4-10
Berthing Only (tons/year) Transit Only (tons/year)
Vessel ID Name Calls HC CO NOx PM SOx
Fuel
Cons. HC CO NOx PM SOx
Fuel
Cons.STAR
9116876 VISION OF THE SEAS 1 0.03 0.04 1.23 0.08 0.92 19 0.01 0.01 0.40 0.03 0.30 6
9188037 AMSTERDAM 1 0.02 0.04 1.01 0.07 0.76 15 0.01 0.01 0.40 0.03 0.30 69228198 DIAMOND
PRINCESS 1 0.01 0.02 0.72 0.03 0.48 18 0.01 0.01 0.28 0.01 0.19 79221281 OOSTERDAM 1 0.01 0.02 0.59 0.02 0.42 13 0.01 0.01 0.32 0.01 0.23 79141065 NORWEGIAN
SPIRIT 1 0.01 0.02 0.56 0.04 0.42 9 0.01 0.01 0.40 0.03 0.30 61 Dawn Princess did not call in 2004; values were estimated based on 2005 port call data. Table 4-10. 2004 per call auxiliary power emission estimates.
Berthing Only (tons per call) Transit Only (tons per call)
Vessel ID Name HC CO NOx PM SOx
Fuel
Cons. HC CO NOx PM SOx
Fuel
Cons.9103996 DAWN
PRINCESS1 0.02 0.04 1.09 0.07 0.82 17 0.01 0.01 0.37 0.02 0.28 69106302 MERCURY 0.03 0.05 1.47 0.10 1.10 23 0.01 0.02 0.52 0.03 0.39 88521232 REGAL
PRINCESS 0.02 0.04 1.02 0.07 0.76 16 0.01 0.01 0.37 0.02 0.28 68806204 CRYSTAL
HARMONY 0.02 0.03 0.87 0.01 0.05 14 0.01 0.01 0.31 0.00 0.02 5928931 CG YORKTOWN
CLIPPER 0.01 0.04 0.46 0.03 0.35 7 0.00 0.01 0.08 0.00 0.06 19192167 SILVER
SHADOW 0.02 0.03 0.88 0.06 0.66 14 0.00 0.01 0.17 0.01 0.12 39128532 NORWEGIAN
SKY 0.06 0.10 2.83 0.18 2.13 44 0.01 0.01 0.40 0.03 0.30 69228186 SAPPHIRE
PRINCESS 0.01 0.02 0.79 0.04 0.53 20 0.01 0.01 0.28 0.01 0.19 79192387 SUMMIT 0.01 0.01 0.54 0.00 0.10 27 0.00 0.00 0.17 0.00 0.03 86810627 MAXIM GORKIY 0.03 0.05 1.34 0.09 1.01 21 0.00 0.01 0.17 0.01 0.12 39156515 VOLENDAM 0.02 0.04 1.12 0.07 0.84 17 0.01 0.01 0.40 0.03 0.30 69229659 CORAL
PRINCESS 0.01 0.02 0.76 0.03 0.51 19 0.01 0.01 0.28 0.01 0.19 79195195 RADIANCE OF
THE SEAS 0.01 0.01 0.81 0.00 0.16 40 0.00 0.00 0.17 0.00 0.03 89218131 NORWEGIAN
SUN 0.04 0.06 1.68 0.11 1.26 26 0.01 0.01 0.40 0.03 0.30 69210139 SEVEN SEAS
MARINER 0.03 0.06 1.57 0.10 1.18 24 0.01 0.01 0.40 0.03 0.30 68210986 SUN PRINCESS 0.02 0.03 0.78 0.05 0.59 12 0.01 0.01 0.40 0.03 0.30 69195157 NORWEGIAN
STAR 0.03 0.05 1.45 0.09 1.09 22 0.01 0.01 0.40 0.03 0.30 69116876 VISION OF THE
SEAS 0.03 0.04 1.23 0.08 0.92 19 0.01 0.01 0.40 0.03 0.30 69188037 AMSTERDAM 0.02 0.04 1.01 0.07 0.76 15 0.01 0.01 0.40 0.03 0.30 69228198 DIAMOND
PRINCESS 0.01 0.02 0.72 0.03 0.48 18 0.01 0.01 0.28 0.01 0.19 79221281 OOSTERDAM 0.01 0.02 0.59 0.02 0.42 13 0.01 0.01 0.32 0.01 0.23 79141065 NORWEGIAN
SPIRIT 0.01 0.02 0.56 0.04 0.42 9 0.01 0.01 0.40 0.03 0.30 61 Dawn Princess did not call in 2004; values were estimated based on 2005 port call data.
September 2005 Final Report
H:\POSF\Report\Final_091205\Final\Sec 4.doc 4-11
4.4 Shoreside Power Emission Estimates This section describes emission estimates for initiatives to reduce emissions through the use of shoreside power rather than running on-board ship service diesel generators while vessels are berthed. The emissions calculated here were for the diesel generators currently used by vessels while at dock. Shoreside emissions per port call were estimated as a function of the time at dock (hours), the generator power load (kW), and the pollutant specific emission factor per kW-hr. The emission factors used in this study were discussed in the previous section. Annual emissions are for all port calls throughout the year, so the number of calls per year is multiplied by the average emissions per call. Ships with a large number of calls, long times at dock, and large electrical loads are more likely to produce higher emissions while at a dock. The shoreside power emissions were estimated using the following equations.
Emissions per port call = (Avg. Berthing Time – Connection+Disconnecting Time) x (Avg. Load, kW) x (Emission Factor, g/kW-hr)
Annual Emissions = (Emissions per port call) x (Annual Calls)
Emissions of PM and SOx depend on the fuel sulfur level used in the generator engines. As shown previously in Table 3-1, all four selected cruise ships, except CRYSTAL HARMONY, use heavy fuel oil, IFO-380, with an average sulfur level of 2.5%. The CRYSTAL HARMONY cruise ship uses a light diesel fuel, MDO, with an average sulfur level of 0.2%. It should be noted that the REGAL PRINCESS uses IFO-180 with an average sulfur level of 1.5% in Alaska to comply with the visible smoke restriction but this sulfur level was not used in this study. Applying the emission factors to the ship call activity estimates provided an estimate of the emissions per port call. Annual emissions were then calculated based upon the number of calls expected over a 12-month period using the 2004 port call data for all vessels, except the DAWN PRINCESS, which was calculated based on the 2005 port call data. One adjustment was that two hours (one hour on each end of each port call) were subtracted from the average berthing time to account for the time to transition to and from shoreside power. The emission results are provided here both as per port call and as an annual average to allow comparison of emission estimates for similar vessels berthed at the Port or other ports. Table 4-11 shows the annual fuel consumption and emission estimates for shoreside power for the selected cruise ships based on the 2004 port call data, except DAWN PRINCESS, which was based on the projected 2005 port call data. Table 4-12 shows the fuel consumption and emission estimates per port call for shoreside power for the selected cruise ships.

September 2005 Final Report
H:\POSF\Report\Final_091205\Final\Sec 4.doc 4-12
Table 4-11. Annual shoreside power fuel consumption and emission estimates for the selected candidate cruise ships.
Shoreside Power Emission Estimates (tons/yr) Vessel1
Fuel Cons. (tons/yr) HC CO NOx PM SOx
CELEBRITY MERCURY 306 0.43 0.71 19.94 1.30 14.97 CRYSTAL HARMONY 121 0.17 0.29 7.60 0.08 0.47 DAWN PRINCESS 163 0.23 0.38 10.60 0.69 7.96 REGAL PRINCESS 149 0.21 0.35 9.72 0.63 7.30 1 Calculations were based on 2004 port call data for all vessels, except DAWN PRINCESS, which was based on 2005 port call data. Table 4-12. Shoreside power fuel consumption and emission estimates per port call for the selected candidate cruise ships.
Shoreside Power Emission Estimates (tons/call) Vessel1
Fuel Cons. (tons/call) HC CO NOx PM SOx
CELEBRITY MERCURY 18 0.03 0.04 1.17 0.08 0.88 CRYSTAL HARMONY 11 0.02 0.03 0.69 0.01 0.04 DAWN PRINCESS 14 0.02 0.03 0.88 0.06 0.66 REGAL PRINCESS 12 0.02 0.03 0.81 0.05 0.61 1 Calculations were based on 2004 port call data for all vessels, except DAWN PRINCESS, which was based on 2005 port call data. 4.5 Net Shoreside Power Emission Reduction Estimates The use of shoreside power would increase emissions from power plants in the region. Therefore, it was necessary to account for the emissions associated with shoreside power generation. In the Port of Long Beach Study, the emissions associated with shoreside power generation were derived from AP-42 for a typical natural gas steam power generation with selective catalytic reduction (SCR) but no CO catalyst were used (ENVIRON, 2004). For consistency with the ARB’s state-wide shoreside power study, average powerplant emission factors based on California power mix provided by ARB were used in this study (Zeller, 2005-1.) These emission factors are shown in Table 4-13. Table 4-13. Powerplant emission factors.
PoLB Study’s Emission Factors
ARB’s Shoreside Power study’s Emission Factors Air Pollutant
lb/MW-hr lb/MW-hr NOX 0.11 0.191 CO 0.96 0.257
PM (assumed PM10) 0.087 0.029 SOx 0.0069 0.0149 VOC 0.063 0.035
Table 4-14 presents the annual and per port call net shoreside power emission reduction estimates, after subtracting associated shoreside power generating emissions (i.e. powerplant emissions), as well as percent emission reductions from berthing emissions with the use of shoreside power. The annual berthing emissions are also included in Table 4-14 for references.

September 2005 Final Report
H:\POSF\Report\Final_091205\Final\Sec 4.doc 4-13
Table 4-14. Berthing emissions, net shoreside power emission reduction estimates, and percent emission reductions for the selected candidate cruise ships.
Berthing Emission Estimates (tons/yr) Vessel1
HC CO NOx PM SOx CELEBRITY MERCURY 0.53 0.89 24.92 1.62 18.71 CRYSTAL HARMONY 0.22 0.36 9.52 0.10 0.59
DAWN PRINCESS 0.28 0.47 13.12 0.85 9.85 REGAL PRINCESS 0.26 0.44 12.20 0.79 9.16
Net Shoreside Emission Reduction Estimates (tons/yr) Vessel1
HC CO NOx PM SOx CELEBRITY MERCURY 0.40 0.55 19.81 1.28 14.96 CRYSTAL HARMONY 0.16 0.22 7.55 0.07 0.47 DAWN PRINCESS 0.22 0.29 10.53 0.68 7.95 REGAL PRINCESS 0.20 0.27 9.66 0.62 7.29
Berthing Emission Estimates (tons/call) Vessel1 HC CO NOx PM SOx
CELEBRITY MERCURY 0.025 0.042 1.173 0.076 0.880 CRYSTAL HARMONY 0.016 0.026 0.690 0.007 0.043
DAWN PRINCESS 0.019 0.032 0.883 0.057 0.663 REGAL PRINCESS 0.017 0.029 0.810 0.053 0.608
Net Shoreside Emission Reduction Estimates (tons/call) Vessel1
HC CO NOx PM SOx CELEBRITY MERCURY 0.024 0.032 1.166 0.075 0.880 CRYSTAL HARMONY 0.015 0.020 0.686 0.006 0.043 DAWN PRINCESS 0.018 0.024 0.878 0.057 0.663 REGAL PRINCESS 0.016 0.022 0.805 0.052 0.608
Shoreside Emission Reductions from Berthing Emissions (%) Vessel1
HC CO NOx PM SOx CELEBRITY MERCURY 76% 61% 80% 79% 80% CRYSTAL HARMONY 76% 61% 79% 72% 79% DAWN PRINCESS 77% 62% 80% 80% 81% REGAL PRINCESS 75% 61% 79% 79% 80% 1 Calculations were based on 2004 port call data for all vessels, except DAWN PRINCESS, which was based on 2005 port call data. 4.6 Projected 2020 Shoreside Power Emission Estimates The Port of San Francisco estimated that the number of port calls would steadily increase to 107 in 2020 for the new cruise ship terminal (PoSF, 2001). In order to determine a “best case” scenario, it was necessary to project the 2020 hotelling emissions based on these 107 projected port calls. Since it is impossible to determine the future vessel fleet in 2020, it was necessary to estimate the average fleet hotelling emissions per call based on the 2004 port call data. This was achieved by averaging the per call emissions for the 2004 fleet weighted by their hotelling load, instead of simple averaging of the per call emissions. Simple averaging would underestimate the emissions if the most frequently called vessels were smaller vessels with lower hotelling load demands and visa versa. The 2004 load-weighted average per call emissions are shown in Table 4-15.
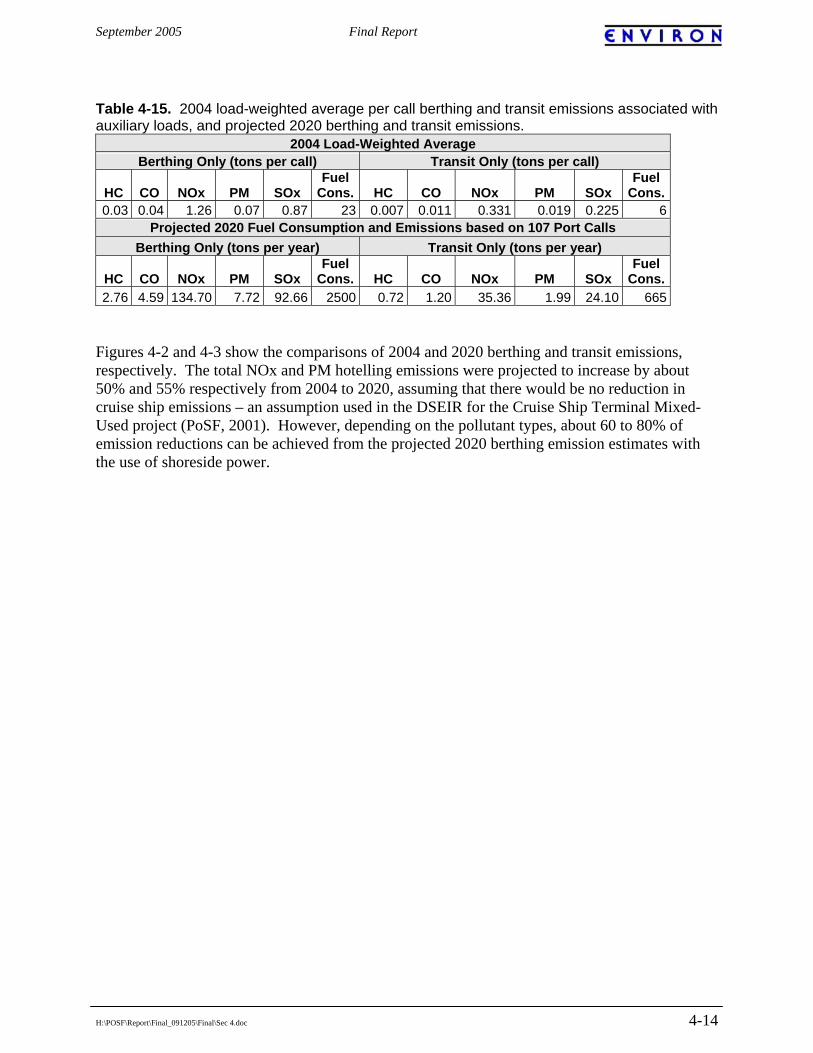
September 2005 Final Report
H:\POSF\Report\Final_091205\Final\Sec 4.doc 4-14
Table 4-15. 2004 load-weighted average per call berthing and transit emissions associated with auxiliary loads, and projected 2020 berthing and transit emissions.
2004 Load-Weighted Average Berthing Only (tons per call) Transit Only (tons per call)
HC CO NOx PM SOx Fuel
Cons. HC CO NOx PM SOx Fuel
Cons.0.03 0.04 1.26 0.07 0.87 23 0.007 0.011 0.331 0.019 0.225 6
Projected 2020 Fuel Consumption and Emissions based on 107 Port Calls Berthing Only (tons per year) Transit Only (tons per year)
HC CO NOx PM SOx Fuel
Cons. HC CO NOx PM SOx Fuel
Cons.2.76 4.59 134.70 7.72 92.66 2500 0.72 1.20 35.36 1.99 24.10 665
Figures 4-2 and 4-3 show the comparisons of 2004 and 2020 berthing and transit emissions, respectively. The total NOx and PM hotelling emissions were projected to increase by about 50% and 55% respectively from 2004 to 2020, assuming that there would be no reduction in cruise ship emissions – an assumption used in the DSEIR for the Cruise Ship Terminal Mixed-Used project (PoSF, 2001). However, depending on the pollutant types, about 60 to 80% of emission reductions can be achieved from the projected 2020 berthing emission estimates with the use of shoreside power.

September 2005 Final Report
H:\POSF\Report\Final_091205\Final\Sec 4.doc 4-15
Figure 4-2. Comparison of 2004 and 2020 berthing emissions.
Figure 4-3. Comparison of 2004 and 2020 transit emissions.
1.80 3.21
87.15
4.79
56.86
2.76 4.59
134.70
7.72
92.66
0.00
20.00
40.00
60.00
80.00
100.00
120.00
140.00
160.00
HC CO NOx PM SOx
Pollutant
tons
/yea
r
2004 Berthing Emissions 2020 Berthing Emissions
0.57 0.99
27.51
1.49
17.67
0.72 1.20
35.36
1.99
24.10
0.00
5.00
10.00
15.00
20.00
25.00
30.00
35.00
40.00
HC CO NOx PM SOx
Pollutant
tons
/yea
r
2004 Transit Emissions 2020 Transit Emissions

September 2005 Final Report
H:\POSF\Report\Final_091205\Final\Sec 5.doc 5-1
5. CONCEPTUAL DESIGN OF A SHORESIDE POWER SYSTEM This section discusses the infrastructure needs, conceptual design, and cost estimates of a shoreside power system for reducing hotelling emissions from cruise ships berthed at the Port, as well as potential shipside alterations and cost estimates on selected cruise ships to receive shoreside power. For background on shoreside power systems, we also briefly examine the design and cost estimates for the Princess Cruise Lines’ shoreside power system in Juneau, Alaska1. 5.1 Overview of the Juneau Shoreside Power System for Princess Cruise Lines The first cruise ship shoreside power installation anywhere in the world was in Juneau, Alaska. On July 24, 2001, the DAWN PRINCESS operated completely on shore power for about 10 hours. By the 2002 cruise season, all five Princess Cruise ships serving Alaska were converted to use shore power when they moored in Juneau. The Juneau project was initiated in order to comply with the local stack emissions opacity standard. Shore power is supplied by Alaska Electric Light & Power (AEL&P), which had a surplus of local hydroelectric power. The Juneau shoreside power system provides both electric power and steam, using an electric boiler. It should be noted that even in dock, the ship’s boilers are run in a low-fire mode to prevent excessive smoking on start up. Other cruise lines do not participate in shoreside power in Alaska. Capital Costs –Princess Cruises provided $4.5 million for the Juneau project to supply both electricity and steam2. Of the $4.5 million, $2.5 million was spent on shoreside power infrastructure that supplies both electricity and steam3 and $2.0 million was for shipboard alterations to four ships at $500,000 per ship inclusive of $150,000 for modification of on-board power management software to synchronize onboard power and shoreside power. Each ship was outfitted with a new door, an electrical connection cabinet and the necessary equipment to automatically connect the ship’s electrical network to the local onshore electrical network. Each ship’s technical office area on deck 4 was used as the point of entry for the power connection. A 4-meter by 2.5-meter steel bulkhead was installed between adjacent steel decks to provide the A-0 fire class condition required to connect to a high voltage (6.6 kV) power source. The Sun Class ships have four Sulzer 16ZAV40S engines driving four GEC generators delivering 6.6 kV, 3-phase, 60 Hz power. Each Sun Class ship was originally constructed with one spare 6.6 kV breaker on its switchboard. The cable connection on the ship is a traditional male/female plug and socket that was adapted from the American mining industry.
1 Cruise ship shoreside power is also being examined for use in Long Beach, and is currently being installed for Princess Lines cruise ships in Seattle, Washington. The Seattle installation is probably the most similar to that which would be installed in San Francisco. See http://www.westcoastdiesel.org/files/outreach/Seattle%20Sept%2030th%20Fact%20Sheet%2003-11-05.pdf for more information. 2 Princess News: SHORE POWER CONNECTION LAUNCHED FOR PRINCESS SHIPS Innovative Program Demonstrates Company's Commitment to Local Concerns, July 24, 2001. 3 Steam is used for heating during port stays. Such is no the case in San Francisco and is thus not included in analysis of costs at the Port of San Francisco.

September 2005 Final Report
H:\POSF\Report\Final_091205\Final\Sec 5.doc 5-2
Operating Costs - Princess Cruises Sun Class ships require about 7 MW of power at 6.6 kV; the Grand Class requires 11 MW at berth. Princess Cruises estimated a cost of $4,000 to $5,000 per day for Sun Class vessels for hotelling power demand using hydroelectric power supplied by AEL&P, as compared to a cost of $3,500 per day to run the diesel engines while in port at Juneau.4,5 Operation - Electrical power is transmitted from a three-phase transformer onshore via four 3-inch diameter flexible cables that festoon to the ship. A special 135-foot long, 25-foot high gantry system was built into the dock to support the festooning equipment, connection cables, and plugs. This transmission equipment was designed to accommodate a 20-foot change in the tide level and to withstand 100 mile per hour winds. The Princess Cruise crew performs the cable connection and disconnection, but AEL&P personnel operate the shoreside substation. Pulling the cables aboard, connecting them to the ship controls, and beginning to run the ship on shoreside power takes approximately 20 to 30 minutes. The same amount of time is needed for disconnecting shoreside power. Process safety is addressed though personnel training and implementing process checklists. The onboard power management system (PMS) software was modified to recognize the shoreside power supply as an additional (the 5th) onboard power-generating unit. The software synchronizes the onboard power with the onshore supplied power, adjusts the onboard voltage until it matches the onshore supply and then regulates the onboard frequency and phase until they match the onshore supply characteristics. 5.2 Electrical Power Infrastructure Conceptual Design at the Port of San Francisco As discussed earlier, the four selected cruise ships used in this study (CRYSTAL HARMONY, CELEBRITY MERCURY, DAWN PRINCESS, and REGAL PRINCESS) all operate at 6.6 kV, 3-phase with normal load demands while at dock ranging from 6 MW to 9.5 MW. The DAWN PRINCESS is currently equipped for shoreside power with a point of entry in the hull at deck 4 (11.3 m above Baseline; at a draft of 8.3 m and a Mean Sea Level tide this would correlate with an elevation of approximately 13’ MLLW, which correlates nearly to the elevation of the wharf deck). The remaining vessels have not been retrofitted for shoreside power, but responses provided by the ship operators indicated that the likely point of entry in the hull will be at deck 4 (10.4 m to 11.4 m above Baseline). The distance from aft perpendicular to the point of entry will be different for each vessel with a likely variation of approximately 30 m. At the expected load demand (ranging from 6 MW to 9.5 MW) and operating voltage of 6.6 kV, two 500 MCM6 cables will have to be brought on to the ship, plus a neutral electric cable and one ship to shore Supervisory Control and Data Acquisition (SCADA) Cable. If the distance
4 As we note elsewhere in this report, arrangements are often made with local utilities and the affected port such that the cost of the electricity provided is modified in some fashion to be lower than otherwise prevailing rates. This is affected by the “interruptability” of the provided electricity, possible funding by the port, or other special provisions. It is beyond the scope of this report to characterize the nature of such arrangements in various applications of shoreside power. Suffice it to say that in each of the cases of Seattle, Juneau, and Long Beach, the cost of electricity for shoreside powering of ships has been a negotiated arrangement. 5 See later sections of this report for the electricity rate structure assumed in this study. 6 MCM is a terminology used to describe the size of the cables based on the electrical load to be served by such cables.

September 2005 Final Report
H:\POSF\Report\Final_091205\Final\Sec 5.doc 5-3
from the transformer to the point of connection on the vessel is increased substantially beyond 500 feet, the number of feeder cables may have to be increased from two to three or four cables. 5.3 Overview of Power Transmission/Distribution to the Ships This study assumes that power will be supplied by PG&E and delivered to the terminal at 12 or 34.5 kV7 (see Section 5.4). The high-voltage power would then be brought underground into the terminals and reduced to 6.6 kV at an on-terminal substation from whence it would be run to the wharf. For the purpose of this study, the use of cable reel towers, similar to those used in Juneau, was considered. The use of a work barge delivery concept as discussed in the Port of Long Beach Cold Ironing Feasibility study (ENVIRON, 2004) was rejected on the basis of anticipated permitting problems associated with the fill created by the semi-permanent mooring of the barge, and incompatibility of berthing the barge fore or aft of the vessel with the expected point of entry for the cold-ironing cables at mid-ships. For the four selected cruise ships, the main power switchboard is located at deck 3, which is located very near the water line for all four vessels. These four vessels either have an existing hull penetration where the shore power cables can enter the ship or have the potential to add a hull penetration at either deck 3 or deck 4. The resulting range in location where the shoreside power will need to be provided to these vessels is approximately 30m (98’) longitudinally and 5m (16’) vertically. Locating the cable reel tower mid-range of the potential hull penetration point for these vessels will limit the cable run to approximately 15m (49’) longitudinally. 5.4 Energy and Transmission Distribution to Terminals PG&E Transmission and Distribution System PG&E owns and operates the electrical transmission and distribution system within the City of San Francisco. As the franchise service provider, PG&E conducts periodic studies of the system capacity, demands, and modifications needed for both near- and long-term service needs. As a part of those ongoing efforts, PG&E has been preparing to shut down and remove the Hunters Point Power Station for several years. A new 115 kV feeder will be constructed between the Potrero Substation and the Hunters Point Substation as part of the overall system reconfiguration to accommodate the loss of the Hunters Point electric power plant. PG&E's Draft Mitigated Negative Declaration for the Hunters Point Substation to Potrero Substation Project states that PG&E is currently programming their system development and maintenance to meet total demand growth at the rate of about 15 MW per year. The possible demand placed on the system for a shoreside power system for cruise ships coupled with the new development of the terminal (about 15 MW total) would place additional demand growth on-line and will affect the load planning process8. 7 Terminology for this voltage is sometimes referred to as 12.5 kV. For consistency, we use 12 kV throughout this report. 8 Since this is a feasibility study, many simplifying assumptions have been made. While these assumptions are clearly stated, and are considered by the authors to be reasonable for the purposes of this study, actual engineering design and related cost analyses will necessarily be carried out by stakeholders in this effort. It is expected that PG&E would provide such detailed shoreside infrastructure engineering and cost estimating (so-called, Engineering Feasibility Study, EFS) as the project progresses.

September 2005 Final Report
H:\POSF\Report\Final_091205\Final\Sec 5.doc 5-4
PG&E operates three substations within about 2 miles of the proposed project site. They are the Embarcadero, Mission, and Larkin Substations. PG&E serves the Embarcadero Substation with a 230 kV feeder from the Martin Substation located near the Cow Palace, about 5 miles south of the proposed project site. PG&E serves the Mission Substation with a 115 kV feeder also from the Martin Substation, but the line must first pass through the Potrero Substation. The Larkin Substation is served by 115 kV feeds from the Hunters Point and Potrero Substation. The Potrero, Mission, and Larkin Substations appear to be configured as a loop system, whereas the Embarcadero Substation has no loop connections with the other substations that serve San Francisco. The Embarcadero, Mission, and other substations may be able to provide power at voltages 12, 34.5, 115, or possibly 230 kV. Figure 5-1 (an exhibit prepared by the California Energy Commission) illustrates the local transmission system. Possible Distribution Routes The limited scope and schedule for this study precluded identifying the most likely source of power to meet the ship hotelling and terminal needs. However, three candidate power sources and routes have been identified using existing and possible new distribution or transmission infrastructure (see Figure 5-2). The first option would be for PG&E to provide an underground high voltage service from an existing feeder located within a few blocks of the cruise terminal. The second option would be for PG&E to provide an underground high voltage feeder from the Embarcadero Substation located at the intersection of Folsom and Fremont Streets; this source is the current design option for the developer for the new cruise ship terminal to supply the terminal load demands. The PG&E Mission Substation located at the intersection of Mission and 8th Streets appears to be the least desirable choice. Although the Larkin Substation is located a similar distance from the proposed project site, it is probably not desirable to cross Market Street with new electrical infrastructure for the proposed project. Therefore, the Larkin Substation is not identified as a candidate power tap location. PG&E has yet to perform an Engineering Feasibility Study (ESF) for each of these options. The ESF would identify the service options PG&E’s system can support and provide cost estimates for each option at an accuracy level of +25%. Also, this study does not take into account any costs of facilities needed to provide service to the terminal itself. The actual cost of facilities necessary to provide shore power to the ships would be the combined cost electrical service facilities required to serve the terminal and shore power less the cost of the costs of facilities to serve the terminal only.

September 2005 Final Report
H:\POSF\Report\Final_091205\Final\Sec 5.doc 5-5
Figure 5-1. A schematic illustrating the PG&E substations within the local electric transmission system.

September 2005 Final Report
H:\POSF\Report\Final_091205\Final\Sec 5.doc 5-6
Figure 5-2. A schematic illustrating the three candidate power sources and routes for a distribution and transmission infrastructure for shoreside power. While overhead service is not an option in this area9, costs for overhead service were estimated to provide a range infrastructure costs. For instance, the difference between overhead and underground service might reflect the sunk costs already required to bring service to the terminal.10 Selected photographs obtained during site visits are included in Appendix C to illustrate the general conditions of the visible distribution lines and underground vaults in the area of the Mission and Embarcadero Substations. Table 5-1 shows the possible power sources and distribution distances to the new cruise ship terminal.
9 Overhead service is not an option for many practical reasons related to construction constraints in the routes shown. Further, it is unlikely that overhead service would be acceptable in the immediate vicinity of Pier 30/32 due to aesthetics of the Port area. 10 “Sunk costs” refers to the cost of providing service to the Pier 30/32 area, whether shoreside powering of the ships is implemented or not. The infrastructure cost attributed to the shoreside powering per se would be over and above that needed for the Pier30/32 normal operation.

September 2005 Final Report
H:\POSF\Report\Final_091205\Final\Sec 5.doc 5-7
Table 5-1. Possible power source and distribution distance. Power Source and Location Distance Between Power Source and Site
Existing Vault in The Embarcadero or nearby cross street (location to be determined)
Assumed Maximum 1,000 Feet (0.2 Miles)
PG&E Embarcadero Substation (Fremont and Folsom Streets)
2,600 Feet (0.5 Miles)
PG&E Mission Substation (Mission and Eighth Streets)
11,000 Feet (2.1 Miles)
Opinions of Probable Construction Costs Opinions of probable construction costs for underground distribution lines were prepared for the three alternative power tap locations. The cost of construction within the streets of the City is very high as a result several factors, including:
• The confined work environment; • Frequently limited work hours and access to the required areas; and • Dense network of underground utilities that must be protected from damage during
construction or avoided in selecting underground utility routes. Working within these constraints can result in construction costs that are triple that in many other urban or suburban settings. All estimated costs for conceptual power supply distribution and transmission infrastructure for the shoreside power assumed the following:
1. Power will be distributed using 12 or 34.5kV. This results in more and larger conductors, larger conduit, and more frequent manholes for pulling conductors for underground ductbank. This is the most conservative assumption and normally most expensive for the conductor and related materials. Overhead lines would share a similar higher cost for conductors for 12 kV or higher voltages.
2. Trench width and depth are estimated conservatively since the final configuration of a
new distribution system may include other conduits such as lower voltage conductors, communications conduits, and spare conduits;
3. Manholes are assumed to be placed every 500 feet.
4. Conductors would be 600 kcmil, 15 kV, PVC jacketed, 133% insulated. A total of 6 conductors would be needed, two for each phase (A, B, and C); (Until PG&E completes an EFS, this can not be known with surety.)
5. Conduit would be 6" PVC schedule 80 and would carry 1 set of conductors (phase A, B, and C); (Until PG&E completes an EFS, this can not be knows with surety.)
6. All opinions of probable cost are based on year 2005 construction dollars, no escalation is included11;
11 2005 dollars were used so that the reader may escalate those costs to future years if desired. If the Pier30/32 terminal is begun and completed in the 2007-20010 timeframe, these costs will be slightly higher in 2005 dollars.

September 2005 Final Report
H:\POSF\Report\Final_091205\Final\Sec 5.doc 5-8
7. No specific costs are included for any modifications at substations or splicing to existing conductors. Any such costs would be included in the contingency; and
8. Costs shown are only for providing power to the proposed project site boundary. The total preliminary estimate of construction costs for each alternative is shown in Table 5-2. Since the final route of a high voltage feeder, for the longer runs may include some overhead service, the estimated cost shown for underground service is likely a worst-case scenario. Since it is the most likely scenario, cost estimates for Alternative 2, with Option A (underground feeder) as a high estimate and Option B (overhead/sunk cost for terminal service) as a low cost estimate, were used in the cost effectiveness analysis.12 Table 5-2. Preliminary opinion of construction costs for possible power sources.
Power Source and Location Estimated Construction Cost Alternate 1 - Existing Vault in The Embarcadero or Nearby Cross Street
$ 850,000
Alternate 2A - Underground Feeder from PG&E Embarcadero Substation (Fremont and Folsom Streets)
$ 2,200,000
Alternate 3A - Underground Feeder from PG&E Mission Substation (Mission and Eighth Streets)
$9,200,000
Recommendations for Further Refinement of Design and Costs Within the limited scope of this study, only broad conceptual plans could be identified. A more thorough evaluation of the existing infrastructure will be necessary to focus on a preferred alternative. Questions and matters that should be addressed include:
• Determine all available voltages in existing ductbanks, overhead lines, or substations that might be used to provide power to the proposed project site. Voltages of interest might include 12 or 34.5, kV;
• Continue to seek PG&E cooperation in better understanding what distribution or transmission infrastructure might be currently available; and
• Continue to seek PG&E cooperation in developing a high voltage, high power infrastructure to serve a possible eventual need for shoreside electrical power.
12 These cost ranges are not sufficiently detailed to include engineering and design, and permitting and contingency explicitly. By offering a range of costs, the reader can reasonably assume that these specific costs will not alter the overall conclusions of this report.
September 2005 Final Report
H:\POSF\Report\Final_091205\Final\Sec 5.doc 5-9
5.5 Power Delivery within the Terminals As noted above, 12 kV power would be made available from PG&E at a power vault located at the entrance to the terminal near the foot of the pier. As shown in the conceptual plan (see Figure 5-3), the power would be brought in to the terminal along the proposed internal roadway behind the terminal building via underground ducting to a step-down transformer at a new near-dock substation. Bringing power close to the vessel limits the length of the 6.6 kV feeds to the vessel, which allows for reducing the total number of feed cables to the ship. The location of the proposed transformer shown on the conceptual plan will allow the 6.6 kV feeds to be less than 500’ long. Again, the number of feeder cables may have to be increased from 2 to 3 or 4, if the distance from the transformer to the point of connection on the vessel is increased substantially beyond 500 feet. Under this conceptual plan, only a single vessel at a time would be provided shore power at the eastern berth of Piers 30-32. Optionally, additional 6.6 kV power could be brought to the northern berth of Piers 30-32 and an additional transformer and dual cable reel tower could be constructed there to serve a second vessel at the berth (see Figure 5-4). The additional costs to provide the infrastructure necessary to support simultaneous shore power to vessels at both berths was approximately estimated in Table 5-3. A 12 or 34.5 kV to 6.6 kV transformer is a fairly large piece of equipment requiring a fenced enclosure approximately 25’ X 33’ for safety and security reasons. For conceptual purposes, the transformer is shown adjacent to the proposed new terminal building, where it could be incorporated into (screened/hidden by) the terminal architecture for aesthetic effects13. Locating the equipment below the deck of the wharf is not feasible because of the severe maintenance considerations caused by salt spray in the tidal splash zone under the wharf and because of access and clearance requirements14. The use of multiple, smaller transformers in an effort to reduce the footprint of the electrical equipment is not feasible as the equipment size is driven by the needs of stepping down from 12 or 34.5 kV to 6.6 kV (multiple smaller transformers can not accomplish this.) The cruise vessels would be supplied power via a cable reel tower that would be located close to the face of the wharf at a location approximately midpoint of the range where the various vessels would likely have points of entry in their hulls. Two cable reels would be used to supply the 6.6 kV power feeds to the vessels. The cable reel tower conceptual design is illustrated in Figure 5-5. The 6.6 kV feed to the cable reel tower would be run either underneath the wharf or installed in a trench cut into the deck. Conceptually, the tower would consist of a 30-inch diameter steel pipe with the cable reel attached on one side, and, in the case of two reels, one on each side. Near the base of the cable reel tower there would be an electrical pull box for both the high voltage feed and the low voltage feed for the electrical motors on the tower. The reel tower would be supported on a new foundation constructed into the wharf deck. The bottom of the reel would be about 7 feet above the deck to provide clearance and the tower would be set far enough back to 13 If a shoreside power system is determined to be cost effective and/or the Ports desires to include one in the new cruise ship terminal development, the Port would work with the project developer to incorporate design features for aesthetic effects, as well as costs associated with aesthetic and potential loss of usable space. 14 Locating the transformer above any on-pier structure is not feasible due to the significant weight of the transformer upon the underlying structure and other safety considerations.

September 2005 Final Report
H:\POSF\Report\Final_091205\Final\Sec 5.doc 5-10
clear the hull of the ship. On top of the tower would be a steel davit controlling a sling, through the use of an electric winch, and a steel cable to raise and lower the ends of the cables to the ship. The davit would also be on a geared turntable, run by another electric motor, so it could be rotated away from the ship when necessary. The cable reels and the lowering frame would be electro-mechanically powered and controlled. The cable lowering and raising system would be pendant controlled from either the pier or the ship. An electrician would energize and de-energize the power at the substation.15 5.6 Summary of the Terminal Infrastructure and Operating Costs The cost to construct the pier-side power lines, substation/transformer and dual cable reel, as shown in Figures 5-3 and 5-5, is approximately $425,000 (see Table 5-3). Adding additional power lines from the substation to the northern berth and constructing a second dual cable reel tower there to service vessels at that berth is estimated to cost an additional $225,000. However, this on-pier infrastructure cost could be doubled if a larger transformer and more than 2 cables are used16. Annual labor costs to pull the cables to the vessel and energize the ship from shore, based on an estimated 100 vessel calls at the terminal, is estimated to be approximately $140,000 (see Table 5-4). Breakdown cost estimates of the conceptual shoreside power system are provided in Appendix D. The shipside operating costs (i.e., power energy cost and fuel savings) are discussed later in the shipside alteration sections.
15 This report does not examine labor union implications of differing craft unions being involved in the shoreside connections. For a variety of reasons, it is highly recommended that a standard set of procedures be followed by an experienced crew at all times. 16 With a larger 16.5 MW substation and 4-cable reel tower, the on-pier shoreside power infrastructure cost for the shoreside power project for cruise ship terminal at the Port of Seattle was estimated to be about $1.5 million.

September 2005 Final Report
H:\POSF\Report\Final_091205\Final\Sec 5.doc 5-11
Figure 5-3. Conceptual plan of a one-berth shoreside power system for the Port of San Francisco.
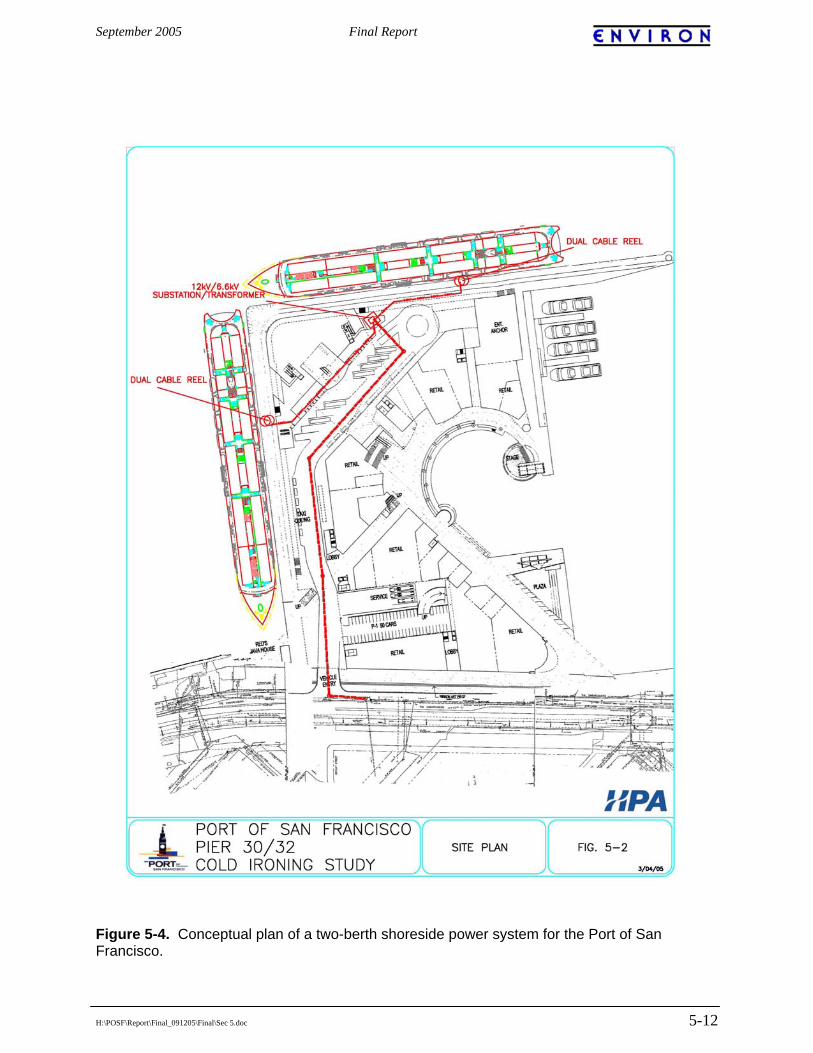
September 2005 Final Report
H:\POSF\Report\Final_091205\Final\Sec 5.doc 5-12
Figure 5-4. Conceptual plan of a two-berth shoreside power system for the Port of San Francisco.
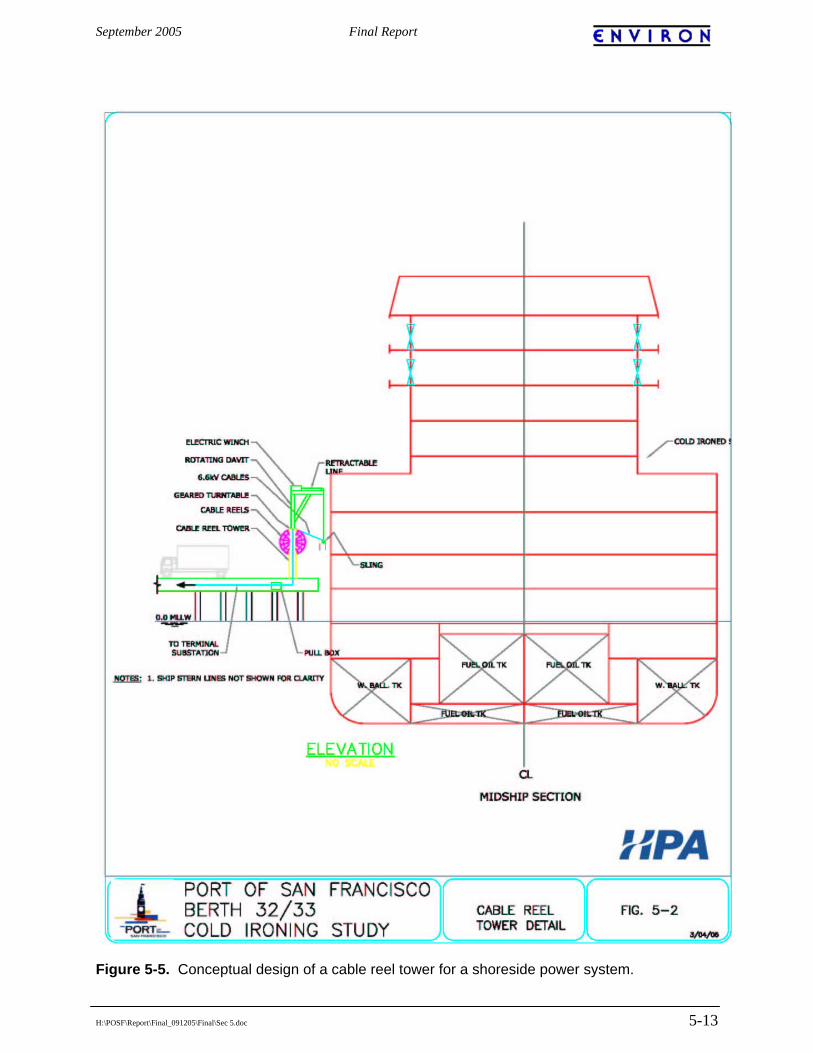
September 2005 Final Report
H:\POSF\Report\Final_091205\Final\Sec 5.doc 5-13
Figure 5-5. Conceptual design of a cable reel tower for a shoreside power system.

September 2005 Final Report
H:\POSF\Report\Final_091205\Final\Sec 5.doc 5-14
Table 5-3. Summary of cost estimates for a conceptual shoreside power system for cruise ships berthed at the Port of San Francisco.
Table 5-4. Summary of annual operating cost estimates for operating the conceptual reel towers.
Annual Labor Cost Estimates Handling 100 Berth Calls Electrician $105,600Subtotal $105,600Contingency17 30% $31,680Total $137,280
5.7 Shipboard Alteration Analysis This section deals with the anticipated shipboard modifications and vessel operational and safety requirements for a proposed shore power installation at the Port of San Francisco cruise ship terminal, piers 30-32, as well as cost estimates associated with shipside alteration and shoreside power operation (e.g., energy costs and potential fuel savings). Discussion is focused in the four cruise ships selected for this study. In 2001, Princess Cruises began retrofitting all five ships in its Alaska fleet to receive shore power for hotelling loads at the port of Juneau, Alaska. DAWN PRINCESS was the first. The average capital cost to retrofit the five Princess Cruises ships for shore hotelling power was in the order of $500,000 per ship. Two other Princess Cruises ships, SUN PRINCESS and CORAL PRINCESS, which call at the Port of San Francisco twice per year, have also been retrofitted for hotelling with shoreside power. In addition, commencing in 2002, Princess Cruises began incorporating a shore hotelling power connection as a standard feature on new cruise ships. This was a cost-saving initiative, as the expense of retrofitting is substantially higher than the expense of providing for shore hotelling power during new ship construction. As a result of Princess Cruises' pro-active and successful program, no additional modifications will be required aboard the DAWN PRINCESS (or the SUN PRINCESS and CORAL PRINCESS) to receive shoreside auxiliary power at the Port. The other three vessels selected for this feasibility study, the REGAL PRINCESS, CRYSTAL HARMONY, and CELEBRITY MERCURY will each require retrofitting equivalent to the modifications accomplished aboard the DAWN PRINCESS.
17 This includes uncertainty in the assumptions and also uncertainty in overhead benefit costs.
Meter to Terminal
Substation Run Substation
Terminal Substation
to Wharf Run
Run Under
the Wharf
Double Cable Reel
Towers (2x6.6kV)
Berth Item 1 Item 2 Item 3 Item 4 Item 9 Total 30-32 east $117,582 $90,100 $18,657 $7,293 $189,345 $422,97730-32 north $0 $0 $26,653 $7,293 $189,345 $223,291

September 2005 Final Report
H:\POSF\Report\Final_091205\Final\Sec 5.doc 5-15
The unique Juneau shore power installation was discussed earlier. As noted, dockside facilities required to provide shore power at the Port of San Francisco cruise ship terminal will be substantially simpler in concept than at Juneau due to reduced tidal action and elimination of the requirement for a shore supply of heating steam, but other challenges in San Francisco such as design aesthetics and the scarcity of space present additional challenges. Review and Approval of Ship Design Alterations and Revised Operating Procedures The proposed shore hotelling power retrofits will require significant engineering and arrangement modifications to REGAL PRINCESS, CRYSTAL HARMONY, and CELEBRITY MERCURY. Prior to implementation, the engineering drawings, specifications, and operating procedures for the required modifications will have to be reviewed and approved by the appropriate ship classification societies and regulatory agencies for compliance with standards of accepted marine engineering practice and safety. The respective classification societies for the three selected ships are identified in Table 5-5. Table 5-5. Classification societies for the three selected cruise ships without shoreside power capability.
Ship Classification Society REGAL PRINCESS CRYSTAL HARMONY CELEBRITY MERCURY
Registro Italiano Navale Lloyd's Register of Ships Lloyd's Register of Ships
All three ships are foreign flag vessels. As a consequence, the United States Coast Guard is not directly involved in the review process for the proposed shipboard modifications. However, prudence and professional courtesy suggest that, particularly in view of its expanded role in homeland security, the U.S. Coast Guard be advised of the proposed modifications and invited to participate and monitor program progress18. In consideration of the successful results previously achieved with the Princess Cruises retrofits, the design review and approval processes for modifications to the three selected cruise ships are not anticipated to be difficult. However, time (at least two to three months) must be allowed for the review and approval of drawings and specifications. In addition, an allowance must be made for a classification society surveyor and possible U.S. Coast Guard representative to attend each cruise ship for final inspections and operational tests. Continuity of Power Supply The arrangement and design of shipboard components in the shore hotelling power system must ensure that the supply of electricity is not interrupted during either the transfer of hotel load from ship to shore or vice-versa. An inadvertent interruption of electricity is not only disturbing to
18 As the number of ships servicing the West Coast (and potentially nationally) using shoreside auxiliary power continues to grow, it behooves the U.S. Coast Guard and other federal agencies to become increasingly involved in order to assure general safety and operating practice conformity, thus reducing safety concerns as well as reducing costs through standardization.
September 2005 Final Report
H:\POSF\Report\Final_091205\Final\Sec 5.doc 5-16
passengers and ship personnel, but can also adversely impact shipboard computers, data logging functions, security, navigation, communications, and control systems. Shore Power Demand and Characteristics CELEBRITY MERCURY, the largest of the four selected cruise ships considered viable candidates for shore power at the Port of San Francisco, requires up to 12.5MW of shoreside hotelling electricity, with an average load of 9,500 kW at 6.6 kV. All four selected vessels are fitted with 6.6 kV, 3 phase, 60-Hertz high voltage electric systems. As noted previously, the conceptual design provides for 12.5 MW at 6.6 kV. This would provide an effective load demand of about 11MW with a power factor of 0.85, and would eliminate PG&E’s power factor adjustments based on its Schedule E-20, their rate schedule for commercial, industrial, and general electric power demands in San Francisco. Energy costs estimated using this rate schedule for shoreside power on selected ships are discussed later in this section. Impact of the DAWN PRINCESS Precedent on Hardware and Design Parameters The DAWN PRINCESS installation achieved the primary Juneau air quality objective of minimized opacity with concurrent reductions in the dockside emissions. These emissions, NOx, PM, and SOx, are of primary concern to the Port of San Francisco. Since the DAWN PRINCESS is one of the four selected ships for this study, it logically follows that the electric cable connection hardware for a proposed installation must be interchangeable with, if not identical to, the hardware used aboard the DAWN PRINCESS and at Juneau. The other (internal) ship modifications required to receive shoreside power for hotelling on the REGAL PRINCESS, CRYSTAL HARMONY, and CELEBRITY MERCURY will likewise comply with the general parameters successfully demonstrated aboard the DAWN PRINCESS with equivalent shipboard engineering operations and safety features. Electric Power Cables and Connections The proposed new cruise ship terminal installation would require a group of four to six electric cables. Two to four of these would be the power supply and 3-inch (75 mm) electric cables (AMERICABLE mining cables or equal) connecting each cruise ship to the shore substation and its supply of 6.6 kV, 3 phase, 60Hertz power. In addition to these power cables, the group would include one neutral electric cable and one ship to shore Supervisory Control and Data Acquisition (SCADA) Cable. All cables would use the same quick acting male/female plug and receptacle specifications developed by the mining industry and used at Juneau. The plugs would be mounted at the waterside terminations of the electric cables. The grouped cables would require a dockside cable reel of sufficient cable length to access the variety of vessels calling at the berth, as discussed earlier. The cable reel must allow sufficient freedom of movement to prevent undue stress on the cables from routine ship motions at berth and maximum tidal activity.

September 2005 Final Report
H:\POSF\Report\Final_091205\Final\Sec 5.doc 5-17
Mating receptacles for the shoreside power cable plugs would be permanently mounted in a shipboard cabinet specifically designed to ensure that they are securely supported, safe to operate, and inaccessible to unauthorized personnel. Point of Entry into Ship Hull In order to minimize ship retrofit expenditures and maintain consistency in vessel berthing operations, it is assumed that only one point of entry shall be required on the port side of each cruise ship. In addition, safety requires that the high voltage shoreside power cable point of entry be located away from the ship refueling station and outside of passenger zones19. Watertight Door and Dedicated Work Space/Compartment Each ship would require a watertight door at the shore power cable point of entry into the hull. It would provide access to a cable connect/disconnect workspace surrounding the receptacle cabinet within a dedicated compartment on the side of the ship. The cable connect/disconnect compartment needs to be positioned in a secure area to exclude unauthorized personnel. Due to the anticipated expense of routing new shore power supply cables through existing ship structure and interferences, the point of entry should generally be located as near to the ship high voltage switchboard as possible. When the DAWN PRINCESS was retrofitted in 2001, the project required provision of a new access opening and watertight door in the side of the hull for the shore power cables. The three other selected cruise ships requiring retrofit for shore hotelling power at the Port either have existing locations proposed for points of entry or will require cutting new openings and providing new watertight doors, as indicated below: Ship Ship- Proposed Location For Point Of Entry REGAL PRINCESS Needs to be determined and a new door provided CRYSTAL HARMONY Needs to be determined and a new door provided CELEBRITY MERCURY Two existing doors are proposed, one on the port and one on the starboard
side of the hull, at frames 247 to 249, approximately 6 meters above baseline, serving compartments adjacent to the passenger embarkation lobby
Review of the general arrangement plans for the REGAL PRINCESS and CRYSTAL HARMONY indicates that potentially feasible locations exist for points of entry. The feasibility of these locations would ultimately need to be confirmed by shipboard inspection of the selected and adjacent areas to identify and deal with structural, piping, electrical, and equipment interferences and possible safety issues. As an example, the DAWN PRINCESS shoreside power installation required construction of a new steel bulkhead in order to comply with high voltage fire protection requirements. Pending confirmation, it is assumed for the preliminary purposes of this feasibility study that the locations suggested below are feasible or that substitute locations can be converted to points of entry at comparable expense and with minimal disruption to shipboard functions. Thus, the specifics of the suggested points of entry are as follows:
19 Note that at the Piers 30-32 cruise ship terminal, ships would likely berth in different positions, depending on tidal/current conditions; port side berthing if flood tide, and starboard berthing if ebb tide.

September 2005 Final Report
H:\POSF\Report\Final_091205\Final\Sec 5.doc 5-18
Ship Suggested Location For Point Of Entry REGAL PRINCESS Dry Provisions Store Room, frames 49 to 61 or Incinerator Room, Frames
61 to 85, deck 4, portside, approximately 10.9 meters above baseline CRYSTAL HARMONY Transformer Room, deck 4, portside, frames 94 to 101, approximately 10.4
meters above baseline The proximity of the proposed point of entry aboard the CELEBRITY MERCURY to the passenger embarkation lobby may pose a high voltage safety issue. In addition, as discussed under Internal Power Cable Routing to High Voltage Switchboards, this proposed point of entry is remote from the ship high voltage switchboard and therefore problematic from the standpoint of retrofit cable routing expense. Safety Interlocks Shipboard shore power cable routing would begin at the new shore power receptacle cabinet within the operating station adjacent to the point of entry. Mechanical and/or electrical safety interlocks would be required at the plug/receptacle connections within the shore power receptacle cabinet, the SCADA, and the ship Power Management System (PMS) to prevent inadvertent activation of electrical switch gear and ensure that all of the plug/receptacle connections are complete and secured prior to delivery of shore power to the ship. Internal Power Cable Routing to High Voltage Switchboards New ship power cabling would be routed from the shore power receptacle cabinet to a dedicated circuit breaker and the high voltage switchboard for distribution to hotel service loads. The internal ship cabling would be smaller in cross-sectional dimensions than the shore substation power cables. Shipboard cabling would be sized to deliver the ship specific hotelling amperage (including an allowance for instantaneous surges) whereas the shore substation cable must be sized for the largest projected cruise ship amperage. In addition, shipboard cabling would be permanently supported in fixed wireways within the ship, in contrast to the grouped portable substation to ship cabling that would require abrasive resistant sheathing and internal reinforcement to withstand repeated reeling and handling to and from cruise ships. The locations of the high voltage switchboards on the three selected cruise ships are as follows: Ship Location Of High Voltage Swithchboard REGAL PRINCESS On centerline of the ship, deck 3, frames 60-69, 9.7 meters from the ship side
shell, 3 meters above the baseline CRYSTAL HARMONY To portside of the centerline of the ship, deck 3, frames 98-101, 7.7 meters
above the baseline CELEBRITY MERCURY On the centerline of the ship, frames 120-140, 3 meters above the baseline
These locations and the proposed points of entry indicate that the REGAL PRINCESS and CRYSTAL HARMONY would each require approximately 20 meters of new high voltage shore power cabling between the shore power receptacle cabinet and the high voltage switchboard. CELEBRITY MERCURY would require approximately 85 meters if the proposed existing point
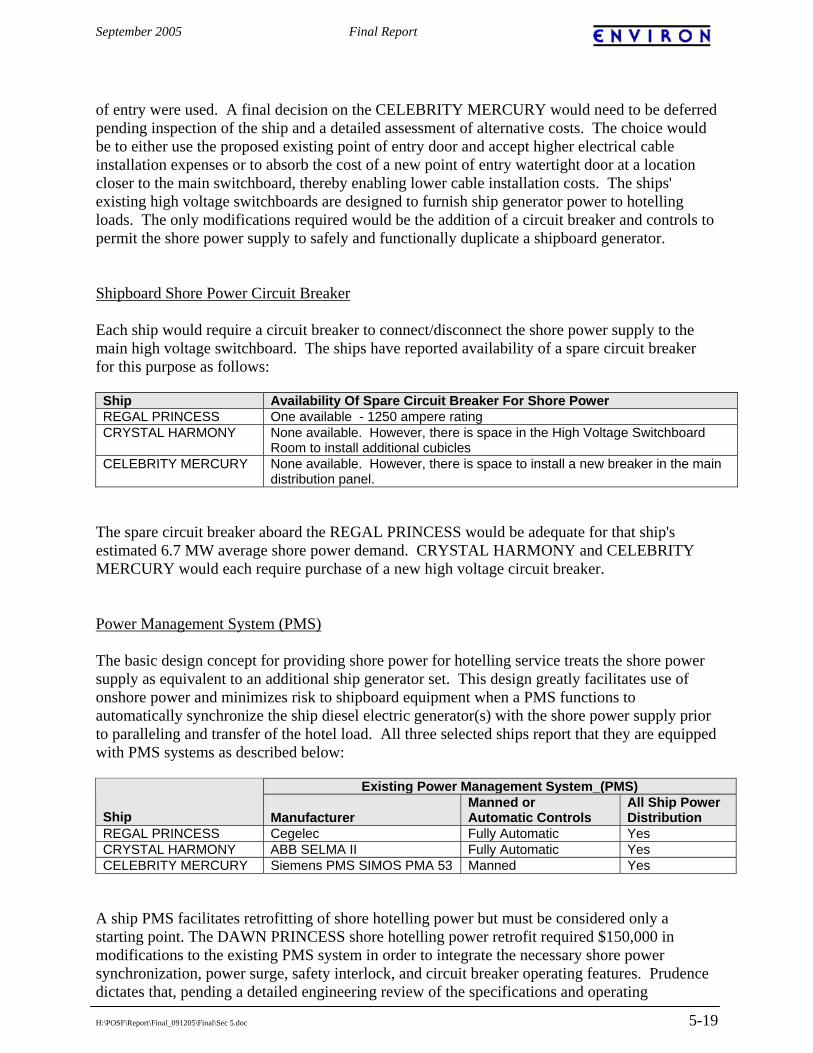
September 2005 Final Report
H:\POSF\Report\Final_091205\Final\Sec 5.doc 5-19
of entry were used. A final decision on the CELEBRITY MERCURY would need to be deferred pending inspection of the ship and a detailed assessment of alternative costs. The choice would be to either use the proposed existing point of entry door and accept higher electrical cable installation expenses or to absorb the cost of a new point of entry watertight door at a location closer to the main switchboard, thereby enabling lower cable installation costs. The ships' existing high voltage switchboards are designed to furnish ship generator power to hotelling loads. The only modifications required would be the addition of a circuit breaker and controls to permit the shore power supply to safely and functionally duplicate a shipboard generator. Shipboard Shore Power Circuit Breaker Each ship would require a circuit breaker to connect/disconnect the shore power supply to the main high voltage switchboard. The ships have reported availability of a spare circuit breaker for this purpose as follows: Ship Availability Of Spare Circuit Breaker For Shore Power REGAL PRINCESS One available - 1250 ampere rating CRYSTAL HARMONY None available. However, there is space in the High Voltage Switchboard
Room to install additional cubicles CELEBRITY MERCURY None available. However, there is space to install a new breaker in the main
distribution panel. The spare circuit breaker aboard the REGAL PRINCESS would be adequate for that ship's estimated 6.7 MW average shore power demand. CRYSTAL HARMONY and CELEBRITY MERCURY would each require purchase of a new high voltage circuit breaker. Power Management System (PMS) The basic design concept for providing shore power for hotelling service treats the shore power supply as equivalent to an additional ship generator set. This design greatly facilitates use of onshore power and minimizes risk to shipboard equipment when a PMS functions to automatically synchronize the ship diesel electric generator(s) with the shore power supply prior to paralleling and transfer of the hotel load. All three selected ships report that they are equipped with PMS systems as described below:
Existing Power Management System_(PMS) Ship
Manufacturer
Manned or Automatic Controls
All Ship Power Distribution
REGAL PRINCESS Cegelec Fully Automatic Yes CRYSTAL HARMONY ABB SELMA II Fully Automatic Yes CELEBRITY MERCURY Siemens PMS SIMOS PMA 53 Manned Yes
A ship PMS facilitates retrofitting of shore hotelling power but must be considered only a starting point. The DAWN PRINCESS shore hotelling power retrofit required $150,000 in modifications to the existing PMS system in order to integrate the necessary shore power synchronization, power surge, safety interlock, and circuit breaker operating features. Prudence dictates that, pending a detailed engineering review of the specifications and operating

September 2005 Final Report
H:\POSF\Report\Final_091205\Final\Sec 5.doc 5-20
characteristics of each PMS, a comparable sum be estimated to upgrade the PMS on each of the three selected ships. Shipboard Control Panel A control panel would be required at the ship hotelling power operations station. The panel would have the following displays and buttons: 1. A shore load meter, displaying megawatts; 2. Two shore power breaker position indicator lights, one for "ON" and one for "OFF"; 3. Two Main Switchboard breaker position indicator lights, one for "ON" and one for "OFF"; 4. A "Shore Power Authorized" keyed security switch connected to the safety interlock system;
and 5. An "Emergency Trip" button to back up the automatic safety features and enable manual
termination of shore power to the ship in the event of a crisis (e.g., a fire). Accomplishing Ship Retrofits It is anticipated that the scope and duration of work required to accomplish the required shore hotelling power modifications aboard the three selected cruise ships would be significant but manageable. Princess Cruises finished the entire DAWN PRINCESS retrofit in a remarkably prompt period of six months. That represents a commendable achievement, but should be considered the minimum duration for a project of this complexity. The following caveats apply to other cruise ship retrofits, where circumstances may not be as fortuitous. Ship inspections, development of detailed engineering design drawings and specifications, and the classification/regulatory agency approval process can easily require four to six months per ship. The classification society/regulatory portion of work usually can be accomplished in two to four months, and expedited upon request. The re-engineering of PMS and other electrical control components to suit the shore power retrofit could be a fairly lengthy process, dependent upon original equipment manufacturers for accomplishment No other long lead times should be involved for materials and equipment. The new electric cabling, cable support hardware, shore power plugs and receptacles, custom-built shore power supply cabinet, interlocks, circuit breakers, watertight hatch, and new bulkhead steel (if required) are all readily obtainable items. The shipboard modifications would need to be implemented with minimal disruption to revenue service. Depending upon the individual ship operating schedules and the extent of work involved in each task, the modifications may be accomplished either piecemeal on a voyage-turn basis (concurrent with normal ship operations) or all at once during ship lay-up for periodic dry-docking. The latter is generally the most economical and practical approach to accomplishing modifications, assuming that the lay-up schedule suits the timing and duration of the retrofit project. Assuming efficient organization of work, manpower, and materials availability, including the prefabrication of specialized components (such as the shore power receptacle cabinet and PMS/control system upgrades) the complete ship retrofit could conceivably be accomplished in as little as one to two weeks.

September 2005 Final Report
H:\POSF\Report\Final_091205\Final\Sec 5.doc 5-21
5.8 Description of Proposed Shore Power Operations at the Port of San Francisco Cruise Ship Terminal This section discusses the sequence of events for the connection and termination of the shoreside power operation. The following general notes should apply to both connection and termination processes: 1. All shore power functions aboard the ships would be managed under the direct supervision of
an assigned ship officer, typically the chief engineer, chief electrical officer, or another qualified engineering officer;
2. All shore power functions on the landside of the terminal would likely be accomplished by
the terminal operator. A shore power dispatcher would direct the actions of a dockside crew, most probably longshoremen specifically trained for this duty20;
3. Based upon the experience of Princess Cruises, it is estimated that approximately one hour
per call at the Port of San Francisco will be required following ship arrival to connect and activate, and then another hour prior to departure to deactivate and disconnect the proposed hotelling power supply. During the first of these two hours, hotelling loads will continue to be carried at the berth by the ship engine generator set(s). During the second hour, approximately one-half hour of engine operation would be required to bring the diesel generator set(s) back to operating temperature for resumption of service.
The proposed sequence of events for the connection and termination of shoreside power supply cables and dockside hotelling operations are provided in Tables 5-6 and 5-7, respectively. Table 5-6. Proposed sequence of events for connections of shoreside power.
Proposed Sequence of Events for Connection of Shore Power Supply Cables and Dockside Hotelling Operations
1. Upon arrival of each cruise ship at the terminal, ship and longshore personnel would fasten mooring
lines. Once all mooring lines have been made fast, the embarkation gangway would be positioned to enable passage between the ship and shore.
2. Once the ship is secured at the terminal, the propulsion plant would be shut down upon the engine room telegraph order "Finished with Engines" from the bridge. At that point, all remaining shipboard power generation would be in support of hotelling loads.
3. Concurrent with or prior to arrival, the designated ship’s engineering officer would proceed to the shore power operating station, unlock its interior entry door, and inspect/prepare the receptacles and safety interlocks for operation. The shore power compartment would be secured to exclude unauthorized persons.
4. The shore power point of entry watertight door on the side of the hull would be opened and secured by ship personnel as soon as convenient upon arrival in San Francisco Bay.
5. The terminal security personnel would close the area of the cruise ship terminal containing the substation, cabling, and cable-handling system to prevent unauthorized entry.
6. Following or concurrent with completion of mooring of the ship and positioning the embarkation gangway, the dockside crew would commence operation of the shore power cable handling system consisting of the shore power cable reel and cable positioning equipment (small crane or lift truck). This action would be accomplished under the direction of the shore power dispatcher. The shore power cable group would be reeled out from its connection to the dockside substation to the point of entry watertight door on the port side of the cruise ship and positioned for receipt by the ship.
20 As noted previously, for safety and efficiency reasons, a consistent crew, or equally experienced and trained back-up crew, should be available for the cable hook up procedure.

September 2005 Final Report
H:\POSF\Report\Final_091205\Final\Sec 5.doc 5-22
Proposed Sequence of Events for Connection of Shore Power Supply Cables and Dockside Hotelling Operations
7. The ship’s engineering officer in charge of shore power operations would establish direct communications with the shore power dispatcher and dockside crew handling the power cabling on the dock.
8. Once the power cables are positioned adjacent to the watertight door, the dockside crew would operate the power cable handling system under direction of the ship’s engineering officer to position the six cable plugs into the shore power operating compartment.
9. The dockside crew would reel out sufficient (predetermined) cable slack to allow for normal ship motion and tidal activity during the ship call.
10. The shore power cable group would be connected by a quick operating linkage to an overhead ship structural support padeye near the point of entry watertight door. This support would bear the weight of the cables and ensure that no stress is placed upon the plug/receptacle connections.
11. Cable shipboard positioning, support, and security must be completed to the satisfaction of the ship’s engineering officer in charge of shore power operations.
12. Once all of the above have been completed, ship personnel would connect the four-six cable plugs to their respective receptacles in the shore power cabinet.
13. Connection of all plugs and receptacles would automatically enable the ship safety interlock system and ship to shore SCADA to communicate and permit transmission of shore power to the ship.
14. Upon authorization from the ship’s engineering officer in charge, the shore power dispatcher would close a circuit breaker at the shore power substation and establish voltage, frequency, and phase at the ship shore power connection cabinet.
15. The ship PMS would then be activated by the engineering officer in charge to automatically synchronize the ship diesel generator with the shore power supply phase and frequency.
16. When synchronization has been established, the shipboard shore power high voltage circuit breaker would be closed and the ship diesel generator would be operated in parallel with the shore power supply.
17. Once satisfactory parallel operations were established, the ship diesel generator would be disconnected from the hotel load by opening its high voltage circuit breaker. Hotelling demand would then be supplied from the shore substation.
18. The diesel generator would be secured in accordance with routine shutdown procedures. Ship diesel engine emissions would be halted and would remain zero at the cruise ship terminal until engines are started for warm-up in preparation for departure from the Port of San Francisco.
Table 5-7. Proposed sequence of events for termination of shoreside power.
Proposed Sequence of Events for Termination of Dockside Hotelling Operations and Disconnection of Shore Power Supply
The termination of hotelling shore power would follow a sequence that is largely the reverse of the foregoing. All shipboard operations would remain under the direct management and control of the designated ship engineering officer and all functions on the land side of the terminal would be accomplished by the Port of San Francisco dockside crew under the direction of a shore power dispatcher. The area of the terminal containing the substation, cable, and positioning system would remain closed by terminal security personnel to prevent unauthorized entry during these events. The sequence of events would be as follows: 1. Following engine orders from the bridge, the ship diesel generator would be started and warmed up
in accordance with routine procedures for normal hotel and propulsion plant operations. 2. Ship engineering personnel would enter the shore power operating station compartment and
maintain security in the space to exclude unauthorized persons. 3. The ship’s engineering officer in charge of shore power operations would establish direct
communications with the shore power dispatcher and dockside crew handling the shore power supply from the terminal.
4. Upon completion of routine engine warm up operations (assumed to take approximately one-half hour) the ship engineers would activate the PMS to automatically synchronize the diesel generator
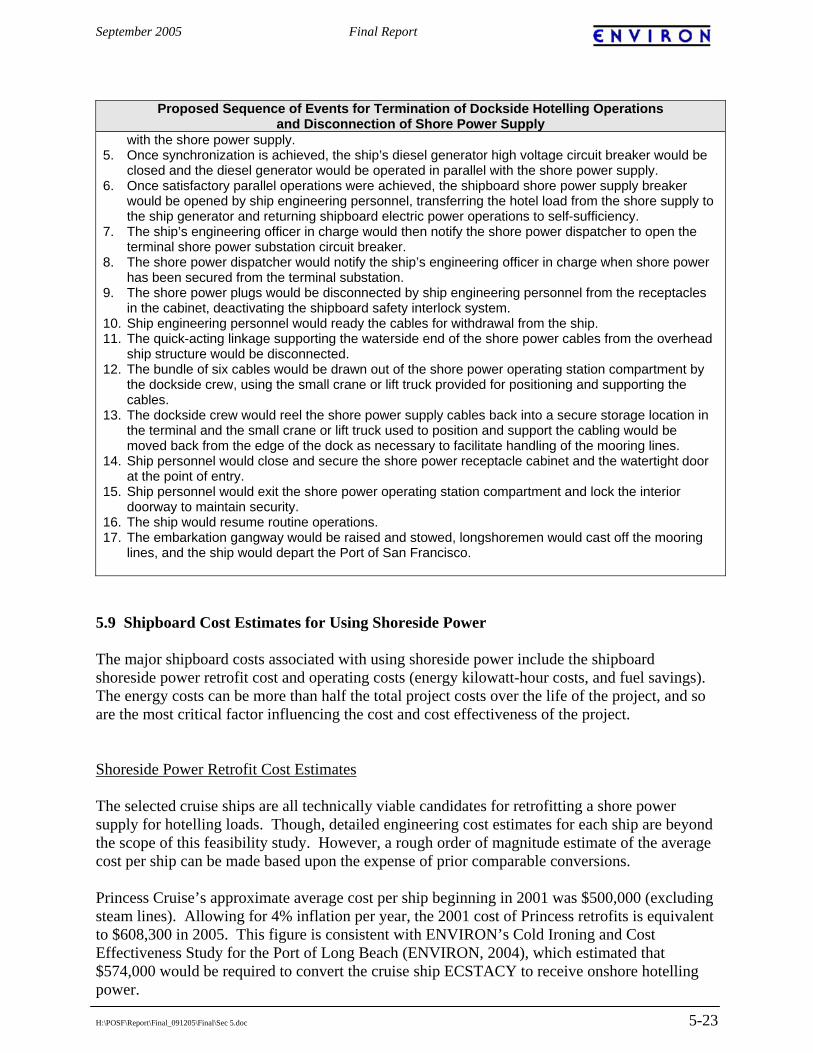
September 2005 Final Report
H:\POSF\Report\Final_091205\Final\Sec 5.doc 5-23
Proposed Sequence of Events for Termination of Dockside Hotelling Operations and Disconnection of Shore Power Supply
with the shore power supply. 5. Once synchronization is achieved, the ship’s diesel generator high voltage circuit breaker would be
closed and the diesel generator would be operated in parallel with the shore power supply. 6. Once satisfactory parallel operations were achieved, the shipboard shore power supply breaker
would be opened by ship engineering personnel, transferring the hotel load from the shore supply to the ship generator and returning shipboard electric power operations to self-sufficiency.
7. The ship’s engineering officer in charge would then notify the shore power dispatcher to open the terminal shore power substation circuit breaker.
8. The shore power dispatcher would notify the ship’s engineering officer in charge when shore power has been secured from the terminal substation.
9. The shore power plugs would be disconnected by ship engineering personnel from the receptacles in the cabinet, deactivating the shipboard safety interlock system.
10. Ship engineering personnel would ready the cables for withdrawal from the ship. 11. The quick-acting linkage supporting the waterside end of the shore power cables from the overhead
ship structure would be disconnected. 12. The bundle of six cables would be drawn out of the shore power operating station compartment by
the dockside crew, using the small crane or lift truck provided for positioning and supporting the cables.
13. The dockside crew would reel the shore power supply cables back into a secure storage location in the terminal and the small crane or lift truck used to position and support the cabling would be moved back from the edge of the dock as necessary to facilitate handling of the mooring lines.
14. Ship personnel would close and secure the shore power receptacle cabinet and the watertight door at the point of entry.
15. Ship personnel would exit the shore power operating station compartment and lock the interior doorway to maintain security.
16. The ship would resume routine operations. 17. The embarkation gangway would be raised and stowed, longshoremen would cast off the mooring
lines, and the ship would depart the Port of San Francisco.
5.9 Shipboard Cost Estimates for Using Shoreside Power The major shipboard costs associated with using shoreside power include the shipboard shoreside power retrofit cost and operating costs (energy kilowatt-hour costs, and fuel savings). The energy costs can be more than half the total project costs over the life of the project, and so are the most critical factor influencing the cost and cost effectiveness of the project. Shoreside Power Retrofit Cost Estimates The selected cruise ships are all technically viable candidates for retrofitting a shore power supply for hotelling loads. Though, detailed engineering cost estimates for each ship are beyond the scope of this feasibility study. However, a rough order of magnitude estimate of the average cost per ship can be made based upon the expense of prior comparable conversions. Princess Cruise’s approximate average cost per ship beginning in 2001 was $500,000 (excluding steam lines). Allowing for 4% inflation per year, the 2001 cost of Princess retrofits is equivalent to $608,300 in 2005. This figure is consistent with ENVIRON’s Cold Ironing and Cost Effectiveness Study for the Port of Long Beach (ENVIRON, 2004), which estimated that $574,000 would be required to convert the cruise ship ECSTACY to receive onshore hotelling power.

September 2005 Final Report
H:\POSF\Report\Final_091205\Final\Sec 5.doc 5-24
Adding a 15% allowance for contingencies to be resolved during detail engineering design development, a conservative average estimated cost for retrofitting REGAL PRINCESS, CRYSTAL HARMONY, and CELEBRITY MERCURY is therefore $700,000 per ship, or $2,100,000 for the three ships. For the cost effectiveness analysis, a cost estimate range of $500,000 to $700,000 was used to represent low and high-end retrofit costs. Operating Cost Estimates Ongoing shipside operating costs for shoreside auxiliary power supply consist of purchased electrical load costs minus fuel savings. Shipside labor costs are incidental to the overall ship docking process. Purchased Energy Costs – the estimated energy costs were based on the predicted summer and winter power consumptions (kW-hr), and the estimated time-related power demand. Other factors considered in the estimate were fixed customer charges, facility demand charges, power factor adjustment, and peak period rates. PG&E estimated the annual purchased energy cost for shoreside powering for the four selected ships using the PG&E’s current E-20 rate schedule (included in Appendix E)21. PG&E uses this rate schedule for service to customers with a maximum demand of 1,000 kW or more. The primary voltage was assumed to be 12 or 34.5 kV with one new meter for shoreside power purposes. PG&E, using its rate schedule and the typical annual usage pattern shown in Table 5-8, calculated average energy costs for an individual ship and the 4-vessel cohort. It was also assumed that a cruise ship would typically berth early in the morning at 6:00AM to disembark the passengers by 10:00AM, and would depart with new passengers by 6:00PM; this schedule checked well with most of the 2004 port call data and schedules. PG&E provided average costs of energy for the two scenarios considered in this study, a individual vessel nominally calling 12 times a year and a four vessel cohort calling 52 times a year as shown in Table 5-8. Given the infrastructure costs, it would be expected that including more vessels in the program would be a more effective project. However, in addition to infrastructure costs, PG&E (Zeller, 2005-1) estimated that the average energy billing rates would be considerably lower with the 4 vessel cohort at $0.156/kW-hr than with an individual vessel calling 12 times a year at $0.220/kW-hr.
21 PG&E also offers some incentive and power energy savings programs to reduce energy costs during peak power season periods. One program that might be of interest to a shoreside power application is the Base Interruptible Program (BIP), which is intended to provide load reductions on PG&E’s system on a day-off basis when the California Independent System Operator (CAISO) issues a curtailment notice (PG&E’s Schedule E-BIP is included in Appendix E). There are two options in the PG&E’s E-BIP with different notification periods and associated incentive payments on a monthly basis; Option A has a notification period of 30 minutes with a $7.00/kW incentive payment, and Option B has a notification period of 3 hours with a $3.00/kW-month incentive payment. Since it would require more than 30 minutes for a cruise ship to reduce the shoreside power and resource to its onboard power generation, Option B of the PG&E’s E-BIP could be applicable to shoreside power, if the Port and/or ship operators opt to take advantage of the incentive program. Under the terms of the BIP the customer only needs to reduce load to qualify not physically disconnect from the grid. A drawback would be the elimination of potential emission benefits of shoreside power during these entailment periods/events. However, PG&E’s E-BIP does have “Event Limits” to cap at the maximum number of event/days, and hours/events for these options.

September 2005 Final Report
H:\POSF\Report\Final_091205\Final\Sec 5.doc 5-25
This project may qualify for the Base Interruptible Program (E-BIP)22. Customers will be required to reduce their load down to their firm service level (FSL) within thirty (30) minutes notice (Option A). Under the terms of the BIP the customer only needs to reduce load to qualify not physically disconnect from the grid. PG&E anticipated that they could earn a $0.015/kWh to $0.019/kWh in incentives if they successfully participated in the program. Table 5-8. Sample vessel and 4-vessel cohort load demands for energy cost estimates.
Number of Calls Peak Part – Peak Off-Peak
Month One Vessel 4 Vessels Summer
(12 noon – 6 pm)8:30am – 12noon Summer8:30am – 9:30pm Winter
6pm – 8:30am Summer9:30pm – 8:30am Winter
January 0 0 February 0 0 March 1 4 9.5 hours per call 2.5 hours per call April 2 6 9.5 2.5 May 1 8 6.0 3.5 2.5 June 1 6 6.0 3.5 2.5 July 2 8 6.0 3.5 2.5 August 2 7 6.0 3.5 2.5 September 1 6 6.0 3.5 2.5 October 1 4 6.0 3.5 2.5 November 1 3 9.5 2.5 December 0 0 Summer considered as May-October. For the other ports studied or implementing shoreside power, a wide range of costs are experienced. At the terminal in Juneau, it has been reported that the rate is only 0.03$/kW-hr. (www.peninsulaclarion.com/stories/092800/ala_092800alapm0010001.shtml). For the cruise ship terminal in Seattle, the flat rate of 0.06 $/kW-hr is being charged at the port through the city owned utility (http://www.nwcurrent.com/renewable/1692337.html) and other offsets may be in the contract. However, in ENVIRON’s study for the Port of Long Beach (ENVIRON, 2004), the energy costs range from 0.20 to 0.40 $/kW-hr. More recently, the Port of Los Angeles has discussed subsidizing the cost of electricity for their shoreside power projects such that it is the same as the cost of the fuel that they would otherwise have burned (estimated as between 0.06 and 0.10 $/kW-hr). The Port of Long Beach has been trying to set up a Port-wide power distribution structure, and is claiming power prices in the range of $0.085/kwh. So the costs estimated here for the Port of San Francisco program fall within this range. Fuel Cost Savings - Ships would receive a fuel cost benefit by purchasing shoreside generated power instead of running onboard auxiliary diesel engines. Table 5-9 gives the estimated fuel savings for each selected ship based on the fuel consumption rates while hotelling and recent snapshot prices for MDO and IFO diesel fuels of $505 and $254 per metric ton (or $458 and $230 per short-ton on August 01, 2005 using Houston spot prices), respectively. As shown in this table, the annual fuel cost savings range from about $40,000 to more than $70,000.
22 ibid
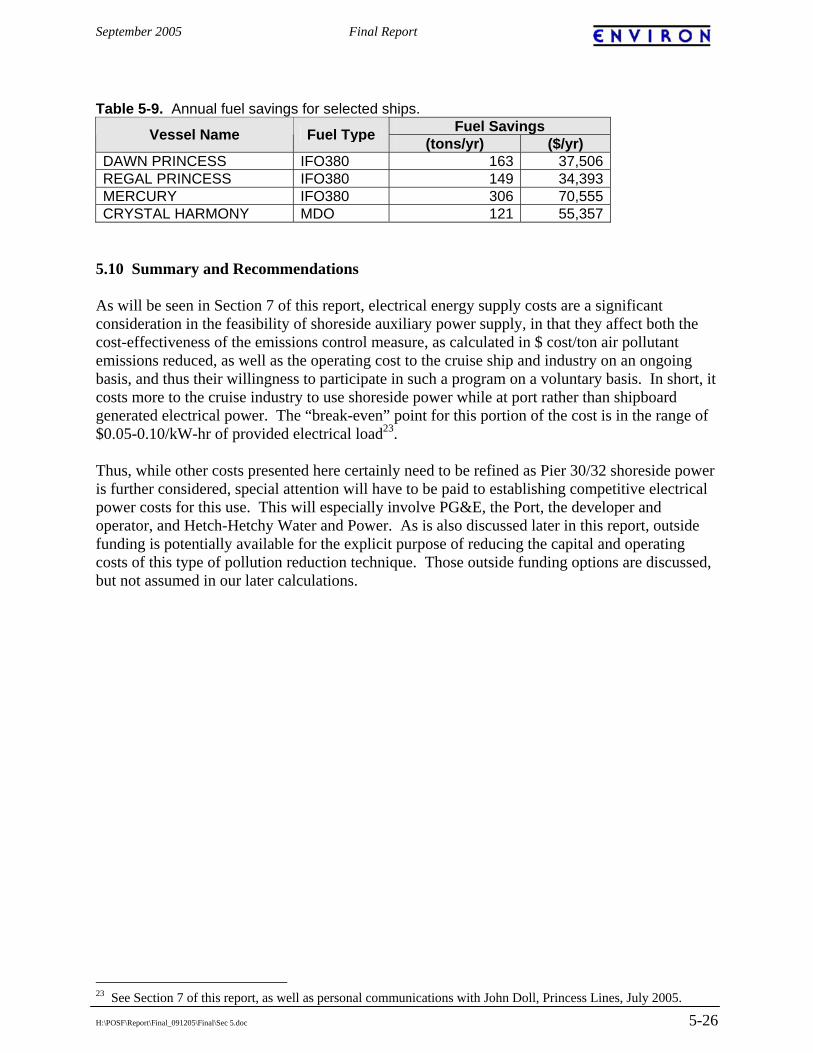
September 2005 Final Report
H:\POSF\Report\Final_091205\Final\Sec 5.doc 5-26
Table 5-9. Annual fuel savings for selected ships. Fuel Savings Vessel Name Fuel Type (tons/yr) ($/yr)
DAWN PRINCESS IFO380 163 37,506 REGAL PRINCESS IFO380 149 34,393 MERCURY IFO380 306 70,555 CRYSTAL HARMONY MDO 121 55,357
5.10 Summary and Recommendations As will be seen in Section 7 of this report, electrical energy supply costs are a significant consideration in the feasibility of shoreside auxiliary power supply, in that they affect both the cost-effectiveness of the emissions control measure, as calculated in $ cost/ton air pollutant emissions reduced, as well as the operating cost to the cruise ship and industry on an ongoing basis, and thus their willingness to participate in such a program on a voluntary basis. In short, it costs more to the cruise industry to use shoreside power while at port rather than shipboard generated electrical power. The “break-even” point for this portion of the cost is in the range of $0.05-0.10/kW-hr of provided electrical load23. Thus, while other costs presented here certainly need to be refined as Pier 30/32 shoreside power is further considered, special attention will have to be paid to establishing competitive electrical power costs for this use. This will especially involve PG&E, the Port, the developer and operator, and Hetch-Hetchy Water and Power. As is also discussed later in this report, outside funding is potentially available for the explicit purpose of reducing the capital and operating costs of this type of pollution reduction technique. Those outside funding options are discussed, but not assumed in our later calculations.
23 See Section 7 of this report, as well as personal communications with John Doll, Princess Lines, July 2005.
September 2005 Final Report
H:\POSF\Report\Final_091205\Final\Sec 6.doc 6-1
6. ALTERNATIVE CONTROL TECHNOLOGIES Modern marine diesel engines are remarkably efficient, reliable, and economic power generation units. Until recent years, the impact of ship emissions on air quality was considered insignificant. However, by 1997 worldwide concern for air quality began to focus attention on vessel emissions and the International Maritime Organization (IMO) adopted the International Convention for the Prevention of Pollution from Ships (MARPOL) Annex VI, “Regulations for the Prevention of Air Pollution from Ships.” This was followed by adoption of a set of marine diesel engine emission standards in 1999 (Tier 2) and in 2003 (Tier 3) by the United States Environmental Protection Agency (USEPA). All of these regulations established upper limits on marine engine emissions that are well in excess of those for highway vehicles. All allowed engine manufacturers three years to develop new designs that would comply with the regulations. None of the regulations applied to pre-existing engines. The vast majority of marine engines now in service were constructed before the imposition of any emission regulations. Because these engines were designed and built to give decades of safe reliable economic service, the impact to date of regulations on the quantity of worldwide marine engine emissions is small. The situation will change over the long term and tighter regulations are anticipated in the future. In the interim, ship diesel engine emissions continue to be of concern, particularly in populated regions confronting air quality concerns, such as the San Francisco Bay Area. The feasibility of shore power and alternative air emission technologies for the Port of San Francisco cruise ship terminal are being studied in anticipation that vessel operations at the terminal will have an adverse impact on air quality due mainly to the following findings:
• Diesel engines on cruise ships calling at the terminal were manufactured and entered service prior to the imposition of effective marine engine emission regulations. Such engines are sometimes referred to as "unregulated" engines;
• The residual fuel used in cruise ship engines is characterized by a relatively high level of
impurities, notably sulfur and ash, as well as agglomerations of hydrocarbon molecules called asphaltenes; and
• The combination of these components in the fuel and the peak temperature of the diesel
combustion process result in problematic levels of particulate matter (PM), nitric oxides (NOx) and sulfur oxides (SOx) in the engine exhaust. These are the three primary emissions of concern for health and air quality regulations. Secondary, but nevertheless, harmful emissions of concern are carbon monoxide (CO), carbon dioxide (CO2), unburned hydrocarbons (HC), volatile organic compounds (VOC), and opacity.
It should be noted that the discussion in this section bears upon applications of large, medium speed marine diesel engines used for cruise ship propulsion and electric generator applications. (Much of the discussion applies with equal validity to large, slow speed marine propulsion engines; small, high speed marine propulsion engines; and auxiliary service engines. However, these latter categories of equipment are not included in the field of cruise ship engines covered by the feasibility study and so are outside of its scope.) All discussion that follows is, therefore, directed towards the management of exhaust emissions from medium speed diesel engines.
September 2005 Final Report
H:\POSF\Report\Final_091205\Final\Sec 6.doc 6-2
Also, the design, construction, and operation of ships is subject to safety rules and regulations administered by the United States Coast Guard and classification societies including the American Bureau of Shipping, Bureau Veritas, and Lloyd's Register. Any significant change to existing ship design, construction, and/or operating procedures is subject to review and approval by these agencies. In addition, where technical proposals involve shore facilities, the review and approval by local agencies including zoning, construction code, environmental safety, homeland security, police, and fire departments is required. As a consequence, shore power and all of the alternative technologies discussed in this report must be considered preliminary proposals pending review and approval in accordance with applicable regulations and ordinances. Several technical and operational alternatives to shore power exist for reducing or eliminating emissions from cruise ship diesel engines. The costs and benefits of alternatives to shore power cover a broad range depending on the pollutant controlled and where within the airshed the emissions are controlled. In most cases, a control technology employed will primarily or exclusively affect either particulate or nitric oxide emissions but not both. Also, it is clear that the impact on air quality depends on the spatial allocation of emissions, so emission reductions that occur away from berth during transit (because most cruise ships are designed to allow the same engines to produce both propulsion and auxiliary power) may not produce the same improvement in air quality that shoreside power does, especially for those directly affected by the terminal operations. Alternative technologies to shore power have been grouped into four general categories in this report. Section 6.1 addresses possible cruise ship engine upgrades. Section 6.2 reviews alternative exhaust after-treatment techniques to reduce the levels of harmful components in cruise ship engine emissions. Section 6.3 investigates ship fuels and shipboard fuel modifications to achieve reduced emissions. Section 6.4 summarizes the feasibility of alternative means to provide the energy requirements of cruise ships at berth. 6.1 New Engines and Engine Modifications Manufacturers of marine diesel engines and after market equipment vendors have responded to the MARPOL regulations by developing and proof testing improved hardware and software designs. These are now available on the new (regulated) engines and in some cases as retrofits to older (unregulated) engines. However the new engines just meeting the MARPOL standards are expected to result in a minimal NOx reduction (0-10%) from the unregulated levels for medium-speed diesel with little effect on PM emissions when burning high sulfur (2.5%) fuels as described in Section 4.2. Both the replacement of older diesel engines with regulated engines and the modification of older diesel engines with emission reducing components might be accomplished within the existing space limitations of ship machinery compartments, but this is a significant consideration. Another important operational advantage of replacing or upgrading an existing unregulated ship engine with lower emission equipment is that the benefits, unlike shore power. are effective full-time and can impact emissions generated while meeting both ship propulsion and electrical energy demands. To be specific, a ship with new or upgraded engines will improve California air quality the entire time (measured in days per voyage) it is operating in California regional waters, as opposed to the mere eight to ten hours (with the propulsion plant secured) at the Port of San Francisco cruise ship terminal.

September 2005 Final Report
H:\POSF\Report\Final_091205\Final\Sec 6.doc 6-3
The chief air quality disadvantage of engine replacement or modification compared with shore power is that the maximum emission reduction from engine replacement or modification is at best fractional while shore power enables a 100 percent benefit (zero emissions) while at berth. So, any cost effectiveness estimate depends on whether or not those benefits incurred during transit are included The marketing and engineering focus of marine engine manufacturers is heavily weighted toward new engines and compliance with international and national emissions regulations. Progress has been and continues to be made. New marine diesel engines are now available with design features that could achieve 15 to 30 percent lower NOx emissions, depending upon the age and model of the unregulated engine under consideration for replacement, though not all engines may produce these emission reductions. Turbines represent another emission control option and are also used on some of the cruise vessels calling at the Port. Turbines produce less than 50% of NOx emissions compared with medium speed diesel engines. Turbines also produce very low levels of particulate because of the combustion design and they require a very low sulfur fuel. Other advantages of turbines are the small size and long operational lifetime. However, the fuel costs for turbines can be significant because the turbines are less efficient (consume 40% more than a diesel engine) and the fuel costs are much higher. If a turbine were already equipped on a vessel, its use would reduce the benefit of employing shoreside power and might represent a reasonable alternative. However, excepting rare cases of major reconstruction programs (as when Cunard's QUEEN ELIZABETH 2 was converted from steam turbine to diesel electric propulsion), the expense of repowering a cruise ship is prohibitively high. Repowering subjects the ship operator to a prolonged loss of service revenue in addition to the enormous purchase and replacement costs (in the order of tens of millions of dollars) of new engines. Such expenses are difficult to justify on the basis of emissions benefits, and only enter the realm of economic feasibility when considered in conjunction with other ship reconstruction objectives. On the other hand, it is reasonable to anticipate that, as a matter of prudent business practice, no ship operator planning a major vessel conversion program would consider repowering with engines that did not comply with the most stringent emissions regulations. The type of engine and its emissions used on board may also be a consideration when owner/operators order new ships. Engine Modifications Some engine manufacturers and after market vendors offer retrofit equipment to upgrade existing ‘unregulated’ engines with one or more of the emission reducing features developed for newer ‘regulated’ engines. The list of proven engine modifications and their anticipated impacts on emissions are briefly summarized in the Table 6-1. Table 6-1. Engine modification alternatives. Engine Modification Anticipated Impact On Emissions Modify cylinder heads for direct water injection. Reduce NOx 10 to 20%. Delay injector timing; injector upgrade Reduce NOx 20% Install an exhaust gas recirculation (EGR) system. Reduce NOx 20%, increase HC, CO, and PMInstall an inlet air humidification system. Reduce NOx 10% Ceramic coat cylinder combustion surfaces. Reduce organic PM 5%

September 2005 Final Report
H:\POSF\Report\Final_091205\Final\Sec 6.doc 6-4
As indicated, none of the proven engine retrofit technologies provides the full suite of desirable benefits, and some actually incur emissions penalties. Retrofitting reduced emissions hardware to existing marine engines is also problematic due to the high cost and equipment downtime required for the modifications. While admittedly a relatively minor task compared to repowering, retrofitting an engine is typically too time consuming to be accomplished on a routine voyage-turn basis and will have to be deferred until the ship is inactivated for periodic drydocking, repair, or other reasons. The cost of new hardware, engine control software, and conversion labor can be anticipated to be in the order of $350,000 to $1,000,000 per engine. 6.2 Engine Exhaust After-treatment Systems This category includes both shipboard and external systems designed to reduce exhaust emissions before they are released into the atmosphere. The technologies identified in Table 6-2 provide a range of potential feasible alternatives. They can be installed either individually or as a combination to address both NOx and PM emissions. Table 6-2. Potential exhaust after-treatment alternatives. Treatment Technology Projected Impact On Emissions Selective Catalytic Reduction (SCR) Up to 95% reduction in NOx (followed by a DOC for
ammonia clean up) Ionizing Wet Scrubber (IWS) 95% reduction in SOx, 90% reduction in PM Diesel Oxidation Catalyst (DOC) 40% reduction of organic1-PM, 90% in ROG and CO Diesel Particulate Filter (DPF) 2 90% reduction in organic-PM, ROG, CO, SOx 1 The organic fraction is less than 10% of PM emissions when using IFO at 2.5% sulfur and about 50% of PM emissions when using MGO at 0.2% sulfur. 2 Typically requires the use of ultra-low sulfur (15 ppm) diesel fuel. Both the oxidation catalysts and particulate filters affect only the organic portion of the PM emissions from vessels and are more effective with engines burning very low sulfur fuels. For engines burning high sulfur fuel, this study estimated that over 90% of the particulate mass is due to hydrated sulfate from the fuel sulfur. The oxidation catalyst reduced only a portion of the organic particulate (less than 10% of the particulate produced from high sulfur fuel), called the soluble organic fraction (SOF), which is comprised of primarily unburned fuel and engine oil. The particulate trap reduces the SOF and elemental carbon fraction of the particulate. With a catalyzed filter, the sulfur in the fuel may be converted to particulate sulfate more readily, possibly increasing the total particulate. This conversion necessitates the use of ultralow sulfur fuel. Uncatalyzed particulate filter alternatives exist, but would provide minimal reduction without a lower sulfur fuel. Shipboard Systems Shipboard engine exhaust treatment systems share the operational advantage of repowering and engine modifications in that they can be beneficial full-time, with both propulsion and auxiliary engines, and are not limited to dockside operating hours. A handful of distillate-fueled vessels have been built or retrofitted with some of these systems. One major potential drawback of retrofitting shipboard exhaust treatment systems to existing vessels is that they require locations

September 2005 Final Report
H:\POSF\Report\Final_091205\Final\Sec 6.doc 6-5
and space that, depending upon the hull and machinery arrangement, may not be readily available. The control options SCR, DOC and DPF are not feasible without additional measures and would provide little PM reduction when high levels of SOx are present in the exhaust. These treatment options and their potential benefits can only be considered if a change to a low sulfur distillate fuel is made or if an effective IWS is installed upstream to remove SOx from the exhaust gas. DPF technology has enjoyed success in small land vehicle applications but presents practical maintenance (filter plugging) problems when considered for the much larger engines used aboard ships. SCR and IWS are individually ineffective exhaust treatment systems because neither deals with both NOx and PM emissions. However, the combination of SCR and IWS is effective with an anticipated 90% reduction in PM and 95% reductions in both NOx and SOx. While short of the zero emissions possible with shore power, these are, nevertheless, impressive emission reduction options. SCR needs a supply of ammonia (NH3) to deal with NOx. The ammonia is typically provided by an onboard tank of aqueous urea (NH2CONH2). IWS requires a supply of hazardous sodium hydroxide (NaOH) solution for removal of SOx. Shipboard logistics, storage and handling of these chemicals increase operating costs and raise safety issues. The liquid sludge effluent from a combined SCR/IWS exhaust treatment facility contains compounds of sodium sulfate as well as heavy metals from the ash including vanadium and nickel. These materials cannot be simply discharged into harbor waters or a municipal sewer system. The liquid sludge will require storage aboard ship in a special holding tank until eventually disposed under controlled conditions. Disposition of the sludge at the Port of San Francisco will require use of an approved toxic waste management contractor and full documentation. The capital expenditure required to retrofit a combined SCR/IWS system aboard any of the selected cruise ships is estimated to be in the order of two to three million dollars per ship. Annual operating costs would depend on the number of hours of use, but will be significant in any case, probably in the order of at least $50,000 to $100,000 per cruise ship if the system is employed regularly. (ACTI, 2005) External Systems External exhaust treatment systems using the foregoing proven technologies have been proposed but not yet built for handling emissions from ships at dockside. These systems consist of a shore or barge mounted facility and piping apparatus designed to capture, treat, and release ship stack gas to the atmosphere. The chief benefits of the concept are the following:
• Limited capital investment (one facility handles all ships); and • There are no requirements for additional equipment space, significant involvement of
offshore personnel, hazardous chemicals, or toxic effluents to be managed aboard the ships.
A noteworthy proposal of this technology (entitled Advanced Maritime Emissions Control System (AMECS) has been made by Advanced Cleanup Technologies, Incorporated (ACTI) and is presently under consideration for cargo terminals in the Ports of Los Angeles and Long Beach. The AMECS proposal involves a tall barge mounted structure and exhaust piping apparatus to

September 2005 Final Report
H:\POSF\Report\Final_091205\Final\Sec 6.doc 6-6
access the area above the ship stack, and to connect and soft seal itself to the exhaust uptake(s) of the ship engine(s) in service. The engine exhaust is subsequently directed via the piping apparatus to a treatment unit on the barge. At the Port of San Francisco cruise ship terminal, tidal action is modest and vessel draft changes at berth are minimal. A shore-based facility would therefore be adequate and more economical to operate than a barge-mounted facility (which would require costly positioning by a harbor tug for each cruise ship call). The ACTI proposed external exhaust treatment facility employs an effective multistage emission control unit combining an IWS and SCR. As a shore installation, this facility and its chemical logistics requirements would have to comply with routine industrial safety codes, ordinances, and environmental regulations, but its impact on shipboard operations and costs would be relatively insignificant. The claimed benefits are a 90% reduction in PM and 95% reduction in both NOx and SOx. While still short of the zero emissions possible with shore power, these are impressive numbers. The preliminary ACTI cost estimates for the proposed shore based external system are substantial - $7,000,000 in initial capital investment and projected $1,000,000 annual operating costs. (ACTI, 2005) The preliminary cost estimates of a shore-based exhaust treatment facility exceed the estimated costs of a shore power installation serving the four selected cruise ships. However, in view of the excellent claimed emissions benefits and because the proposed facility would conceivably handle many of the cruise ships calling at the Port of San Francisco, its expense may well be effectively equal to or less than the combined costs of other feasible emission reducing alternatives. However, while the concept may prove suitable for marine cargo terminals, attention would be required to ensure that its very tall structure does not impose an unacceptable visual impact on the design aesthetics of cruise ships or the architecture of the adjoining passenger terminal. 6.3 Fuel Modifications and Alternative Fuels The owner/operator specified fuel oils now in use aboard the selected four cruise ships are listed in Table 6-3. The higher fuel sulfur level is expected to result in higher PM emissions, and usually the high sulfur fuels result in an increase in NOx levels, most likely due to high nitrogen content associated with high sulfur fuels. Table 6-3. Fuel specifications for the four vessels studied. Ship Fuel Oil REGAL PRINCESS IFO 180 (IFO 180 centistokes kinematic viscosity @ 50oC) (1.5%
sulfur) DAWN PRINCESS IFO 380 (IFO 380 centistokes kinematic viscosity @ 50o) (2.5%
sulfur) CRYSTAL HARMONY MDO 1SO DMB (MDO, 6 centistokes kinematic viscosity @40oC)
(0.2% sulfur) CELEBRITY MERCURY IFO 380 (IFO 380 centistokes kinematic viscosity @ 50oC) (2.5%
sulfur)

September 2005 Final Report
H:\POSF\Report\Final_091205\Final\Sec 6.doc 6-7
Marine Fuels: Residuals versus Distillates Residual fuel oils are petroleum products primarily composed from the residue of refining processes. The residue consists of dense, viscous products and inorganic compounds remaining after lighter, high quality distillate products such as gasoline, highway diesel fuel, and kerosene have been removed from the crude oil feed stock. The residual product is mixed with a small quantity of a compatible but less viscous product to enable the resulting blend to be readily stored, pumped, and used as fuel. The following provides a few general notes on marine and California highway diesel fuels with respect to their sulfur and ash contents, product origins, costs, and emissions:
• IFO 180 and 380 fuel oils contain 2.5 to 3.5% sulfur and are blends of refinery distillates and (primarily) residual oils;
• Marine Diesel Oil (MDO) typically contains less than 2% sulfur and is a distillate. A ‘DMB’ designation establishes that it cannot be transported in a tank containing traces of residual oil. A ‘DMS’ designation establishes that it is permissible to transport it in a tank containing traces of residual oil;
• Marine Gas Oil (also known as Number 2 Diesel fuel) (MGO) typically contains less than 1.5% sulfur, and most likely much lower, and is a high quality distillate. It cannot be transported in a tank containing traces of residual oil;
• California low sulfur diesel fuel (also known as California highway diesel) contains only 0.3% sulfur (and starting in 2006 will average 15 ppm) and is a premium quality distillate. This fuel is not widely available in the marine industry. It has recently achieved limited application to harbor craft such as commuter ferries and towboats operating in California and Texas ports;
• Marine fuel prices, like the prices of all petroleum products, are subject to inflation and wide fluctuations. Daily spot market prices are obtainable at ports all over the world, but long-term price projections are highly speculative. In general, it can be said that fuel costs vary inversely with sulfur content and viscosity numbers, as indicated in the following approximation of March 2005 West Coast spot prices. These prices exclude barging and related delivery costs1:
o IFO 380 - $226/metric ton o IFO 180 - $241/metric ton o MDO ---- $500/metric ton o MGO ---- $600/metric ton
• An early March 2005 price for California highway diesel fuel is $2.50/gallon at San
Francisco Bay Area service stations. Subtracting applicable Federal and State taxes (24.4 cents per gallon and 18 cents per gallon, respectively) the price of this fuel for marine purposes is approximately $2.10/gallon, or $635 per metric ton;
1 Barging, fuel oil surveys and laboratory analyses to verify fuel quality represent a variable percent addition to the basic fuel price, depending largely on the quantity of the fuel order. A very rough approximation of 3% can be assumed for purposes of preliminary discussions. To illustrate: A 200 ton delivery of MDO might cost the shipowner 200 tons x $500/ton x 1.03 (for barging, etc. expenses) = $103,000. These fuel costs were presented here to illustrate how the costs vary inversely with fuel sulfur contents, and were not used in the cost effectiveness analysis; instead August 2005 spot prices were used in the analysis.

September 2005 Final Report
H:\POSF\Report\Final_091205\Final\Sec 6.doc 6-8
• Fuel ash content tends to increase with fuel density and sulfur content and directly contributes to PM emissions; and
• Fuel sulfur content directly relates to SOx emissions and, like ash content has a substantial impact on PM emissions. The higher the sulfur and ash content, the higher the PM emissions.
The four selected ships comply with standard cruise industry practice by employing modestly priced fuels. The engines and shipboard fuel treatment systems aboard these ships have been optimized to give safe, reliable, and economic service with those fuels. An uncompensated switch to a higher cost distillate fuel would impose a substantial increase in operating expense and place the ship operator in a competitively disadvantaged position. However, the operators of the CRYSTAL HARMONY responded that it already uses low sulfur (0.2%) fuel oil indicative of MGO, and the operators of the REGAL PRINCESS responded that it uses a lower sulfur (1.5%) IFO fuel in Alaska. Because the sulfur in the fuel can be responsible for a large portion of the PM emissions, the California Air Resources Board (CARB) is considering a program to encourage the use of MDO for ship auxiliary diesel engines operating in California regional waters2. If all cruise ships use low sulfur fuel, the effective emission reductions for shoreside power would be reduced. Alternative Fuels The choice of any marine fuel from the field of alternatives has traditionally been primarily based on economic considerations. These are chiefly the cost of the fuel itself and the consequent costs of ship maintenance, fuel logistics, and convenience of operations. Three of the four cruise ships selected for this feasibility study operate on conventional liquid fuels. The option of conversion to a dual fuel ship, enabling dockside operations with a less polluting gaseous fuel, such as compressed natural gas, would require the complete and probably infeasible reconstruction of the diesel engines to add a spark ignition system and alter engine timing. The ship fuel storage and delivery system, engine lubricating system, and control systems would likewise require massive alterations. A full range of dual fuel safety concerns would have to be addressed. These modifications, if technically possible, would amount to a complete multimillion-dollar replacement or reconstruction of the ship engine(s), fuel systems, fuel storage tanks, and fuel delivery logistics. As noted, the expense for a ship retrofit is astronomical and cannot be justified on the basis of reduced emissions in port. The synthetic Fisher-Tropsch Diesel Fuel and biomass derived Bio-Diesel Fuel have both been proposed as diesel emission reducing options for marine applications. Each remains problematic. Fisher-Tropsch appears to offer significant emissions benefits, but is still a new technology under development insofar as supply logistics, costs, and vessel safety issues are concerned. More time is needed before it can be seriously considered a viable emission reducing alternative for the Port of San Francisco cruise ship terminal. Bio-Diesel has appeared in very limited vehicular applications on California streets and highways. Vessel emissions tests conducted in 2002 in San Francisco Bay (under direction of the San Francisco Bay Area Water Transit Authority) established that, compared to operations with California highway diesel fuel, Bio-Diesel reduced PM 30% but simultaneously raised NOx emissions an unacceptable 13%. 2 http://www.arb.ca.gov/msprog/offroad/marinevess/documents/draftproposal051805.pdf
September 2005 Final Report
H:\POSF\Report\Final_091205\Final\Sec 6.doc 6-9
The remaining alternative cruise ship fuels are liquid distillate products produced by the petroleum industry for marine and highway use. As previously noted, the prices of fuel oils increase dramatically with quality, lower sulfur content, and progressively lower emissions signatures. The choice of an emission reducing alternative distillate fuel for in port service is therefore ultimately driven by the operating cost differential between the existing and proposed fuel(s). In addition to the problem of comparative costs, a distillate fuel flash point question arises as a consequence of ISO and Safety of Life at Sea (SOLAS) regulations. These require that the flash point of marine fuels be a minimum of (no less than) 60 degrees C. Since the flashpoint of MGO can vary between 57 and 69 degrees C it is possible that an MGO fuel could be received that is not in compliance with the regulations. The risk is even greater with California highway diesel. It has a minimum flash point of 130 degrees F (54.4 degrees C). The best means to approach this issue is to request U.S. Coast Guard approval of a feasible solution for each cruise ship. It is possible that, in consideration of the local air quality benefits, an exception to the regulations would be granted. The approval request would have to include detailed engineering drawings and specifications and ensure that the proposed distillate fuel storage and piping systems are positioned away from sources of heat, such as boilers. A potential engine lubrication problem arises from the fact that marine diesel engine lubricants are tailored to suit the fuel in use. If a long-term switch in fuel type occurs, a change in engine lubricating oil specifications will probably be required. The question is largely dependent on the duration of planned operations with distillate versus residual fuel and the properties of the two specific fuels involved. A switch to lubricating oil with different specifications can be problematic, particularly on a ship underway at sea. Such things as a new auxiliary lubricating oil tank or a change in engine lubricating oil feed rate may be required. As a consequence, the concept of changing to a distillate fuel upon entering port and changing back to a residual fuel upon departure 10 to 12 hours later may not be feasible. The fuel and lubrication questions posed by this concept need to be investigated with the engine manufacturer on a ship specific, case by case basis, and are beyond the scope of this study. Fuel Modifications As previously described, one of the primary sources of harmful components in marine diesel engine exhaust is the high peak temperature of the diesel combustion process, which causes NOx. The most effective means developed to date for reducing diesel NOx emissions involves the introduction of fresh water into the engine combustion chamber to reduce the peak combustion temperature. Engine designs incorporating either direct water injection into the cylinder combustion space or inlet air fogging systems were discussed previously under the New Engines and Engine Modifications and found to be generally lacking due to their high capital cost and limited emissions benefits. A more practical, beneficial, and broadly accepted method to introduce water into the engine combustion chamber employs a stable water-fuel emulsion, in which approximately 15 to 25 % of the of the resulting blend is fresh water and the rest is fuel. The water content of emulsified fuels produces no energy, so the volume of emulsified fuel required producing a unit of power (such as one kilowatt) is 15 to 25% greater than the volume of unblended (straight) fuel needed for the same power. This leads to the potential need, if an engine is operated at or near rated output, for larger sized fuel injectors and fuel service pumps.

September 2005 Final Report
H:\POSF\Report\Final_091205\Final\Sec 6.doc 6-10
In addition, for residual fuel installations, special safety controls are required to prevent the engine from overspeeding during an accidental failure of the fresh water supply to the emulsification unit. The choice to operate on either straight or emulsified fuel is largely at the discretion of the ship operator. Emulsified fuel can be used full or part time, underway at sea and/or in port. NOx reducing fuel-water emulsions come in two basic forms. Residual Fuel/Water Emulsions - When a residual fuel is used, a stable emulsion can be achieved with an onboard high-energy system that blends fresh water with the fuel and concurrently homogenizes the fuel so that the agglomerated, hard to burn molecules characteristic of residual fuels are eliminated. This kind of system has been proven successful and reliable by decades of service in large land utility engine applications. NOx has been reduced by 20 to 25%, PM roughly 4%, and exhaust opacity completely eliminated. The United States Maritime Administration and California Air Resources Board are currently proposing a large, deep-sea vessel demonstration of this technology in California regional waters. Shipboard space requirements for an onboard water-fuel emulsification system have been modest and readily managed. The capital expenditure for a cruise ship installation is estimated to be in the order of $200,000 to $250,000. This would cover all ship modifications, equipment, and personnel training. Additional operating expenses would be relatively minor, primarily the cost of supplying the fresh water for the emulsion and for routine maintenance of the emulsification equipment and controls. These operating costs are typically less than the engine fuel and maintenance savings that result from improved combustion. Fuel consumption savings are in the order of 5%. (Enabling a corresponding reduction of 5% in the "greenhouse gas" CO2). Mineral and soot deposits on engine internals and engine exhaust heated boilers are substantially reduced, with consequent beneficial impact on parts longevity and minimized risk of accidental exhaust system fires. A properly tuned shipboard system can even be set for optimization under two distinct operating modes: (a.) minimum NOx and PM emissions while in port (b.) minimum fuel consumption while underway at sea. For the Port of San Francisco cruise ship terminal, a convenient and simple shore hose connection would provide a low cost supply of municipal potable water for the emulsification unit. For extended service underway at sea, the ship would need to dedicate or convert a portion of existing internal tank capacity to provide the required increase in fresh water storage volume. This water would be replenished from shore potable water supplies while the vessel is berthed in ports of call. A shipboard residual fuel/water emulsion-homogenization system can therefore provide a significant reduction to NOx and PM emissions and eliminate exhaust opacity for relatively low cost. Its chief emissions drawback is that the NOx and PM reductions are only partial, and no improvement is achieved in SOx emissions.

September 2005 Final Report
H:\POSF\Report\Final_091205\Final\Sec 6.doc 6-11
Distillate Fuel/Water Emulsions - Unlike residual fuels, distillate fuels cannot maintain emulsions without the addition of stabilizing surfactants. Two vendors (Lubrizol and Aquazole) now manufacture stabilized blends of distillate diesel fuels for highway and off-highway use. These products typically employ blends of 15% water and 85% distillate fuel. The California Air Resources Board has verified that the Lubrizol product PuriNOx reduces emissions of NOx 14%, PM 63%, and VOC 25% when run with fuels with sulfur levels below 500 ppm. These emissions benefits were determined in comparison to another distillate fuel, Number 2 diesel oil. If PuriNOx is compared with a residual fuel oil, the PM reduction would be even greater and there would be a virtual elimination of SOx. The chief drawbacks unique to the use of distillate fuel/water emulsions aboard cruise ships are high blended fuel costs, ship tank and piping system conversion costs to enable the use of two fundamentally different liquid fuels, possible engine lubrication problems, and the regulatory issue concerning fuel flash point. In addition to these, fuel injector and fuel service pumps must either be confirmed adequate or increased to handle the additional volume of water in the emulsion, as previously discussed under "Residual Fuel/Water Emulsions". The high cost of distillate emulsions poses a major problem. The distillate fuel/water emulsion alternative begins with the assumption of a switch to the most expensive grade of marine (or California highway) fuel and then imposes degradation in engine fuel economy of roughly 15% by adding water and surfactant to the blend. The net result to the ship operator is a tripling of fuel costs at berth. To illustrate, suppose CELEBRITY MERCURY changed from the present IFO 380 to an MGO water emulsion for in-port power. The ship's present reported consumption of fuel at berth is 1.8 metric tons/hour x 10 hours = 18 metric tons of IFO 380 at $254/metric ton. This totals to about $4,600 per port call. With 15% water in the alternative emulsified MGO fuel the engine consumption would have to increase 18% (1/0.85) and the cost of the MGO used in the blend would be about $600/metric ton. The net result is a new operating fuel cost of about $12,700 per port call. Of course, the price differential between MGO and IFO costs varies, and recent spot prices could vary (http://www.lloydslistbunker60.com/) somewhat, and so affect this estimated cost differential. A potential engine lubrication problem arises from the fact that marine diesel engine lubricants are tailored to suit the fuel in use. If a long-term switch in fuel type occurs, a change in engine lubricating oil specifications will probably be required. The question is largely dependent on the duration of planned operations with emulsified distillate versus residual fuel and the properties of the two specific fuels involved. A switch to lubricating oil with different specifications can be problematic, particularly on a ship underway at sea. Such things as a new auxiliary lubricating oil tank or a change in engine lubricating oil feed rate may be required. As a consequence, the concept of changing to an emulsified distillate fuel upon entering port and changing back to a residual fuel upon departure 10 to 12 hours later may not be feasible. The fuel and lubrication questions posed by this concept need to be investigated with the engine manufacturer on a ship specific, case by case basis, and are beyond the scope of this study. In addition to the foregoing, a flash point question arises as a consequence of ISO and Safety of Life at Sea (SOLAS) regulations. These require that the flash point of marine fuels be a minimum of (no less than) 60 degrees C. Since the flashpoint of MGO can vary between 57 and 69 degrees C it is possible that an emulsified MGO fuel could be received that is not in

September 2005 Final Report
H:\POSF\Report\Final_091205\Final\Sec 6.doc 6-12
compliance with the regulations. The risk is even greater with California highway diesel. It has a minimum flash point of 130°F (54.4°C). The best means to approach this issue is to request U.S. Coast Guard approval of a feasible solution for each cruise ship. It is possible that, in consideration of the local air quality benefits, an exception to the regulations would be granted. The approval request would have to include detailed engineering drawings and specifications and ensure that the proposed emulsified distillate fuel storage and piping systems are positioned away from sources of heat, such as boilers. 6.4 Advanced Technologies The field of advanced technologies for cruise ships calling at the Port of San Francisco is severely limited by practical economics, demand, and size considerations. Solar and wind power are non-polluting but costly per unit of energy and insufficient in capacity to meet cruise ship demands. Fuel cells, storage batteries, geothermal, hydroelectric, and nuclear energy also fail to meet practical feasibility and economic requirements. A new land or barge-mounted spark-ignition (gasoline or natural gas) engine-generator installation of sufficient power capacity would enable lower emissions but would be very costly to construct and operate. A new land- or barge-sited natural gas fueled gas turbine generating station would be a preferable choice and would enable significantly lower emissions than shipboard diesel generators. However, the capital and operating costs of any of these proposals would be at least equal to, if not substantially higher than, utility grid furnished shore power generated with comparably low emissions natural gas fired steam and/or gas turbine power plants. 6.5 Summary Alternative technologies can be employed in tandem with one another or separately. However, to produce equivalent emission reductions to shoreside power, more than one option must be employed. In Table 6-4, a suite of alternative controls is reviewed along with cost and effectiveness estimates for the four-vessel cohort subject to this study. The control technologies chosen were those deemed most feasible in terms of implementation. A number of assumptions were required to estimate the emission reductions and costs, so the figures in Table 6-4 should be considered uncertain and require more study.
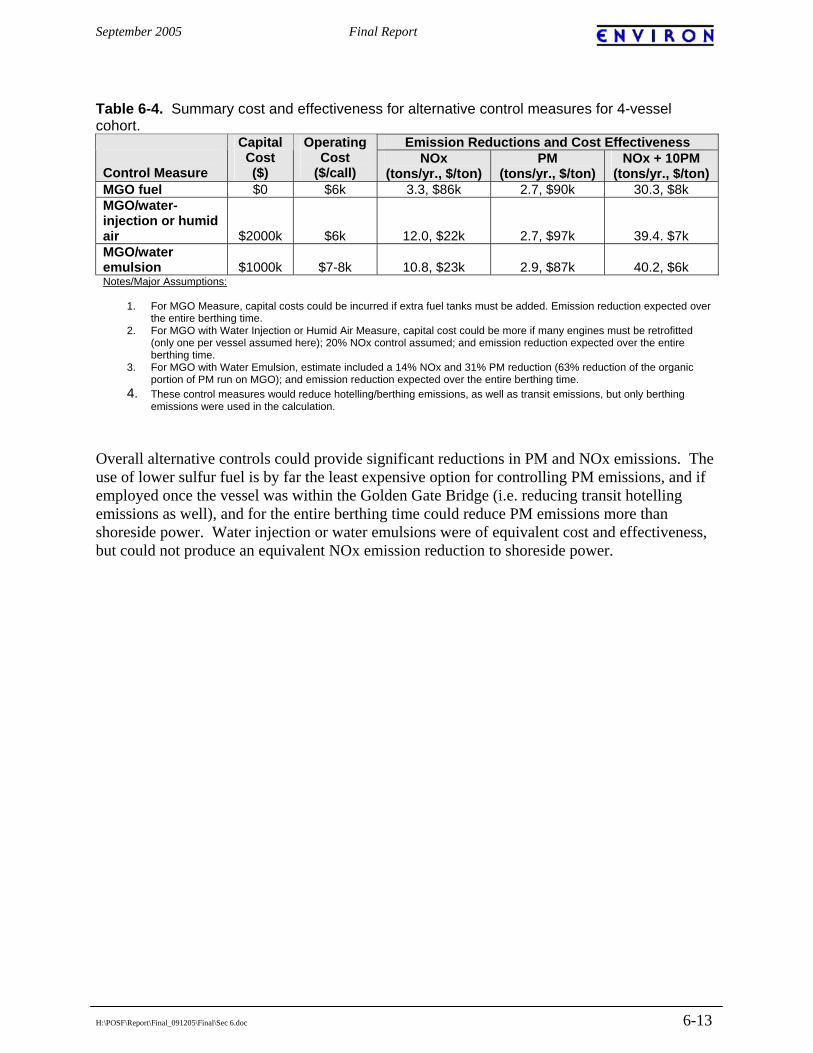
September 2005 Final Report
H:\POSF\Report\Final_091205\Final\Sec 6.doc 6-13
Table 6-4. Summary cost and effectiveness for alternative control measures for 4-vessel cohort.
Emission Reductions and Cost Effectiveness Control Measure
Capital Cost ($)
Operating Cost
($/call) NOx
(tons/yr., $/ton) PM
(tons/yr., $/ton) NOx + 10PM
(tons/yr., $/ton) MGO fuel $0 $6k 3.3, $86k 2.7, $90k 30.3, $8k MGO/water-injection or humid air $2000k $6k 12.0, $22k 2.7, $97k 39.4. $7k MGO/water emulsion $1000k $7-8k 10.8, $23k 2.9, $87k 40.2, $6k Notes/Major Assumptions:
1. For MGO Measure, capital costs could be incurred if extra fuel tanks must be added. Emission reduction expected over the entire berthing time.
2. For MGO with Water Injection or Humid Air Measure, capital cost could be more if many engines must be retrofitted (only one per vessel assumed here); 20% NOx control assumed; and emission reduction expected over the entire berthing time.
3. For MGO with Water Emulsion, estimate included a 14% NOx and 31% PM reduction (63% reduction of the organic portion of PM run on MGO); and emission reduction expected over the entire berthing time.
4. These control measures would reduce hotelling/berthing emissions, as well as transit emissions, but only berthing emissions were used in the calculation.
Overall alternative controls could provide significant reductions in PM and NOx emissions. The use of lower sulfur fuel is by far the least expensive option for controlling PM emissions, and if employed once the vessel was within the Golden Gate Bridge (i.e. reducing transit hotelling emissions as well), and for the entire berthing time could reduce PM emissions more than shoreside power. Water injection or water emulsions were of equivalent cost and effectiveness, but could not produce an equivalent NOx emission reduction to shoreside power.

September 2005 Final Report
H:\POSF\Report\Final_091205\Final\Sec 7.doc 7-1
7. COST-EFFECTIVENESS ANALYSIS This section addresses the project cost-effectiveness using information discussed in other sections, including Section 4 Auxiliary Mode Emission Analysis and Section 5 Conceptual Design of a Shoreside Power System. The capital and operating costs were combined from the different elements of the project and amortized to present dollars over the life of the project. The cost and cost effectiveness is provided in terms of individual vessels, and two, three, and four vessel cohorts. 7.1 Costs Summary Section 5 describes in detail the project and assumptions used in estimating capital and operating costs for the Port of San Francisco project. This section provides the cost estimates for land and vessel capital and the amortized operating cost requirements. The total project cost is presented as a present value to be compared with the emission reductions over the life of the project. Specific elements of the landside project include an underground high voltage system for a two-pier system allowing scheduling flexibility for ships with shoreside power connections. Low cost and a high cost sensitivity cases are presented. The low cost sensitivity case eliminates 50% of the capital cost for landside construction because some electrical power infrastructure (such as trenching and other similar activities) must already be in place to bring power to the piers. The high cost sensitivity case for landside capital costs is for an underground system in the absence of any other construction. The low cost case is 50% of the high cost case. As noted in Section 5, historically, the cost to retrofit vessels to permit shoreside connections has been in the order of $500,000. A contingency cost of $700,000 was used to account for inflation and other unknown situations with many of the vessels considered for shoreside power. As is demonstrated later, this cost differential for vessel retrofit is a minor element in the total cost of the project. The landside operating costs were estimated for operating personnel assigned to maintain the shoreside connections and other aspects of the facility. The personnel cost ($137,280 per year) was for one full time equivalent, which could be amortized for one or more vessels calling at the Port. No adjustment was made for the number of vessels or calls at the Port. This cost is expected to occur annually and was amortized over the life (20 years) of the project using a rate of return of 4% to estimate a net present value to compare with the capital costs. The shipside operating costs were considered to be the electric power cost accounting (i.e., subtracting) for the fuel savings. PG&E provided the electric power costs ($/kW-hr) per vessel and per 4-vessel cohort with and without interruptible service cost reduction. Because of fees and other base costs, the cost per kilowatt-hour for an individual vessel was estimated as significantly higher than for more vessels. Cost rates used in the cost effectiveness analysis were estimated as 0.141 $/kW-hr for the 4-vessel cohort and 0.220 $/kW-hr for individual vessel(s). The electric energy cost is the most significant cost of this project. The energy cost (the cost savings from reduced fuel use if using shoreside power) for electrical production using on-board engines ranges from about 0.05 $/kW-hr using heavy fuel (IFO380) to 0.10 $/kW-hr using a lighter lower sulfur fuel. Therefore, the overall energy cost estimate (accounting for shore power

September 2005 Final Report
H:\POSF\Report\Final_091205\Final\Sec 7.doc 7-2
cost and fuel cost reduction benefits) for the sum of the individual vessels is double the rate for the 4-vessel cohort. The energy cost would occur annually and was amortized over the life (20 years) of the project using a rate of return of 4% to estimate a net present value to compare with the capital costs. Table 7-1 presents a cost summary for the project for the four types of costs incurred: land, vessel, capital, and operating. The shipside operating cost for electrical energy is the most significant fraction of the overall project cost, especially when more than one vessel is considered for this project. The Port requested that 2 and 3 vessel cost effectiveness be analyzed. The same approach for costs was used for the 4-vessels together. The higher electric costs (0.220 $/kW-hr) were used for 2 and 3 vessels together as a conservative estimate, but the electricity costs would likely fall between the high and low costs cited in discussion here and in Section 5. Therefore, the 2 and 3 vessel costs presented here may be proportionally higher than actually would be experienced. This possibility warrants further study and input from the power suppliers. Table 7-1 presents this information. Table 7-1. Cost summary for individual vessels and vessel cohorts (2 vessels DAWN and REGAL PRINCESS; 3 vessels add MERCURY). DAWN
PRINCESS REGAL
PRINCESS
MERCURYCRYSTAL HARMONY
2-Vessels
3-Vessels
4-Vessels
Shipside capital cost (Low) $01 $500,000 $500,000 $500,000 $500,000 $1,000,000 $1,500,000
Shipside capital cost (High) $01 $700,000 $700,000 $700,000 $700,000 $1,400,000 $2,100,000
Landside capital cost (Low) $1,405,000 $1,405,000 $1,405,000 $1,405,000 $1,405,0002 $1,405,0002 $1,405,0002
Landside capital cost (High) $2,809,780 $2,809,780 $2,809,780 $2,809,780 $2,809,7802 $2,809,7802 $2,809,7802
Shipside purchased Electrical Energy Operating Cost (annual)
$151,096 $138,556 $284,240 $114,840 $289,652 $573,892 $441,415
Shipside Fuel Saving (annual) (-$37,506) (-$34,393) (-$70,555) (-$55,357) (-$71,899) (-$142,454) (-$197,810) Landside O&M (annual) $137,280 $137,280 $137,280 $137,280 $137,280 1 $137,280 1 $137,280 1 Shipside Net Present Value: Operating costs
$1,543,732 $1,415,612 $2,904,050 $808,391 $2,959,344 $5,863,394 $3,310,660
Landside Net Present Value: Operating costs
$1,865,680 $1,865,680 $1,865,680 $1,865,680 $1,865,680 $1,865,680 $1,865,680
Combined Project Value: Low ($)
$4,814,461 $5,186,341 $6,674,779 $4,579,120 $6,730,073 $10,134,123 $8,081,389
Combined Project Value: High ($)
$6,219,192 $6,791,072 $8,279,510 $6,183,851 $8,334,804 $11,938,854 $10,086,120
1. Note that landside capital and operating costs are the same, regardless of the number of vessels, and the energy cost is lower for only for the 4-vessel cohort based on PG&E estimates. 2. DAWN PRINCESS has already been retrofitted for shoreside power use where available.

September 2005 Final Report
H:\POSF\Report\Final_091205\Final\Sec 7.doc 7-3
7.2 Cost-Effectiveness Summary The cost effectiveness was determined for individual vessels and for 2-, 3- and 4-vessel cohorts using the projected costs and expected emission reductions over the 20 year life of the project. Once the annualized operating costs have been calculated to the net present value, the cost effectiveness was determined by a simple metric of dividing those costs by the project’s emissions benefits. Table 7-2 presents the emission reductions by pollutant types, as well as cost-effectiveness values with different scenarios. The emission reductions estimated and shown in Table 7-2 use only the estimated time under shoreside power, not the entire berthing period. Also, emissions that would be generated from powerplant providing the electrical power were subtracted from the reduced emissions. The cost effectiveness estimates in Table 7-2 account for the total project cost against only the NOx, only the PM, and a combined measure that gives greater weight to PM emission reductions. This benefit measure was proposed by ARB (2005) for the Carl Moyer program to better value particulate emission reductions in terms of public health benefits and for comparison with other PM emission reduction measures such as particulate traps for trucks and off-road equipment. Since emission reductions of other pollutants would have value for air quality, Table 7-2 also presents the cost-effectiveness values for emission reductions of all pollutants. Table 7-2. Emission reduction and cost-effectiveness summary (2 vessels DAWN and REGAL PRINCESS, 3 vessels add MERCURY). Estimate
DAWN PRINCESS
REGAL PRINCESS
MERCURY
CRYSTAL HARMONY
2-Vessels
3-Vessels
4-Vessels
Emission Benefit Summary HC (tons/year) 0.22 0.20 0.40 0.16 0.41 0.82 0.98 CO (tons/year) 1 0.29 0.27 0.55 0.22 0.56 1.10 1.32 NOx (tons/year) 10.53 9.66 19.81 7.55 20.19 40.01 47.55 PM (tons/year) 1 0.68 0.62 1.28 0.07 1.30 2.58 2.65 SOx (tons/year) 7.95 7.29 14.96 0.47 15.24 30.20 30.67 (NOx + 10*PM) 17.3 15.9 32.6 8.2 33.2 65.8 74.1
Cost Effectiveness ($/ton and $/adjusted ton) Low All Pollutants $12,239 $14,378 $9,020 $27,041 $8,925 $6,783 $4,858 High All Pollutants $15,810 $18,826 $11,188 $36,517 $11,053 $7,991 $6,063 Low NOx – only $22,854 $26,848 $16,843 $30,344 $16,665 $12,666 $8,497 High NOx – only $29,522 $35,155 $20,892 $40,978 $20,639 $14,921 $10,605 Low PM – only $354,133 $416,014 $260,990 $3,313,358 $258,235 $196,258 $152,425High PM – only $457,460 $544,734 $323,736 $4,474,509 $319,809 $231,209 $190,237 Low (NOx + 10*PM) $13,890 $16,317 $10,237 $27,798 $10,129 $7,698 $5,456 High (NOx + 10*PM) $17,943 $21,366 $12,698 $37,540 $12,544 $9,069 $6,809 1 Emission benefits subtract electrical generation powerplant emissions from powerplant. The upper threshold for cost effective programs in the proposed Carl Moyer criteria is $14,300 per combined ton of NOx and PM (although many are funded at much more cost effective levels). The combination of NOx and PM typically use a weighting factor that values PM emission reductions from between 10 and 30 times its numeric emission reduction. ENVIRON used the low end of that range to be conservative, but the higher end of the range dramatically reduces the cost per ton estimates provided in Table 7-2. Another significant factor in the cost effectiveness of this program is that if a ship is already using a low sulfur fuel, the particulate emission reduction benefits of shoreside power are

September 2005 Final Report
H:\POSF\Report\Final_091205\Final\Sec 7.doc 7-4
dramatically affected. The CRYSTAL HARMONY is purported to use a low (0.2%) sulfur fuel, significantly reducing particulate benefit from the use of shoreside power. The use of low sulfur fuel by itself may be a more cost effective program to reduce particulate emissions, but provides little NOx emission reduction benefit. Overall, under the current assumptions, incorporating two vessels (calling 24 times a year) would be cost effective by combining the NOx and PM benefits. The energy costs for one, two, or three vessels were taken at the high end of the costs that PG&E estimated for a single vessel calling 12 times a year, and energy costs range from 15% to 45% of the amortized cost of the project. So, with 2 or 3 vessels calling 24 or 41 times a year, one would expect some energy cost reduction making 2 or 3 vessel cohorts more cost effective than is shown in Table 7-2. Sources of Funding for the Project In order for the project to move forward, however, the funding for capital and other costs should be investigated more deeply. The basic funding opportunities can be categorized as State\Local, Federal, and emission credits. The Carl Moyer Program has been in place for some time and has been used for several marine applications to fund projects. The State of California allocates funding to be administered by local entities such as the Bay Area Air Quality Control Management District (BAAQMD) to fund projects that benefit local air quality. Special case State funding has been used for the benefit of air quality and could include line item funding or tax incentives. United States Environmental Protection Agency (EPA) (National Clean Diesel Campaign/Voluntary Diesel Retrofit Program) line item funding has been available to reduce emissions from diesel engines. The EPA has sponsored several initiatives with elements that could apply to a shoreside powering initiative. The West Coast Diesel Reduction Collaborative (http://www.westcoastcollaborative.org/projects.htm#marine) and the West Oakland Collaborative are two examples. The EPA contributed some funding for the Seattle shore-powering project. The EPA administers several other grant programs aimed at diesel emission reductions, including:
• Diesel Retrofit Grants, which have been used to help local agencies implement diesel emission reduction projects;
• Regional grant programs, such as Region 10 Regional Geographic Initiative grants; and • Grants provided by the SmartWay program to reduce truck idling.
Emission Credit Trading is emerging as an option in California. Entities like the POSF would generate credits by developing projects that reduce emissions. Some or all of these emission reductions could be purchased by other developers for mitigating their own emissions. Although there is no formal process in place as yet, there is much interest in developing the concept. The serving electrical utility may be interested in providing funding, either through direct grants, or as a method of generating emission credits. For instance, PG&E has an Electric Rate Tariff that provides funding for the conversion of diesel powered agricultural pumps to electricity and emission credits generate are retained by PG&E. A similar program could be feasible for Cold Ironing at the Port.

September 2005 Final Report
H:\POSF\Report\Final_091205\Final\Sec 7.doc 7-5
The Supplemental Environmental Program (SEP) is another source of funding for emission control projects. Violators of the Clean Air Act, as part of an agreement, fund mitigation programs as a portion of their violation penalties. The funding can be derived from State or Federal enforcement actions but is always special case funding and depends on availability. The Congestion Mitigation and Air Quality (CMAQ) program has historically been exclusively restricted for use on highway projects (including car ferries as a special case). However, recent Congressional actions may allow some of this money to be used for nonroad (offroad) projects. The CMAQ program is funded from the Federal highway motor fuel tax, but is administered by the individual state departments of transportation with the oversight of the Federal Highway Administration.

September 2005 Final Report
H:\POSF\Report\Final_091205\Final\Sec 8r.doc 8-1
8. CONCLUSIONS AND RECOMMENDATIONS The Port of San Francisco has entered into a development and lease agreement with a developer to build a mixed use/cruise terminal facility at Piers 30-32. The cruise terminal will be named the James R. Herman International Cruise Terminal and will become the primary cruise terminal for San Francisco. One of the potential mitigation measures for reducing air pollution impacts is the use of technologies such as shoreside electrical power to reduce hotelling emissions from cruise ships while at berth, by way of allowing the ships to turn off their self-generating electrical units. Alternatives to shoreside power for air emission reduction could include the use of low sulfur fuels and new engine technologies that would reduce emissions not only at berth but also throughout a cruise ship voyage. This document reports the findings of a study carried out by ENVIRON International Corporation and its subcontractors to examine the technical and cost feasibility of the shoreside power mitigation option, and it discusses other possible air pollutant emissions reduction measures. This section of the report provides the overall conclusions and recommendations of this study. 8.1 Assumptions In Section 1 of this report we identified several caveats related to this report. Before summarizing our conclusions and recommendations, we summarize those assumptions here.
• Aesthetics - The aesthetics of the waterfront in San Francisco are critically important. Because the port is not a typical industrial port, such as the Port of Oakland or the Port of Los Angeles, additional considerations will have to be made regarding the aesthetics of the shoreside power design. The material provided here gives the reader a general understanding of the visual impacts of the shoreside power equipment. Artists’ renderings and such will further facilitate assuring that the equipment for shoreside power is aesthetically acceptable.
• Candidate ships - Four candidate ships were selected for this study, representing the likely mix of visiting ships in future years. Actual ships and frequency of visits will be different. Nevertheless, this selection of ships is likely a reasonable approximation of the minimum port use patterns, and thus the most conservative assumption for cost-effectiveness evaluations.
• Cost of ship modification - A related assumption is that the cost of the ship modifications needed for shoreside power are assigned as if the Port of San Francisco were the only port at which the ships used shoreside power. Costs are NOT amortized over several ports. For this study, we assumed that the ships needing such conversion were doing so only because of the San Francisco program. However, if, for example, a single ship uses shoreside power at a port other than the Port of San Francisco, shipside modification costs should be halved for the purpose of this study. Thus, the results presented here are a “worst case” or conservative estimate of the cost effectiveness.
• Electrical Energy Provider – In assessing the overall cost effectiveness of shoreside electrification, the provider of the energy, the cost rate of that energy, and the allocation of the construction and operating costs for the shoreside portion of the project design

September 2005 Final Report
H:\POSF\Report\Final_091205\Final\Sec 8r.doc 8-2
needs to be eventually determined. In carrying out this work, we could not, and did not establish firm electrical rates, nor did we determine who would likely bear the costs of various shoreside infrastructures. A range of rate structures estimated by PG&E for one vessel, and four-vessel cohort scenarios utilizing shoreside power were used in this study.
• Feasibility, not design and implementation – As noted previously, this is a feasibility study. If, upon the basis of this report and other information, it is decided to proceed with shoreside power provisions, full engineering design and cost analyses are yet to be carried out. Some of that would be done by the electricity provider, some by the transmission provider, some by the developer, and some by the ship owners.
• Safety – Installations elsewhere, in both cruise and industrial port areas have shown that safe movement of goods and people are not negatively affected by the shoreside power equipment.
• Service level – A characteristic of the Port of San Francisco is that many ships (and cruise lines) visit, but only a few visit often. The shoreside projects in Juneau, Alaska and Seattle, Washington, involve mainly one cruise line and a high number of ship calls.
• Shoreside infrastructure costing – Because this is a “conceptual” or “feasibility study”, it was beyond the scope of this project to do detailed engineering design. Nevertheless, we did carry out general engineering design, based on similar installations elsewhere, to arrive at costs and general descriptions of the proposed facility. A significant uncertainty in this study relates to how the shoreside infrastructure cost in bringing electricity to the pier(s) should be allocated between the pier (concession operations, etc.) and the ship electricity demands through shoreside power. A careful examination of this requires a full scale power provider study to reconcile.
8.2 Conclusions Shoreside auxiliary electrical power demand is estimated to be less than 12.5 MW for a single shoreside connection. This is consistent with demands in other ports with similar applications. Hotelling with shoreside power with two ships simultaneously is technically possible and has also been examined in this study. Thus, certain provisions may be incorporated into the facility design, principally the under-pier electrical conduit and provision of adequate space for future step-down transformer expansion and electrical reel placement to accommodate a two-berth shoreside power system. However, the major effects of a two-berth shoreside power system may be an increase in the shoreside power infrastructure cost carried by the providing utility (increased feeder line capacity, additional or bigger transformer, additional reel assembly, etc.), as well as the need for additional space to accommodate the additional/larger transformer and electrical reel assembly. This possible increase in capacity should be examined further to determine if provisions should be made for this contingency. The technical aspects of shoreside power have been examined and found to not present any unique issues to San Francisco that have not been addressed in actual installations in Seattle and Alaska. However, aesthetics and space management will have to be especially addressed at the Port of San Francisco. Only one cruise line currently frequenting the Port of San Francisco has existing shoreside power experience and on-board equipment – Princess. It is estimated that other ships can be retrofitted at a cost of $500,000-700,000 per ship. However, if a single ship uses shoreside power at other
September 2005 Final Report
H:\POSF\Report\Final_091205\Final\Sec 8r.doc 8-3
ports as well, the shipside modification costs would be reduced proportionally according to the number of ports where it uses shoreside power. There are no known safety or passenger or cruise ship supply issues that cannot be addressed adequately based on installations elsewhere. This study estimated that the shoreside capital cost for electricity supply to be in the range of $1.5 million to $3.0 million, with an approximate range of $600,000 to $1.5 million for on-pier electrical supply fixed costs, depending on the scenario considered. Within the cost estimates for the on-pier electric supply, the capital cost for a substation with a 12.5 MW transformer, and a double cable reel tower assembly was estimated to be about $300,000. However, this cost would be increased accordingly if more than 2 cables and/or larger transformer are used. The shoreside annual operation and maintenance cost, which would be mainly labor cost, was estimated to be approximately $140,000. The main cost to cruise ship operators is the increased cost of the electrical power provided by the local utility as opposed to providing their own auxiliary power by way of at dock hotelling with their own engine/generator system. This study showed that this cost ranged up to 2 to 3 times self-generated electrical costs. In short, it costs the cruise industry more to use shoreside power while at port than shipboard generated electrical power. The study found that the “break-even” point for this portion of the cost was in the range of $0.05-0.10/kW-hr of provided electrical load. Depending on ship size and frequency of visits, this study estimated that an annual cost of approximately $150,000 to $300,000 per ship for purchase of utility provided electricity. The potential annual fuel savings from using shoreside power for the example ships ranged from $35,000 to $70,000. Thus, the net annual increase in shipside operating costs ranged from $115,000 to $230,000 for the candidate ships studied. Therefore, a key aspect of any future system must be a thorough examination of electrical rate structures available to the Port and ships. For this study, nominal rate structures of 0.141 $/kW-hr and 0.220 $/kW-hr provided by PG&E were used for the four ship cohort scenario and for one ship scenario, respectively. For comparison, other ports that have implemented or are implementing shoreside power report or anticipate energy rates in the range of 0.03 to 0.085 $/kW-hr. made possible via subsidizing by ports and/or city owned utilities. Current methods of evaluating the “cost effectiveness” of various air pollutant emissions reductions control options in California often rely upon the so-called “Carl Moyer” program guidance. Cost effectiveness is usually expressed in terms of tons of air pollutant emissions reduced divided by the cost of the measure to accomplish that reduction. The upper end of the “acceptable” ratio for this metric under the Moyer program is approximately $14,000/ton of combined oxides of nitrogen and particulate matter.
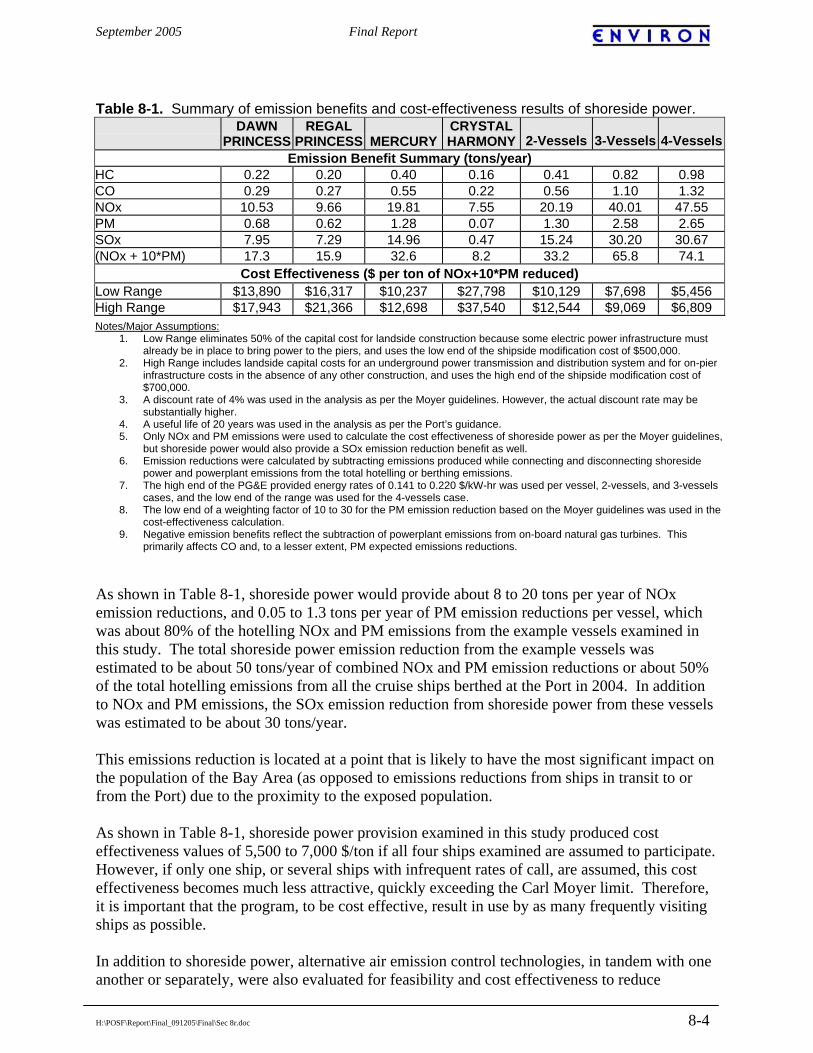
September 2005 Final Report
H:\POSF\Report\Final_091205\Final\Sec 8r.doc 8-4
Table 8-1. Summary of emission benefits and cost-effectiveness results of shoreside power.
DAWN PRINCESS
REGAL PRINCESS
MERCURY
CRYSTAL HARMONY
2-Vessels
3-Vessels
4-Vessels
Emission Benefit Summary (tons/year) HC 0.22 0.20 0.40 0.16 0.41 0.82 0.98 CO 0.29 0.27 0.55 0.22 0.56 1.10 1.32 NOx 10.53 9.66 19.81 7.55 20.19 40.01 47.55 PM 0.68 0.62 1.28 0.07 1.30 2.58 2.65 SOx 7.95 7.29 14.96 0.47 15.24 30.20 30.67 (NOx + 10*PM) 17.3 15.9 32.6 8.2 33.2 65.8 74.1
Cost Effectiveness ($ per ton of NOx+10*PM reduced) Low Range $13,890 $16,317 $10,237 $27,798 $10,129 $7,698 $5,456 High Range $17,943 $21,366 $12,698 $37,540 $12,544 $9,069 $6,809 Notes/Major Assumptions:
1. Low Range eliminates 50% of the capital cost for landside construction because some electric power infrastructure must already be in place to bring power to the piers, and uses the low end of the shipside modification cost of $500,000.
2. High Range includes landside capital costs for an underground power transmission and distribution system and for on-pier infrastructure costs in the absence of any other construction, and uses the high end of the shipside modification cost of $700,000.
3. A discount rate of 4% was used in the analysis as per the Moyer guidelines. However, the actual discount rate may be substantially higher.
4. A useful life of 20 years was used in the analysis as per the Port’s guidance. 5. Only NOx and PM emissions were used to calculate the cost effectiveness of shoreside power as per the Moyer guidelines,
but shoreside power would also provide a SOx emission reduction benefit as well. 6. Emission reductions were calculated by subtracting emissions produced while connecting and disconnecting shoreside
power and powerplant emissions from the total hotelling or berthing emissions. 7. The high end of the PG&E provided energy rates of 0.141 to 0.220 $/kW-hr was used per vessel, 2-vessels, and 3-vessels
cases, and the low end of the range was used for the 4-vessels case. 8. The low end of a weighting factor of 10 to 30 for the PM emission reduction based on the Moyer guidelines was used in the
cost-effectiveness calculation. 9. Negative emission benefits reflect the subtraction of powerplant emissions from on-board natural gas turbines. This
primarily affects CO and, to a lesser extent, PM expected emissions reductions.
As shown in Table 8-1, shoreside power would provide about 8 to 20 tons per year of NOx emission reductions, and 0.05 to 1.3 tons per year of PM emission reductions per vessel, which was about 80% of the hotelling NOx and PM emissions from the example vessels examined in this study. The total shoreside power emission reduction from the example vessels was estimated to be about 50 tons/year of combined NOx and PM emission reductions or about 50% of the total hotelling emissions from all the cruise ships berthed at the Port in 2004. In addition to NOx and PM emissions, the SOx emission reduction from shoreside power from these vessels was estimated to be about 30 tons/year. This emissions reduction is located at a point that is likely to have the most significant impact on the population of the Bay Area (as opposed to emissions reductions from ships in transit to or from the Port) due to the proximity to the exposed population. As shown in Table 8-1, shoreside power provision examined in this study produced cost effectiveness values of 5,500 to 7,000 $/ton if all four ships examined are assumed to participate. However, if only one ship, or several ships with infrequent rates of call, are assumed, this cost effectiveness becomes much less attractive, quickly exceeding the Carl Moyer limit. Therefore, it is important that the program, to be cost effective, result in use by as many frequently visiting ships as possible. In addition to shoreside power, alternative air emission control technologies, in tandem with one another or separately, were also evaluated for feasibility and cost effectiveness to reduce
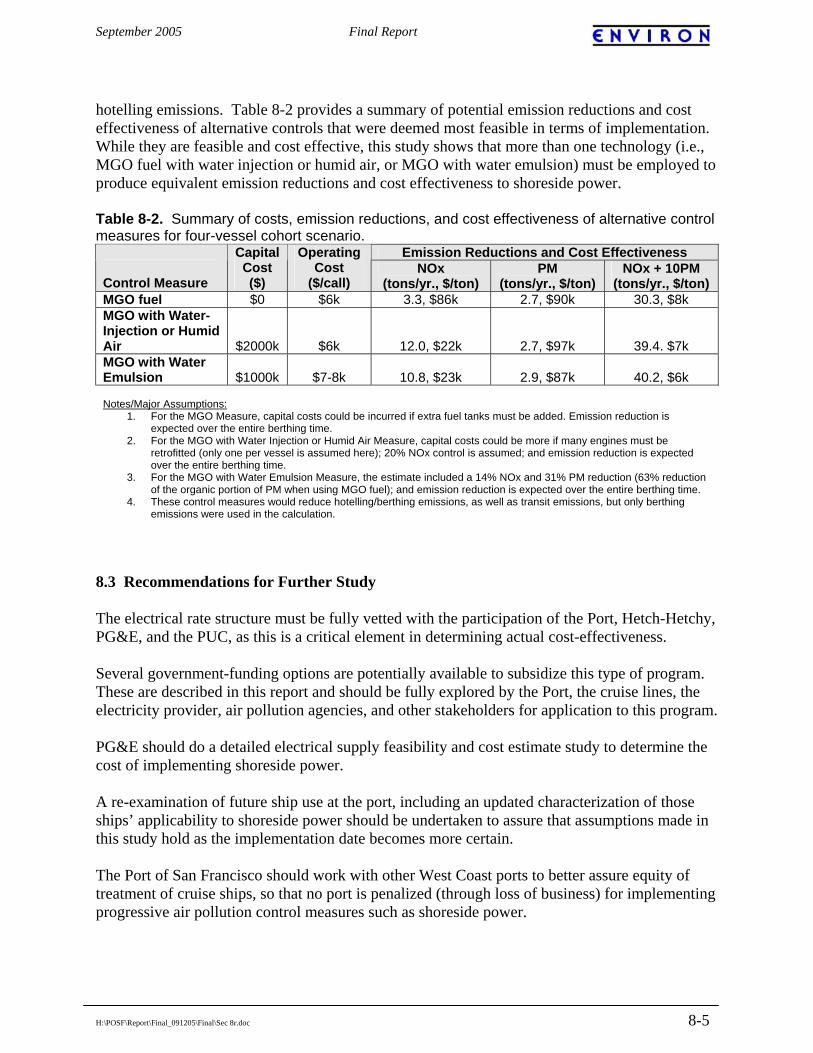
September 2005 Final Report
H:\POSF\Report\Final_091205\Final\Sec 8r.doc 8-5
hotelling emissions. Table 8-2 provides a summary of potential emission reductions and cost effectiveness of alternative controls that were deemed most feasible in terms of implementation. While they are feasible and cost effective, this study shows that more than one technology (i.e., MGO fuel with water injection or humid air, or MGO with water emulsion) must be employed to produce equivalent emission reductions and cost effectiveness to shoreside power. Table 8-2. Summary of costs, emission reductions, and cost effectiveness of alternative control measures for four-vessel cohort scenario.
Emission Reductions and Cost Effectiveness Control Measure
Capital Cost ($)
Operating Cost
($/call) NOx
(tons/yr., $/ton) PM
(tons/yr., $/ton) NOx + 10PM
(tons/yr., $/ton) MGO fuel $0 $6k 3.3, $86k 2.7, $90k 30.3, $8k MGO with Water-Injection or Humid Air $2000k $6k 12.0, $22k 2.7, $97k 39.4. $7k MGO with Water Emulsion $1000k $7-8k 10.8, $23k 2.9, $87k 40.2, $6k Notes/Major Assumptions:
1. For the MGO Measure, capital costs could be incurred if extra fuel tanks must be added. Emission reduction is expected over the entire berthing time.
2. For the MGO with Water Injection or Humid Air Measure, capital costs could be more if many engines must be retrofitted (only one per vessel is assumed here); 20% NOx control is assumed; and emission reduction is expected over the entire berthing time.
3. For the MGO with Water Emulsion Measure, the estimate included a 14% NOx and 31% PM reduction (63% reduction of the organic portion of PM when using MGO fuel); and emission reduction is expected over the entire berthing time.
4. These control measures would reduce hotelling/berthing emissions, as well as transit emissions, but only berthing emissions were used in the calculation.
8.3 Recommendations for Further Study The electrical rate structure must be fully vetted with the participation of the Port, Hetch-Hetchy, PG&E, and the PUC, as this is a critical element in determining actual cost-effectiveness. Several government-funding options are potentially available to subsidize this type of program. These are described in this report and should be fully explored by the Port, the cruise lines, the electricity provider, air pollution agencies, and other stakeholders for application to this program. PG&E should do a detailed electrical supply feasibility and cost estimate study to determine the cost of implementing shoreside power. A re-examination of future ship use at the port, including an updated characterization of those ships’ applicability to shoreside power should be undertaken to assure that assumptions made in this study hold as the implementation date becomes more certain. The Port of San Francisco should work with other West Coast ports to better assure equity of treatment of cruise ships, so that no port is penalized (through loss of business) for implementing progressive air pollution control measures such as shoreside power.
September 2005 Final Report
H:\POSF\Report\Final_091205\Final\Sec 9 Refs.doc 9-1
9. REFERENCES ACTI. 2005. Personal communication with Sal Caro and Matt Stewart of Advanced Control
Technology Incorporated (ACTI), March, 2005. ARB. 2005. “PM Emissions and Fuel Sulfur Content,” public presentation by Paul Milkey,
May 18, 2005. ARB. 2005. “Proposed Project Criteria,” Carl Moyer Program Agricultural Assistance Program
August 2005. Arcadis. 1999. “Marine Vessels Emissions Inventory,” Prepared for the South Coast Air
Quality Management District, ARCADIS Geraghty & Miller, September 23, 1999. BAH. 1991. ‘Commercial Marine Vessel Contributions to Emission Inventories,’ Final Report
prepared for EPA, Booz-Allen & Hamilton, October 7, 1991. Cooper, D.A. 2001. “Exhaust emissions from high speed passenger ferries,” Atmos. Env., v35,
pp 4189-4200. Cooper D.A. 2003. “Exhaust emissions from ships at berth,” Atmos. Env., v 37, pp 3817-3830. ENTEC. 2002. ‘Quantification of Emissions from Ships Associated with Ship Movements
Between Ports in the European Community,’ Prepare for the European Commission by ENTEC UK Limited, July 2002.
ENVIRON. 2002. “Commercial Marine Emission Inventory Development,” E.H. Pechan and
Associates, Inc. and ENVIRON International Corporation, April, 2002. Air Docket A-2001-11, item II-A-67.
ENVIRON. 2004. "Cold Ironing Cost Effectiveness," Prepared for the Port of Long Beach,
March 30, 2004 Environment Canada. 1997. ‘Port of Vancouver Marine Vessel Emissions Test Report, Final
Report,” ERMD Report #97-04, presumably 1997. Environment Canada. 1999. Ferry Engine Emissions, personal communication with Greg
Rideout. EPA. 2003. “Final Regulatory Support Document: Control of Emissions from New Marine
Compression-Ignition Engines at or Above 30 Liters per Cylinder,” Environmental Protection Agency US EPA420-R-03-004, January 2003.
EPA. 2002. ‘Exhaust Emission Factors for Nonroad Engine Modeling--Compression-Ignition,’
NONROAD Model Report No. NR-009b, EPA420-P-02-016, November 2002.
September 2005 Final Report
H:\POSF\Report\Final_091205\Final\Sec 9 Refs.doc 9-2
EPA. 2000. “Analysis of Commercial Marine Vessels Emissions and Fuel Consumption Data,” Prepared for EPA under contract to Sierra Research by Energy and Environmental Analysis, Inc., EPA420-R-00-002, February 2000.
EPA. 1999a. ‘Control Of Air Pollution From Marine Compression-Ignition Engines’ Part 94,
Code of Federal Regulations, December, 1999. Published in the Federal Register December 29, 1999.
EPA. 1999b. ‘Final Regulatory Impact Analysis: Control of Emissions from Compression-
Ignition Marine Engines,’ US EPA420-R-99-026, November, 1999. ETC. 1997. ‘Shipboard Marine Engines Emission Testing for the United States Coast Guard,’
Prepared for the Volpe National Transportation Systems Center and the United States Coast Guard by Environmental Transportation Consultants under Delivery Order No. 31, presumably 1997.
Fleischer, F., E.J. Ulrich, R. Krapp, and W. Grundmann. 1998. “Comments on particulate
emissions from diesel engines when burning heavy Fuels,” Conference paper: CIMAC, Proc. of the 22nd CIMAC Internat. Congress on Combustion Engines, Volume 6, Copenhagen, DK, May 18-21, 1998.
IVL. 2004. “Methodology for Calculating Emissions from Ships: 1 Update on Emission
Factors,” Prepared for the Swedish Environmental Protection Agency by IVL Swedish Environmental Research Institute, February 2004.
Lloyds. 1995. ‘Marine Exhaust Emissions Research Programme,’; ‘Steady-state Operation,’
1990; ‘Slow Speed Addendum,’ 1991; ‘Marine Exhaust Emissions Research Programme,’ 1995; Lloyds Register Engineering Services, Croyden, Lloyds Register of Shipping, London.
Lloyds. 2004. ‘Lloyds' Register of Ships Version 2.17. October 2004, Lloyds Register of
Shipping, London. PoSF. 2004. 2004 and 2005 Cruise Ship Port Call Data (2004 San Francisco Schedule 9-7-
04.xls and 2005 San Francisco Schedule 9-1-04.XLS) provided by John Doll of the Port of San Francisco to David Souten of ENVIRON, September 2004.
POSF. 2001. “San Francisco Cruise Terminal Mixed-Use Project & Brannan Street Wharf
Project Draft SEIR,” Port of San Francisco Case No. 2000.1229E, June 2001. Samulski. 2000. US EPA Staff, personal communication, April 5, 1999. Seaworthy Systems, Inc. 2001-updated. ‘Fuel Cost Estimates,’ developed for the California Air
Resources Board, United States Maritime Administration, and the following merchant marine companies: Matson Navigation Company, Chevron Texaco Shipping Company, American President Lines, and Sea River Shipping Inc., 2001 to present.
SFBP. 2005. Personal communication with Ken Levin, June 10, 2005. San Francisco Bar
Pilots.

September 2005 Final Report
H:\POSF\Report\Final_091205\Final\Sec 9 Refs.doc 9-3
Starcrest. 2004. “Port-Wide Baseline Air Emission Inventory,” Prepared for the Port of Los
Angeles by Starcrest Consulting, June 2004. TRC. 1989. ‘Ship Emissions Control Study for the Ports of Long Beach and Los Angeles,
Volume I Marine Vessel Emissions While Hotelling in Port,’ Prepared for the Ports of Long Beach and Los Angeles, South Coast Air Quality Management District, and Western States Petroleum Association, December, 1989.
Zeller, W. 2005-1. Email from Mike Waugh of ARB to William Zeller of PG&E, August 25,
2005. Zeller, W. 2005-2. Personal communication, July 20, 2005.