International Consumer Complaints - Federal Trade … · Against Companies Located in Canada ......
46
Federal Trade Commission June 2015 Source: Data from Consumer Sentinel Network International Consumer Complaints January – December 2014
-
Upload
nguyenhuong -
Category
Documents
-
view
219 -
download
2
Transcript of International Consumer Complaints - Federal Trade … · Against Companies Located in Canada ......

Federal Trade CommissionJune 2015
Source: Data from Consumer Sentinel Network
International Consumer ComplaintsJanuary – December 2014

Report Subject Page No. Introduction . . . . . . . . . . . . . . . . . . . . . . . . . . . . . . . . . . . . . . . . . . . . . . . . . . . . . . . . . . . . . . . . . . . . 2 Executive Summary . . . . . . . . . . . . . . . . . . . . . . . . . . . . . . . . . . . . . . . . . . . . . . . . . . . . . . . . . . . . . . 3
Cross-Border Fraud ComplaintsCross-Border Fraud Complaint Count by Calendar Year . . . . . . . . . . . . . . . . . . . . . . . . . . . . . . . . . . 4 Cross-Border Fraud and Non-Cross-Border Fraud Complaints . . . . . . . . . . . . . . . . . . . . . . . . . . . . . 5Cross-Border Fraud Complaints by Consumer and Company Location . . . . . . . . . . . . . . . . . . . . . . . 6
U.S. Consumers in Cross-Border ComplaintsNumber of U.S. Consumers in Cross-Border Fraud Complaints . . . . . . . . . . . . . . . . . . . . . . . . . . . . 7Top Products or Services for Cross-Border Fraud Complaints from U.S. Consumers .. . . . . . . . . . . . 8Amount Paid Information in Cross-Border Fraud Complaints from U.S. Consumers . . . . . . . . . . . . 9Method of Payment for Cross-Border Fraud Complaints from U.S. Consumers . . . . . . . . . . . . . . . . 10Method of Initial Contact for Cross-Border Fraud Complaints from U.S. Consumers . . . . . . . . . . . 11 Cross-Border Fraud Complaints from U.S. Consumers – Canadian Provincial Details
Against Companies Located in Canada . . . . . . . . . . . . . . . . . . . . . . . . . . . . . . . . . . . . . . . . . . 12Against Companies Located in Ontario . . . . . . . . . . . . . . . . . . . . . . . . . . . . . . . . . . . . . . . . . . . 13Against Companies Located in Quebec . . . . . . . . . . . . . . . . . . . . . . . . . . . . . . . . . . . . . . . . . . . 14Against Companies Located in British Columbia . . . . . . . . . . . . . . . . . . . . . . . . . . . . . . . . . . . . 15Against Companies Located in Alberta . . . . . . . . . . . . . . . . . . . . . . . . . . . . . . . . . . . . . . . . . . . .16
International ComplaintsTop 100 Non-U.S. Company Locations Reported in Fraud Complaints. . . . . . . . . . . . . . . . . . . . . . . 17
Top Fraud Complaints in the Top 15 Non-U.S. Company Locations . . . . . . . . . . . . . . . . . . . . 18Top 100 Non-U.S. Consumer Locations Reported in Fraud Complaints. . . . . . . . . . . . . . . . . . . . . . 22
Top Fraud Complaints in the Top 5 Non-U.S. Consumer Locations . . . . . . . . . . . . . . . . . . . . 23
Canadian Consumer Fraud Complaints Canadian Consumer Fraud Complaints . . . . . . . . . . . . . . . . . . . . . . . . . . . . . . . . . . . . . . . . . . . 25Located in Ontario . . . . . . . . . . . . . . . . . . . . . . . . . . . . . . . . . . . . . . . . . . . . . . . . . . . . . . . . . . 26Located in Quebec . . . . . . . . . . . . . . . . . . . . . . . . . . . . . . . . . . . . . . . . . . . . . . . . . . . . . . . . . . . 27Located in Alberta. . . . . . . . . . . . . . . . . . . . . . . . . . . . . . . . . . . . . . . . . . . . . . . . . . . . . . . . . . . . 28Located in British Columbia . . . . . . . . . . . . . . . . . . . . . . . . . . . . . . . . . . . . . . . . . . . . . . . . . . . 29
Top Complaints by Select Company Countries and Regions . . . . . . . . . . . . . . . . . . . . . . . . . . . . . . . 30
Econsumer.govTop Consumer and Company Locations for Econsumer Complaints . . . . . . . . . . . . . . . . . . . . . . . . . 39Top Products or Services for Econsumer Complaints. . . . . . . . . . . . . . . . . . . . . . . . . . . . . . . . . . . . . . 40Top Alleged Law Violations for Econsumer Complaints. . . . . . . . . . . . . . . . . . . . . . . . . . . . . . . . . . . 41
AppendicesAppendix A1: Description of the Consumer Sentinel Network . . . . . . . . . . . . . . . . . . . . . . . . . . . . . 42Appendix A2: Major Data Contributors . . . . . . . . . . . . . . . . . . . . . . . . . . . . . . . . . . . . . . . . . . . . . . . 43Appendix A3: Data Contributor Details . . . . . . . . . . . . . . . . . . . . . . . . . . . . . . . . . . . . . . . . . . . . . . . 44Appendix A4: Better Business Bureau Data Contributors . . . . . . . . . . . . . . . . . . . . . . . . . . . . . . . . . . 45
TABLE OF CONTENTS
Federal Trade Commission Page 1 of 45 Released June 2015

The Consumer Sentinel Network (CSN) is a secure online database of millions ofconsumer complaints available only to law enforcement. In addition to storing complaintsreceived by the FTC, the CSN includes complaints filed with state law enforcementorganizations such as the Hawaii Office of Consumer Protection, the Montana, NorthCarolina, and Oregon Departments of Justice, the South Carolina Department of ConsumerAffairs, the Tennessee Division of Consumer Affairs, and the Offices of the AttorneysGeneral for Alaska, California, Colorado, Idaho, Indiana, Iowa, Louisiana, Maine,Massachusetts, Michigan, Mississippi, Nevada, Ohio, and Washington. Federal agencies,including the Consumer Financial Protection Bureau and the FBI’s Internet CrimeComplaint Center, contribute data. In 2014, the U.S. Departments of Defense, Education,and Veterans Affairs began contributing educational institution and student lendingcomplaints from military members and their dependents. The Commission also receivescomplaints from the Canadian Anti-Fraud Centre. Non-governmental organizations alsoprovide complaint data to the FTC. The Council of Better Business Bureaus, consisting ofall North American BBBs, is a major contributor of complaint data. Other organizationsinclude the following: Green Dot, the Lawyers’ Committee for Civil Rights Under Law,MoneyGram International, the National Fraud Information Center, PrivacyStar andWestern Union.
Law enforcement partners - whether they are down the street, across the nation, or aroundthe world - can use information in the database to enhance and coordinate investigations.
Begun in 1997 to collect fraud and identity theft complaints, the CSN now has more than10 million complaints, including those about credit reports, debt collection and mortgageassistance scams, among other subjects. The CSN has a five-year data retention policy;complaints older than five years are purged biannually. The following are a series ofstatistical reports from the CSN database presenting information about cross-border fraudand international complaints. For the purposes of this report, a fraud complaint is cross-border if the reported consumer and company country locations are different. We are alsopresenting select “international” reports on complaints where either the reported consumeror company country is outside the U.S. These reports provide further information aboutcomplaints from consumers reporting from abroad and about foreign companies.
Company location is based on addresses reported by the complaining consumers and, thus,likely understates the number of cross-border and international complaints. In someinstances, the company address provided by the consumer actually may be a mail drop inthe consumer’s country rather than the physical location of the company in a foreigncountry, and in other cases, the consumer does not know whether the location is in the U.S.or abroad.
Some organizations transfer their complaints to the CSN after the end of the calendar year,and new data providers, added to the system each year, are contributing complaints fromprior years. As a result, the total number of complaints for 2014 will increase during thenext few months, and totals from previous years may differ from prior CSN annual reports.
The 2014 International Consumer Complaints Report is based on unverified complaintsreported by consumers. The data is not based on a consumer survey.
For more information about the Consumer Sentinel Network, visitwww.FTC.gov/sentinel. Law enforcement personnel may join CSN atRegister.ConsumerSentinel.gov.
INTRODUCTION
Internet Crime Complaint CenterBetter Business Bureaus
Leading International Data Contributors
www.econsumer.gov www.FTC.gov/sentinel
For a detailed description of the CSN and a complete list of our data contributors, see Appendices A1 through A4.
www.FTC.gov/idtheft
Canadian Anti-Fraud Centre
Publishers Clearing House
PrivacyStar
Canada Competition Bureau
Western UnionMoneyGram
National Consumers League
Federal Trade Commission Page 2 of 45 Released June 2015
North Carolina Department of Justice

Executive Summary International Consumer Complaints
January 1 – December 31, 2014
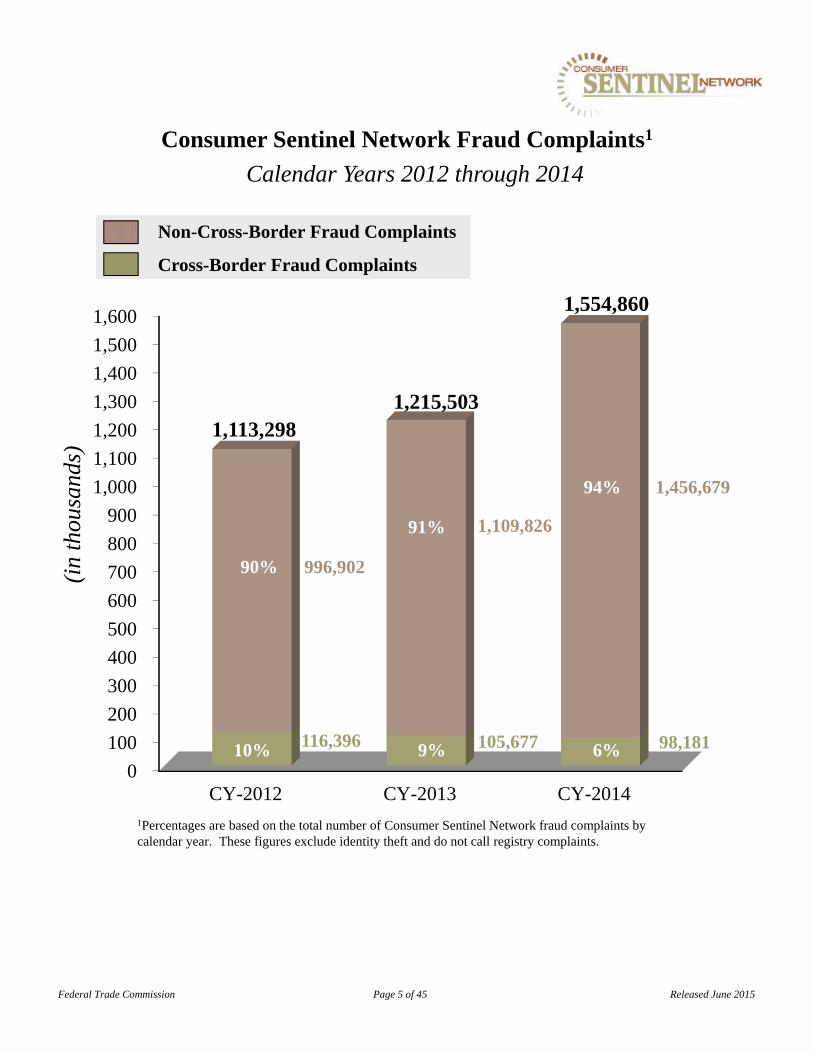
• The Commission received over 98,000 cross-border fraud complaints during calendar year 2014. Cross-border fraud complaints comprised 6% of all fraud complaints received during calendar year 2014, 9% during CY-2013 and 10% in CY-2012.
• Impostor: Family\Friend was the leading type of complaint in U.S. consumers’ cross-border complaints (10%), followed by Shop-at-Home\Catalog Sales (8%), Prizes\Sweepstakes\Gifts (7%), Foreign Money Offers (6%) and Telemarketing Practices (5%).
• Of all cross-border fraud complaints (98,181) in calendar year 2014, 5% (4,811) were from U.S. consumers complaining about Canadian companies and 49% (48,427) were from U.S. consumers complaining about other foreign companies. Telemarketing practices was the top reported type of complaint from U.S. consumers against Canadian companies.
• U.S. consumers reported fraud losses of over $9 million against companies located in Canada, and losses of over $171 million against companies located in other foreign countries in calendar year 2014.
• Wire transfer was the highest reported payment method used in cross-border fraud complaints in calendar year 2014; 55% of the complaints from U.S. consumers who paid companies located in Canada reported wire transfer as the payment method, and 78% of the complaints from U.S. consumers who paid other foreign companies reported that payment method. Sixty-six percent of cross-border fraud complaints from U.S. consumers reported payment method information. However, these figures may be skewed by the significant number of complaints from data contributors MoneyGram International and Western Union Money Transfer.
• Mail continued to be the most frequently reported method used by companies located in Canada to initially contact U.S. consumers in CY-2014, while e-mail continued to be the most frequently reported method used by companies located in other foreign countries to initially contact U.S. consumers.
• There were over 1.5 million fraud complaints (1,554,860) reported in the Consumer Sentinel Network (CSN) for calendar year 2014. For countries outside of the U.S., Canada was the number one reported company location for calendar year 2014, with 16,546 fraud complaints, followed by Nigeria (9,858), the United Kingdom (7,371); China (6,487); and Jamaica (6,159). The complete ranking of the top 100 reported company locations appears on page 17 of this report, followed by the top complaint products or services for each of the top 15 reported company locations.
• Of all fraud complaints in CSN for calendar year 2014 (1,554,860), Canada was the number one reported consumer location outside the U.S., with 26,921 complaints, followed by the United Kingdom (5,074); Australia (3,216); India (2,197); and France (1,668). The complete ranking of the top 100 reported consumer locations appears on page 22 of this report, followed by the top complaint products or services for each of the top five reported consumer locations.
• A summary of complaints received against companies located in select regions appears in this report starting on page 30. The regions cover Africa; Australia and New Zealand; the Caribbean; China, Japan, and the Republic of Korea; the European Union; Latin America; the Middle East; South Asia; and Southeast Asia.
ECONSUMER.GOV – Collecting and sharing cross-border e-commerce complaints (for details see Appendix A1).
• Econsumer received over 63,000 complaints between CY-2012 and CY-2014; 22,569 complaints in CY-2012, 23,436 in CY-2013, and 17,793 complaints in CY-2014.
• Shop-at-Home\Catalog Sales was the most commonly reported product or service in Econsumer complaints during calendar year 2014, comprising 18% of Econsumer complaints during that time period, while Computers: Equipment\Software was the second most commonly reported product or service, comprising 8% of Econsumer complaints. “Merchandise or Service Never Received” accounts for 18% of the alleged Econsumer law violations in CY-2014.
Federal Trade Commission Page 3 of 45 Released June 2015

Cross-Border Fraud Complaint Count1
No.
of C
ompl
aint
s
Calendar Years 2010 through 2014
Federal Trade Commission Page 4 of 45 Released June 2015
1For the purposes of this report, a fraud complaint is “cross-border” if the reported consumer and company country locations are different. These figures exclude identity theft and do not call registry complaints.
109,457
139,266
116,396
105,677
98,181
75,000
100,000
125,000
150,000
0
100
200
300
400
500
600
700
800
900
1,000
1,100
1,200
1,300
1,400
1,500
1,600
CY-2012 CY-2013 CY-2014
Consumer Sentinel Network Fraud Complaints1
116,396
Cross-Border Fraud Complaints
Non-Cross-Border Fraud Complaints
1,113,2981,215,503
10% 9% 6%
90%
91%
94%
1,554,860
1Percentages are based on the total number of Consumer Sentinel Network fraud complaints by calendar year. These figures exclude identity theft and do not call registry complaints.
(in
thou
sand
s)
105,677 98,181
1,109,826
1,456,679
996,902
Calendar Years 2012 through 2014
Federal Trade Commission Page 5 of 45 Released June 2015

Cross-Border Fraud Complaints By Consumer and Company Location1
January 1 – December 31, 2014
1Percentages are based on the total number of cross-border fraud complaints for each calendar year: CY-2012 = 116,396; CY-2013 = 105,677; and CY-2014 = 98,181.
Cross-Border Fraud Complaints By Consumer and Company Location1
Calendar Years 2012 through 2014
Foreign Consumers Against Companies Located in
Other Foreign Countries12%
U.S. Consumers Against Companies Located in
Other Foreign Countries 49%
U.S. Consumers Against Companies Located in
Canada5%
Foreign Consumers Against Companies Located in the
U.S. or Canada 18%
Canadian Consumers Against Companies Located in Other Foreign Countries
5%
Canadian Consumers Against Companies Located
in the U.S.11%
Federal Trade Commission Page 6 of 45 Released June 2015
2012 2013 2014
U.S. Consumers Against Companies Located in Canada 6% 5% 5%U.S. Consumers Against Companies Located in Other Foreign Countries 64% 52% 49%Canadian Consumers Against Companies Located in the U.S. 8% 10% 11%Canadian Consumers Against Companies Located in Other Foreign Countries 6% 6% 5%Foreign Consumers Against Companies Located in the U.S. or Canada 10% 17% 18%Foreign Consumers Against Companies Located in Other Foreign Countries 6% 10% 12%
Calendar Year

Fraud Complaints from U.S. Consumers Against Companies Located in Foreign Countries
No.
of C
ompl
aint
s
Calendar Years 2010 through 2014
Federal Trade Commission Page 7 of 45 Released June 2015
81,018
105,176
82,128
59,700
53,238
20,000
40,000
60,000
80,000
100,000
120,000
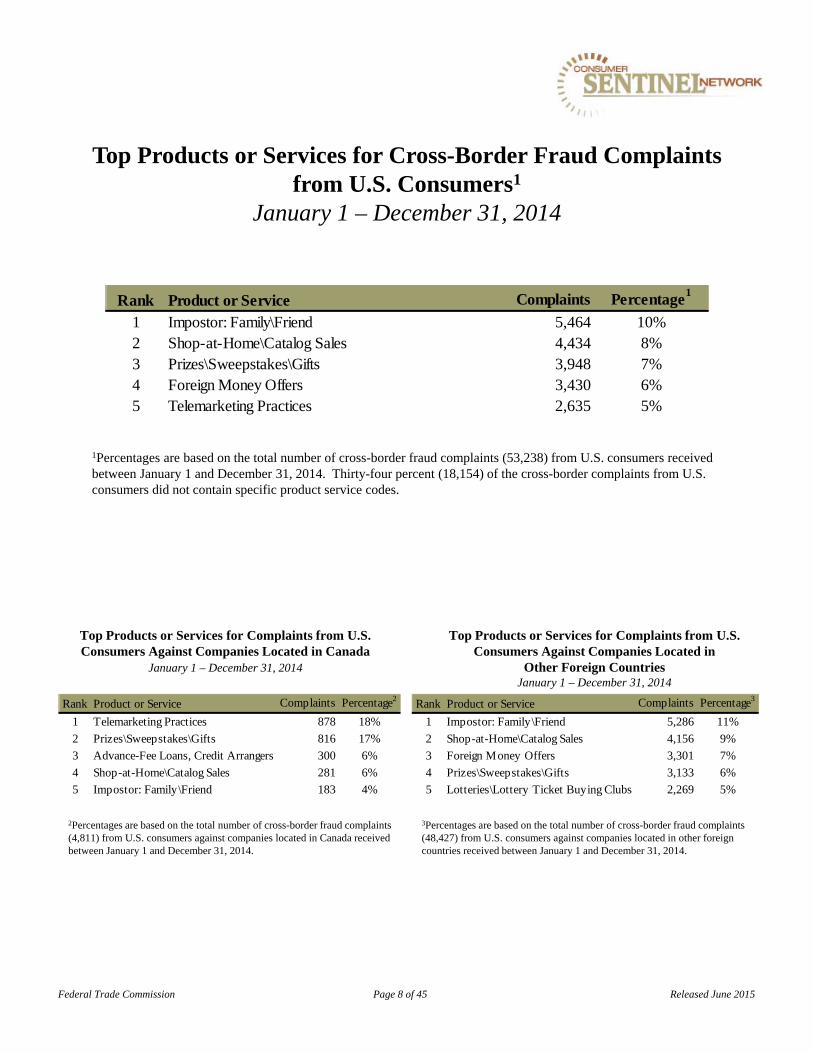
Top Products or Services for Cross-Border Fraud Complaints from U.S. Consumers1
January 1 – December 31, 2014
1Percentages are based on the total number of cross-border fraud complaints (53,238) from U.S. consumers received between January 1 and December 31, 2014. Thirty-four percent (18,154) of the cross-border complaints from U.S. consumers did not contain specific product service codes.
Top Products or Services for Complaints from U.S. Consumers Against Companies Located in Canada
January 1 – December 31, 2014
2Percentages are based on the total number of cross-border fraud complaints (4,811) from U.S. consumers against companies located in Canada received between January 1 and December 31, 2014.
Top Products or Services for Complaints from U.S. Consumers Against Companies Located in
Other Foreign CountriesJanuary 1 – December 31, 2014
3Percentages are based on the total number of cross-border fraud complaints (48,427) from U.S. consumers against companies located in other foreign countries received between January 1 and December 31, 2014.
Federal Trade Commission Page 8 of 45 Released June 2015
Rank Product or Service Complaints Percentage1
1 Impostor: Family\Friend 5,464 10%2 Shop-at-Home\Catalog Sales 4,434 8%3 Prizes\Sweepstakes\Gifts 3,948 7%4 Foreign Money Offers 3,430 6%5 Telemarketing Practices 2,635 5%
Rank Product or Service Complaints Percentage2
1 Telemarketing Practices 878 18%
2 Prizes\Sweepstakes\Gifts 816 17%
3 Advance-Fee Loans, Credit Arrangers 300 6%
4 Shop-at-Home\Catalog Sales 281 6%
5 Impostor: Family\Friend 183 4%
Rank Product or Service Complaints Percentage3
1 Impostor: Family\Friend 5,286 11%
2 Shop-at-Home\Catalog Sales 4,156 9%
3 Foreign Money Offers 3,301 7%
4 Prizes\Sweepstakes\Gifts 3,133 6%
5 Lotteries\Lottery Ticket Buying Clubs 2,269 5%

Total Reporting
Amount Paid Reported Average3
Median4
2012 74,576 71,906 96% $183,542,868 $2,553 $5182013 54,600 52,561 96% $190,051,990 $3,616 $6602014 48,427 45,959 95% $171,694,524 $3,736 $590
CY
Complaint CountPercentage Reporting
Amount Paid
Amount Paid
Total Reporting
Amount Paid Reported Average1
Median2
2012 7,552 5,664 75% $13,013,537 $2,298 $6762013 5,100 3,402 67% $10,265,597 $3,018 $5862014 4,811 2,785 58% $9,307,553 $3,342 $613
CY
Complaint CountPercentage Reporting
Amount Paid
Amount Paid
Fraud Complaints and Amount Paid byU.S. Consumers Against Companies Located in Canada
Calendar Years 2012 through 2014
Fraud Complaints and Amount Paid byU.S. Consumers Against Companies Located in Other Foreign Countries
Calendar Years 2012 through 2014
1Average is based on the total number of consumers who reported amount paid for each calendar year: CY-2012 = 5,664; CY-2013 = 3,402; and CY-2014 = 2,785. The amount paid is based on complaints with reported values from $0 to $999,999.
2Median is the middle number in a set of numbers so that half the numbers have values that are greater than the median and half have values that are less. Calculation of the median excludes complaints with amount paid reported as $0.
3Average is based on the total number of consumers who reported amount paid for each calendar year: CY-2012 = 71,906; CY-2013 = 52,561; and CY-2014 = 45,959. The amount paid is based on complaints with reported values from $0 to $999,999.
4Median is the middle number in a set of numbers so that half the numbers have values that are greater than the median and half have values that are less. Calculation of the median excludes complaints with amount paid reported as $0.
Federal Trade Commission Page 9 of 45 Released June 2015

Method of Payment Reported by U.S. Consumers in Cross-Border Fraud Complaints
January 1 - December 31, 2014
1Percentages are based on the total number of consumers who reported the method of payment (1,439). Thirty percent of consumers reported this information.
3Percentages are based on the total number of consumers who reported the method of payment (33,775). Seventy percent of consumers reported this information.
2These figures include a significant number of complaints from data contributors MoneyGram International and Western Union Money Transfer, which may affect the distribution of the reported method of payment.
4These figures include a significant number of complaints from data contributors MoneyGram International and Western Union Money Transfer, which may affect the distribution of the reported method of payment.
2
Federal Trade Commission Page 10 of 45 Released June 2015
4
U.S. Consumers Who Paid Companies Located in Canada1
U.S. Consumers Who Paid Companies Located in Other Foreign Countries3

U.S. Consumers Contacted By Companies Located in Canada1
Method of Initial Contact in Cross-Border Fraud Complaints from U.S. Consumers
U.S. Consumers Contacted By Companies Located in Other Foreign Countries2
CY – 2012
CY - 2014
CY - 2013
CY - 2012
CY – 2014
CY - 2013
1Percentages are based on the total number of consumers who reported the company’s method of initial contact: CY-2012 = 5,149 with 68% reporting this information; CY-2013 = 3,448 with 68% reporting this information; and CY-2014 = 2,761 with 57% reporting this information.
2Percentages are based on the total number of consumers who reported the company’s method of initial contact: CY-2012 = 38,747 with 52% reporting this information; CY-2013 = 28,497 with 52% reporting this information; and CY-2014 = 24,350 with 50% reporting this information.
Federal Trade Commission Page 11 of 45 Released June 2015

Fraud Complaints from U.S. Consumers AgainstCompanies Located in Canada
January 1 – December 31, 2014
Ontario
British Columbia
Company Locations
1Percentages are based on the 4,811 fraud complaints received between January 1 and December 31, 2014 from U.S. consumers against companies located in Canada.
Quebec
Federal Trade Commission Page 12 of 45 Released June 2015
Alberta
Province\Territory Complaints Percentage1
Ontario 1,589 33.0%Quebec 492 10.2%British Columbia 348 7.2%Alberta 136 2.8%Nova Scotia 40 0.8%Manitoba 40 0.8%Saskatchewan 30 0.6%New Brunswick 17 0.4%Prince Edward Island 7 0.1%Newfoundland 7 0.1%Yukon 1 <0.1%Northwest Territories 0 0.0%Nunavut 0 0.0%Not Reported 2,104 43.7%

Top Products or Services for Fraud Complaints from U.S. Consumers Against Companies Located in
Ontario, Canada1
January 1 – December 31, 2014
1Percentages are based upon the total number of fraud complaints (1,589) by U.S. consumers complaining about companies in Ontario, Canada received between January 1 and December 31, 2014. Note that counts and percentages may not add up to the total because CSN complaints may be coded under multiple product service codes.
Federal Trade Commission Page 13 of 45 Released June 2015
Rank Product or Service Complaints Percentage
1 Telemarketing Practices 597 38%
2 Advance-Fee Loans, Credit Arrangers 284 18%
3 Prizes\Sweepstakes\Gifts 144 9%
4 Shop-at-Home\Catalog Sales 108 7%5 Mobile: Text Messages 83 5%
Telemarketing Practices38%
Advance-Fee Loans, Credit Arrangers
18%
Prizes\Sweepstakes\Gifts9%
Shop-at-Home\Catalog Sales7%
Mobile: Text Messages5%
Other23%

Top Products or Services for Fraud Complaints from U.S. Consumers Against Companies Located in
Quebec, Canada1
January 1 – December 31, 2014
1Percentages are based upon the total number of fraud complaints (492) by U.S. consumers complaining about companies in Quebec, Canada received between January 1 and December 31, 2014. Note that counts and percentages may not add up to the total because CSN complaints may be coded under multiple product service codes.
Foreign Money Offers19%
Impostor: Family\Friend18%
Telemarketing Practices16%
Shop-at-Home\Catalog Sales8%
Office: Ad Space\Directory Listings
6%
Prizes\Sweepstakes\Gifts6%
Other27%
Federal Trade Commission Page 14 of 45 Released June 2015
Rank Product or Service Complaints Percentage
1 Foreign Money Offers 94 19%
2 Impostor: Family\Friend 89 18%
3 Telemarketing Practices 79 16%
4 Shop-at-Home\Catalog Sales 39 8%
5 Office: Ad Space\Directory Listings 31 6%
6 Prizes\Sweepstakes\Gifts 31 6%

Top Products or Services for Fraud Complaints from U.S. Consumers Against Companies Located in
British Columbia, Canada1
January 1 – December 31, 2014
1Percentages are based upon the total number of fraud complaints (348) by U.S. consumers complaining about companies in British Columbia, Canada received between January 1 and December 31, 2014. Note that counts and percentages may not add up to the total because CSN complaints may be coded under multiple product service codes.
Telemarketing Practices14%
Shop-at-Home\Catalog Sales12%
Prizes\Sweepstakes\Gifts9%
Mobile: Text Messages6%
Internet Web Site Design\Promotion
6%
Other53%
Federal Trade Commission Page 15 of 45 Released June 2015
Rank Product or Service Complaints Percentage
1 Telemarketing Practices 47 14%
2 Shop-at-Home\Catalog Sales 43 12%
3 Prizes\Sweepstakes\Gifts 33 9%
4 Mobile: Text Messages 22 6%
5 Internet Web Site Design\Promotion 21 6%
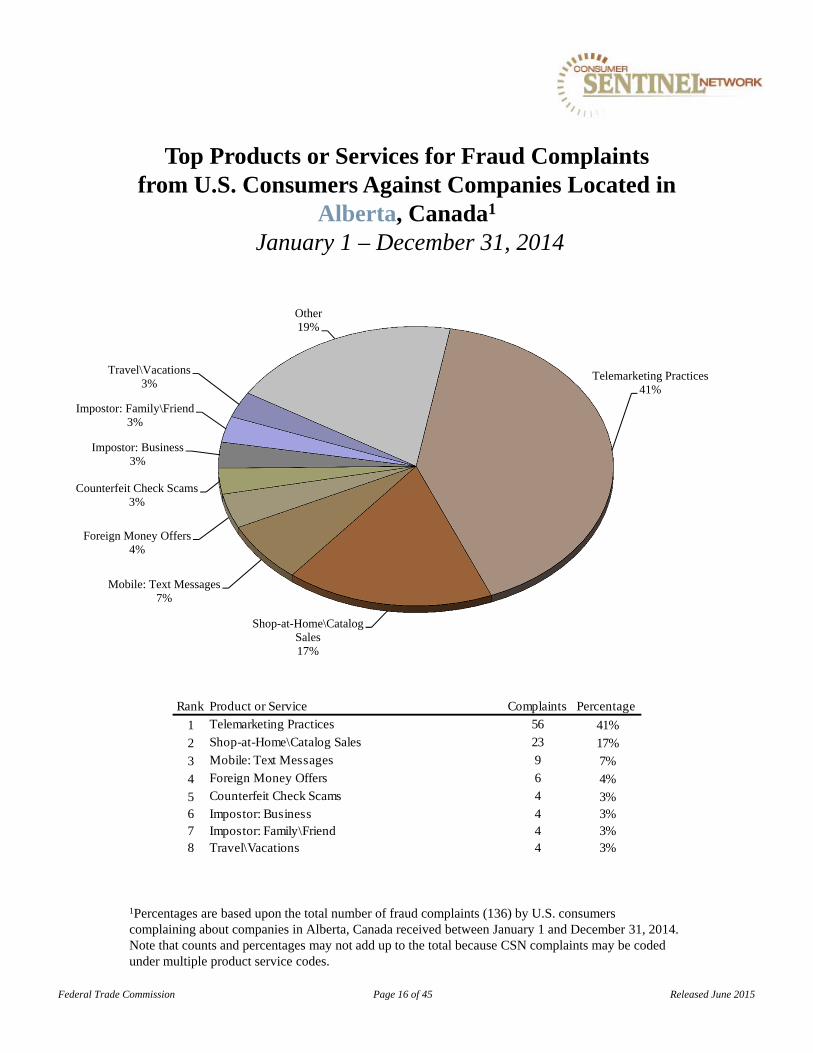
Top Products or Services for Fraud Complaints from U.S. Consumers Against Companies Located in
Alberta, Canada1
January 1 – December 31, 2014
1Percentages are based upon the total number of fraud complaints (136) by U.S. consumers complaining about companies in Alberta, Canada received between January 1 and December 31, 2014. Note that counts and percentages may not add up to the total because CSN complaints may be coded under multiple product service codes.
Telemarketing Practices41%
Shop-at-Home\Catalog Sales17%
Mobile: Text Messages7%
Foreign Money Offers4%
Counterfeit Check Scams3%
Impostor: Business3%
Impostor: Family\Friend3%
Travel\Vacations3%
Other19%
Federal Trade Commission Page 16 of 45 Released June 2015
Rank Product or Service Complaints Percentage
1 Telemarketing Practices 56 41%
2 Shop-at-Home\Catalog Sales 23 17%
3 Mobile: Text Messages 9 7%
4 Foreign Money Offers 6 4%
5 Counterfeit Check Scams 4 3%6 Impostor: Business 4 3%7 Impostor: Family\Friend 4 3%8 Travel\Vacations 4 3%
Federal Trade Commission Page 17 of 45 Released June 2015
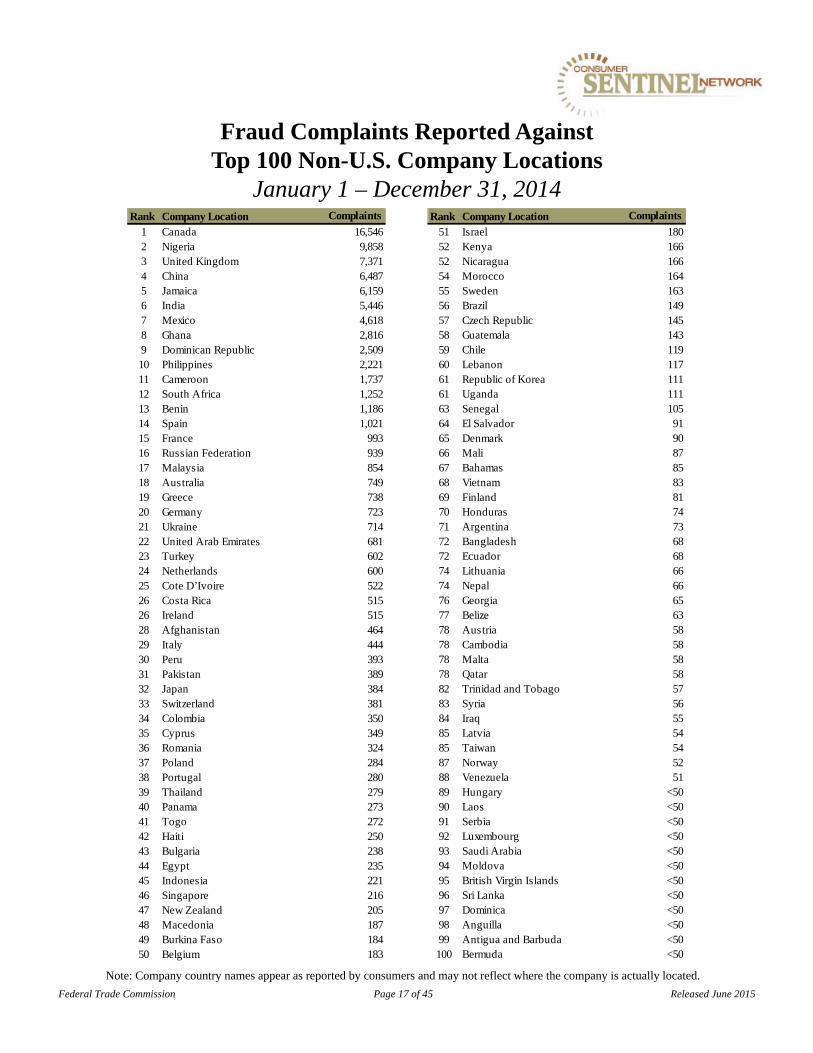
Rank Company Location Complaints
1 Canada 16,5462 Nigeria 9,8583 United Kingdom 7,3714 China 6,4875 Jamaica 6,1596 India 5,4467 Mexico 4,6188 Ghana 2,8169 Dominican Republic 2,50910 Philippines 2,22111 Cameroon 1,73712 South Africa 1,25213 Benin 1,18614 Spain 1,02115 France 99316 Russian Federation 93917 Malaysia 85418 Australia 74919 Greece 73820 Germany 72321 Ukraine 71422 United Arab Emirates 68123 Turkey 60224 Netherlands 60025 Cote D’Ivoire 52226 Costa Rica 51526 Ireland 51528 Afghanistan 46429 Italy 44430 Peru 39331 Pakistan 38932 Japan 38433 Switzerland 38134 Colombia 35035 Cyprus 34936 Romania 32437 Poland 28438 Portugal 28039 Thailand 27940 Panama 27341 Togo 27242 Haiti 25043 Bulgaria 23844 Egypt 23545 Indonesia 22146 Singapore 21647 New Zealand 20548 Macedonia 18749 Burkina Faso 18450 Belgium 183
Fraud Complaints Reported Against Top 100 Non-U.S. Company Locations
January 1 – December 31, 2014
Note: Company country names appear as reported by consumers and may not reflect where the company is actually located.
Rank Company Location Complaints
51 Israel 18052 Kenya 16652 Nicaragua 16654 Morocco 16455 Sweden 16356 Brazil 14957 Czech Republic 14558 Guatemala 14359 Chile 11960 Lebanon 11761 Republic of Korea 11161 Uganda 11163 Senegal 10564 El Salvador 9165 Denmark 9066 Mali 8767 Bahamas 8568 Vietnam 8369 Finland 8170 Honduras 7471 Argentina 7372 Bangladesh 6872 Ecuador 6874 Lithuania 6674 Nepal 6676 Georgia 6577 Belize 6378 Austria 5878 Cambodia 5878 Malta 5878 Qatar 5882 Trinidad and Tobago 5783 Syria 5684 Iraq 5585 Latvia 5485 Taiwan 5487 Norway 5288 Venezuela 5189 Hungary <5090 Laos <5091 Serbia <5092 Luxembourg <5093 Saudi Arabia <5094 Moldova <5095 British Virgin Islands <5096 Sri Lanka <5097 Dominica <5098 Anguilla <5099 Antigua and Barbuda <50100 Bermuda <50

Rank Product or Service Complaints1 Shop-at-Home\Catalog Sales 2,8282 Prizes\Sweepstakes\Gifts 2,7003 Telemarketing Practices 1,3344 Employ Agencies\Job Counsel\Overseas Work 1,0775 Advance-Fee Loans, Credit Arrangers 1,044
Top Products or Services for Fraud Complaints Reported Against Companies Located in Canada
Top Products or Services for Fraud Complaints ReportedAgainst the Top 15 Company Locations Outside of the U.S.1
January 1 – December 31, 2014
Rank Product or Service Complaints1 Impostor: Family\Friend 1,7962 Romance Scams 1,1873 Foreign Money Offers 9624 Internet Auction 6405 Lotteries\Lottery Ticket Buying Clubs 395
Top Products or Services for Fraud Complaints Reported Against Companies Located in Nigeria
Rank Product or Service Complaints1 Internet Auction 9262 Shop-at-Home\Catalog Sales 8853 Business Opportunities\Work-At-Home Plans 3044 Prizes\Sweepstakes\Gifts 1825 Foreign Money Offers 167
Top Products or Services for Fraud Complaints Reported Against Companies Located in the U.K.
Rank Product or Service Complaints1 Shop-at-Home\Catalog Sales 2,5562 Internet Auction 5233 Credit Cards 2104 Telephone: Other 1855 Impostor: Business 162
Top Products or Services for Fraud Complaints Reported Against Companies Located in China
1Complaints may be coded under multiple product service codes.Note: Company country names appear as reported by consumers and may not reflect where the company is actually located.
Federal Trade Commission Page 18 of 45 Released June 2015
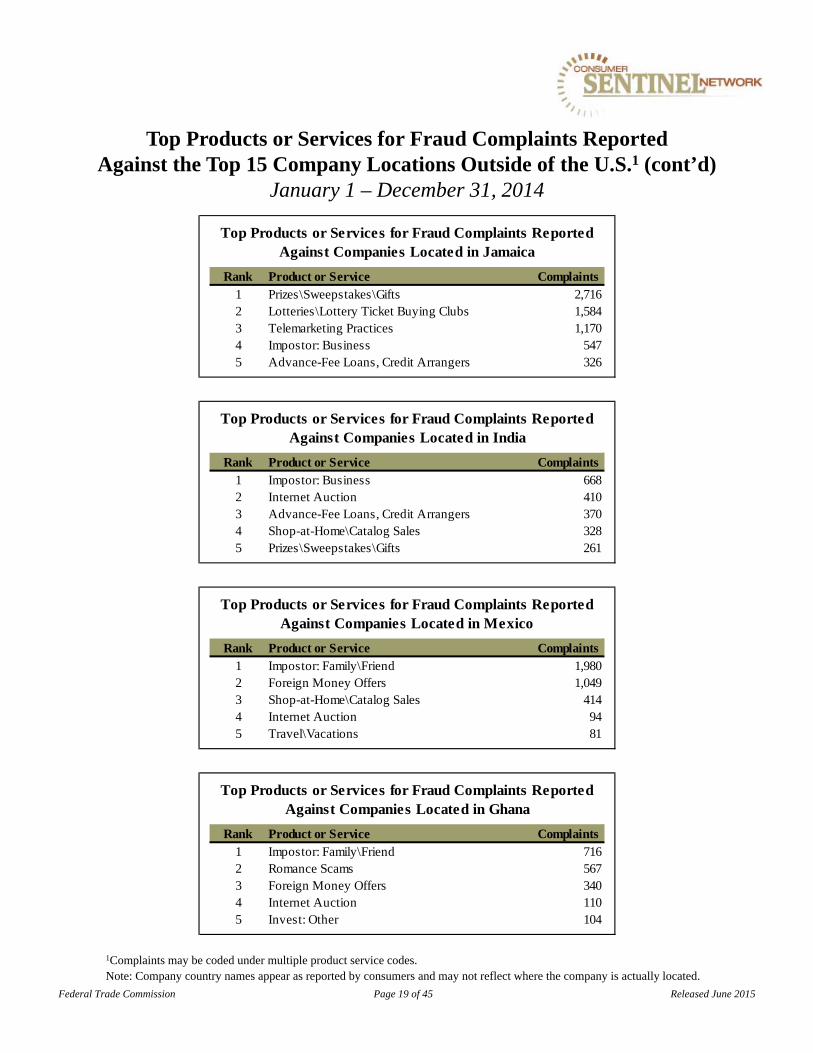
Rank Product or Service Complaints1 Impostor: Family\Friend 7162 Romance Scams 5673 Foreign Money Offers 3404 Internet Auction 1105 Invest: Other 104
Top Products or Services for Fraud Complaints Reported Against Companies Located in Ghana
Rank Product or Service Complaints1 Impostor: Family\Friend 1,9802 Foreign Money Offers 1,0493 Shop-at-Home\Catalog Sales 4144 Internet Auction 945 Travel\Vacations 81
Top Products or Services for Fraud Complaints Reported Against Companies Located in Mexico
Rank Product or Service Complaints1 Prizes\Sweepstakes\Gifts 2,7162 Lotteries\Lottery Ticket Buying Clubs 1,5843 Telemarketing Practices 1,1704 Impostor: Business 5475 Advance-Fee Loans, Credit Arrangers 326
Top Products or Services for Fraud Complaints Reported Against Companies Located in Jamaica
Top Products or Services for Fraud Complaints ReportedAgainst the Top 15 Company Locations Outside of the U.S.1 (cont’d)
January 1 – December 31, 2014
1Complaints may be coded under multiple product service codes.Note: Company country names appear as reported by consumers and may not reflect where the company is actually located.
Rank Product or Service Complaints1 Impostor: Business 6682 Internet Auction 4103 Advance-Fee Loans, Credit Arrangers 3704 Shop-at-Home\Catalog Sales 3285 Prizes\Sweepstakes\Gifts 261
Top Products or Services for Fraud Complaints Reported Against Companies Located in India
Federal Trade Commission Page 19 of 45 Released June 2015

Rank Product or Service Complaints1 Impostor: Family\Friend 1602 Foreign Money Offers 973 Romance Scams 844 Internet Auction 745 Shop-at-Home\Catalog Sales 54
Top Products or Services for Fraud Complaints Reported Against Companies Located in South Africa
Rank Product or Service Complaints1 Shop-at-Home\Catalog Sales 7782 Internet Auction 5393 Impostor: Family\Friend <204 Foreign Money Offers <205 Advance-Fee Loans, Credit Arrangers <20
Top Products or Services for Fraud Complaints Reported Against Companies Located in Cameroon
Rank Product or Service Complaints1 Romance Scams 3082 Impostor: Family\Friend 2573 Internet Auction 1744 Business Opportunities\Work-At-Home Plans 1705 Foreign Money Offers 118
Top Products or Services for Fraud Complaints Reported Against Companies Located in Philippines
Rank Product or Service Complaints1 Impostor: Family\Friend 5662 Foreign Money Offers 3893 Shop-at-Home\Catalog Sales 3504 Romance Scams 2555 Advance-Fee Loans, Credit Arrangers 107
Top Products or Services for Fraud Complaints Reported Against Companies Located in Dominican Republic
Top Products or Services for Fraud Complaints ReportedAgainst the Top 15 Company Locations Outside of the U.S.1 (cont’d)
January 1 – December 31, 2014
1Complaints may be coded under multiple product service codes.Note: Company country names appear as reported by consumers and may not reflect where the company is actually located.
Federal Trade Commission Page 20 of 45 Released June 2015

Rank Product or Service Complaints1 Internet Auction 2112 Shop-at-Home\Catalog Sales 1593 Business Opportunities\Work-At-Home Plans 584 Advance-Fee Loans, Credit Arrangers 515 Employ Agencies\Job Counsel\Overseas Work 38
Top Products or Services for Fraud Complaints Reported Against Companies Located in France
Rank Product or Service Complaints1 Timeshare Sales 1232 Property\Inheritance Tracers 963 Internet Auction 944 Prizes\Sweepstakes\Gifts 795 Shop-at-Home\Catalog Sales 77
Top Products or Services for Fraud Complaints Reported Against Companies Located in Spain
Rank Product or Service Complaints1 Advance-Fee Loans, Credit Arrangers 1962 Internet Auction 1783 Foreign Money Offers 844 Shop-at-Home\Catalog Sales 695 Lotteries\Lottery Ticket Buying Clubs 61
Top Products or Services for Fraud Complaints Reported Against Companies Located in Benin
Top Products or Services for Fraud Complaints ReportedAgainst the Top 15 Company Locations Outside of the U.S.1 (cont’d)
January 1 – December 31, 2014
1Complaints may be coded under multiple product service codes.Note: Company country names appear as reported by consumers and may not reflect where the company is actually located.
Federal Trade Commission Page 21 of 45 Released June 2015

Rank Consumer Location Complaints
51 Austria 11352 Dominican Republic 10653 Czech Republic 10154 Kuwait 9955 Croatia 9656 Trinidad and Tobago 8557 Costa Rica 8158 Jamaica 8059 Guatemala 6759 Kenya 6761 Cyprus 6561 Qatar 6563 Bolivia 6363 Kazakhstan 6363 Latvia 6366 Mauritius 6267 Lebanon 6068 Albania 5668 Panama 5668 Slovenia 5671 Sri Lanka 5572 Lithuania 5472 Slovakia 5474 Bahamas 5375 Bangladesh 5276 Iran 5177 Uruguay <5078 Bahrain <5079 Vietnam <5080 Estonia <5081 Malta <5082 Ghana <5083 Jordan <5084 Macedonia <5085 Azerbaijan <5086 Honduras <5087 Oman <5088 Uganda <5089 Afghanistan <5090 El Salvador <5091 Armenia <5092 Moldova <5093 Nicaragua <5094 Bosnia and Herzegovina <5095 Serbia <5096 Belarus <5097 Fiji <5098 Algeria <5099 Morocco <50100 Luxembourg <50
Rank Consumer Location Complaints
1 Canada 26,9212 United Kingdom 5,0743 Australia 3,2164 India 2,1975 France 1,6686 Mexico 1,3067 Italy 1,1398 Germany 8839 Spain 86110 Brazil 76911 China 75212 Russian Federation 67513 South Africa 64014 Netherlands 56515 Philippines 46916 New Zealand 42417 Israel 40818 Colombia 38419 Sweden 38020 Malaysia 36621 Belgium 36321 United Arab Emirates 36323 Ireland 36224 Singapore 34025 Turkey 33626 Saudi Arabia 29927 Argentina 29827 Switzerland 29829 Portugal 29630 Japan 29231 Pakistan 28932 Romania 27333 Greece 26534 Republic of Korea 25235 Denmark 22936 Nigeria 21037 Ukraine 20038 Norway 19439 Poland 18140 Chile 18041 Finland 16342 Venezuela 15943 Thailand 15644 Bulgaria 15045 Indonesia 14046 Peru 13847 Hungary 12248 Egypt 12149 Ecuador 12050 Taiwan 114
Fraud Complaints Reported For Top 100 Non-U.S. Consumer Locations
January 1 – December 31, 2014
Note: Consumer country names appear as reported by consumers.
Federal Trade Commission Page 22 of 45 Released June 2015

Top Products or Services for Fraud Complaints Reportedin the Top 5 Consumer Locations Outside of the U.S.1
January 1 – December 31, 2014
1Complaints may be coded under multiple product service codes.Note: Consumer country names appear as reported by consumers.
Rank Product or Service Complaints1 Shop-at-Home\Catalog Sales 4,4572 Prizes\Sweepstakes\Gifts 3,7823 Office: Ad Space\Directory Listings 1,4324 Employ Agencies\Job Counsel\Overseas Work 1,3285 Internet Auction 1,318
Top Products or Services for Fraud Complaints Reported By Consumers Located in Canada
Rank Product or Service Complaints1 Internet Auction 4932 Shop-at-Home\Catalog Sales 3713 Advance-Fee Loans, Credit Arrangers 3644 Impostor: Family\Friend 3545 Timeshare Sales 298
Top Products or Services for Fraud Complaints Reported By Consumers Located in the U.K.
Rank Product or Service Complaints1 Shop-at-Home\Catalog Sales 6092 Internet Auction 5463 Impostor: Family\Friend 1124 Credit Cards 1025 Travel\Vacations 81
Top Products or Services for Fraud Complaints Reported By Consumers Located in Australia
Federal Trade Commission Page 23 of 45 Released June 2015

Rank Product or Service Complaints1 Shop-at-Home\Catalog Sales 3442 Internet Auction 1483 Telephone: Other 634 Impostor: Family\Friend 605 Credit Cards 57
Top Products or Services for Fraud Complaints Reported By Consumers Located in France
Rank Product or Service Complaints1 Shop-at-Home\Catalog Sales 1752 Internet Information Services 463 Employ Agencies\Job Counsel\Overseas Work 444 Business Opportunities\Work-At-Home Plans 385 Unsolicited Email 32
Top Products or Services for Fraud Complaints Reported By Consumers Located in India
Top Products or Services for Fraud Complaints Reportedin the Top 5 Consumer Locations Outside of the U.S.1 (cont’d)
January 1 – December 31, 2014
1Complaints may be coded under multiple product service codes.Note: Consumer country names appear as reported by consumers.
Federal Trade Commission Page 24 of 45 Released June 2015

Canadian Consumer Fraud Complaints January 1 – December 31, 2014
Top Products or Services by Complaint Count2
2Percentages are based upon the total number of fraud complaints (26,921) by Canadian consumers received between January 1 and December 31, 2014.
Federal Trade Commission Page 25 of 45 Released June 2015
1The amount paid is based on complaints with reported values from $0 to $999,999.
Shop-at-Home\Catalog Sales
17%
Prizes\Sweepstakes\Gifts14%
Office: Ad Space\Directory Listings
5%
Employ Agencies\Job Counsel\Overseas Work
5%
Internet Auction5%
Other54%
Note: Forty percent (10,722) of the complaints from Canadian consumers were against companies located in the United States; $19,791,645 amount paid was reported in these complaints.
No. of Complaints
Total Amount Paid
Reported1
26,921 $44,832,172

Fraud Complaints from Consumers Located in Ontario, Canada
January 1 – December 31, 2014
2Average amount paid is based upon the total number of complaints where amount paid was reported by Ontario consumers (5,003). The amount paid is based on complaints with reported values from $0 to $999,999.
3Median is the middle number in a set of numbers so that half the numbers have values that are greater than the median and half have values that are less. Calculation of the median excludes complaints with amount paid reported as $0.
4Percentages are based on the total number of fraud complaints where company’s method of initial contact was reported by Ontario consumers (5,592). Nine percent (494) of consumers reported other methods of initial contact. 59% of consumers reported this information.
Company’s Method of Contacting Consumers4
Top 5 Products or Services1
Reported Amount Paid
1Percentages are based on the total number of fraud complaints (9,477) received from Ontario consumers during the time period. Four percent (395) of the fraud complaints received from Ontario consumers did not include specific product service codes.
Federal Trade Commission Page 26 of 45 Released June 2015
Method of Payment Reported by Consumers5
Rank Product or Service Complaints Percentage1
1 Prizes\Sweepstakes\Gifts 1,856 20%2 Shop-at-Home\Catalog Sales 1,660 18%3 Employ Agencies\Job Counsel\Overseas Work 588 6%4 Internet Auction 503 5%5 Travel\Vacations 502 5%
TotalReporting
Amount PaidPercentage Reporting
Amount Paid Reported Average2
Median3
9,477 5,003 53% $11,343,650 $2,267 $700
Complaint Count Amount Paid
5Percentages are based on the total number of Ontario consumers who reported the method of payment (2,254) during the time period. 24% of consumers reported this information.

Fraud Complaints from Consumers Located in Quebec, Canada
January 1 – December 31, 2014
Reported Amount Paid
1Percentages are based on the total number of fraud complaints (3,597) received from Quebec consumers during the time period. Three percent (101) of the fraud complaints received from Quebec consumers did not include specific product service codes.
2Average amount paid is based upon the total number of complaints where amount paid was reported by Quebec consumers (2,171). The amount paid is based on complaints with reported values from $0 to $999,999.
3Median is the middle number in a set of numbers so that half the numbers have values that are greater than the median and half have values that are less. Calculation of the median excludes complaints with amount paid reported as $0.
Company’s Method of Contacting Consumers4
Top 5 Products or Services1
Method of Payment Reported by Consumers5
Rank Product or Service Complaints Percentage1
1 Shop-at-Home\Catalog Sales 1,157 32%2 Office: Ad Space\Directory Listings 349 10%3 Internet Auction 328 9%4 Impostor: Family\Friend 241 7%5 Advance-Fee Loans, Credit Arrangers 230 6%
TotalReporting
Amount PaidPercentage Reporting
Amount Paid Reported Average2
Median3
3,597 2,171 60% $7,535,280 $3,471 $627
Complaint Count Amount Paid
Federal Trade Commission Page 27 of 45 Released June 2015
4Percentages are based on the total number of fraud complaints where company’s method of initial contact was reported by Quebec consumers (2,315). Thirteen percent (312) of consumers reported other methods of initial contact. 64% of consumers reported this information.
5Percentages are based on the total number of Quebec consumers who reported the method of payment (1,247) during the time period. 35% of consumers reported this information.

Fraud Complaints from Consumers Located in Alberta, Canada
January 1 – December 31, 2014
Top 5 Products or Services1
Reported Amount Paid
1Percentages are based on the total number of fraud complaints (3,434) received from Alberta consumers during the time period. Four percent (154) of the fraud complaints received from Alberta consumers did not include specific product service codes.
2Average amount paid is based upon the total number of complaints where amount paid was reported by Alberta consumers (1,708). The amount paid is based on complaints with reported values from $0 to $999,999.
3Median is the middle number in a set of numbers so that half the numbers have values that are greater than the median and half have values that are less. Calculation of the median excludes complaints with amount paid reported as $0.
Company’s Method of Contacting Consumers4
4Percentages are based on the total number of fraud complaints where company’s method of initial contact was reported by Alberta consumers (1,822). Nine percent (167) of consumers reported other methods of initial contact. 53% of consumers reported this information.
Federal Trade Commission Page 28 of 45 Released June 2015
Method of Payment Reported by Consumers5
Rank Product or Service Complaints Percentage1
1 Prizes\Sweepstakes\Gifts 540 16%2 Shop-at-Home\Catalog Sales 523 15%3 Auto: Sales – New 372 11%4 Office: Ad Space\Directory Listings 242 7%5 Travel\Vacations 218 6%
TotalReporting
Amount PaidPercentage Reporting
Amount Paid Reported Average2
Median3
3,434 1,708 50% $4,798,648 $2,810 $740
Complaint Count Amount Paid
5Percentages are based on the total number of Alberta consumers who reported the method of payment (817) during the time period. 24% of consumers reported this information.
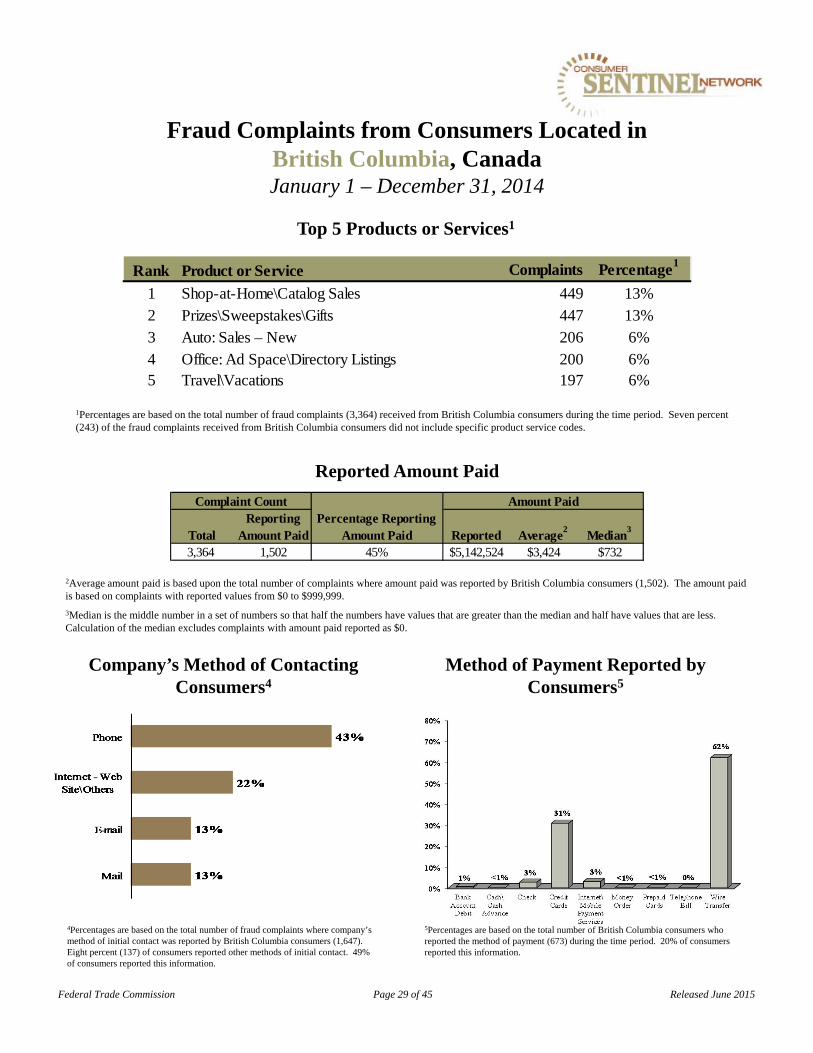
Fraud Complaints from Consumers Located in British Columbia, CanadaJanuary 1 – December 31, 2014
Top 5 Products or Services1
Reported Amount Paid
1Percentages are based on the total number of fraud complaints (3,364) received from British Columbia consumers during the time period. Seven percent (243) of the fraud complaints received from British Columbia consumers did not include specific product service codes.
2Average amount paid is based upon the total number of complaints where amount paid was reported by British Columbia consumers (1,502). The amount paid is based on complaints with reported values from $0 to $999,999.
3Median is the middle number in a set of numbers so that half the numbers have values that are greater than the median and half have values that are less. Calculation of the median excludes complaints with amount paid reported as $0.
Company’s Method of Contacting Consumers4
Federal Trade Commission Page 29 of 45 Released June 2015
Method of Payment Reported by Consumers5
Rank Product or Service Complaints Percentage1
1 Shop-at-Home\Catalog Sales 449 13%2 Prizes\Sweepstakes\Gifts 447 13%3 Auto: Sales – New 206 6%4 Office: Ad Space\Directory Listings 200 6%5 Travel\Vacations 197 6%
TotalReporting
Amount PaidPercentage Reporting
Amount Paid Reported Average2
Median3
3,364 1,502 45% $5,142,524 $3,424 $732
Complaint Count Amount Paid
4Percentages are based on the total number of fraud complaints where company’s method of initial contact was reported by British Columbia consumers (1,647). Eight percent (137) of consumers reported other methods of initial contact. 49% of consumers reported this information.
5Percentages are based on the total number of British Columbia consumers who reported the method of payment (673) during the time period. 20% of consumers reported this information.

Top Products or Services in All ComplaintsReported Against Companies Located in Africa1
January 1 – December 31, 2014
1“Africa” includes complaints where consumers reported the company country location as Algeria, Angola, Ascension and Tristan Da Cunha, Benin, Botswana, Burkina Faso, Burundi, Cameroon, Cabo Verde, Central African Republic, Chad, Comoros, the Democratic Republic of Congo, the Republic of Congo, Cote D’Ivoire, Djibouti, Egypt, Equatorial Guinea, Eritrea, Ethiopia, Gabon, Gambia, Ghana, Guinea, Guinea-Bissau, Kenya, Lesotho, Liberia, Libya, Madagascar, Malawi, Mali, Mauritania, Mauritius, Mayotte, Morocco, Mozambique, Namibia, Niger, Nigeria, Rwanda, Saint Helena, Sao Tome and Principe, Senegal, Seychelles, Sierra Leone, Somalia, South Africa, South Sudan, Sudan, Swaziland, Tanzania, Togo, Tunisia, Uganda, Western Sahara, Zambia or Zimbabwe. Note it is possible that not all countries have complaints in the system for the period the report covers.
Note: Company country locations appear as reported by consumers and may not reflect where the company is actually located.
Federal Trade Commission Page 30 of 45 Released June 2015
Product or Service Complaints
Impostor: Family\Friend 3,140Internet Auction 1,961Romance Scams 1,957Foreign Money Offers 1,635Shop-at-Home\Catalog Sales 1,416Advance-Fee Loans, Credit Arrangers 683Lotteries\Lottery Ticket Buying Clubs 535Invest: Other 456Prizes\Sweepstakes\Gifts 378Housing 325Business Opportunities\Work-At-Home Plans 290Employ Agencies\Job Counsel\Overseas Work 129Impostor: Business 108Impostor: Government 87Unsolicited Email 81Counterfeit Check Scams 58Charitable Solicitations 54Internet Information Services 48Property\Inheritance Tracers 43Telemarketing Practices 39

Top Products or Services in All ComplaintsReported Against Companies Located in Australia and New Zealand1
January 1 – December 31, 2014
1Includes complaints where consumers reported the company country location as Australia or New Zealand.
Note: Company country locations appear as reported by consumers and may not reflect where the company is actually located.
Federal Trade Commission Page 31 of 45 Released June 2015
Product or Service Complaints
Shop-at-Home\Catalog Sales 75Prizes\Sweepstakes\Gifts 44Internet Auction 40Computers: Equipment\Software 32Internet Access Services 29Internet Information Services 24Employ Agencies\Job Counsel\Overseas Work 24Impostor: Business 22Business Opportunities\Work-At-Home Plans <20Unsolicited Email <20Telemarketing Practices <20Credit Cards <20Internet Web Site Design\Promotion <20Home Furnishings <20Invest: Other <20Counterfeit Check Scams <20Health Care: Other Products\Supplies <20Cars <20Impostor: Government <20Romance Scams <20
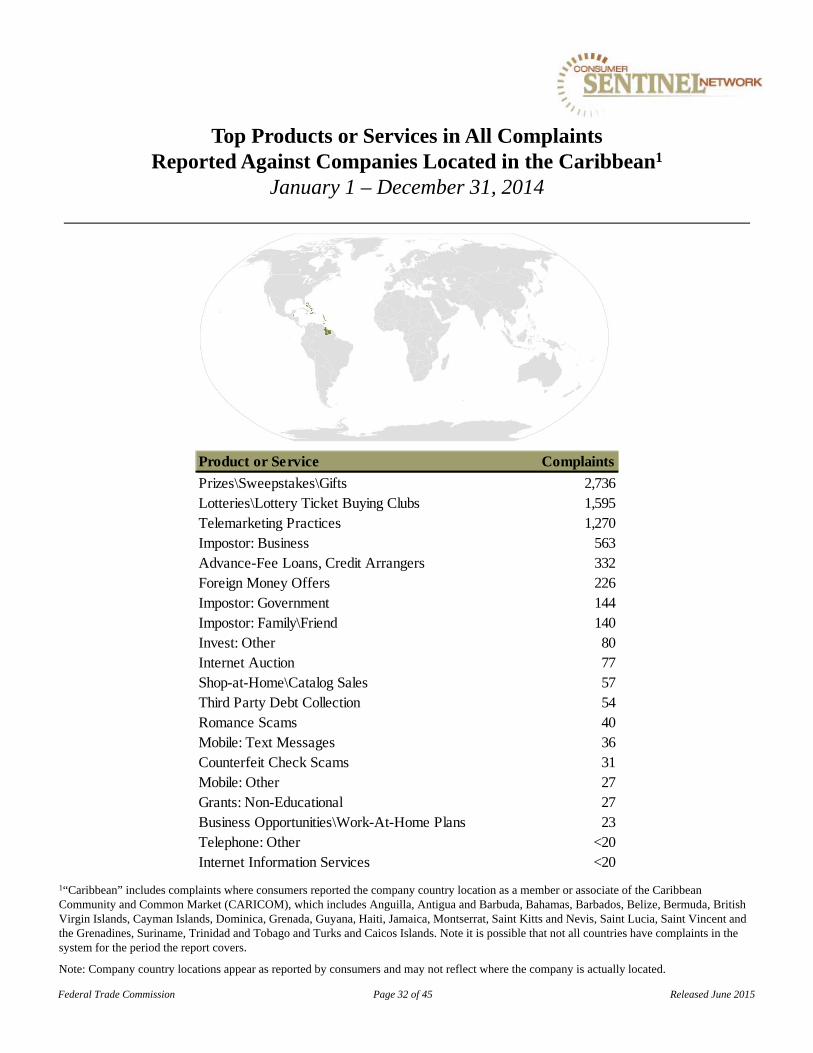
Top Products or Services in All ComplaintsReported Against Companies Located in the Caribbean1
January 1 – December 31, 2014
1“Caribbean” includes complaints where consumers reported the company country location as a member or associate of the Caribbean Community and Common Market (CARICOM), which includes Anguilla, Antigua and Barbuda, Bahamas, Barbados, Belize, Bermuda, British Virgin Islands, Cayman Islands, Dominica, Grenada, Guyana, Haiti, Jamaica, Montserrat, Saint Kitts and Nevis, Saint Lucia, Saint Vincent and the Grenadines, Suriname, Trinidad and Tobago and Turks and Caicos Islands. Note it is possible that not all countries have complaints in the system for the period the report covers.
Note: Company country locations appear as reported by consumers and may not reflect where the company is actually located.
Federal Trade Commission Page 32 of 45 Released June 2015
Product or Service Complaints
Prizes\Sweepstakes\Gifts 2,736Lotteries\Lottery Ticket Buying Clubs 1,595Telemarketing Practices 1,270Impostor: Business 563Advance-Fee Loans, Credit Arrangers 332Foreign Money Offers 226Impostor: Government 144Impostor: Family\Friend 140Invest: Other 80Internet Auction 77Shop-at-Home\Catalog Sales 57Third Party Debt Collection 54Romance Scams 40Mobile: Text Messages 36Counterfeit Check Scams 31Mobile: Other 27Grants: Non-Educational 27Business Opportunities\Work-At-Home Plans 23Telephone: Other <20Internet Information Services <20

Top Products or Services in All ComplaintsReported Against Companies Located in China, Japan and
the Republic of Korea1
January 1 – December 31, 2014
1Includes complaints where consumers reported the company country location as China, Japan, or the Republic of Korea.
Note: Company country locations appear as reported by consumers and may not reflect where the company is actually located.
Federal Trade Commission Page 33 of 45 Released June 2015
Product or Service Complaints
Shop-at-Home\Catalog Sales 2,635Internet Auction 537Computers: Equipment\Software 396Credit Cards 222Telephone: Other 196Impostor: Business 170Employ Agencies\Job Counsel\Overseas Work 92Jewelry\Watches 92Home Appliances 85Internet Access Services 84Property\Inheritance Tracers 75Children's Products 69Business Opportunities\Work-At-Home Plans 58Banks 52Health Care: Other Products\Supplies 49Cars 47Unsolicited Email 46Internet Information Services 40Counterfeit Check Scams 38Romance Scams 38
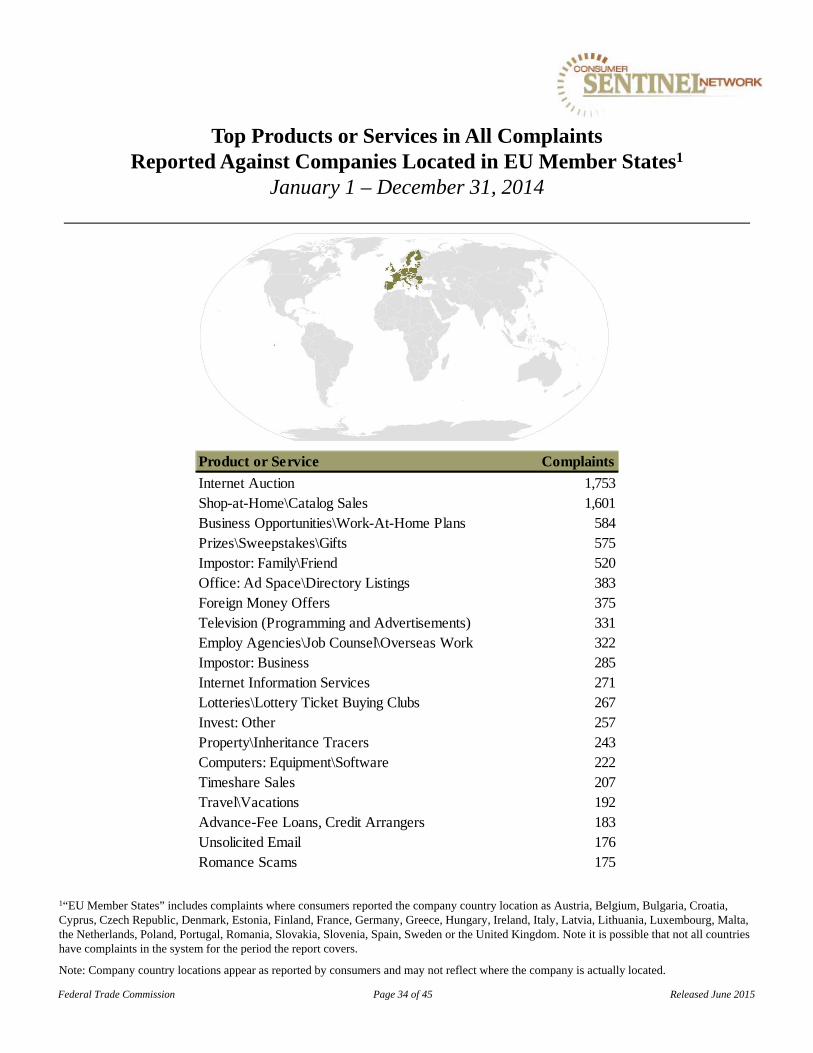
Top Products or Services in All ComplaintsReported Against Companies Located in EU Member States1
January 1 – December 31, 2014
1“EU Member States” includes complaints where consumers reported the company country location as Austria, Belgium, Bulgaria, Croatia, Cyprus, Czech Republic, Denmark, Estonia, Finland, France, Germany, Greece, Hungary, Ireland, Italy, Latvia, Lithuania, Luxembourg, Malta, the Netherlands, Poland, Portugal, Romania, Slovakia, Slovenia, Spain, Sweden or the United Kingdom. Note it is possible that not all countries have complaints in the system for the period the report covers.
Note: Company country locations appear as reported by consumers and may not reflect where the company is actually located.
Federal Trade Commission Page 34 of 45 Released June 2015
Product or Service Complaints
Internet Auction 1,753Shop-at-Home\Catalog Sales 1,601Business Opportunities\Work-At-Home Plans 584Prizes\Sweepstakes\Gifts 575Impostor: Family\Friend 520Office: Ad Space\Directory Listings 383Foreign Money Offers 375Television (Programming and Advertisements) 331Employ Agencies\Job Counsel\Overseas Work 322Impostor: Business 285Internet Information Services 271Lotteries\Lottery Ticket Buying Clubs 267Invest: Other 257Property\Inheritance Tracers 243Computers: Equipment\Software 222Timeshare Sales 207Travel\Vacations 192Advance-Fee Loans, Credit Arrangers 183Unsolicited Email 176Romance Scams 175
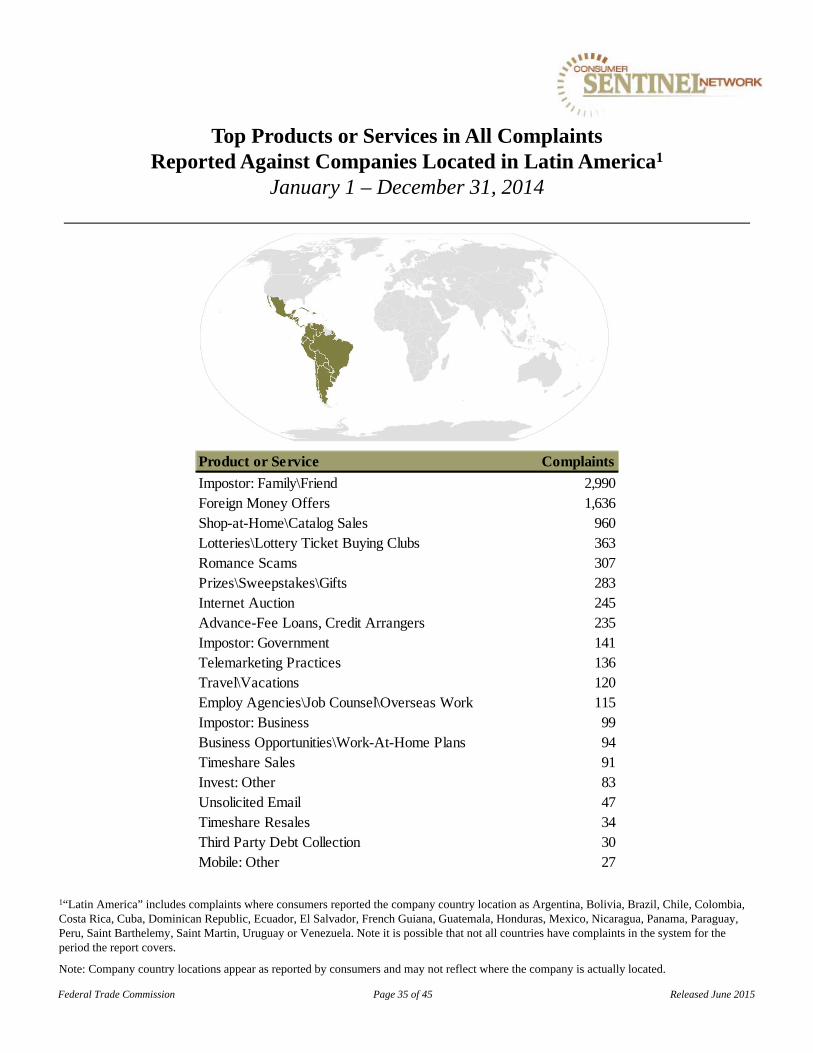
Top Products or Services in All ComplaintsReported Against Companies Located in Latin America1
January 1 – December 31, 2014
1“Latin America” includes complaints where consumers reported the company country location as Argentina, Bolivia, Brazil, Chile, Colombia, Costa Rica, Cuba, Dominican Republic, Ecuador, El Salvador, French Guiana, Guatemala, Honduras, Mexico, Nicaragua, Panama, Paraguay, Peru, Saint Barthelemy, Saint Martin, Uruguay or Venezuela. Note it is possible that not all countries have complaints in the system for the period the report covers.
Note: Company country locations appear as reported by consumers and may not reflect where the company is actually located.
Federal Trade Commission Page 35 of 45 Released June 2015
Product or Service Complaints
Impostor: Family\Friend 2,990Foreign Money Offers 1,636Shop-at-Home\Catalog Sales 960Lotteries\Lottery Ticket Buying Clubs 363Romance Scams 307Prizes\Sweepstakes\Gifts 283Internet Auction 245Advance-Fee Loans, Credit Arrangers 235Impostor: Government 141Telemarketing Practices 136Travel\Vacations 120Employ Agencies\Job Counsel\Overseas Work 115Impostor: Business 99Business Opportunities\Work-At-Home Plans 94Timeshare Sales 91Invest: Other 83Unsolicited Email 47Timeshare Resales 34Third Party Debt Collection 30Mobile: Other 27

Top Products or Services in All ComplaintsReported Against Companies Located in the Middle East1
January 1 – December 31, 2014
1“Middle East” includes complaints where consumers reported the company country location as Armenia, Azerbaijan, Bahrain, Gaza Strip, Georgia, Iran, Iraq, Israel, Jordan, Kuwait, Lebanon, Oman, Qatar, Saudi Arabia, Syria, Turkey, United Arab Emirates, West Bank or Yemen. Note it is possible that not all countries have complaints in the system for the period the report covers.
Note: Company country locations appear as reported by consumers and may not reflect where the company is actually located.
Federal Trade Commission Page 36 of 45 Released June 2015
Product or Service Complaints
Internet Auction 215Impostor: Family\Friend 164Shop-at-Home\Catalog Sales 104Foreign Money Offers 103Romance Scams 103Business Opportunities\Work-At-Home Plans 87Lotteries\Lottery Ticket Buying Clubs 68Employ Agencies\Job Counsel\Overseas Work 53Impostor: Business 52Office: Ad Space\Directory Listings 43Prizes\Sweepstakes\Gifts 40Invest: Other 34Counterfeit Check Scams 31Internet Information Services 23Unsolicited Email 23Advance-Fee Loans, Credit Arrangers <20Computers: Equipment\Software <20Travel\Vacations <20Telemarketing Practices <20Credit Cards <20
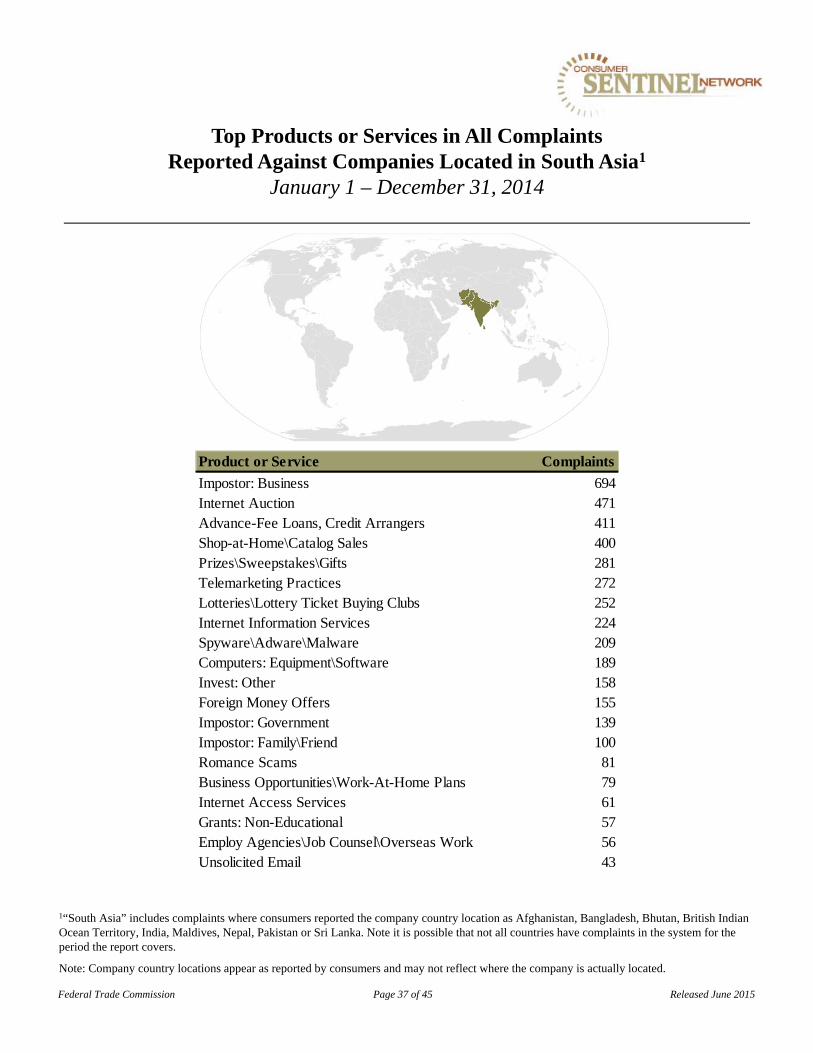
Top Products or Services in All ComplaintsReported Against Companies Located in South Asia1
January 1 – December 31, 2014
1“South Asia” includes complaints where consumers reported the company country location as Afghanistan, Bangladesh, Bhutan, British Indian Ocean Territory, India, Maldives, Nepal, Pakistan or Sri Lanka. Note it is possible that not all countries have complaints in the system for the period the report covers.
Note: Company country locations appear as reported by consumers and may not reflect where the company is actually located.
Federal Trade Commission Page 37 of 45 Released June 2015
Product or Service Complaints
Impostor: Business 694Internet Auction 471Advance-Fee Loans, Credit Arrangers 411Shop-at-Home\Catalog Sales 400Prizes\Sweepstakes\Gifts 281Telemarketing Practices 272Lotteries\Lottery Ticket Buying Clubs 252Internet Information Services 224Spyware\Adware\Malware 209Computers: Equipment\Software 189Invest: Other 158Foreign Money Offers 155Impostor: Government 139Impostor: Family\Friend 100Romance Scams 81Business Opportunities\Work-At-Home Plans 79Internet Access Services 61Grants: Non-Educational 57Employ Agencies\Job Counsel\Overseas Work 56Unsolicited Email 43

Top Products or Services in All ComplaintsReported Against Companies Located in Southeast Asia1
January 1 – December 31, 2014
1“Southeast Asia” includes complaints where consumers reported the company country location as a member of the Association of Southeast Asian Nations (ASEAN), which includes Brunei, Cambodia, Indonesia, Laos, Malaysia, Myanmar, Philippines, Singapore, Thailand and Vietnam. Note it is possible that not all countries have complaints in the system for the period the report covers.
Note: Company country locations appear as reported by consumers and may not reflect where the company is actually located.
Federal Trade Commission Page 38 of 45 Released June 2015
Product or Service Complaints
Romance Scams 430Impostor: Family\Friend 351Shop-at-Home\Catalog Sales 285Internet Auction 259Foreign Money Offers 188Business Opportunities\Work-At-Home Plans 173Lotteries\Lottery Ticket Buying Clubs 137Prizes\Sweepstakes\Gifts 91Housing 91Employ Agencies\Job Counsel\Overseas Work 91Impostor: Business 67Invest: Other 62Advance-Fee Loans, Credit Arrangers 61Counterfeit Check Scams 49Computers: Equipment\Software 30Impostor: Government 29Internet Information Services 27Telephone: Other 22Telemarketing Practices <20Property\Inheritance Tracers <20

Econsumer Complaints Top Consumer and Company Locations
January 1 – December 31, 2014
Note: Consumer and company country locations appear as reported by consumers. Company country name may not reflect where the company is actually located.
Federal Trade Commission Page 39 of 45 Released June 2015
Consumer Location ComplaintsUnited States 8,749Australia 2,036France 1,236United Kingdom 719Spain 461Canada 426India 297Brazil 283Israel 277Belgium 172
Company Location ComplaintsChina 3,647United States 3,405United Kingdom 1,123India 382Spain 276Australia 244France 228Germany 219Canada 179Cyprus 146
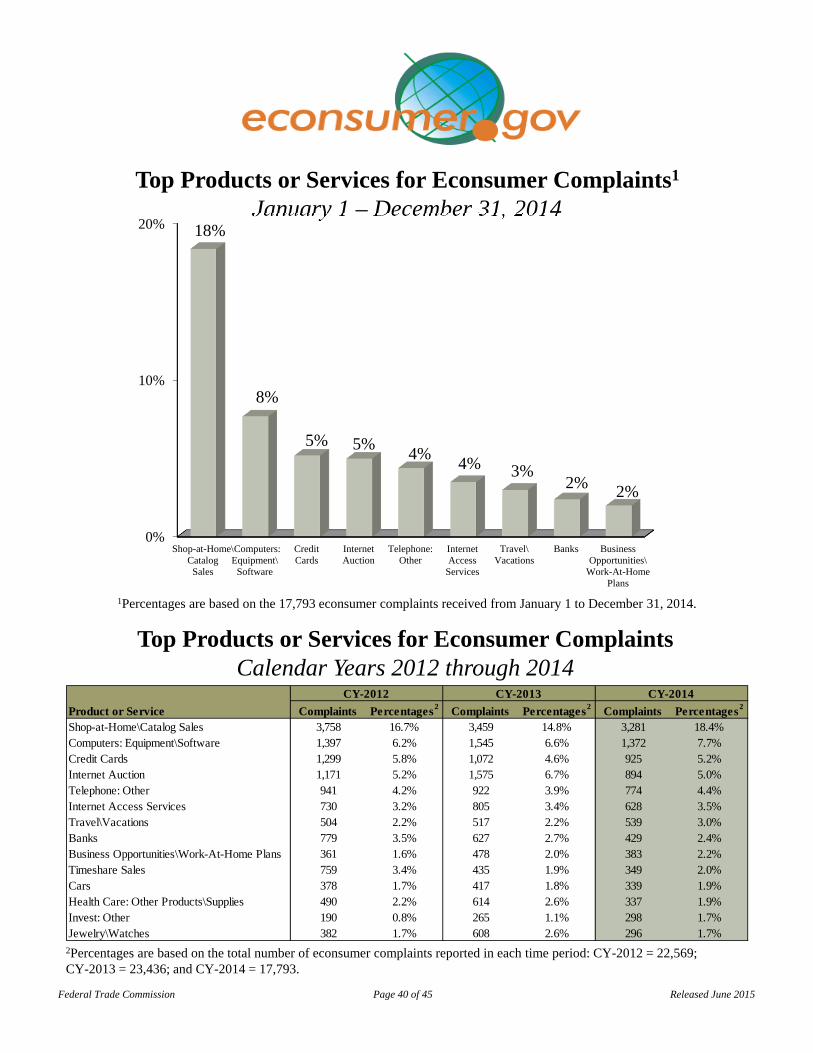
Top Products or Services for Econsumer Complaints1
January 1 – December 31, 2014
0%
10%
20%
Shop-at-Home\Catalog
Sales
Computers:Equipment\
Software
CreditCards
InternetAuction
Telephone:Other
InternetAccess
Services
Travel\Vacations
Banks BusinessOpportunities\
Work-At-HomePlans
18%
8%
5% 5%4%
4% 3%2% 2%
Top Products or Services for Econsumer ComplaintsCalendar Years 2012 through 2014
2Percentages are based on the total number of econsumer complaints reported in each time period: CY-2012 = 22,569; CY-2013 = 23,436; and CY-2014 = 17,793.
1Percentages are based on the 17,793 econsumer complaints received from January 1 to December 31, 2014.
Complaints Percentages2 Complaints Percentages2 Complaints Percentages2
Shop-at-Home\Catalog Sales 3,758 16.7% 3,459 14.8% 3,281 18.4%Computers: Equipment\Software 1,397 6.2% 1,545 6.6% 1,372 7.7%Credit Cards 1,299 5.8% 1,072 4.6% 925 5.2%Internet Auction 1,171 5.2% 1,575 6.7% 894 5.0%Telephone: Other 941 4.2% 922 3.9% 774 4.4%Internet Access Services 730 3.2% 805 3.4% 628 3.5%Travel\Vacations 504 2.2% 517 2.2% 539 3.0%Banks 779 3.5% 627 2.7% 429 2.4%Business Opportunities\Work-At-Home Plans 361 1.6% 478 2.0% 383 2.2%Timeshare Sales 759 3.4% 435 1.9% 349 2.0%Cars 378 1.7% 417 1.8% 339 1.9%Health Care: Other Products\Supplies 490 2.2% 614 2.6% 337 1.9%Invest: Other 190 0.8% 265 1.1% 298 1.7%Jewelry\Watches 382 1.7% 608 2.6% 296 1.7%
Product or Service
CY-2012 CY-2013 CY-2014
Federal Trade Commission Page 40 of 45 Released June 2015

Merchandise or Service Never Received
18%
Failure to HonorRefund Policy
13%
Other Misrepresentation 11%
Cannot Contact Merchant10%
Defective\Poor Quality
8%
Unauthorized Use of Identity/Account
Information6%
Billed for Unordered Merchandise or Service
4%
Failure to Honor Warranty or Guarantee
3%
Merchandise or Service Not in Conformity with Order
3%
Merchandise or Service Received Late
2%
Other22%
Top Alleged Law Violations for Econsumer Complaints1
January 1 – December 31, 2014
1Percentages are based on the 23,608 econsumer law violations reported from January 1 to December 31, 2014. One complaint may have multiple law violations.
Top Alleged Law Violations for Econsumer Complaints Calendar Years 2012 through 2014
2Number of complaints reporting each alleged econsumer law violation in each time period. The total number of law violations are more than the number of complaints reported in each time period because one complaint may have multiple law violations. The total number of econsumer complaints reported in each time period are: CY-2012 = 22,569; CY-2013 = 23,436; and CY-2014 = 17,793. 3Percentages are based on the total number of alleged econsumer law violations reported in each time period: CY-2012 = 28,750; CY-2013 = 29,621; and CY-2014 = 23,608. One complaint may have multiple law violations.
Complaints2 Percentages3 Complaints2 Percentages3 Complaints2 Percentages3
Merchandise or Service Never Received 4,166 14.5% 4,864 16.4% 4,206 17.8%Failure to Honor Refund Policy 2,863 10.0% 3,248 11.0% 3,111 13.2%Other Misrepresentation 5,158 17.9% 5,691 19.2% 2,568 10.9%Cannot Contact Merchant 2,268 7.9% 2,435 8.2% 2,360 10.0%Defective/Poor Quality 2,001 7.0% 1,886 6.4% 1,852 7.8%Unauthorized Use of Identity/Account Information 1,402 4.9% 1,200 4.1% 1,297 5.5%Billed for Unordered Merchandise or Service 1,261 4.4% 1,088 3.7% 967 4.1%Failure to Honor Warranty or Guarantee 785 2.7% 830 2.8% 794 3.4%Merchandise or Service Not in Conformity with Order 844 2.9% 822 2.8% 788 3.3%Merchandise or Service Received Late 545 1.9% 649 2.2% 542 2.3%
Law Violation
CY-2012 CY-2013 CY-2014
Federal Trade Commission Page 41 of 45 Released June 2015

The Consumer Sentinel Network is a free, online database of consumer complaints available only to law enforcement. It includes complaints about identity theft, fraud, financial transactions, debt collection, and credit reports, among other subjects. The Consumer Sentinel Network is based on the premise that sharing information can make law enforcement even more effective. To that end, the Consumer Sentinel Network provides law enforcement members with access to consumer complaints provided directly to the FTC, as well as to complaints shared by other data contributors.
Econsumer.gov was created in April 2001 to gather and share cross-border e-commerce complaints to respond to the challenges of multinational Internet fraud, and enhance consumer confidence in e-commerce. Through econsumer.gov, consumers can file cross-border consumer complaints online and learn about alternative ways to resolve them. All information is available in English, French, German, Japanese, Korean, Polish, Spanish, and Turkish. Using the existing Consumer Sentinel Network, the incoming complaints are shared through the government website. In 2014, consumer protection law enforcers from 32 nations participated in the econsumer.gov network.
The Identity Theft Data Clearinghouse was launched in November 1999 and is the sole national repository of consumer complaints about identity theft. The Clearinghouse provides specific investigative material for law enforcement and broader reports that provide insight to both private and public sector partners on ways to reduce the incidence of identity theft. Information in the Clearinghouse is available to law enforcement members via the Consumer Sentinel Network. This access enables law enforcers to readily spot local identity theft problems and to coordinate with other law enforcement officers where the data reveals common schemes or perpetrators.
www.econsumer.gov
Appendix A1: The Consumer Sentinel Network
www.FTC.gov/idtheft
www.FTC.gov/Sentinel
Federal Trade Commission Page 42 of 45 Released June 2015

Appendix A2: Consumer Sentinel Network Major Data Contributors1
January 1 – December 31, 2014
1Percentages are based on the total number of Consumer Sentinel Network complaints (2,582,851) received between January 1 and December 31, 2014. The type of complaints provided by the organization is indicated in parentheses.
2For a list of Better Business Bureaus contributing to the Consumer Sentinel Network, see Appendix A4.
Federal Trade Commission Page 43 of 45 Released June 2015
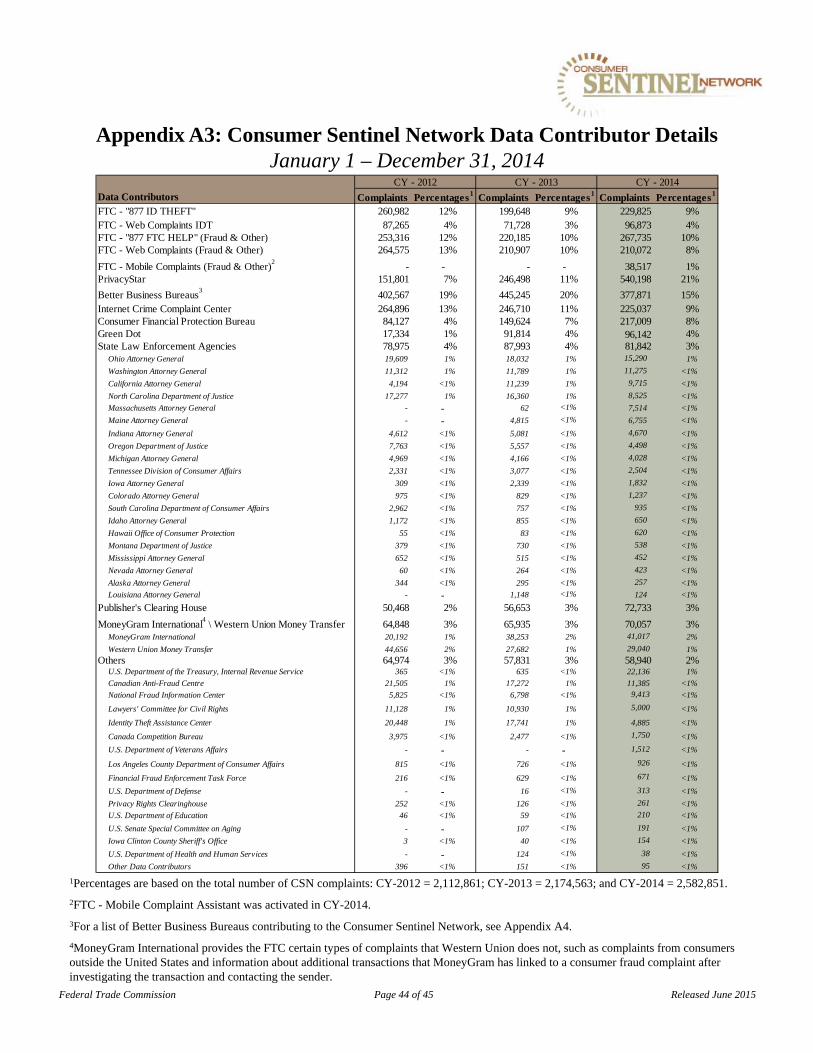
Appendix A3: Consumer Sentinel Network Data Contributor DetailsJanuary 1 – December 31, 2014
1Percentages are based on the total number of CSN complaints: CY-2012 = 2,112,861; CY-2013 = 2,174,563; and CY-2014 = 2,582,851.
2FTC - Mobile Complaint Assistant was activated in CY-2014.
3For a list of Better Business Bureaus contributing to the Consumer Sentinel Network, see Appendix A4.
4MoneyGram International provides the FTC certain types of complaints that Western Union does not, such as complaints from consumers outside the United States and information about additional transactions that MoneyGram has linked to a consumer fraud complaint after investigating the transaction and contacting the sender.
Complaints Percentages1 Complaints Percentages1 Complaints Percentages1
FTC - "877 ID THEFT" 260,982 12% 199,648 9% 229,825 9%FTC - Web Complaints IDT 87,265 4% 71,728 3% 96,873 4%FTC - "877 FTC HELP" (Fraud & Other) 253,316 12% 220,185 10% 267,735 10%FTC - Web Complaints (Fraud & Other) 264,575 13% 210,907 10% 210,072 8%
FTC - Mobile Complaints (Fraud & Other)2
- - - - 38,517 1%PrivacyStar 151,801 7% 246,498 11% 540,198 21%
Better Business Bureaus3
402,567 19% 445,245 20% 377,871 15%Internet Crime Complaint Center 264,896 13% 246,710 11% 225,037 9%Consumer Financial Protection Bureau 84,127 4% 149,624 7% 217,009 8%Green Dot 17,334 1% 91,814 4% 96,142 4%State Law Enforcement Agencies 78,975 4% 87,993 4% 81,842 3% Ohio Attorney General 19,609 1% 18,032 1% 15,290 1%
Washington Attorney General 11,312 1% 11,789 1% 11,275 <1%
California Attorney General 4,194 <1% 11,239 1% 9,715 <1%
North Carolina Department of Justice 17,277 1% 16,360 1% 8,525 <1%
Massachusetts Attorney General - - 62 <1% 7,514 <1%
Maine Attorney General - - 4,815 <1% 6,755 <1%
Indiana Attorney General 4,612 <1% 5,081 <1% 4,670 <1%
Oregon Department of Justice 7,763 <1% 5,557 <1% 4,498 <1%
Michigan Attorney General 4,969 <1% 4,166 <1% 4,028 <1%
Tennessee Division of Consumer Affairs 2,331 <1% 3,077 <1% 2,504 <1%
Iowa Attorney General 309 <1% 2,339 <1% 1,832 <1%
Colorado Attorney General 975 <1% 829 <1% 1,237 <1%
South Carolina Department of Consumer Affairs 2,962 <1% 757 <1% 935 <1%
Idaho Attorney General 1,172 <1% 855 <1% 650 <1%
Hawaii Office of Consumer Protection 55 <1% 83 <1% 620 <1%
Montana Department of Justice 379 <1% 730 <1% 538 <1%
Mississippi Attorney General 652 <1% 515 <1% 452 <1%
Nevada Attorney General 60 <1% 264 <1% 423 <1%
Alaska Attorney General 344 <1% 295 <1% 257 <1%
Louisiana Attorney General - - 1,148 <1% 124 <1%
Publisher's Clearing House 50,468 2% 56,653 3% 72,733 3%
MoneyGram International4 \ Western Union Money Transfer 64,848 3% 65,935 3% 70,057 3%
MoneyGram International 20,192 1% 38,253 2% 41,017 2%
Western Union Money Transfer 44,656 2% 27,682 1% 29,040 1%
Others 64,974 3% 57,831 3% 58,940 2% U.S. Department of the Treasury, Internal Revenue Service 365 <1% 635 <1% 22,136 1%
Canadian Anti-Fraud Centre 21,505 1% 17,272 1% 11,385 <1%
National Fraud Information Center 5,825 <1% 6,798 <1% 9,413 <1%
Lawyers' Committee for Civil Rights 11,128 1% 10,930 1% 5,000 <1%
Identity Theft Assistance Center 20,448 1% 17,741 1% 4,885 <1%
Canada Competition Bureau 3,975 <1% 2,477 <1% 1,750 <1%
U.S. Department of Veterans Affairs - - - - 1,512 <1%
Los Angeles County Department of Consumer Affairs 815 <1% 726 <1% 926 <1%
Financial Fraud Enforcement Task Force 216 <1% 629 <1% 671 <1%
U.S. Department of Defense - - 16 <1% 313 <1%
Privacy Rights Clearinghouse 252 <1% 126 <1% 261 <1%
U.S. Department of Education 46 <1% 59 <1% 210 <1%
U.S. Senate Special Committee on Aging - - 107 <1% 191 <1%
Iowa Clinton County Sheriff's Office 3 <1% 40 <1% 154 <1%
U.S. Department of Health and Human Services - - 124 <1% 38 <1%
Other Data Contributors 396 <1% 151 <1% 95 <1%
Data Contributors
CY - 2012 CY - 2013 CY - 2014
Federal Trade Commission Page 44 of 45 Released June 2015

Appendix A4: Consumer Sentinel NetworkBetter Business Bureau Data Contributors
January 1 – December 31, 2014
Federal Trade Commission Page 45 of 45 Released June 2015
Alabama, Birmingham Kentucky, Lexington Ohio, ToledoAlabama, Huntsville Kentucky, Louisville Ohio, YoungstownAlabama, Mobile Louisiana, Baton Rouge Oklahoma, Oklahoma CityAlberta, Calgary (Canada) Louisiana, Lafayette (Acadiana) Oklahoma, TulsaAlberta, Edmonton (Canada) Louisiana, Lake Charles Ontario, London (Canada)Arizona, Phoenix Louisiana, Monroe Ontario, Ottawa (Canada)Arizona, Tucson Louisiana, New Orleans Pennsylvania, PittsburghArkansas, Little Rock Louisiana, Shreveport Saskatchewan, Regina (Canada)British Columbia, Vancouver (Canada) Manitoba, Winnipeg (Canada) South Carolina, ColumbiaBritish Columbia, Victoria (Canada) Maryland, Baltimore South Carolina, GreenvilleCalifornia, Fresno Massachusetts, Boston South Carolina, Myrtle BeachCalifornia, Oakland Massachusetts, Worchester Tennessee, ChattanoogaCalifornia, Sacramento Michigan, Detroit (Eastern) Tennessee, KnoxvilleCalifornia, San Diego Michigan, Grand Rapids Tennessee, MemphisCalifornia, San Jose (Silicon Valley) Minnesota, Saint Paul Tennessee, NashvilleCalifornia, Santa Ana (Orange County) Mississippi, Jackson Texas, AbileneCalifornia, Santa Barbara (Tri-Counties) Missouri, Kansas City Texas, AmarilloColorado, Colorado Springs Missouri, Saint Louis Texas, AustinColorado, Denver Missouri, Springfield Texas, BeaumontColorado, Fort Collins Nebraska, Omaha Texas, Brazos Valley (Bryan)Connecticut, Wallingford Nevada, Las Vegas Texas, DallasDelaware, Wilmington Nevada, Reno Texas, El PasoDistrict of Columbia, Washington New Hampshire, Concord Texas, Fort WorthFlorida, Clearwater New Jersey, Trenton Texas, HoustonFlorida, Jacksonville (Northeast Florida) New Mexico, Albuquerque Texas, Lubbock (South Plains)Florida, Orlando New York, Buffalo Texas, San AngeloFlorida, Pensacola New York, New York City Texas, TylerFlorida, West Palm Beach North Carolina, Asheville Texas, Wichita FallsGeorgia, Atlanta, Athens and Northeast Georgia North Carolina, Charlotte Utah, Salt Lake CityGeorgia, Columbus North Carolina, Greensboro Virginia, NorfolkGeorgia, Macon North Carolina, Raleigh Virginia, RichmondHawaii, Honolulu North Carolina, Winston-Salem Virginia, RoanokeIdaho, Boise Nova Scotia, Halifax (Canada) Washington, DuPont Illinois, Chicago Ohio, Akron Washington, SpokaneIllinois, Peoria Ohio, Canton Wisconsin, MilwaukeeIndiana, Evansville Ohio, CincinnatiIndiana, Fort Wayne Ohio, ClevelandIndiana, Indianapolis Ohio, ColumbusIowa, Des Moines Ohio, Dayton