International Congress ‘14 (IntCongress 2014) 2014 Proceedings.pdf · International Congress...
183
International Congress ‘14 (IntCongress 2014) Association of Scientists, Developers and Faculties www.asdf.res.in Association of Scientists, Developers and Faculties Proceedings of the combined volumes of International Congress (IntCongress 2014) held at Holiday Inn Silom, Bangkok, Kingdom of Thailand between 19th November, 2014 and 21st November, 2014. ISBN : 978-81-929742-3-1
Transcript of International Congress ‘14 (IntCongress 2014) 2014 Proceedings.pdf · International Congress...

International Congress ‘14
(IntCongress 2014)
A s s o c i a t i o n o f S c i e n t i s t s ,
D e v e l o p e r s a n d F a c u l t i e s
w w w . a s d f . r e s . i n
Association of Scientists,
Developers and Faculties Proceedings of the combined volumes of International
Congress (IntCongress 2014) held at Holiday Inn Silom,
Bangkok, Kingdom of Thailand between 19th November,
2014 and 21st November, 2014.
ISBN : 978-81-929742-3-1

International Congress 2014
IntCongress 2014


International Congress 2014
Volume 1
By
Association of Scientists, Developers and Faculties, Thailand Chapter
Financially Sponsored By
Association of Scientists, Developers and Faculties, India
Conjunction of 44 Conferences
19 – 21, November 2014
Holiday Inn Silom, Bangkok, Kingdom of Thailand
Editor-in-Chief
Anbuoli P, Kokula Krishna Hari K, Saikishore E
Editors:
Rajkumar Sugumaran, Kemplong Municief, Long CAI

Published by
Association of Scientists, Developers and Faculties
Address: RMZ Millennia Business Park, Campus 4B, Phase II, 6th Floor, No. 143, Dr. MGR Salai,
Kandanchavady, Perungudi, Chennai – 600 096, India.
Email: [email protected] || www.asdf.org.in
International Congress (IntCongress 2014)
VOLUME 1
Editor-in-Chief: Anbuoli P, Kokula Krishna Hari K, Saikishore E
Editors: Rajkumar Sugumaran, Kemplong Municief, Long CAI
Copyright © 2014 IntCongress 2014 Organizers. All rights Reserved
This book, or parts thereof, may not be reproduced in any form or by any means, electronic or mechanical, including
photocopying, recording or any information storage and retrieval system now known or to be invented, without
written permission from the IntCongress 2014 Organizers or the Publisher.
Disclaimer:
No responsibility is assumed by the IntCongress 2014 Organizers/Publisher for any injury and/ or damage to persons
or property as a matter of products liability, negligence or otherwise, or from any use or operation of any methods,
products or ideas contained in the material herein. Contents, used in the papers and how it is submitted and approved
by the contributors after changes in the formatting. Whilst every attempt made to ensure that all aspects of the paper
are uniform in style, the IntCongress 2014 Organizers, Publisher or the Editor(s) will not be responsible whatsoever
for the accuracy, correctness or representation of any statements or documents presented in the papers.
ISBN-13: 978-81-929742-3-1
ISBN-10: 81-929742-3-5

PREFACE
Welcome to the International Congress (IntCongress 2014) 2014 in Holiday Inn Silom, Bangkok,
Kingdom of Thailand on 19 – 21 November, 2014. If this is your first time to Bangkok, you need
to look on more objects which you could never forget in your lifetime. There is much to see and
experience. We also hope you join in engaging conversations about different areas in all sectors
of the field.
The day modernization makes a clear view about the dramatic changes in the terms of par
excellence created in each and every lifestyle. The concrete structure is difficult to be laid on the
account of various developments that are happening every moment. In this present scenario
managing the data and integrity of the same is a biggest question. The management of data is not
having the data into the hard disk and putting the hard disk into administrator’s pocket, instead
protecting them from the vulnerable external sources ensuring a higher ability of accessing the
said data by the right people.
Multiple areas have contributed to make this International Congress in a highly sophisticated
manner exhibiting a clear view and ability of team management. After reviewing thousands of
paper the 44 chairs of the congress have done remarkable achievements.
We invite you to join us in this inspiring conversation.
Finally, I thank my family, friends, students and colleagues for their constant encouragement and
support for making this type of conference.
-- Anbuoli P, Kokula Krishna Hari K & Saikishore E
Editor-in-Chief

Co-Editors
• A Baskar, Amrita University, India
• Albert Alexander, Kongu Engineering College, India
• Aruna Anil Deoskar, ATSS College of Business Studies and Computer Applications
• Asha Shripad Ambhaikar, Rungta College of Engineering & Technology, Bhilai, India
• A S N Chakravarthy, Jawaharlal Nehru Technological University, India
• Balachandran Arumugam, Amrita University, India
• C. V. Jayakumar, Sri Sai Ram Engineering College, India
• D. Balasubramanian, GKM College of Engineering and Technology, India
• Dimitrios Efstathiou, Technological and Educational Institute of Central Macedonia Serres
• Ela Kumar, Gautam Buddha University, India
• G. Gunasekaran, Meenakshi College Of Engineering, India
• G Ganesan, Adikavi Nannaya University, India
• Hari Mohan Pandey, Amity University, India
• Indra Gandhi Raman, GKM College of Engineering and Technology, India
• Ion Tutanescu, University of Pitesti, Romania
• Jai Vighneshwar, Robert Bosch Engineering and Business Solutions Ltd, India
• JBV Subrahmanyam, Christu Jyoti Institute of Technology & Science(CJITS), Jangaon, India
• Jeya Mala D, Thiagarajar College of Engineering, India
• K. O. Joseph, GKM College of Engineering and Technology, India
• K. Maran, Sri Sairam Institute of Management Studies, India
• Mahalakshmi Raman, GKM Group of Educational Institutions, Chennai, India
• M. Chandrasekaran, Government College of Engineering, Bargur, India
• M Selvam, Bharathidasan University, India
• N.B. Geetha, GKM College of Engineering and Technology, India
• N. Gunasekaran, SNS College of Engineering, India
• N. Ramaraj, Thangavelu College of Engineering and Technology, India
• Ritwik M, Amrita University, Coimbatore
• R. S. Sudhakar, Research Scientists, IM Laboratories, Japan
• Subramaniam Ganesan, Oakland University, Rochester, MI 48309, USA
• Subashri V, SW Engineer and Author, India

• Sudakar P, M Kumarasamy College of Engineering, India
• Sundaram RMD, WIPRO Technologies, United States of America
• Sunandhini, India
• Sundaram RMD, WIPRO Technologies, United States of America
• S Geetha, VIT University , India
• Shriram Kris Vasudevan, Amrita University, India
• TP Rajendran, ADG, ICAR, India
• T. Rajendran, Chettinad College of Engineering and Technology, India
• Uma N. Dulhare, Muffakham Jah College of Engineering and Technology, India
• Vikrant Bhateja, SRM GPC, Lucknow, India

TECHNICAL REVIEWERS
• A S N Chakravarthy, JNTUK University College of Engineering, Vizianagaram, India
• Abdelghani Bellaachia, George Washington University, United States
• Abdeslam Jakimi, My Ismail University
• Abhishek Shukla, R. D. Engineering College, India
• Adethya Sudarsanan, Cognizant Technology Solutions, India
• Ahmed Salem, Old Dominion University, United States
• Ainuddin, University of Malaya, Malaysia
• Aissa Manallah, Institute of Optics and Precision Mechanics, Algeria
• Ajay Chakravarthy, University of Southampton, United Kingdom
• Alejandro Peña-Ayala, WOLNM - IPN, Mexico
• Ali Khalfallah, Sfax High Institute of Electronics and Communication, Tunisia
• Amin Daneshmand Malayeri, Dutch Academy of Management, Iran
• Amir Hajjam El Hassani, University Of Technology Belfort-Montbeliard, France
• Amit Chauhan, Babaria Institute of Technology, Vadora, India
• Angelina Geetha, B S Abdur Rahman University, Chennai
• Anirban Mitra, MITS Rayagada, India
• Annie Ibrahim, Telecommunication Software and Systems Group, Ireland
• Aramudhan M, PKIET, Karaikal, India
• Arivazhagan S, Mepco Schlenk Engineering College, India
• Arokiasamy A, Principal, ARJ College of Engineering and Technology, India
• Aroop Mukherjee, Professor, Universiti Putra Malaysia, Malaysia
• Arul Lawrence Selvakumar A, Director, India
• Aruna Deoskar, ATSS College of Business Studies and Computer Applications, Pune,
India
• Asha Ambhaikar, Rungta College of Engineering and Technology, Bhilai
• Ashish Chaurasia, Gyan Ganga Institute of Technology & Sciences, Jabalpur, India
• Ashish Rastogi, Higher college of Technology - MUSCAT, Oman
• Ashok Kumar, PSG College of Technology, India
• Ashutosh Kumar Dubey, Trinity Institute of Technology & Research, India
• Assem Moussa, Egypt Airlines, Egypt
• Aswatha Mattur, K S School of Engineering and Management, India
• Ata Elahi, Southern Connecticut State University, United States of America

• Avadhani P S, Andhra University, India
• B K Murthy, Department of Information and Technology - GoI, India
• B Veera Jyothi, Chaitanya Bharathi Institute of Technology, India
• Balachandran A, Amrita University, India
• Balasubramanie Palanisamy, Kongu Engineering College, India
• Belur V. Dasarathy, Editor-in-Chief, Information Fusion
• Berk Canberk, Istanbul Technical University, Turkey
• Bhavana Gupta, All Saints College of Technology, India
• Bing Shi, University of Southampton, UK
• Bouhadada Thahar, Badji Mokhtar Universtiy of Annaba, Algeria
• Carlos Silva Cardenas, Pontificia Universidad Católica del Perú, Peru
• Célia Martinie, University Paul Sabatier - Toulouse III, France
• Chamin Morikawa, Motion Portrait Inc., Japan
• ChandraMohan P, Director, Professional Group of Institutions, India
• Chandrasekaran M, Government College of Engineering, Salem, India
• Chandrasekaran S, Kumaraguru College of Technology, Coimbatore, India
• Chaudhari A L, University of Pune, India
• Ching-Hsien Hsu, Chung Hua University, Taiwan
• Chitra Krishnamoorthy, St Josephs College of Engineering and Technology, India
• Chokri BEN AMAR, National Engineering School of Sfax, University of Sfax, Tunisia
• Chokri Ben Amar, University of Sfax, Tunisia
• Christian Esteve Rothenberg, CPqD (Telecom Research Center), Brazil
• Christos Chrysoulas, Technological Educational Institute of Patras, Greece
• Chun-Chieh Huang, Minghsin University of Science and Technology, Taiwan
• Constantin Filote, Stefan cel Mare University of Suceava, Romania
• Cristian-Gyozo Haba, Gheorghe Asachi Technical University of Iasi, Romania
• Darshan M Golla, Andhra University, India
• Deepak Rawat, Amrapali Group Of Institute, India
• Derkaoui Orkia, Algeria
• Dev Audsin, France Telecom R & D / Orange, United Kingdom
• Dianne Murray, British Computer Society, Great Britain
• Dimitrios Efstathiou, Technological Educational Institute of Central Macedonia, Serres,
Greece
• Dinesh Kumar Saini, Sohar University Oman

• Dominique Archambault, Université Paris 8, France
• Dumitru Popescu, University Politehnica of Bucarest, Romania
• Ela Kumar, Dean, Gautam Buddha University, India
• Elvinia Riccobene, University of Milan, Italy
• EPPIES BABURAJ, SUN COLLEGE OF ENGINEERING AND TECHNOLOGY, India
• Essa, Tikrit University, Iraq
• Fazidah Othman, University of Malaya, Malaysia
• Fulvio Frati, University of Milan, Italy
• G Jeyakumar, Amrita School of Engineering, India
• Ganesan G, Adikavi Nannaya University, India
• Ganesh Neelakanta Iyer, Progress Software Development, India
• Gayathri Jayapal, Bharathidasan University, India
• Geetharamani R, Associate Professor, Department of Information Science and
Technology, Anna University, Chennai, India
• Gemikonakli O, Middlesex University, UK
• Ghassemlooy Z, Associate Dean, Northumbria University, UK
• Gregorio Martinez Perez, Professor, University of Murcia, Spain
• Gunatharan Barani, Anna University Regional Centre, Coimbatore, India
• Gurudatt Kulkarni, Marathwada Mitra Mandal's Polytechnic, Pune, India
• Hamid Abdulla, University of Malaya, Malaysia
• Hanumantha Reddy T, Rao Bahadur Y Mahabaleswarappa Engineerng College, Bellary,
India
• Hari Mohan Pandey, Middle East College, Muscat, Oman
• Helge Langseth, Professor, Norwegian University of Science and Technology, Norway
• Hussein Abdulmuttalib, Dubai Municipality, Dubai
• Indra Gandhi Raman, GKM Group of Educational Institutions, India
• Inese Barbare, Univeristy of Latvia, Latvia
• Ing. David Luigi FUSCHI, Bridging Consulting Ltd, United Kingdom
• Ion Tutanescu, University of Pitesti, Romania
• J Karthikeyan, Velammal College of Engineering and Technology, India
• Jaime Lloret, Universidad Politecnica de Valencia, Spain
• Jeya Mala D, Thiagarajar College of Engineering, India
• Jia Uddin JU, University of Ulsan, South Korea
• Jinjun Chen, Professor, University of Technology Sydney, Australia

• Joel Rodrigues, Professor, Instituto de Telecomunicações, University of Beira Interior,
Portugal
• John Sanjeev Kumar A, Thiagarajar College of Engineering, India
• Joseph M, Mother Terasa College of Engineering & Technology, India
• K Maran, Director, Sairam Institute of Management Studies, India
• K N Rao, Andhra University, India
• Kachwala T, NMIMS University, India
• Kannan Balasubramanian, Mepco Schlenk Engineering College, India
• Kannan N, Jayaram College of Engineering and Technology, Trichy, India
• Kasturi Dewi Varathan, University of Malaya, Malaysia
• Kavita Singh, University of Delhi, India
• Kiran Kumari Patil, Reva Institute of Technology and Management, Bangalore, India
• Krishnamachar Sreenivasan, Indian Institute of Technology Ropar, India
• Kumar D, Periyar Maniammai University, Thanjavur, India
• Lain-Chyr Hwang, I-Shou University, Taiwan
• Lajos Hanzo, Chair of Telecommunications, University of Southampton, UK
• Loganathan D, Professor, Pondicherry Engineering College, India
• Longbing Cao, University of Technology, Sydney
• Lugmayr Artur, Texas State University, United States
• M HariHaraSudhan, Pondicherry University, India
• M Thanga Mani, Kongu Engineering College, India
• M. Ayaz Ahmad, University of Tabuk, Saudi Arabia
• M. C. Schraefel
• Maaruf Ali, University of Hail, KSA
• Maheswaran R, Mepco Schlenk Engineering College, India
• Manju Lata Agarwal, University of Delhi, India
• Manuela Aparicio, Professor, ISCTE-IUL, Lisboa, Portugal
• Marcin Paprzycki, Professor, Systems Research Institute of the Polish Academy of
Sciences, Poland
• Mazliza Othman, University of Malaya, Malaysia
• Mehdi Asadi, Islamic Azad University, Iran
• Michael Joseph, St.Joseph's College of Engineering and Technology, India
• Mohamed Ali Kaafar MAK, National ICT Australia, Inria France, Australia
• Mohamed Moussaoui, ENSA Tangier, Abdelmalek Essaadi University, Morocco

• Mohammad M Banat, Jordan University of Science and Technology
• Mohammad Siam, Isra University (IU), Jordan
• Mohsen Tabejamaat, Islamic Azad University, Iran
• Moni S, National Informatics Centre - GoI, India
• Mónica Aguilar Igartua, Universitat Politècnica de Catalunya, Spain
• Mostafa Uddin, Old Dominion University, United States
• Muhammad Javed, Wayne State University, Detroit, Michigan, USA
• Mukesh D. Patil, Indian Institute of Technology, Mumbai, India
• Muthu Ramachandran, Leeds Metropolitan University, UK
• Nagarajan S K, Annamalai University, India
• Nallusamy R, Nandha College of Technology, India
• Nayan Jobanputra, Saurashtra University, India
• Neelanarayanan Venkataraman, VIT University, Chennai, India
• Nilanjan Chattopadhyay, S P Jain Institute of Management & Research, Mumbai, India
• Niloy Ganguly, IIT-KG, India
• Noreen Imran, Auckland University of Technology, New Zealand
• Nornazlita Hussin, University of Malaya, Malaysia
• P Chandrasekar, Dean, Professional Group of Institutions, India
• Panchanatham N, Annamalai University, India
• Parvatha Varthini B, St Joseph’s College of Engineering, India
• Parveen Begam, MAM College of Engineering and Technology, Trichy
• Pascal Hitzler, Wright State University, Dayton, US
• Pascal LORENZ, Director, University of Haute Alsace, France
• Peter Neema-Abooki, Dean, East African School of Higher Education Studies and
Development (EASHESD), Uganda
• Pijush Kanti Bhattacharjee, Assam University, Assam, India
• Ponnammal Natarajan, Rajalakshmi Engineering College, Chennai, India
• Poorna Balakrishnan, Principal, SSS Jain College for Women, India
• Prabu Dorairaj, NetApp Inc., India
• Pradeep Tomar, Professor, Gautam Buddha University, India
• Pradip Kumar Bala, IIT, Roorkee
• Prasanna N, TMG College, India
• Prem Shankar Goel, Chairman - RAE, DRDO-GoI, India
• Priyesh Kanungo, Patel Group of Institutions, India

• R K Nair, Former CEO, TechnoPark, India
• R M Suresh, Principal, Jerusalem Engineering College, India
• R Mahalakshmi, Dean, GKM Group of Educational Institutions
• Radha S, SSN College of Engineering, Chennai, India
• Radhakrishnan V, Mookamibigai College of Engineering, India
• Rahim KACIMI, University of Toulouse, France
• Rahul Tyagi, Lucideus Tech Private Limited, India
• Raja K, Alpha College of Engineering, India
• Rakesh Kumar Mishra, Feroze Gandhi Institute of Engineering and Technology, India
• Ram Shanmugam, Texas State University, United States
• Ramkumar Jaganathan, VLB Janakiammal College of Arts and Science, India
• Rao D H, Jain College of Engineering, India
• Ravichandran C G, Excel Engineering College, India
• Ravikant Swami, Arni University, India
• Raviraja S, University of Malaya, Malaysia
• Reza Gharoie Ahangar, Azad University, Iran
• Rishad A Shafik, University of Southampton, UK
• Ritwik M, Amrita Vishwa Vidyapeetham, India
• Rudra P. Pradhan, IIT-KGP, India
• Russell Beale, Director, HCI Research Centre, University of Birmingham
• Ryma Abassi, Higher Institute of Communication Studies, Tunisia
• S A V Satya Murty, Director, Indira Gandhi Centre for Atomic Research, India
• S Albert Alexander, Kongu Engineering College, India
• S Geetha, Thiagarajar College of Engineering, India
• S Khan, Kohat University of Science and Technology, Pakistan
• S Krishnakumar, DRDO, India
• S Purushothaman, ISRO, Bangalore, India
• Sahaaya Arul Mary S A, Jayaram College of Engineering & Technology, India
• Samarjeet Borah, Sikkim Manipal Institute of Technology, India
• Sana Ullah, King Saud University, Saudi Arabia
• Sanjay Chaudhary, DA-IICT, India
• Sanjay K Jain, University of Delhi, India
• Sanjeevikumar Padmanaban, NIT Karaikal, India
• Saraju P. Mohanty, Professor, University of North Texas, United States

• Satheesh Kumar KG, Dean & Chairperson, Asian School of Business, Trivandrum, India
• Sathiyabhama Balasubramaniam, Sona College of Technology, India
• Satyadhyan Chickerur, Professor B V Bhoomaraddi College of Engineering and
Technology, India
• Saurabh Dutta, Dr B C Roy Engineering College, Durgapur, India
• SEDDIK Hassene, ENSIT, Tunisia
• Senthil Arasu B, National Institute of Technology - Trichy, India
• Shanmugam A, SNS College of Technology, Coimbatore, India
• Sharon Pande, NMIMS University, India
• Sheila Anand, Rajalakshmi Engineering College, Chennai, India
• Shenbagaraj R, Mepco Schlenk Engineering College, India
• Shilpa Bhalerao, FCA Acropolis Institute of Technology and Research
• Shivaji Sinha, J.S.S. Academy of Technical Education, Noida
• Singaravel G, K. S. R. College of Engineering, India
• Sivakumar V J, National Institute of Technology - Trichy, India
• Sivasothy SHANMUGALINGAM, Institut Mines-Télécom, Télécom SudParis, France
• Sivasubramanian A, St Josephs College of Engineering and Technology, India
• Sreenivasa Reddy E, Acharya Nagarjuna University, India
• Sri Devi Ravana, University of Malaya, Malaysia
• Srinivasan A, MNM Jain Engineering College, Chennai
• Srinivasan K S , Turbomachinery Institute of Technology and Sciences, India
• Stefanos Gritzalis, University of the Aegean, Greece
• Stelvio Cimato, University of Milan, Italy
• Subash Chandra Bose J, Professional Group of Institutions, India
• Subramanian K, Director, IGNOU, India
• Sudakar P, M Kumarasamy College of Engineering, India
• Sundaram RMD, WIPRO Technologies, United States of America
• Sundeep Dhawan, National Physics Laboratory, GoI, India
• Sunil Chowdary, AMITY University, India
• Suresh G R, Easwari Engineering College, Chennai, India
• T Nalini, Bharath University, India
• Tulika Pandey, Department of Information and Technology - GoI, India
• U S Raghupathy, Kongu Engineering College, India
• Ubaid Abbasi, COMSATS Institute of Technology, Pakistan

• Uma N Dulhare, MJ College of Engineering and Technology, India
• Venkataramani Y, Director, Saranathan College of Engineering, India
• Verma R S, Joint Director, Department of Information and Technology - GoI, India
• Vicente Lucena, Federal University of Amazonas, Brazil
• Vijayalakshmi K, Mepco Schlenk Engineering College, India
• Vijayalakshmi S, Vellore Institute of Technology, India
• Vijyendra Niranjan, Price Waterhouse Coopers India Private Limited
• Vikrant Bhateja, Professor, SRM GPC, Lucknow, India
• Ville Luotonen, Senior Researcher, Hermia Limited, Spain
• Vimala Balakrishnan, University of Malaya, Malaysia
• Vishnuprasad Nagadevara, Indian Institute of Management - Bangalore, India
• Wang Wei, University of Nottingham, Malaysia
• Wei Wei, Xi'an University of Technology, China
• Yulei Wu, Chinese Academy of Sciences, China

Remarkable Dignitaries
Presidential Note : President P. Anbuoli, ASDF
Inaugural Note : Kokula Krishna Hari K, International Secretary, ASDF
Keynote 1 : Assem Moussa, Egypt Air, Egypt
Keynote 2 : Kokula Krishna Hari K, International Secretary, ASDF
Keynote 3 : Aruna Anil Deoskar, ATSS, India
Keynote 4 : M Selvam, Trichy, India
Keynote 5 : T Rajendiran, Chettinad College of Engineering and Technology, India
Keynote 6 : S Geetha, VIT University, India
Keynote 7 : N. Gunasekaran, SNS College of Engineering, India
Keynote 8 : M. Chandrasekaran, Government College of Engineering, Bargur, India
Keynote 9 : Jeya Mala D, Thiagarajar College of Engineering, India
Keynote 10: JBV Subrahmanyam, CJITS, Jangaon, India
Keynote 11: G. Gunasekaran, Meenakshi College Of Engineering, India
Keynote 12: Asha Shripad Ambhaikar, Rungta College of Engineering & Technology, Bhilai
Keynote 13: Uma N. Dulhare, Muffakham Jah College of Engineering and Technology, India

Table of Contents
Volume 01 Issue 01 Month November Year 2014
International Congress Full Papers
Titles & Authors Pages
Inter-Linkages, Co Movements and Causal Relationship among Emerging Stock Markets in Asia with Reference to Stock Exchange of Thailand by Lingaraja Kasilingam, Murugesan Selvam, Vasanth Vinayagamoorthi, Gayathri Mahalingam and Bennet Ebenezer
pp 01 – pp 09
A Study on CRM as a Sound Strategy for Banking Sector by Dr. P. Anbuoli, T. R.T hiruvenkatraj pp 10 – pp 15
A Study on Role of Micro Finance in Rural Women Development in Tamilnadu by Dr. P. Anbuoli pp 16 – pp 24
Facing Operational Work Issues Working Through E-Platforms in Textile Industries by T. R. Bhavani, Dr. P. Anbuoli, Dr. T. Jothimurugan
pp 25 – pp 30
Influence of Corporate Governance Practices on Firm Performance in India: A Study on Structural Equation Model Analysis by Karpagam Venkatraman, Murugesan Selvam & Raja Mariappan
pp 31 – pp 42
A Study on the Implications of NPA in PSB Banks with Reference to Home Loans by Dr. P. Anbuoli, P. Vijayalakshmi, Dr. A. C. Kannan pp 43 – pp 49
UAtilize: Interactive Visualization & Analysis of Campus Building Utilization by Suphanut Jamonnak, Bharani Anne, Nikhil Preeth, En Cheng pp 50 – pp 59
Children’s Luxury Brands: An Identity Construction Tool for Young Mothers? by Christel de Lassus, Virginie Silhouette-Dercourt pp 60 – pp 64
Rust Prevention in Structural Establishments using Cathodic Protection Technique Driven by an MPPT based Solar Charge Controller by Sai Shankar B, K P Pranav, Kiran Raj R, C V Jayakumar
pp 65 – pp 72
The Thermal Phenomena of the Supercritical CO2 in the Reservoir of the Enhanced Geothermal System based on Brinkman Model by David T.W. Lin, J.C. Hsieh, Y.C. Hu, C.H. Wei, and B.H. Lee
pp 73 – pp 79
Kinetics of Sodium Borohydride Hydrolysis on Cobalt with Different Structures by E. Norkus, L. Tamašauskaitė-Tamašiūnaitė, S. Lichušina, D. Šimkūnaitė, A. Žielienė, I. Stalnionienė, L. Naruškevičius, A. Selskis, B. Šimkūnaitė-Stanynienė
pp 80 – pp 83

Graphene Supported Platinum-Cobalt Nanoparticles as Anode Electrocatalyst for Direct Methanol Fuel Cell by V. Kepenienė, L. Tamašauskaitė-Tamašiūnaitė, J. Jablonskienė, M. Semaško, J. Vaičiūnienė, R. Kondrotas, E. Norkus
pp 84 – pp 89
Accuracy of Contemporary Parametric & Non Parametric Software Estimation Models: A Comparative Analysis by Dr. Aruna Deoskar, Jyoti Mokashi, Rinku Dulloo
pp 90 – pp 100
A Novel Algorithm to improve QoS for Heterogeneous Mobile Devices by A. Haja Alaudeen, Dr. E. Kirubakaran and Dr. D. Jeya Mala pp 101 – pp 108
Critical Components Identification for Effective Regression Testing by M. Ramalakshmi Praba, D. Jeya Mala pp 109 – pp 116
Utilizing Enterprise Architecture for More Effective Requirements Engineering by Ömer Korkut, Devrim Barış Acar, Erhan Keleş, Oral Gürel
pp 117 – pp 123
Solving Connectivity Issues in Wireless Sensor Networks using Anchor Nodes by Sumathi S, Dr. M. Chandrasekaran pp 124 – pp 131
Trust Metrics for Group Key Management in Malicious Wireless Networks by V.Bhuvaneswari, Dr. M. Chandrasekaran pp 132 – pp 142
Image Steganography Technique using Radon Transform and Neural Network with the Wavelet Transform by S. Thenmozhi, Dr. M. Chandrasekaran
pp 143 – pp 149
A New CSK Communication System With Display and Cameras by Atsuya Yokoi, Sangon Choi and Hiroki Mizuno pp 150 – pp 157

Inter-Linkages, Co Movements and Causal Relationship among Emerging Stock Markets in
Asia with Reference to Stock Exchange of Thailand
Lingaraja Kasilingam1, Murugesan Selvam2, Vasanth Vinayagamoorthi3, Gayathri Mahalingam4 and Bennet Ebenezer5
1, 3 & 4Ph.D Research Scholar, Department of Commerce and Financial Studies, Bharathidasan University, Tiruchirappalli, Tamil Nadu, India
2Professor and Head, Department of Commerce and Financial Studies, Bharathidasan University, Tiruchirappalli, Tamil Nadu, India
5Quality Assurance Department, Ministry of Manpower, Oman
Abstract: The study of Inter-Linkages, Co Movement and Causal Relationship among emerging stock market indices returns in Asia, has gained momentum. Asian stock markets attract huge inflows of portfolio investments which promote the economic development in the Continent. The favorable regulatory changes and technological advancement have brought about significant changes in the Asian emerging markets. The purpose of the paper is to study Inter Linkages, Co Movements and Causal Relationship among the emerging stock market returns in Asia. This study was based on secondary daily time series data for a period of 12 years from 1st January 2002 to 31st December 2013. Statistical tools like Descriptive Statistics, Correlation Matrix and Granger Causality Test were employed. Investors are increasingly interested in international diversification due to the emergence of liberalization of stock markets in recent years. The findings of this study would help the investors in making efficient investment decisions in the indices of emerging stock markets in Asia.
Keywords: Asian Emerging Stock Markets, Causal Relationship, Co Movements, Correlation Matrix, Descriptive Statistics, Granger Causality, Inter – Linkages, International Diversification.
1. Introduction
Foreign investors need better diversification for their portfolio in order to reap gains from their investment. Inter – Linkages, Co Movements and Causal Relationship are fertile areas for research because it could suggest better solutions to the foreign investors. Research in this area has been considered significant from the viewpoint of international portfolio diversification because cross – border acquisitions are witnessed in Asia also. Countries like China, Thailand and India, which till recently had limited trade and investment interests in majority of Asian countries, are expanding their economic ties with several countries in the region. Against this background, an attempt has been made in this study to examine inter-linkages, co-movements and causal relationship among emerging stock markets in Asia, with reference to Thailand Stock Exchange. Major aggressive reforms have been introduced in the emerging markets in the recent past (Eiji Fujii, 2005). Hence this study might facilitate comparison between the results of emerging markets in Asia (listed in Morgan Stanley Capital International index) in general and Thai Stock Market (SET index) in particular.
In May 1974, long-awaited legislation establishing, The Securities Exchange of Thailand (SET) was enacted. By 1975 the basic legislative framework was in place and on April 30, 1975, The Securities Exchange of Thailand officially started trading. On January 1, 1991, its name was formally changed to, The Stock Exchange of Thailand (SET). The Securities and Exchange Act of 1992 (SEA) has created the Securities and
ASDF Thailand Proceedings of the International Congress 2014 [IC 2014], Bangkok, Thailand 1
Int Congress 2014 ISBN : 978-81-929742-3-1 www.intcongress.com

Exchange Commission (SEC) as a single unified supervisory agency to be the regulator of the Thai Capital Market.
The SET Index is a composite market capitalization-weighted price index that compares the Current Market Value (CMV) of all listed common stocks with their market value on the base date of 30 April 1975 (Base Market Value or BMV), the date on which the stock market was established. The initial value of the SET index on the base date was set at 100 points. The formula for calculating the SET index is as follows (Phaisarn Sutheebanjard, 2010).
2. Review of Literature
Orawan Ratanapakorn and Subhash C. Sharma (2002) studied the short-term and long-term relationships in five regional stock indices (namely, USA – S&P 500 Index, European Index, Asian–Pacific index, Latin American index and Eastern European–Middle East index) during the pre-Asian Crisis (January 1, 1990 to December 31, 1996) and Asian Crisis (July 2, 1997 to March 10, 2000) periods. It was found that the US stock market was the most influential one among regional markets during the study period. Gong-meng Chen, et al (2002) investigated the behavior of stock prices in six major Latin American stock exchanges using univariate and multivariate approaches. The samples for this research were Brazil, Mexico, Chile, Argentina, Colombia and Venezuela markets. It was found that investing in various Latin American stock markets offered limited risk diversification until 1999. Eiji Fujii (2005) analyzed the causal linkages among several emerging stock markets (Hong Kong, Malaysia, Philippines and Thailand) in Asia and Latin America (Argentina, Brazil and Chile) using the daily observations from January 1, 1990 to November 14, 2001 of their stock indices. It was found that there were indeed considerable causal interactions across the emerging stock markets. Ming-Shiun Pan, et al (2007) demonstrated the dynamic linkages between the foreign exchange and stock markets of seven East Asian countries during the period from January 1988 to October 1998. The findings indicated that the linkages could vary across economies with respect to exchange rate regimes, the trade size, the degree of capital control, and the size of equity market. Selvam Murugesan et al (2007) discussed the dynamic behavior of stock index returns of sample markets of Asia Pacific countries - Japan, Hong Kong, India, Korea, China, Taiwan, Singapore, Malaysia, Thailand and Indonesia - during the period from January 2006 to December 2006. This study found evidence of time varying volatility, iclustering, high persistence and predictability for almost all the Asian market indices. They also examined the emerging markets except India and China, which exhibited low returns. Claudio Moranaa and Andrea Beltratti (2008) examined the linkages across stock markets from several perspectives (Germany, Japan, USA and UK) during the period from 1973 to 2004. Statistical tools like Conditional Correlations and Linkages between correlation and volatility were used. Evidence of strong linkages across markets, as measured by co movements in prices and returns and in volatility processes, was found. Leo Chan (2008) examined the change in the dynamic causal relationships between Hong Kong and US financial markets after the Hong Kong handover (and Asian Crisis) across spectral frequency band during the study period. It was found that there was relationship between country’s openness and capital market interactions. Lee K. Lim (2009) distinguished the dynamic interdependence and long-run relationships between the ASEAN-5 (Indonesia, Malaysia, the Philippines, Singapore and Thailand) stock markets during the period from 1990 to 2008. The convergence of all Association of Southeast Asian Nations’ (ASEAN-5) market indices was not supported, except for convergence in two pairs of ASEAN-5 markets over the sample period. Zeynel Abidin
Current Market Value X 100 SET Index = ----------------------------------------- Base Market Value
ASDF Thailand Proceedings of the International Congress 2014 [IC 2014], Bangkok, Thailand 2
Int Congress 2014 ISBN : 978-81-929742-3-1 www.intcongress.com

zdemira, Hasan Olgun and Bedriye Saracoglu (2009) analyzed the dynamic linkages between the equity markets of a center (the US) and in its emerging markets periphery during the period from 1st January, 1985 to 24th March 2006. This indicated that a kind of center - periphery relation existed in international stock markets. Shamila A. Jayasuriya (2011) investigated the inter linkages of stock return behavior between China and three of its emerging markets (Thailand, Indonesia and Philippines) in the East Asia and Pacific region during the study period from November 1993 to July 2008. It was found that a common group of investors actively trading in international equity markets might be a likely determinant of financial integration across markets. Chaker Aloui and Besma Hkiri (2014) estimated the short term and long term dependencies between stock market returns for the Gulf Cooperation Council (GCC) Countries (Bahrain, Kuwait, Oman, Qatar, Saudi Arabia, and the UAE) during the period from 2005 to 2010. It was found that statistical tools like Descriptive Statistics, Wavelet, wavelet squared Coherence Test, Unconditional cross correlation and VAR were used to determine the co-movement on both frequency and time and it co-movement depended strongly affected by the occurrence of financial crisis. Tomoe Moore and Ping Wang (2014) examined the determinants of the time-varying correlation between stock return differentials and real exchange rates for the six Asian emerging markets (Indonesia, Malaysia, South Korea, Philippines, Singapore and Thailand) and the four developed markets (Australia, Canada, Japan and the UK) during the period from January 1973 to December 2006. It was found that there was significant time-varying correlation between the two times series.
The present study takes a step ahead in the same direction. It is also an attempt to fill the time gap of researches on Inter – Linkage and Co Movements of seven emerging Asian stock markets and Thailand Stock Market.
3. Empirical Methodology
The assessment of linkage dynamics, co movements and causality of emerging markets within the Asian region, with empirically proven data, is useful for international portfolio managers in making asset allocation decision. The capital market reforms increased the participation of foreign investors in Asia on the basis of economic fundamentals of emerging markets in Asia. The main objective of this study is to examine the Inter – Linkages, Co Movement and Causal Relationship among the emerging stock markets (China, India, Indonesia, Korea, Malaysia, Philippines and Taiwan and Thailand) in Asia, with special reference to Thailand Stock Exchange. For the purpose of examining the dynamic linkages and co movement among sample stock indices of selected emerging markets in Asia, the study covered a period of 12 years from January 1, 2002 through December 31, 2013. The emerging equity market indices used in the study were Shanghai Stock Exchange Composite Index (China), NSE Nifty (India), Jakarta Composite Index (Indonesia), Kospi Index (Korea), KLSE (Malaysia), Philippine stock Index (Philippines), TSEC weighted Index (Taiwan) and SET Index (Thailand).
3.1. Movements of Emerging Markets with Thai SET index in Asia
In order to study the movements of indices, the line chart was used. The movements of Thailand SET index was compared with all the seven indices of emerging market indices namely, shanghai stock exchange composite index (China), NSE Nifty (India), Jakarta Composite Index (Indonesia), Kospi Index (Korea), KLSE (Malaysia), Philippine stock Index (Philippines), TSEC weighted Index (Taiwan) in Asia.
Figure 1 gives the movements for all the emerging eight indices of Asian stock markets during the study period. All the eight sample indices performed equally well from 2006 to 2010. From 2007-2008, all the sample indices moved down together due to the Global Financial Crisis of 2008. But from 2008 to 2013 period, all the eight emerging Asian market indices gradually increased their movement upward.
ASDF Thailand Proceedings of the International Congress 2014 [IC 2014], Bangkok, Thailand 3
Int Congress 2014 ISBN : 978-81-929742-3-1 www.intcongress.com
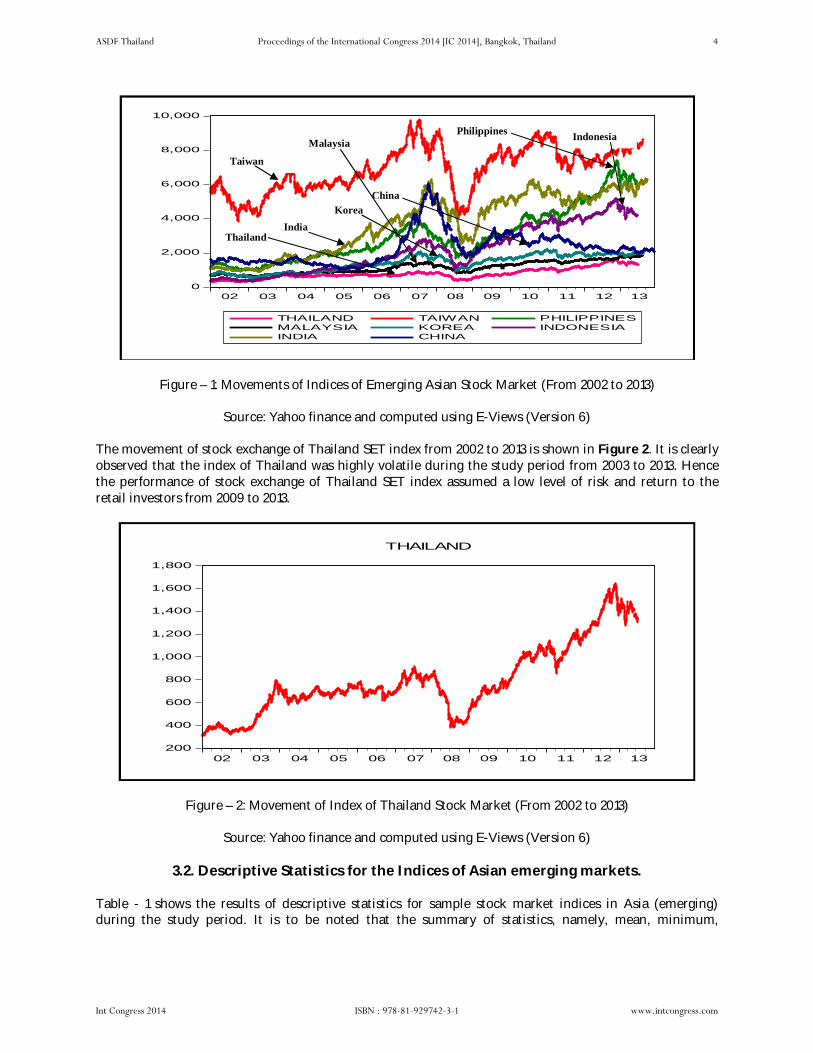
Figure – 1: Movements of Indices of Emerging Asian Stock Market (From 2002 to 2013)
Source: Yahoo finance and computed using E-Views (Version 6)
The movement of stock exchange of Thailand SET index from 2002 to 2013 is shown in Figure 2. It is clearly observed that the index of Thailand was highly volatile during the study period from 2003 to 2013. Hence the performance of stock exchange of Thailand SET index assumed a low level of risk and return to the retail investors from 2009 to 2013.
Figure – 2: Movement of Index of Thailand Stock Market (From 2002 to 2013)
Source: Yahoo finance and computed using E-Views (Version 6)
3.2. Descriptive Statistics for the Indices of Asian emerging markets.
Table - 1 shows the results of descriptive statistics for sample stock market indices in Asia (emerging) during the study period. It is to be noted that the summary of statistics, namely, mean, minimum,
0
2,000
4,000
6,000
8,000
10,000
02 03 04 05 06 07 08 09 10 11 12 13
THAILAND TAIWAN PHILIPPINESMALAYSIA KOREA INDONESIAINDIA CHINA
200
400
600
800
1,000
1,200
1,400
1,600
1,800
02 03 04 05 06 07 08 09 10 11 12 13
THAILAND
Taiwan
Thailand
Philippines Indonesia
China Korea
Malaysia
India
ASDF Thailand Proceedings of the International Congress 2014 [IC 2014], Bangkok, Thailand 4
Int Congress 2014 ISBN : 978-81-929742-3-1 www.intcongress.com

maximum, median, standard deviation (SD), skewness, kurtosis and the Jarque- Bera was used to analyse the sample indices return during the study period.
It is clear from the Table that during the study period, the Indonesia Stock Market (JKSE) earned high mean value of 0.000932, followed by Indian stock market (Nifty) with a value of 0.00072. These values were greater than that of other Asian sample indices. It is to be noted that the mean value for all the sample indices showed positive sign which indicated the fact that all the indices earned positive return during the study period. It is to be noted that two indices, namely, China (SSE) and Taiwan (TWII), recorded the lowest average daily mean returns, with values of 0.00021 and 0.000237, respectively. The mean returns of sample indices i.e. Philippines (0.00064) and Thailand (0.00059), Korea (0.000457) and Malaysia (0.000396) improved and came closer to Indonesia and India. In terms of market unpredictability, as measured by the standard deviation of daily returns, China recorded high risk value (0.015994), followed by India (0.015731), Korea (0.015032), Indonesia (0.01467), Thailand (0.013858), Taiwan (0.013582), Philippines (0.013314), and Malaysia (0.010726). This indicated the fact that there was high risk in respect of SSE Composite Index, S&P CNX Nifty, Jakarta Composite Index, Kospi Index, KLSE, Philippine stock Index, TSEC weighted Index and SET Index, which was useful for speculators but the investors had to carefully study the market risk and take studied investment decision of portfolio diversification. The analysis of skewness showed that the values for all sample indices, except India (0.025075) and Malaysia (1.905172), were negative. It is significant to note from the Table that all sample indices of emerging Asian markets earned values of kurtosis larger than three or high level fat-tails, which made it Leptokurtic. Besides, the Jarque-Bera (JB) values of the sample indices implied that all the sample indices were normally distributed. In other words, all the sample indices were less volatile during the study period. In short, the distribution of return data for all the sample indices was normal.
Table – 1: The Results of Descriptive Statistics for Emerging Asian Stock Market Indices Returns during the study period from 01-01-2002 to 30-12-2013
Emerging Asian Countries Descriptive Statistics
China
India
Indonesia
Korea
Malaysia
Philippines
Taiwan
Thailand
Mean 0.000210
0.00072
0.000932
0.000457
0.000396
0.00064
0.000237
0.00059
Median 0.000000
0.001202
0.001386
0.000946
0.000522
0.000587
0.00061
0.000841
Maximum 0.094549
0.177441
0.079215
0.119457
0.21970
0.098178
0.067422
0.111567
Minimum -0.08840
-0.122377
-0.103753
-0.105705
-0.175076
-0.122683
-0.066789
-0.148395
Std. Dev. 0.015994
0.015731
0.01467
0.015032
0.010726 0.013314 0.0135
82 0.013858
Skewness -0.01085
0.025075
-0.532686
-0.298497
1.905172
-0.414521
-0.184178
-0.545991
Kurtosis 7.153316
12.91989
9.041185
7.930896
135.4433
9.240686
5.682545
12.51171
Jarque-Bera 2189.376
12288.55
4590.974
3051.901
2168866
4850.147
906.08
11206.05
Probability 0 0 0 0 0 0 0 0 Observations 3046 2997 2928 2969 2965 2937 2966 2934 Mean return (mean = X total no. 63.97 215.7 272.89 135.68 117.41 187.97% 70.29 173.11
ASDF Thailand Proceedings of the International Congress 2014 [IC 2014], Bangkok, Thailand 5
Int Congress 2014 ISBN : 978-81-929742-3-1 www.intcongress.com

of observations) (%) % 8% % % % % %
Source: http://finance.yahoo.com/ and Computed using E-Views 6 Version.
3.3. Correlation for the Indices of Asian emerging markets with Thailand SET index.
As a general indicator of market, a correlation matrix was used. Table 2 shows the results of correlation among the sample indices of emerging stock markets and Thailand market in Asia. According to the results of the Table, the values of correlation ranged from -0.023 (India–Korea) to 0.116 (Korea–Philippines). Similarly, all the sample stock indices in Asia were positively correlated but few indices (i.e. S&P CNX Nifty - Korea Stock Exchange Index (KOPSI) with the value of -0.023), (China – Taiwan with the value of -0.015), and (China - Korea with the value of -0.014) were negatively correlated. It is significant to note from the correlation values earned by emerging market indices in Asia India (0.023), Indonesia (0.040), Korea (0.015), Malaysia (0.015), Philippines (0.030) and Taiwan (0.055) were positively correlated with Thailand. At the same time, only one index, namely, Shanghai Stock Exchange Composite index of China (-.004) was negatively correlated with Thailand.
Table – 2: The Results of Correlation Matrix for Asian Stock Market Index Returns during the study period from 01-01-2002 to 31-12-2013
Pearson Correlations Samples China India Indonesia Korea Malaysia Philippines Taiwan Thailand
China 1 India 0.010 1
Indonesia 0.009 -0.007 1 Korea -0.014 -0.023 .051** 1
Malaysia -0.011 -0.004 0.016 .067** 1 Philippines 0.030 0.029 .050** .116** 0.028 1
Taiwan -0.015 .051** 0.007 .037* 0.022 .092** 1 Thailand -0.004 0.023 .040* 0.015 0.015 0.03 .055** 1
**. Correlation is significant at the 0.01 level (2-tailed). *. Correlation is significant at the 0.05 level (2-tailed).
Source: http://finance.yahoo.com/ and Computed using SPSS 16 Version
3.4. Pair wise Granger Causality Test for the Indices of emerging Asian markets and Thailand market.
An attempt has been made to study the Co Movements and Bidirectional Causality relation among all emerging Asian stock market indices with Thailand market in Asia, using Pair Wise Granger Causality Test. Table – 3 shows the results of Granger Causality for testing the inter linkages of Thailand market, with seven sample emerging stock market indices in Asia during the study period. It is clear that among the sample indices, only one Asian emerging market index, Indonesia, was perfectly fit and recorded Co Movement with Thailand market on the basis of two way bidirectional causality relation (as per F – Statistics, Indonesia Thailand (13.0371) and Thailand Indonesia (13.4698)). It is to be noted that out of remaining six emerging markets, only three markets (Korea, Philippines and Taiwan) were significant and recorded causality relationship on the basis of one way bidirectional causality (F – Statistics and Probability values). Further, the remaining three indices (China, India and Malaysia) had no causality relation with Thailand.
ASDF Thailand Proceedings of the International Congress 2014 [IC 2014], Bangkok, Thailand 6
Int Congress 2014 ISBN : 978-81-929742-3-1 www.intcongress.com

The co-movements of stock market indices of Thailand and seven indices of emerging Asian countries during the study period, are shown in Figure 3. This figure was created from the results of Granger Causality test shown in Table 7. It is to be noted that out of eight emerging markets, Indonesia registered a high degree of Co Movements (two way) with Thailand market while three other emerging markets (Korea, Philippines and Taiwan) recorded lesser degree of co movements (single side causal relationship) with Thailand. The remaining three indices (China, India and Malaysia) did not register any causal relationship with Thailand.
Table – 3: The Results of Granger Causality for testing the Co Movements of Thailand Market with Seven Emerging Asian Markets during from 01-01-2002 to 31-12-2013
Null Hypothesis: Obs F- Statistic Prob. Results THAILAND does not Granger Cause CHINA 2932 0.91079 0.4023 Accepts CHINA does not Granger Cause THAILAND 2932 0.13239 0.8760 Accepts THAILAND does not Granger Cause INDIA 2932 0.37628 0.68640 Accepts INDIA does not Granger Cause THAILAND 2932 1.54693 0.21310 Accepts
THAILAND does not Granger Cause INDONESIA 2926 13.4698 0.00000 Rejects INDONESIA does not Granger Cause THAILAND 2926 13.0371 0.00000 Rejects
THAILAND does not Granger Cause KOREA 2932 1.71658 0.17990 Accepts KOREA does not Granger Cause THAILAND 2932 6.84903 0.00110 Rejects
THAILAND does not Granger Cause MALAYSIA 2932 1.85054 0.15730 Accepts MALAYSIA does not Granger Cause THAILAND 2932 0.38936 0.67750 Accepts
THAILAND does not Granger Cause PHILIPPINES 2932 0.91838 0.39930 Accepts PHILIPPINES does not Granger Cause THAILAND 2932 4.41371 0.01220 Rejects
THAILAND does not Granger Cause TAIWAN 2932 0.27479 0.75980 Accepts TAIWAN does not Granger Cause THAILAND 2932 3.38661 0.03400 Rejects
Sources: http://finance.yahoo.com/ using E- views
Rejection of Null Hypothesis when the Probability value is less than or equal to 0.05.
Figure – 3: The Co-Movement of Stock Market between Thailand and Seven Emerging Asian countries during from 01st January 2002 to 31st December 2013.
ASDF Thailand Proceedings of the International Congress 2014 [IC 2014], Bangkok, Thailand 7
Int Congress 2014 ISBN : 978-81-929742-3-1 www.intcongress.com

4. Discussion and Conclusion
An attempt was made to study co movement of the returns of the emerging Asian exchanges indices (SSE Composite Index (SSE), S&P CNX Nifty, Jakarta Composite Index (JKSE), Korea Stock Exchange Index (KOPSI), FTSE Bursa Malaysia (KLSE), Philippine Stock Index and TSEC Weighted Index (TWII)) and Stock exchange of Thailand SET Index. The daily closing returns varied from 63.97 to 272.89 percent. The average daily returns of Indonesia were higher than other emerging Asian stock markets, with 272.89 percent, followed by Indian NSE S&P CNX Nifty with 215.78 percent. China recorded the least return value of 63.97 percent while Thailand SET index earned a value of 173.11 percent. It is clear that among the sample indices of Asia, Indonesia (272.89%) provided better return than that of Thailand (173.11%) during the study period. According to the analysis, better opportunities existed for diversification among the Asian emerging stock markets in general and stock exchange of Thailand SET index in particular.
The analysis of this study clearly shows that in the long run, four countries, namely, Indonesia, Korea, Philippines and Taiwan exerted the greatest influence on Thailand. The stock exchange of Thailand SET index also exercised influence on Indonesia during the whole study period. It is to be noted that Indonesia enjoyed highly inter linked co movements with Thailand i.e. (two way bidirectional causality relationship). Out of remaining six markets, only three markets (Korea, Philippines and Taiwan) recorded one way Bidirectional Causality Relationship with Thailand. The other three emerging Asian markets (China, India and Malaysia) did not record Inter Linkages and Co Movements with Thailand during the study period. The three emerging markets (China, India and Malaysia) recorded higher risk than Indonesia, Korea, Philippines and Taiwan.
References
1. Chaker Aloui and Besma Hkiri (2014). Co-movements of GCC emerging stock markets: New evidence from wavelet coherence analysis, Economic Modelling, 36, 421–431.
2. Claudio Moranaa and Andrea Beltratti (2008). Comovements in international stock markets. Journal of International Financial Markets, Institutions and Money, 18, 31-45
3. Eiji Fujii (2005). Intra and inter-regional causal linkages of emerging stock markets: evidence from Asia and Latin America in and out of crises. International Financial Markets, Institutions and Money, 15, 315–342.
4. Gong-meng Chen, Michael Firth and Oliver Meng Rui (2002). Stock market linkages: Evidence from Latin America. Journal of Banking & Finance, 26, 1113–1141.
5. Guglielmo Maria Caporale, Andrea Cipollini and Nicola Spagnolo (2005). Testing for contagion: a conditional correlation analysis. Journal of Empirical Finance, 12, 476–489.
6. Jarl Kallberg and Paolo Pasquariello (2008). Time-series and cross-sectional excess comovement in stock indexes. Journal of Empirical Finance, 15, 481–502.
7. Kate Phylaktis and Fabiola Ravazzolo (2005). Stock market linkages in emerging markets: implications for international portfolio diversification. International Financial Markets, Institutions and Money, 15, 91-106.
8. Lee K. Lim (2009). Convergence and interdependence between ASEAN-5 stock markets, Mathematics and Computers in Simulation, 79, 2957– 2966.
9. Leo Chan, Donald Lien and Wenlong Weng (2008). Financial interdependence between Hong Kong and the US: A band spectrum approach, International Review of Economics and Finance, 17, 507–516.
10. Ming-Shiun Pan, Robert Chi-Wing Fok and Y. Angela Liu (2007). Dynamic linkages between exchange rates and stock prices: Evidence from East Asian markets. International Review of Economics and Finance, 16, 503–520.
11. Phaisarn Sutheebanjard and Wichian Premchaiswadi (2010). Forecasting the Thailand Stock Market Using Evolution Strategies, Asian Academy of Management Journal of Accounting and Finance, 6 (2), 85–114.
ASDF Thailand Proceedings of the International Congress 2014 [IC 2014], Bangkok, Thailand 8
Int Congress 2014 ISBN : 978-81-929742-3-1 www.intcongress.com

12. Orawan Ratanapakorn and Subhash C. Sharma (2002). Interrelationships among regional stock indices. Review of Financial Economics, 11, 91-108.
13. Queensly Jeyanthi. B. J and M. Albert William SJ (2009). An Empirical Analysis of Dynamic Linkages: A Case of India, Japan, Singapore and USA Stock Markets, SMART Journal of Business Management Studies, 5 (1), 58-64.
14. Selvam Murugesan, Raja, M and Yazh Mozli, P (2007). Forecasting the Time Volatility of Emerging Asian Stock Market Index, Asia-Pacific Business Review, 8(2), 27-37.
15. Shamila A. Jayasuriya (2011). Stock market correlations between China and its emerging market neighbors. Emerging Markets Review, 12, 418–431.
16. Theodore Syriopoulos (2007). Dynamic Linkages between Emerging European and Developed Stock Markets: Has the EMU any impact?. International Review of Financial Analysis, 16, 41– 60.
17. Titus O. Awokuse, Aviral Chopra and David A. Bessler (2009). Structural change and international stock market interdependence: Evidence from Asian emerging markets. Economic Modelling, 26, 549–559.
18. Toda H.Y, Phillips P.C.B. (1991). Vector Autoregression and Causality: A Theoretical Overview and Simulation Study, Cowles Foundation Discussion Paper No: 1001, 1-42.
19. Tomoe Moore and Ping Wang (2014). Dynamic linkage between real exchange rates and stock prices: Evidence from developed and emerging Asian markets. International Review of Economics and Finance, 29, 1–11.
20. Zeynel Abidin Ozdemira, Hasan Olgun and Bedriye Saracoglu (2009). Dynamic linkages between the center and periphery in International stock markets. Research in International Business and Finance, 23, 46–53.
ASDF Thailand Proceedings of the International Congress 2014 [IC 2014], Bangkok, Thailand 9
Int Congress 2014 ISBN : 978-81-929742-3-1 www.intcongress.com

A Study on CRM as a Sound Strategy for Banking Sector
Dr. P. Anbuoli1, T. R.T hiruvenkatraj2
Faculty, Department of Management Studies, Anna University Regional Centre Madurai, Madurai, Tamil Nadu, India
Assistant Professor, Bharath Niketan Engineering College, Theni, Tamilnadu
Abstract: Today many financial sector such as banks, insurance etc. has realized the importance of Customer Relationship Management (CRM) and its prospective to support them to attain new customers, retain existing customer and maximize their lifetime value. Customer relationship management is one of the popular and important strategies to manage customer. Strategy focuses on understanding our customers as individuals instead as a group. Marketing strategies both influence and are influenced by consumer’s behavior and situation. This study deals with the role of Customer Relationship Management in banking sector which helps to satisfy the need of the Bank to increase customer value by using some CRM applications. CRM is a resonance business strategy which helps the bank to identify their most profitable and potential customers. The effective relationship between customers and banks depends on the understanding of the needs of customers. The capability of banks to respond towards the customers’ needs make the customers feel like a valuable individual rather than a large number of customers. CRM manages the relationships between a Bank and its customers. Managing customer relationships requires managing and having customer knowledge. It directs towards improving and continuously delivering good services to customers. The banking business is becoming more and more complex with the changes derives from the liberalization and globalization. For a new bank, customer creation is important, but an established bank it is the retention is much more efficient and cost effective mechanism. It is possible through implementing CRM Strategy in Banks.
Key words: CRM, Customer, Bank
Introduction
CRM Helps an enterprise to enable its marketing departments to identify and target their best customers, manage marketing campaigns and generate quality leads for the sales team. It Assist the organization to improve telesales, account, and sales management by optimizing information shared by multiple employees, and streamlining existing processes. Allowing the formation of individualized relationships with customers, with the aim of improving customer satisfaction and maximizing profits identifying the most profitable customers and providing them the highest level of service. Providing employees with the information and processes necessary to know their customers understand and identify customer needs and effectively build relationships between the company, its customer base, and distribution partners.
Concept of CRM
Customer Relationship Management entails all aspects of interaction that a company has with its customer, whether it is sales or service-related. While the phrase customer relationship management is most commonly used to describe a business-customer relationship, CRM systems are used in the same way to manage business contacts, clients, contract wins and sales leads.
CRM is often thought of as a business strategy that enables businesses to:
Understand the customer
ASDF Thailand Proceedings of the International Congress 2014 [IC 2014], Bangkok, Thailand 10
Int Congress 2014 ISBN : 978-81-929742-3-1 www.intcongress.com

Retain customers through better customer experience Attract new customer Win new clients and contracts Increase profitably
Customer Service in Banks
Peter Drucker says Quality in a service or product is not what you put into it. It is what the client or customer gets out of it.
A lot of companies have chosen to downsize, and maybe that was the right thing for them. We chose a different path. Our belief was that if we kept putting great products in front of customers, they would continue to open their wallets. By Steve Jobs
Review of Literature
According to Shani and Chalarani – Customer Relationship Management marketing can be defined as “ an integrated effort to identify, maintain and build up a network with the individual customers and to continuously strengthen the network for the mutual benefit of both parties, through interactive, individualized and value added contracts over a long period of time.
In the words of Lekha “CRM aims at delivering better products and value to the customers through better understanding of his needs.”
Objectives of the study
1. To study the current practices of CRM in banking sector. 2. To know the importance of CRM as a profitable tool for an organization. 3. To offer suggestion to improve the performance of the bank.
Research Methodology
Research methodology explains the various steps that generally adopted by the research in studying research problem along with logic behind them. A research design is simply a plan for study in collecting and analyzing the data. It helps the researcher to conduct the study in an economical method and relevant to the problem.
Research methodology is a systematic way to solve a research problem. The methodology should combine economy with efficiency.
Research Design
The research design adopted for the study is descriptive design.
Data Source
Data was collected through both primary and secondary data sources. Primary data was collected through a questionnaire.
Sample Size The sample size is 100
ASDF Thailand Proceedings of the International Congress 2014 [IC 2014], Bangkok, Thailand 11
Int Congress 2014 ISBN : 978-81-929742-3-1 www.intcongress.com

Statistical Tools
The tools used for analysis are Percentage Analysis, chi square test and weighted average method.
Data Analysis and Interpretation Chi-Square Analysis
Chi square test is an important test among the several tests of significance. It is a statistical measure used in the context of sampling analysis for comparing a variance to a theoretical variance.
Chi square enables to explain whether or not attributes are associated. Chi square is calculated as follows.
Chi-Square
Comparing customer satisfaction survey and customer comments and complaints.
Hypothesis
A) Null Hypothesis (H0)
There is no significant relationship between customer satisfaction survey and customer comments and complaints.
B) Alternative Hypothesis (H1)
There is significant relationship between customer satisfaction survey and customer comments and complaints.
Chi –square test formula
Where
-The chi square static
O- Observed frequency
E-Expected frequency
Degrees of Freedom
Degree of freedom plays an important part in using the chi square distribution and tests are based on it. The degree of freedom is worked out as follows:
Degree of freedom =(r-1) (c-1)
Where
‘c’ means number of columns ‘r’ means number of rows.
ASDF Thailand Proceedings of the International Congress 2014 [IC 2014], Bangkok, Thailand 12
Int Congress 2014 ISBN : 978-81-929742-3-1 www.intcongress.com

Cus
tom
er
sati
sfac
tion
su
rvey
Customer comments and complaints
Face to face interview
Toll free numbers
Formal surveys
Other means
Total
Yes
18
69
4
1
92
No
2
1
4
1
8
Total
20
70
8
2
100
Calculation for Chi-Square
O
E
O-E
(O-E)^2
(O-E)^2/E
18 18.4 -0.4 0.16 0.0087 69 64.4 4.6 21.16 0.3286 4 7.36 -3.36 11.2896 1.5339 1 1.84 -0.84 0.7056 0.3835 2 1.6 0.4 0.16 0.1 1 5.6 -4.6 21.16 3.7786 4 0.64 3.36 11.2896 17.64 1 0.16 0.84 0.7056 4.41
Total 28.1833
Degree of freedom =(r-1) (c-1) = (4-1) (2-1) = 3*1 =3 Level of significance 5% Calculated value=28.1833 Table value=9.488
Cal value>table value = 28.1833>9.488
Findings
As Pearson Chi-square value is 9.488 for degree of freedom 3. Significance value calculated is 0.000 which is greater than significance table value 0.05. So H1 is accepted
Interpretation
As the calculated value is more than the tabulated value. Null hypothesis is rejected. Hence the alternative hypothesis is accepted.
Conclusion
Thus H1 is accepted so the result is there is relationship between customer satisfaction survey and customer comments and complaints.
ASDF Thailand Proceedings of the International Congress 2014 [IC 2014], Bangkok, Thailand 13
Int Congress 2014 ISBN : 978-81-929742-3-1 www.intcongress.com

Percentage Analysis
Kind of Services Used
Particulars No. Of respondents %of respondents Withdraw 30 30%
Deposit 10 10% Transfer money 25 25% Money exchange 8 8%
Update pass book, cheque 7 7% Others 20 20% Total 100 100
Inference
The above table shows that 30% of customers are usually used these withdraw services, 10% are used deposit services, 25% are transfer money, 8% are money exchange,7% are update passbook and cheque services and 20% are used other services usually.
Chart for kind of services used
Weighted Average Method
S.NO FACTORS 1
W1=5
2 W2=4
3 W3=3
4 W4=2
5 W5=1 TOTAL AVERAGE RANK
1 Facilities 20 10 25 22 23 282 18.8 3
2 Customized services 19 11 35 26 9 305 20.33 2
3 Staff, Time management 21 11 5 7 56 234 15.6 5
ASDF Thailand Proceedings of the International Congress 2014 [IC 2014], Bangkok, Thailand 14
Int Congress 2014 ISBN : 978-81-929742-3-1 www.intcongress.com

4 Scope of services provided 50 20 12 8 10 392 26.13 1
5 Others 12 15 17 20 36 247 16.46 4
Result of Weighted Average Method
RANK FACTORS 1 Scope of services provided 2 Customized services 3 Facilities 4 Others 5 Staff, Time management
Findings & Suggestion
There should be more and more emphasis should be given by the Bank to satisfying their customer to retain them.
More Information technology has to be adopted Bank has to reduce the procedure to be adopted by the customers. Inadequate information about the customer is also a problem so proper database should be
maintained. There should be a good communication between them and their clients. The staff as well as the time should be managed to bring the bank effectively. It is recommended that the bank should provide enough facilities to the customers. The bank can improve the services to the customers.
Conclusion
On the basis of the study it is clear that to retain and develop customer for a Bank, customer relation act as a strategic tool. During delivery of service they have to focus and identify the behavior pattern of the customers. To maintain relationship the employees has to be given training and proper implementation of complaint handling system should be there. It is very clear that CRM became important for all business especially financial service sectors So customer relations plays a major role as a strategic tool for banks to hold the customer for long period and success of the concern.
References
1. Alok Kumar et al, Customer Relationship Management : Concepts and applications, Biztantra, 2008.
2. H.Peeru Mohamed and A.Sahadevan, Customer Relation Management, Vikas Publishing. 3. Bhaskar PV (2004). Customer Service in Banks IBA Bulletin. 4. Parasuraman, A., Zeithaml. V.A. and Berry, L.L. (1985). A Conceptual Model of Service Quality and
its Implications for Future Research. Journal of Marketing, Volume 49. 5. Durkin, M. (2004). In Search of the Internet-Banking Customer. The International Journal of Bank
Marketing 6. Parvatiyar, A., & Sheth, J. N. (2001). Customer relationship management: Emerging practice,
process and discipline. Journal of Economic and Social Research
ASDF Thailand Proceedings of the International Congress 2014 [IC 2014], Bangkok, Thailand 15
Int Congress 2014 ISBN : 978-81-929742-3-1 www.intcongress.com

A Study on Role of Micro Finance in Rural Women Development in Tamilnadu
Dr. P. Anbuoli
Faculty, Department of Management Studies, Anna University Regional Office, Madurai
Abstract: Micro finance sector has passed through long passage from micro savings and micro credit to micro insurance and micro money transfer. This continuing and evolutionary growth process has known an immense opportunity to the rural women in India to reach rational economic, social and cultural empowerment leading to better living standard and quality of life for participating households. Financial institutions offering micro finance schemes in the country continued to play a prominent role for the past two decades. Rural women development largely depends upon the disbursement of micro finance products. In this study 100 samples are collected across different cities in Tamilnadu. Detailed questionnaire is provided to collect data from the respondents, the questionnaire has three sections seeking to collect information about demographic profile of the respondents, level of satisfaction on the use of micro finance products and factors influencing on the use of micro finance products. This study incorporates both primary and secondary data collected from various resources. Simple percentage analysis, weighted average score and factor analysis have been employed to analyze data collected. The role of NABARD on the promotional and financial support on the strengthening of micro finance products is also investigated. There are various factors influenced on the use of micro finance and micro finance is backbone in the rural economy to develop the livelihood of rural inhabitants.
Keywords used: Micro Finance, Micro Credit, Micro Savings, Micro Insurance, Rural Women Development, NABARD
1. Introduction
Micro Finance schemes offer small loans to poor and rural people especially women for their diverse requirements such as consumption, shelter, revenue generation and self-employment for their better livelihood. In several situations, micro finance schemes propose a mixture of numerous services to their customers along with credit. These comprise connection with micro savings outlet and insurance policies, skill development training and developing marketing arrangement. Micro credit schemes, thus, assume significance since they make possible poverty diminution through encouragement of sustainable livelihoods and bring about women empowerment through social and collective action at the working class. In addition, micro finance interventions guide to augmented social interface for poor women within their households and in the society, moreover, greater mobility that increases their self-esteem and self-assertion in the community sphere.
The micro finance movement in India has approximately assumed the outline of an industry, embracing multiple non-government organizations, micro finance institutions, community and regional based self-help groups and their sub-groups, different forms of co-operatives, credit unions, public and private sector banks. This sector has showed a sharp growth with the appearance of a numeral of micro finance institutions that are providing financial and non-financial assistance to the poor and unprivileged in an endeavor to elevate them out of dearth in income and property. The initiative of micro finance institutions with the national level micro finance scheme support reaches out to millions of poor across the country. Increased demand for micro finance in India makes hurried walk and has raised high prospect in the country about the role that it can take part in poverty eradication and women development in rural areas. The present study showcases the momentous involvement of the micro finance institutions to a comparatively large base of customers, which would be of immense help to the policy makers as well as the
ASDF Thailand Proceedings of the International Congress 2014 [IC 2014], Bangkok, Thailand 16
Int Congress 2014 ISBN : 978-81-929742-3-1 www.intcongress.com

general public, to recognize and realize the role that the micro finance institutions can take, in ameliorating the lot of the deprived and underserved rural community. Hence this present research work can be carried to test the role of micro finance schemes in the rural women development.
2. Statement of the Problem
Women form a crucial part in the family, society and economy as a whole, who comprise roughly half of the labor force and acting as a primary member contributing in the survival of the family. While moving to rural area, the main occupation and employment source to the women candidates are agriculture and related field. It is the fact that women form the backbone of the agriculture sector, comprising the majority of agricultural population in India. In agriculture field the cost of women labor is much lower than the cost of men labor. Hence gender distributions in agriculture are stark, with all activities involving manual work usually assigned to women, on the other hand all operations concerning equipment and brought animals generally performed by men. Agriculturists can be classified into several types like, daily wage workers, small and tiny land owners, landless labors and so on. Earnings opportunity in agricultural sector is very limited and it failed offer the employment regularly or throughout the year. At the same time the mobility of labor from one place to another place involving long hours of travel is limited. Hence the earnings power to rural people is limited than the urban sources. Gender domination in rural areas is much higher and the earnings of male community largely spend for their entertainment like drink, smoke and other activities. Hence the income procurement in the family is small in number, the financial requirements of rural women largely fulfilled from the moneylenders and other forms of non-organized financial entities.
The existence of micro finance schemes in rural areas can give enormous benefit to the women residing in the rural areas. Micro finance activity refers to small savings, credit, leasing, money transfer and insurance services extended to socially and economically underprivileged segments of the society. This process also defined as provision of thrift, credit and other financial services and products of very small denominations distributed to the deprived residing in rural and semi urban or urban areas, for assisting them to elevate their earnings levels and improve living standards. Presently a large part of micro finance movement is restricted to credit only. Women comprise a large number of consumers of micro credit savings and other services offered by the micro finance institutions.
3. Need for the Study
Micro finance schemes are presently being recognized as a key factor for alleviating poverty and empowering women. Until last two decades, credit schemes for were almost insignificant because of the inability to repay the stated interest. Additionally, certain misapprehension about the poor populace that they require loan at subsidized rates of interest on squashy terms, they lack skills, capacity to save, credit worthiness and therefore are not aware about banking operations. However the experience of several micro finance institutions and self-help groups reveal that rural people are actually efficient managers of credit and finance. Availability of timely and adequate credit is essential for them in their endeavor rather than grant. Government efforts so far in the course of assorted poverty mitigation schemes for self-employment by providing credit and subsidy received modest achievement. While the majority of them were target based concerning various government agencies and banks.
Finance is the most crucial input for household as well as economic activity along with growth and development. Finance through own resource can give courage to start business or everything one person want to do, if there is any dearth in own resource, the person may seek assistance from the others. The structure of rural financial market in India is dualistic, it consists of both formal and informal financial intermediaries operate. The borrower from the rural areas has been depending upon institutional sources for their productive purposes. At the same time the consumption credit needs not fulfilled from the institutional financial framework. Hence the rural women have to undertake non-institutional lenders have been exploitative and expensive for rural poor. The existence of suitable financial structure to provide both productive and consumption credit needs will reduce the financial hunt by the rural women. Now
ASDF Thailand Proceedings of the International Congress 2014 [IC 2014], Bangkok, Thailand 17
Int Congress 2014 ISBN : 978-81-929742-3-1 www.intcongress.com

increased attention to strengthen the credit disbursement system in rural areas, are lowering the moneylenders clutches on the rural women. Micro finance schemes and its multiple dimensions bring enormous financial support to the village families. Hence this present study has been carried to check the role of micro finance schemes on rural women development.
4. Review of Literature
Studies made in this respect by eminent personalities are viewed to continue this research work and narrated at this juncture accordingly. Bharathamma (2005) carried out a study on empowerment of rural women through income generating activities in Gadag district of Karnataka. The study revealed that education, land holding, income of the family, participation in social activities, mass media and number of training programme undergone showed highly significant association with empowerment, whereas, age, marital status, caste, family type, family size and material possession had no significant association with empowerment of rural women. Gains for different income groups are compared with the average for a control group, rather than with the change for comparable income categories within the control group; in other words, gains to very poor borrowers are compared with average gains in the control group, and not to the gains to the very poor controls (Morduch 1999). Pitt et al (2003) find that credit going to females has a large and significant impact in two out of three health measures for children. Hashemi and Schuler (1996) found a reduced incidence of violence among women who were members of credit organizations than among the general population.
Yunus (2007) argues that it is important to distinguish microcredit in all its previous forms from the specific form of credit adopted at the Grameen Bank, which he calls Grameen credit. For some of the other forms of microfinance as a stand-alone means of reaching the poor, and respects in which it has to be complemented by other inputs and services (Mahajan, 2005). Microfinance institutions could also serve as intermediaries between borrowers and the formal financial sector and on-lend funds backed by a public sector guarantee (Phelps 1995). There is a strong tendency to move to the top of the clientele group, and to give little attention to the needs of the poorest, with the end result that their proportion diminishes over time (Navajas et. al 2000). Only MFIs that design programs around the needs of the poorest are likely to retain them as clients. MFIs that focus on savings more than credit tend to reach a smaller proportion of the poorest, have a lower and slower impact on poverty reduction, and are therefore less conducive to reaching the big goals by the target dates (Chen and Snodgrass 1999; Fruman et. al1998).
Lapeneu and Zeller (2001) find that Asia accounted for the majority of MFIs, retained the highest volume of savings and credit, and served more members than any other continent. The concept and practice of microfinance sector is increasingly adopting a financial systems approach, either by operating on commercial lines or by systematically reducing reliance on interest rate subsidies and aid agency financial support (Basu et al. 2005). One way of expanding the successful operation of microfinance institutions in the informal sector is through strengthened linkages with their formal sector counterparts. A mutually beneficial partnership should be based on comparative strengths of each sector. Informal sector microfinance institutions have comparative advantage in terms of small transaction costs achieved through adaptability and flexibility of operations (Kim Kyung-Hwan, 1995).
5. Objectives of the Study
This study is carried in this direction with the following objectives. These are:
1. To check the demographic profile of respondents who are availing micro finance services from various micro finance institutions.
2. To analyze the satisfaction level of respondents while using micro finance services from the micro finance institutions.
3. To examine the factors influencing on the use of micro finance products of women in rural areas. 4. To assess the NABARD support in this direction for the uplift of livelihood of rural women in India.
ASDF Thailand Proceedings of the International Congress 2014 [IC 2014], Bangkok, Thailand 18
Int Congress 2014 ISBN : 978-81-929742-3-1 www.intcongress.com

6. Research Methodology
This study is based on the sample of 100 rural women and the survey is conducted in various parts of Tamilnadu during January – February 2014. The sample is collected from the infinite population of rural women, sampling unit and source list are the rural women availing micro finance services and identified in micro finance institutions, self-help groups and so on. Sampling is conducted by interviewing randomly selected rural women over a period of six weeks’ time. The data is collected using a structured questionnaire, the questionnaire is divided into three sections, the first section deals with the demographic profile of respondents, second sections collects their satisfaction on the use of micro finance services, third section seeks the factors influencing on the use of micro finance products of women in rural areas. In order to analyze the information collected from the respondents’, simple percentage analysis, weighted average score, factor analysis have been employed to test the worthiness of data collected. The questions are phrased in the form of statements scored on a 5 point summation scale, ranking from 1 for highly dissatisfied, 2 for satisfied, 3 for neutral, 4 for satisfied and 5 for highly satisfied. This study contains both primary data collected from the respondents and secondary data collected from various journals, books and websites of micro finance institutions. Descriptive research design has been adopted to frame the study.
7. Analysis and Discussions
Demographic Profile of Rural Women
The demographic profile of rural women is analyzed as per their age, marital status, annual income, profession, education and presented in the table-1.
Table – 1: Demographic Profile of Rural Women
Attributes Distribution Sample Number Frequency
Age 18 – 28 29 – 58
58 & above
46 36 18
46% 36% 18%
Marital Status
Married Unmarried Divorced Widow
74 14 1 11
74% 14% 1% 11%
Annual Income
Upto 25,000 25,001 – 50,000
50,001 – 1,00,000 More than 1,00,000
28 42 16 11
28% 42% 16% 11%
Nature of Employment
Daily wage Landless labor Small business
Self-Employment Employed
28 17 23 31 1
28% 17% 23% 31% 1%
Education
Uneducated Primary Education
Secondary education Diploma/Degree
29 37 22 12
29% 37% 22% 12%
ASDF Thailand Proceedings of the International Congress 2014 [IC 2014], Bangkok, Thailand 19
Int Congress 2014 ISBN : 978-81-929742-3-1 www.intcongress.com

Community Composition OBC SC/ST
68 32
68% 32%
Family Size Nuclear Family Joint Family
74 26
74% 26%
Detailed demographic profiles of respondents are presented in Table 1. Questionnaires are disseminated to the women who had undertaken at least two kinds of micro finance services in the past 2 years. 100 completed questionnaires from the respondents are collected. From the sample, 46% of respondents are in the age group of 18 – 28 years, 74% of respondents are married, and annual income of the respondents acknowledges that 42% are earning 25,001 – 50,000 per annum. Daily wage (28%), small business (23%) and self-employment (31%) are nature of employment of respondents. Most of the respondents (37%) education is primary level and followed that 29% are illiterate. The information on community composition of the sample respondents revealed that 68% of the beneficiaries are belonged to the general category and 32% of the respondents belonged to scheduled caste and scheduled tribe category. Family size of the respondent’s shows that 74% of the respondents are belonged to the nuclear family type includes their own family members like spouse, kids and parents of their own or spouse and 26% of respondents are belonged to joint family consisting of siblings of their own or spouse.
Level of Satisfaction
Satisfaction level of micro finance users are tested through the weighted average score of analysis, here various microfinance services are examined. A questionnaire containing twenty-three variables on the micro finance schemes was presented with 100 respondents, who are all used the micro finance schemes. The respondents are asked to rate each variable on a five point Likert scale, according to the satisfaction derived from the services availed from the micro-finance institutions. In order to analyze the satisfaction level of the respondents is calculated for each variable. The variables are categorized as variable of high satisfaction, moderate satisfaction and low satisfaction depends upon the value assigned and explained in table-2.
Table – 2: Satisfaction Level of Rural Women Micro Finance Users
Actions Strings HS S N D HD WAS
High Satisfaction
Amount of Credit taken 66 14 11 7 2 4.35 Period of Credit taken 58 18 12 8 4 4.18
Interest on Credit taken 61 11 9 16 3 4.11 Timing to borrow service 51 16 12 11 10 4.03
Suitability of financial products 55 15 14 9 7 4.02 Recognition & respect 53 18 13 10 6 4.02
Moderate Satisfaction
Information effectiveness 48 20 13 12 7 3.90 Compulsory saving conditions 48 19 15 11 7 3.90
Guarantee Expectations 50 18 11 12 9 3.88 Time taken to get loan 53 16 12 11 8 3.87
Bank staff behavior 49 18 12 13 8 3.87 Complaints recognition 47 19 14 9 11 3.82 Penalty of non-payment 46 21 11 12 10 3.81 Cost of transportation 45 15 21 12 7 3.79
Prompt Response 40 15 22 8 15 3.57 Interest on Savings made 36 16 18 11 19 3.39
Low Terms and Conditions 28 11 17 19 24 2.97
ASDF Thailand Proceedings of the International Congress 2014 [IC 2014], Bangkok, Thailand 20
Int Congress 2014 ISBN : 978-81-929742-3-1 www.intcongress.com

Satisfaction Ease of Procedure 26 10 19 14 31 2.86 Demand for Security 23 9 17 15 36 2.68
Loan usage check 21 10 18 16 35 2.66 Repayment procedure 20 10 17 17 36 2.61
Document charges 25 10 18 13 34 2.58 Hidden charges 18 9 16 19 38 2.50
It is ascertained from the out of twenty-three variable presented in the table -2, only six variables are coming under the classification of high satisfaction. 10 variables are categorized in moderate satisfaction and rest 7 is coming under low satisfaction category. High satisfaction includes amount of credit taken places first in that category, its weighted average score is 4.35. Period of credit taken is second important satisfied factor, which scores 4.18, similarly interest on credit taken placed third in that category. Timing to borrow service, suitability of financial products, recognition and respect from the workplace ranked as fourth and fifth category. Moderate satisfaction covers ten variables, includes information effective provided by micro finance institutions, compulsory saving conditions at the time of getting loans, guarantees expectations, time involved to get loan, behavior of bank loan, complaints recognition, penalty of non-payment, cost of transportation, prompt response and interest on savings made. Highest score is 3.90 and lowest score is 3.39. In low satisfaction classification of variables, terms and conditions, ease of procedure involved in micro finance products, demand for security, loan usage check, repayment procedure, document charges and hidden charges. The score distribution is ranges from 2.97 to 2.50 in this category. It shows the lowest level of satisfaction to the rural women in the availing micro finance services. They experienced the procedural difficulties too, for getting the loan sanctioned, specifically while going for the formal sources of finance like banks.
Factors Influencing on Micro Finance Product Use
There are several micro finance schemes are available in the micro finance institutions in India. Micro credit is offered to safeguard from the financial requirement of various expected and unexpected happenings. Micro savings is one among the micro finance product; it creates thrift among the rural women to save their money in smaller denominations. Micro insurance schemes are acquired with the expectation of establishing family protection and savings for the family future. Micro leasing provides leasing services for small and women entrepreneurs and money transfer helps to transfer smaller denominations from one place to another place for business as well as personal purposes. There are various factors are influencing on the use of micro finance products, hence its impact is analyzed with the help of factor analysis. The detailed factor analysis is presented in table 3.
Table - 3: Results of Factor Analysis
Factor Variable Factor Loadings
Eigen Value
Cumulative % of Variance
Micro Credit
Starting self-employed business Basic protection of purpose
Education of children Unexpected medical expenses
Development finance for business
Basic livelihood expense Constructing own house
Family function To acquire land/plot for own use
0.823 0.533 0.679 0.732 0.843 0.711 0.818 0.714 0.782
12.434 38.428
Micro Savings Savings for future Meeting future financial
0.836 0.792 7.490 12.564
ASDF Thailand Proceedings of the International Congress 2014 [IC 2014], Bangkok, Thailand 21
Int Congress 2014 ISBN : 978-81-929742-3-1 www.intcongress.com

contingencies Wealth accumulation Retirement planning
Medical care expectation
0.735 0.638 0.724
Micro Insurance
Insurance Protection Minimal savings for future
Accidental Coverage Medical Coverage
0.817 0.793 0.639 0.623
5.295 7.673
Money Transfer
Money Transfer for business purpose
Money Transfer for personal purpose
0.698 0.582 3.194 4.184
Micro Leasing Leasing 0.774 2.085 2.126
The factors influencing on the use of micro finance products are analyzed with the principal factor component analysis. There are 21 variables are given under the five factors, it is clear that all variables are having factor load of more than 0.5. Hence it is evidenced that all the variables are consisting considerable impact in the use of micro finance products. Put together all variables are explaining the variance of 64.975%. Factor analysis strongly evidences that micro credit is the most recognized product among the other micro finance products. Development finance for business (0.843), starting self-employed business (0.823) and constructing own house (0.813) are bearing maximum factor load in that category. Availing credit for basic family protection purpose is the minimum factor loading bearing variable in that category. It explains 38.428% variances and has Eigen value of 12.434. Under micro savings factor, savings for future is the major factor that influences on the availing micro finance products. It bears the maximum factor load of 0.836 in that category. Retirement planning with micro savings are very minimal in that category and it possess the factor loading of 0.638. Micro savings explains 12.564% of variance and 7.490 as Eigen value. Micro Insurance is a special kind of insurance policies, which offers insurance policies like child plans, retirement plans, medical rider coverage, accidental coverage etc., on lower premium. Four factors are loaded in that category and explain 7.673% of variance and 5.295 of Eigen value. Money transfer facilitates to transfer money from one place to another place and both personal and business purpose is encouraged. It is loaded with two factors and explains 4.184% of variance in data and 3.194 as Eigen value. Lastly, micro leasing is loaded with only one string and it explains 2.126% variance in data and has Eigen value of 2.085.
Promotional Efforts and Financial Support by NABARD
NABARD offers refinance facility to banks to the 100 percent credit disbursement to women self-help groups. The total refinance disbursed to banks against bank loans to self-help groups during the financial year 2009-10 was Rs.3173.56 crore, registered a growth of 21.1% than the previous years. In addition to that, the cumulative refinance facility disbursed under self-help group bank linkage scheme positioned as Rs. 12861.65 crore. In order to strengthen the efforts of NABARD’s promotional support for micro finance activity, Central Government increased the fund size to Rs.400 crore to Micro Finance Development and Equity Fund. Apart from such funded assistance, NABARD continued to sponsor training programmes and so many efforts to enhance the effectiveness of officials in the disbursement of micro finance products. During the financial year 2012-13, the following programmes are offered to the beneficiaries listed in table-4.
Table – 4: Training and Capacity Building Programmes – 2012-13
Sr. No. Programme Particulars No of
Programmes No of
Participants
1 Awareness creation and capacity building programmes organized for SHGs associated with NGOs. 1991 83131
ASDF Thailand Proceedings of the International Congress 2014 [IC 2014], Bangkok, Thailand 22
Int Congress 2014 ISBN : 978-81-929742-3-1 www.intcongress.com

2 Awareness-cum-refresher programmes conducted for NGOs 1130 35648
3 Training programmes conducted for bankers of Commercial banks, RRBs, and Co-operative banks 462 14945
4 Exposure visits for bank officials/NGOs to agencies pioneering in micro finance initiatives 14 387
5 Field visit of Block Level Bankers’ Committee member to nearby SHGs 227 5880
6 Programmes for the elected members of Panchayat Raj Institutions to create awareness 80 2799
7 Training & exposure programmes for government officials 79 3385
8 Other training programmes for microfinance sector 1181 65029
9 Micro Enterprises Development Programme 1530 38313
10 Micro Enterprise Promotional Agency 36 1000
11 Meetings and Seminars 74 3351
Total 6804 253868
Additionally, NABARD grants financial support to the various agencies to disburse credit to rural and unprivileged areas. Financial sanctions, cumulative sanctions and cumulative progress are presented in the table -5.
Table – 5: Grant Support to Partner Agencies - 2012-13
Grant Assistance to various Partners under SHG-Bank linkage Programme (Rs. in lakhs)
Sanctions Cumulative Sanctions Cumulative Progress
Agency No. Amount No. of SHGs No. Amount No of
SHGs Amount released
SHG formed
SHGs linked
NGOs 306 2620.10 53393 2624 9025.81 345173 3469.69 244367 157831
RRBs 4 40.14 3395 117 429.44 47975 189.23 54271 36155
Co-operatives 7 63.23 5230 102 626.36 59105 252.95 44618 29075
IRVs 2 154.70 9250 68 684.46 40483 63.91 9991 5636
Farmers’ Clubs - - - - - - 61.96 14858 7986
Total 319 2878.17 71268 2911 10766.07 492746 4037.74 368105 236683
It is evident from the table-5 that sanctions during the financial year 2012-13 was Rs. 2878.17 lakhs and it was provided to 71268 agencies. Similarly cumulative sanctions positioned to Rs.10766.07 lakhs, it was distributed to 492746 agencies. Cumulative progress of amount released during the year was 4037.74 lakhs and 3.68 lakhs self-help formed in the same period.
ASDF Thailand Proceedings of the International Congress 2014 [IC 2014], Bangkok, Thailand 23
Int Congress 2014 ISBN : 978-81-929742-3-1 www.intcongress.com

8. Conclusion
The revolution from the micro finance towards strengthening the rural poor in India have provided considerable flows of credit, frequently to very low income groups or households, who would generally be excluded by conservative financial institutions. Micro finance offers services in the small denomination of savings, credit, leasing, insurance and money transfer. Micro credit presents poor people access to credit from a multiplicity of micro financial institutions they need to utilize income-earning prospects, meet life-cycle basic requirements, cope with tragedy such as natural disasters and protect them from added impoverishment during financial anxiety. Percentage analysis reveals that 46% of respondents are in 18-28 years of age, 74% are married respondents, annual income of 42% is falls in the range of 25,001 – 50,000, nature of employment of respondents furnishes that 31% are self-employed, educational qualification evidences that 37% respondents are primary school education. Community composition furnishes that 68% are general category and 74% of respondent’s family size are nuclear family. Level of satisfaction of rural women shows those only 6 strings out of 23, falls under high satisfaction. 10 strings are coming under moderate satisfaction and 7 are coming under low satisfaction. Factors influencing on the use of micro finance products are analyzed according to the micro finance products. Put together it explains that 65.975% variance in data and variable are loaded with more than 0.5 to all 21 variables given under 5 factors like micro credit, micro savings, micro insurance, money transfer and micro leasing. NABARD offers plenty of promotional and financial assistance to develop the rural women development. Micro finance schemes are the universal remedy in the elimination of rural women poverty and it is fuelled equally by the various Government agencies to bring anticipated development in rural economy.
References
1. Mahajan, V. (2005). “From Microfinance to Livelihood Finance”, Economic and Political Weekly, October 8, 2005, Mumbai.
2. Bharathamma, G.U., (2005). “Empowerment of rural women through income generating activates in Karnataka”, Thesis – University of Agricultural Science, Dharwad, Karnataka, India.
3. Yunus, Muhammad (2007). “Banker to the Poor: Micro-Lending and the Battle Against World Poverty”, Public Affairs, New York.
4. Chen, M. A., and Snodgrass, D. (1999). “An Assessment of the Impact of SEWA Bank in India: Baseline Findings”, Harvard Institute for International Development.
5. Fruman, C.and Paxton, J. (1998). “Outreach and Sustainability of Savings-First vs. Credit-First Financial Institutions: A Comparative Analysis of Eight Microfinance Institutions in Africa.
6. Phelps, P. (1995). “Building Linkages Between the Microenterprise and Shelter Sectors: An Issues Paper,” GEMINI, Betuesda, Maryland.
7. Navajas, S., Schreiner, M., Richard L. Meyer, Vega, C.G., & Meza J.R., (2000). “Microcredit and the Poorest of the Poor: Theory and Evidence from Bolivia”, World Development, Vol.28, No.2.
8. Lapenu, C. and Zeller, M. (2001) “Distribution, growth and performance of microfinance institutions in Africa, Asia and Latin America, Food Consumption and Nutrition Division, Discussion Paper, International Food Policy Research Institute.
9. Morduch, J. (1999) “The Microfinance Promise”, Journal of Economic Literature, Vol.XXXVII, pp. 1569-1614.
10. Pitt, M.M., Khankder, R., Chowdhury, O.H., and Millimet, D.L. (2003). “Credit programs for the poor and the health status of children in rural Bangladesh,” International Economic Review, Vol. 44, No.1, pp. 87-118.
11. Basu, P and Srivastava, P., (2005). “Scaling-up Microfinance for India’s Rural Poor Policy”, Research Working Paper 3646, World Bank, Washington.
12. Kim Kyung-Hwan (1995). “Access to Credit, Term of Housing Finance and Affordability of Housing”, Housing Finance International, Vol.9, No.4, June 22-27.
13. Hashemi, Syed, Sidney Schuler, and Ann Riley, (1996). “Rural Credit Programs and Women’s Empowerment in Bangladesh”, World Development, Vol. 24, No.4. pp. 635-653.
ASDF Thailand Proceedings of the International Congress 2014 [IC 2014], Bangkok, Thailand 24
Int Congress 2014 ISBN : 978-81-929742-3-1 www.intcongress.com

Facing Operational Work Issues Working Through E-Platforms in Textile Industries
T. R. Bhavani, Dr. P. Anbuoli, Dr. T. Jothimurugan
Research Scholar, ULTRA College of Engineering and Technology for Women, Madurai Faculty, Management Studies, Anna University, Regional Office, Madurai
Director & Head, Management Studies, K.L.N.College of Engg. & Tech., Sivagangai
Abstract: This study was designed to find out the tragedy of employees work performance by facing operational work issues through technology changes. The sample of this study consists of 213 employees from small & medium scale textile industries in Theni District. This is a descriptive and surveying research with an applied goal. The random stratified sampling was used. The main objective of the study is how technology amendments in HRMS helping and troubling employees in textile industries. The knowledge management processing system shows how to mend employees in the calamity of work issues mainly using e-platforms in textile industries. The main purpose of the study is to analyses work related factors in textile industries. To explain how should overcome from the operational work issues in the HRIS and E-platforms. Discriminant analysis was performed to identify sub systems. Wilks Lambda Test analysis was performed to identify sub systems of e-platforms. The findings of the study indicate that new tools and new platforms are implementing in all areas of sub systems but workers are unable to tackle the new tools and techniques. Mainly HRMS may affect low level employees while handling systems. Therefore all transitional elements organization culture, organization structure, technology should always be considered together. To validate their struggles in scheming suitable learning and improve so that the job can be organized which can attain to improving employee performance. We attained utmost benefits while using HRIS, MIS, ERP effectively and well-organized manner. The remaining five elements are optimistic impression. Training given to employees how to use but should fail to stretch how to rectify it. The research concludes that, the organization must develop the weak areas of E-platforms.
Key words used: E-platforms, Knowledge Management, Technical Innovation, Textile Industries
I. Introduction
In Indian textile industry has been a major contributor to the growth of the Indian economy and a significant source of employment in the small, medium as well as large scale sectors. The textile industry faces incredible defies in the appearance global competition. The rapid development of high technology, information and communications technologies have urged many organizations to actively seek for new way, ideas, strategy, experimentation, and system support in improving their current product, process, system and technology. Only 48.3% felt that the responsibility to manage innovative changes in textile industries should be everyone’s job. E-platforms information system was designed to focus on the actions of HRM. They keep records in a compressed manner, allowing access and reclamation in a suitable way. Human resources are not only brought into the organization by means of recruitment and selection but also developed within the organization by investment in their personal capacities and deployed by nurturing of interpersonal and inter-group relations.
The major challenge is how we are able to tackle the new tools and technical problems incorporate all the sub-systems in e-platforms and help them without mistake in achieving the ultimate goal. Information systems contribute to improve the organizational performance, and enhance the competencies of human resource professionals. This paper aims to assess and establish the support levels and the benefits of the sub system process of HRIS, MIS and E-Platforms in the medium-scale textile industries. The goal of e-
ASDF Thailand Proceedings of the International Congress 2014 [IC 2014], Bangkok, Thailand 25
Int Congress 2014 ISBN : 978-81-929742-3-1 www.intcongress.com

platforms in HRM is to maximize the productivity of an organization by optimizing the effectiveness of its employees while simultaneously improving the work life of employees.
II. Review Literature
Physically manual handling is one of the utmost mutual reasons of difficulties in the textile industry. Levitt, Apgar and March (1988) shows that there are less positive about the capacity of organizations to manage knowledge effectively. Argote argues that one of the reasons why knowledge is difficult to transfer is because “some of the knowledge acquired through learning by doing to the particular constellation of people, technology, structures and environmental conditions” (Argote, 1993, p. 42). Jacob and Ebrahimpur (2001, p. 75) results showed that the transfer of knowledge within organizations still remain problematic issue for managers. The present researcher has tried to survey this aspect from a different point of views. 50% of the professionals believe that changing human behavior is one of the executing problems in knowledge management (Glasser, 1998). Horwitz et al., 2006, results showed performance of an individual depends on job satisfaction. A persons’ ability, the quality of his tools and materials, the nature of the work environment and job and efficient managerial coordination of the efforts of the work force all assist the effective performance. Allameh (2007) states that the current scenario upgrading the technology is essential for organisation but applying and understanding the new knowledge is the task for today’s managers. Cummings, 2008 states that without skill, attitude and human commitment it will not accomplish the suitability of the organisation with highly technology system.
Popa Daniela, Bazgan Marius and Bashir Ahmed (2011) results shows their professional satisfaction correlated with job performance. Dr. Kameshwar Pandit and N.Mallika (2012) states handling employee performance based on the organizational needs, strategic requirements, and customer’s preference is crucial aspect of human Being. Balasundaram Nimalathasan (2012), according to the compatibility principle, work performance, being only one relatively specific aspect related to one’s work, cannot be well predicted from a general attitude such as job satisfaction. The study confirms that high employee satisfaction level can reduce industrial disputes and ultimately it leads to cordial industrial relations Dr. Vijaysinh Vanar (2012). Momani.A (2013) results showed that the main purpose of this infrastructure is not only converting tacit knowledge into explicit forms in the individual level, but also transmitting message from bottom to up and up to bottom in appropriate positions in the organizational level. In this study by technology improvement the employees attain specific technical problems while doing their work. It’s beneath to low level of job satisfaction.
III. Objective of the Study
The primary objective of the study is how innovative changes serving and distressing employees in textile industries. These are:
To explicate how to overwhelmed from the operational work issues in HRMS and E-platforms To explicate how to incorporate all the sub-systems in e-platforms and satisfy the employees in
textile industries.
IV. Research Methodology
This study was carried out from small and medium scale textile mills in Theni district, Tamilnadu. A sample of 213 employees from various departments was selected as respondents on the basis of systematic sampling. In this study, the main data was collected through questionnaire which consists of both open ended and close ended questions. To overcome the operational work force issues in a systematic way by using Multivariate test. To focus on subsystems, Discriminant Analysis and Wilks Lambda has been applied providing test results free from parametric assumption. To test these hypotheses, this research will present theoretical background about the concept and models of work performance, the analyses of the interviews,
ASDF Thailand Proceedings of the International Congress 2014 [IC 2014], Bangkok, Thailand 26
Int Congress 2014 ISBN : 978-81-929742-3-1 www.intcongress.com

statistical information and charts regarding the survey method. Therefore, it was found that the questionnaire used for assessing the employee work performance and organization performance of textiles mill employees was reliable.
V. Statistical Analysis Results
5.1 To demonstrate how to overwhelmed from the operational work issues in HRIS, MIS and E-platforms.
By using anova measures we measured perceived organizational support with 4-item to assess how well the organization thought that management supported it. We infer that F-ratio is significant at both levels which mean the difference in group means is significant.
Table 5.1: ANOVA Measures
The observed significance levels are not corrected for this and thus cannot be interpreted as tests of the hypothesis. The conclusion that knowledge workers are the most satisfied with factors which are at least important for their overall job satisfaction and opposite, that they are not so much satisfied with facing operation work issue factor. The average of measurable items and its correlation, and if the result is generally above 0.5, it is considered to be reliable.
The Eigen Values represents the model performance through the following statistics. a. Dependent variables: Employee Performance, Technical skills (Technology), Team Work, Work Load, Job Aids, Technical Skills, working environment. The above equation is the calculated from the Eigen Values Correlation equation we notice that except work Load & Technology Support, remaining all the factors have a positive impact on Employee Performance. Therefore, the null hypotheses 3 and 5 need not to be rejected while the remaining can be rejected. Seven factors emerged with eigen values greater than 1.0, explaining 65.5% of the variance.
Table 5.2: Eigen Value analysis
ASDF Thailand Proceedings of the International Congress 2014 [IC 2014], Bangkok, Thailand 27
Int Congress 2014 ISBN : 978-81-929742-3-1 www.intcongress.com

5.2 Focusing on all the subsystems in HRIS, MIS and to improve employee work performance in textile industries.
In the modern technology, Innovation is designed to improve effectiveness either by in terms of the accuracy of information or by using the technology to simplify the process.
Table 5.3 – Focusing Subsystems of E-Platforms, HRIS & MIS
As a result, employee well-being and computer based system support should be more accurate and timely, which helps get better employee satisfaction. By mechanically updating employee records and helping to make sure a smooth job aids, employee satisfaction improves. The ways that people respond to their jobs have consequences for their personal happiness and the effectiveness of their work organizations. We can see that in our example, Wilks Lambda Tests is shown 0.829, which indicates a high level of internal consistency for our scale with this specific sample.
Table 5.4 – Factor analysis among dependent variables
The small significance value indicates that the discriminant function does better than chance at separating the groups. Wilks' lambda agrees that only the first two functions are useful. For each set of functions, this tests the hypothesis that the means of the functions listed are equal across groups. The test of function 3 has a significance value greater than 0.10, so this function contributes little to the model. The tests of equality of group means measure each independent variable's potential before the model is created.
ASDF Thailand Proceedings of the International Congress 2014 [IC 2014], Bangkok, Thailand 28
Int Congress 2014 ISBN : 978-81-929742-3-1 www.intcongress.com

The result of factor analysis as illustrated in the table 5.4 shows that the variables act in that six groups are created. In our example, Information sharing will plan in directive to accumulation in ERP Platforms for the future needs. We can see that in our example, Wilks Lambda Tests is shown 0.526; it specifies an optimistic impression on employee high level of satisfaction from our survey. The test is conducted within each dimensions which they hope to measure to improve work performance in a systematic way at an industrial complex.
VI. Limitations of the Study
The first limitation of the current study is that the record gathering was limited to only in all around Theni. The study must be prolonged to low level and middle level executives excluding top management executives. The limitation of the study is self-report data. This study is subject to the usual limitations like all fields of survey research. There are a number of areas which are related to the present study and where future studies can be conducted.
VII. Implications and Suggestions
This study shows that proper and systematic training must be evaluated in the organization. A proper technical handling mechanism should be adopted where the employees feel free to raise their voices. Handling skills, Staff training and growth is essential to the existence and survival of organisations as it enables employees to acquire the relevant professional skills and knowledge for actual performance. Proper training is not sufficient to low level employees. Moreover need general training how to solve technical problems while handling e-platforms.
VIII. Conclusion
This paper proves that operational work place problems and specific technical problems faced by the workers while doing their work. The technological innovation and growth and execution levels in medium scale textile industries are highly nonaggressive. Now a day’s technology plays into MIS, HRMS and E-Platforms in developing and sharing knowledge. In organisation there having positive and negative effects in the working phenomenon. The present subject denotes the both effects of new technology variations. Mainly e-platforms may affect low level employees while handling systems. It shows the negative level of job satisfaction. Whereas handling systems everyday make it as practical. The results of regression analysis revealed that the two practices, Handling System and Technical Skills are negative impact on the performance of employees. The remaining elements have an optimistic impression. Therefore all transitional elements organization culture, organization structure, technology should always be considered together. New tools and new platforms are implementing in all areas of sub systems but workers are unable to tackle the tools and techniques. Training given to employees how to use but should fail to stretch how to rectify it. Technology is deliberated an advanced and pervasive phenomenon of employees. The researchers recommend that the organization must develop the weak areas of E-platforms. However correlation analysis indicated that there is weak and inverse relationship of technical skills for each employee. Identifying the employee is suitable for a particular task or activity by using the listing skills and capability mapping. This study concludes that the technological development and implementation levels in medium scale textile industries through the innovative changes is particularly nonaggressive and for reestablishment. We attained utmost benefits while using HRMS, E-Platforms, MIS, ERP effectively and well organized manner which we attained the satisfaction levels.
References
1. Balasundaram Nimalathasan (2012), “Satisfaction and Employees work performance: A case study of peoples bank in Jaffna peninsula”, International Journal of Research in Commerce & Management, vol. 3, Issue no.7, July (2012).
ASDF Thailand Proceedings of the International Congress 2014 [IC 2014], Bangkok, Thailand 29
Int Congress 2014 ISBN : 978-81-929742-3-1 www.intcongress.com

2. Bird, A. (1994), “Careers as repositories of knowledge: a new perspective on boundary less careers”, Journal of Organizational Behavior, Vol. 15, 325–344.
3. Broderick, R & Boudreau, J.W (1992), “Human Resource Management, Information Technology and the Competitive Edge”, Academy of Management Executive, Vol. 6, No. 2, May, 1992.
4. Clausen, T.S., Jones, K.T. and Rich, J.S. (2008), “Appraising employee performance evaluation systems”, The CPA Journal, Vol. 78 No. 2, pp. 64-7.
5. Davenport, T.H. and Prusak, L. (1998), “Working Knowledge – How Organizations Manage What They Know”, Harvard Business School Press.
6. Dauda Abdulsalam & Mohammed Abubakar Mawoli (2012), “Motivation and Job Performance of Academic Staff of State Universities in Nigeria: The Case of Ibrahim Badamasi Babangida University, Lapai, Niger State”, International Journal of Business and Manegement, Vol. 7, No. 14.
7. Dr. Vijaysinh M. Vanar (2012), “Employees Satisfaction and Industrial Relations – A Study of selected Industrial Units of Ahmedabad and Anand Districts, International Journal of research in Commerce & Management, Vol. 7, No. 5; March 2012.
8. Godse, A. and Thingujam, N.S. (2010), “Perceived emotional intelligence and conflict resolution styles among information technology professionals: testing the mediating role of personality”, Singapore Management Review, Vol. 32, pp. 69-83.
9. Kalpana Rathore Solanki (2013), “Flextime association with job satisfaction, work productivity, motivation & employees stress levels”, Journal of Human Resource Management, Vol 1(1), pp: 9-14
10. Laxminarayana, B. (2012), “HRM Practices on Performance of Non-Academic Employees”, International Journal of Research in Commerce & Management, Vol. 3 No. 7, July 2012.
11. Lengnick-Hall, Mark L. and Moritz Steve (2003), “The Impact of e-HR on the Human Resource Management Function”, Journal of Labor Research. 24(3), pp. 365-379.
12. Mohammad Jasim Uddin, Rumana Huq Luva & Saad Md. Maroof Hossian, “Impact of Organizational Culture on Employee Performance and Productivity: A Case Study of Telecommunication Sector in Bangladesh, International Journal of Business and Management, Vol. 8, No. 2; 2013
13. N.Mallika, Dr.M.Ramesh (2012), “Job Satisfaction in Banking: A study of Private and Public sector banks”, International Journal of Management (IJM), Vole 2, No 3, 2012
14. Raheel Mumtaz, Bashir Ahmed(2011), “Impact of Top Management Ethical Behavior on Job Satisfaction: Evidence from Pakistan”, Research Journal of Finance and Accounting, Vol 2, No 3, 2011
15. Wael Mohd, Raed A. Momani (2013), “Impact of Environmental Dynamism on Marketing Strategy Comprehensiveness and Organizational Performance”, International Journal of Business and Management, Vol. 8, No. 9; 2013.
ASDF Thailand Proceedings of the International Congress 2014 [IC 2014], Bangkok, Thailand 30
Int Congress 2014 ISBN : 978-81-929742-3-1 www.intcongress.com

Influence of Corporate Governance Practices on Firm Performance in India: A Study on Structural
Equation Model Analysis Karpagam Venkatraman1, Murugesan Selvam2 & Raja Mariappan3
1Ph.D Research Scholar, 2Professor and Head, Department of Commerce and Financial Studies, Bharathidasan University, Tiruchirappalli, Tamil Nadu, India
3Assistant Professor and Head, Department of Commerce, Bharathidasan University Constituent College, Lalgudi, Tamil Nadu, India
Abstract: Corporate Governance identifies the role and responsibilities as well as the rights of the company. Investors believe that a company, with good corporate governance, would perform well over a period of time and that effective governance could reduce the risks and attract further investment. The objective of the study is to examine the influence of Corporate Governance Practices on Firm’s Performance. The paper analyzed board variables and financial performance of listed companies in the National Stock Exchange (CNX Midcap), using Structural Equation Modeling (SEM) during the study period. The study suggests that the corporate governance mechanism, which included Tobin’s Q, Insider Ownership and Board Independence, is crucial for better performance of firms. Therefore, good governance structures must be designed and implemented to improve the quality of monitoring the board decisions and for enhancing the performance of Indian firms. Good Governance practices would result in an increase in the shareholders’ returns.
Key Words: Corporate Governance, Firm’s Performance, Tobin’s Q, Structural Equation Modeling
JEL Classification: G34, G32 and H23
1. Introduction
The concept of corporate governance identifies their role and responsibilities as well as their rights in the context of a company. Investors believe that a company, with good corporate governance, would perform over a period of time and that effective governance could reduce the risk and attract further investment (Agrawal.A and C.R.Knoeber, 1996). Good governance should address all issues that lead to value addition for the firm and protect the interests of all the stakeholders and shareholders. It is the system of structuring, operating and controlling a company with a view to achieving strategic goals for the benefit of shareholders, creditors, employees, customers and suppliers, complying with all the legal and regulatory requirements (Maria Maher and Thomas Anderson, 2000). In India, SEBI issued necessary guidelines for effective implementation of Corporate Governance. The details are briefly explained below.
1.1 Main Provisions of Clause 49 of SEBI Guidelines on Corporate Governance
Guidelines Objective Impact Board of Directors
Independence Overseeing
Professionalisation of directorial oversight, transparency of board remuneration and processes.
Audit Committees Risk Assurance Improvement of Quality of Financial Oversight and
thereby in Firm Performance. Subsidiary Companies Capital Protection Greater oversight of unlisted companies by Shareholders
of holding company. Disclosures Financial Better control mechanism being implemented for better
ASDF Thailand Proceedings of the International Congress 2014 [IC 2014], Bangkok, Thailand 31
Int Congress 2014 ISBN : 978-81-929742-3-1 www.intcongress.com

Transparency risk management processes. CEO/CFO
Certification Accountability Wider Ownership of Financial affairs of the company, leading to better oversight mechanism.
1.2 Effectiveness of the Board
The effectiveness of the board, which includes the following, is important for proper implementation of Corporate Governance.
Board Independence – The degree, to which board members are dependent on the current CEO or organization, is considered key to the effectiveness of board monitoring.
Board consisting primarily of insiders is considered to be less effective in monitoring because of their dependence on the organization (Sanjeev Gupta, 2013).
2. Review of Literature
The research studies already conducted on the firm’s performance under different periods are summarized below.
Ahmadu Sandu, et al, (2005) found that the boards, with a higher proportion of outside directors, performed better than other firms. Besides, there was evidence that firms run by expatriate CEOs achieved higher levels of performance than those run by indigenous CEOs. Ekta Selarka (2005) examined the corporate governance issues in emerging economies by studying the role of block holders in influencing the firm value. The study recorded the significant role played by these shareholders, with substantial voting power, in situations when equity holding is less than the shares in the hands of promoters. Neeraj Dwivedi and Roszaini Haniffa and Mohammed Hudaib (2006) examined the significant relationship between multiple directorships and market performance. It is found that duality role and managerial shareholdings were significantly associated with accounting performance. Badar Khalid Al Shabibi and Ramesh .G (2011) found that board independence, profitability, firm size and firm risk have an impact on the dividend policy decisions in the UK. The alternative ways for reducing agency cost problem were being explored as the economy in the UK was expanding day by day. Wan Fauziah Wan Yusoff and Idris Adamu Alhaji (2012) tested the structure of the board, particularly in relation to the structure of the decision making process, which needs to be transformed to enable companies to focus on sustaining high performance. The results found that the investors considered only governance practices that were important for their investment decisions. Karpagam .V, et al, (2013) studied that the ownership registered insignificant impact on performance measures, which implied that indicators were mainly affected by economic and market conditions rather than ownership concentration. The study suggested that investors, policy makers and stake holders are to be educated about the relationship between ownership structure and the performance of firms. Investors may take appropriate decision on the portfolio, after taking into account these pieces of information. Karpagam .V and Selvam .M (2013) studied the independent director’s added vales to the firm only under pressure from the stakeholders. Karpagam .V (2013) examined the performance and ownership structures of board of directors. The study indicated that independent directors were effective in monitoring managers and their independence should be strengthened. It is pertinent to mention that there was no conflicting evidence to show that directors destroyed the value of the firm. Velnampy .T and Pratheepkanth .P (2013) investigated the board structure and corporate reporting as the determinants of corporate governance that have a significant impact on ROA, ROE and NP as the measurements of firm performance. The study found that there was positive relationship between the variables of corporate governance and firm’s performance.
The above literature provides an overview of different models used to study the Ownership Structure and Corporate Performance from various parts of the world. There were a few comprehensive studies carried out on Indian Firm’s Performance and Corporate Governance Practice.
ASDF Thailand Proceedings of the International Congress 2014 [IC 2014], Bangkok, Thailand 32
Int Congress 2014 ISBN : 978-81-929742-3-1 www.intcongress.com

3. Statement of the Problem
Corporate Governance is the code of conduct by which the organization manages its corporate and business structure, its culture, policies and the manner in which it deals with various stakeholders. The key role for the growth of the organization is played by the board of directors. The success of any business firm mainly depends upon the good and effective corporate governance. In the corporate form of organization, there is always dominance by majority shareholders on the minority shareholders. But the shareholders, who are supposed to control, are unable to control the firms effectively and influence the decisions. Majority of shareholders, by exercising their voting rights, elect the directors and control majority of directors to determine the outcome of the firms. The good proportion of outside directors on the board is essential for good corporate governance. Outside Directors (non-executive directors), particularly independent directors, are mandated by law in order to protect the interests of minority shareholders and to increase the firm profitability and its value in the long run. Hence the corporate governance and effective implementation are essential to protect the interests of all types of stake holders. Besides, the evaluation on implementation of Corporate Governance should be made on a periodical basis to study its influence on the performance. Against this background, the present study entitled, “Influence of Corporate Governance Practices on Firm Performance: A Study on Structural Equation Model Analysis”, was undertaken.
4. Need for the Study
The firm performance is affected by corporate governance practices of sample companies in India because the success or failure of corporate governance is dependent on the extent to which they are managed efficiently. The study is useful for the corporates to perform accounting, auditing and corporate reporting in tune with the global standards. It is beneficial for the companies to enhance the corporate strategy, financial integrity of their organisations and to protect the interests of all the stakeholders including creditors, investors, policy makers, apex regulating bodies and the economy as a whole. Since the governance practices contribute to the enhancement of the value of listed companies in NSE, the study aimed to explore the efficacy of corporate governance mechanism which affects the performance of firm resulting in transparent accountability to shareholders and other stakeholders through appropriate corporate reporting which develops the value of listed companies in India. It also helps the firms to attract low cost investment by attracting investors and improving creditors’ confidence, both nationally and internationally. It increases firms’ responsiveness to the needs of the society and results in improving long-term performance.
5. Objectives of the Study
The present study examines the influence of Corporate Governance Practices on Firm’s Performance of the CNX Midcap companies listed firms in NSE.
6. Hypotheses of the Study
The present study tested the following null hypotheses.
NH1: There is no significant relationship between Corporate Governance Practices and Firm’s Performance. NH2: There is no impact of Corporate Governance Practices on Firm’s Performance.
Formulation of Model
Figure-1 shows the model on the relationship between Corporate Governance Variables and Firm Performance. This model was developed based on the above hypotheses. The study focused on the relationship between Corporate Governance Variables and Performance of CNX Midcap firms in India.
ASDF Thailand Proceedings of the International Congress 2014 [IC 2014], Bangkok, Thailand 33
Int Congress 2014 ISBN : 978-81-929742-3-1 www.intcongress.com

Figure-1: Model of Corporate Governance Variables and the Firm’s Performance
7. Methodology of the Study
7.1 Sample Selection
The Indian Stock Market is one of the most dynamic and efficient markets in Asia. Similarly, NSE is one of the top stock exchanges in India. Hence the sample for this study includes CNX Midcap companies listed on the National Stock Exchange. Out of 100 companies, only 50 companies were selected based on the value of Market Capitalization (refer Annexure-1). Only those companies that earned high values of market capitalization, were selected for the study.
7.2 Source and Collection of Data
The study mainly depended on secondary data. The required data regarding annual financial statements of sample companies were collected from the CMIE Prowess Corporate Database and www.nseindia.com. The other relevant details for this study were collected from various books, journals and magazines.
7.3 Period of the Study
The study analyzed the financial statement of CNX Midcap companies from 1st January 2008 to 31st December 2013.
7.4 Tools Used in the Study
The present study used the following tools.
a) Descriptive Statistics like Mean, Standard Deviation, Minimum, Maximum, Kurtosis and Skewness. b) Financial Ratios like Return on Asset (ROA), Earnings Per Share and Tobins Q were also used. c) Cross Correlation
The following equation was used to calculate the Cross Correlation
r =푛(∑푥푦)− (∑푥)(∑푦)
푛(∑푥 − (∑푥) )(푛∑푦 − (∑푦)²)
Where, N = Number of observations
Σx = Dependent variables, and Σy = Independent variables
ASDF Thailand Proceedings of the International Congress 2014 [IC 2014], Bangkok, Thailand 34
Int Congress 2014 ISBN : 978-81-929742-3-1 www.intcongress.com

a. Structural Equation Modeling
A measure of the amount of change in the variable expected, given a one unit change in the causal variable and no change in any other variable. Although a regression coefficient, this coefficient may not be estimable by multiple regression.
X3 = aX1 + bX2 + U1
X4 = cX1 + dX2 + eX3 + U2
Where, X3 and X4 are endogenous (i.e., caused), X1 and X2 are exogenous (not caused), and U1 and U2 are disturbances.
Table-1: The Variables used in the Study
Name of the Variables Abbreviation Measure of Variables
Return on Asset ROA Return on Asset (Net Income /Total Asset) Return on Asset ROE Return on Equity (Net Profit/Shareholders Equity)
Tobin’s Q Tobin’s Q Year-end market capitalization divided by the book value of total
assets and the sum of the market value of equity and the book value of debt divided by the book value of total assets.
Firm Size FSIZE Number of years of establishment of the firm Board
Independence BOIND Independent directors/Number of directors
Insider Ownership INOWN Percentages of promoters or promoter group ownership in firm.
Outside Director OUTDC Number of non-executive directors divided by the total number of
directors on the board.
8. Limitations of the Study
The present study suffers from the following major limitations.
1. The non-availability of complete ownership data of companies was a constraint in the assessment of ownership structure.
2. Many factors influence performance and not all of them could be controlled. 3. To test the governance practice and performance of companies, it may be necessary to collect data
for a longer time horizon. 4. This study used the statistical tools which have certain inherent limitations.
9. Analysis of Corporate Governance Practices and the Performance of Firms
For the purpose of this study, the analysis was made as follows;
a) Descriptive Statistics for Corporate Governance Practices and the performance of CNX Midcap Firms. b) Cross Correlation for Corporate Governance Practices and the Performance of CNX Midcap Firms. c) Structural Modeling Equation (SME) of CNX Midcap Firms.
a) Descriptive Statistics for Corporate Governance Practices and the Performance of CNX Nifty Firms
ASDF Thailand Proceedings of the International Congress 2014 [IC 2014], Bangkok, Thailand 35
Int Congress 2014 ISBN : 978-81-929742-3-1 www.intcongress.com

Table-2 reveals the results of Descriptive Statistics for the performance of sample companies listed in CNX Midcap and Corporate Governance Practices during the study period from 1st January 2008 to 31st December 2013. It is to be noted that the performance of sample companies was measured with reference to Return on Asset (ROA), Return on Equity (ROE) and Tobin’s Q as these are considered as the important parameters to measure the firms’ performance. The mean value of Tobin’s Q was 16.4094 while its standard deviation was at 26.9683. The values of ROA (0.7383) and ROE (5.8679) were lower than that of other parameters during the study period. It indicates the fact that the Tobin’s Q was a more important factor than the other two parameters (ROA and ROE) as far as the sample companies in India were concerned during the study period (2008 to 2013). Besides, the performance of sample companies was positively skewed in respect of ROA (1.1841), ROE (5.2244) and Tobin’s Q (2.2467). The results of Kurtosis (ROA with 4.1112, ROE with 3.2670 and Tobin’s Q with 6.8341) were leptokurtic distribution over the level of three. It is understood from the analysis of kurtosis that all the three variables taken for this study were not perfectly skewed in a normal bell curve.
The Table also reveals the results of descriptive statistics in respect of four Corporate Governance Variables, namely, Firm Size (FSIZE), Board Independence (BOIND), Insider Ownership (INOWN) and Outside Directors (OUTDC). The analysis of the Table shows the fact that the mean proportions of Insider Ownership (57.6143) was higher than the values of other three variables - FSIZE (7.6993), BOIND (0.6318) and OUTDC (0.6085). The value of standard deviation for Insider Ownership was 16.3892, followed by Firm Size (2.6997), Board Independence (0.2114) and Outside Directors (0.1581). The highest mean value for INOWN (57.6143) clearly reflects the fact that Board of Directors of most sample companies in India comprised of majority of promoters and directors as members. The number of insider ownership ranged from a minimum value of 16.9840 to a maximum value of 85.4000. According to the Table, the board variables were negatively skewed in respect of FSIZE (-0.1645), BOIND (-1.4898), INOWN (-0.3951) and OUTDC (-1.2436). Besides, the results of kurtosis for two variables, namely, FSIZE (2.3669) and INOWN (2.6087) were platykurtic while two variables, namely, BOIND (4.7975) and OUTDC (6.0165) were leptokurtic during the study period.
b) Cross Correlation for Corporate Governance Practices and the Performance of CNX Midcap Firms
Table-3 gives the results of Cross Correlation for Corporate Governance Practices and the Performance of CNX Nifty companies in India for a period from 1st January 2008 to 31st December 2013. An attempt has been made here to study whether there was relationship between the Dependent Variables (namely ROA, ROE and Tobin’s Q) and Independent Variables (like FSIZE, BOIND, INOWN and OUTDC). The Table clearly reveals the fact that out of seven variables (28 sets of variables), only three sets were significant and recorded positive relationship between INOWN – Tobin’s Q (0.323) and its two tailed p-value was 0.029 at 5% level. Besides, there was strong significant relationship between sets of variables like Tobin’s Q – ROA (0.447) and BOIND – FSIZE (0.424) at 1% significant level while their p-values were 0.002 and 0.003 respectively during the study period.
From the analysis of the Table, it is inferred that there was no significant relationship between the corporate governance practices and firms’ performance as far as the sample companies were concerned in India. Hence the null hypothesis (NH1), namely, There is no significant relationship between Corporate Governance Practices and Firms’ Performance, is rejected. It is to be noted that the other sets of independent variables (25 sets), as given in the Table, were insignificantly correlated at 1% and 5% significant levels. Hence the Null Hypothesis (NH1) in respect of 25 sets of variables (ROE - ROA, Tobin’s Q - ROE, FSIZE - ROA, FSIZE - ROE, FSIZE - Tobin’s Q, BOIND - ROA, BOIND - ROE, BOIND - Tobin’s Q, INOWN - ROA, INOWN - ROE, INOWN - FSIZE, INOWN - BOIND, OUTDC - ROA, OUTDC - ROE, OUTDC - Tobin’s Q, OUTDC - FSIZE, OUTDC - BOIND and OUTDC – INOWN) was accepted during the study period. It is suggested that shareholders may carefully take their investment decisions after taking into consideration the above information.
ASDF Thailand Proceedings of the International Congress 2014 [IC 2014], Bangkok, Thailand 36
Int Congress 2014 ISBN : 978-81-929742-3-1 www.intcongress.com

c) Analysis of Structural Modeling Equation (SME) of CNX Midcap Firms
Table-4 shows the overall Structural Equation Modeling (SEM) for sample companies during the study period from 1st January 2008 to 31st December 2012. It is to be noted that the analysis of unstandardized regression coefficient clearly reveals the amount of change in the dependent or mediating variable for each one unit change in the independent variable.
According to the results of Structural Equation Modeling (SEM) for sample companies as given in Table-4, the Critical Ratio was the highest for the factor of Outside Directors on Tobin’s Q. The probability value of critical ratio (2.416) was absolute, which is less than 0.05. In other words, the regression weight for Tobin’s Q in the prediction of Outside Directors (OUTDC) is significantly different from zero at 5% level (two-tailed test). It is to be noted that in the case of the next highest set (INOWN on Tobin’s Q, BOIND on ROE and BOIND on Tobin’s Q) its critical ratio was 1.095, 0.262 and 0.050 (absolute value), which is less than 0.053, 0.001 and 0.007 at 1% and 5% significant level.
It is observed that sample variables like OUTDC on ROA and FSIZE on Tobin’s Q earned negative critical values (-0.106 and -0.778) and the absolute value is less than 0.001 while the other set of variables (FSIZE on ROA, BOIND on ROA, INOWN on ROA, FSIZE on ROE, INOWN on ROE, OUTDC on ROE) were greater at 5% significant level. . The regression weights for ROA and ROE were insignificant at 1% level. It indicates the fact that the OUTDC on Tobin’s Q was a more important variable than the other sample variables (FSIZE, BOIND and INOWN) considered for this study.
The results of Structural Equation Modeling (SEM) model which is fit to study are shown in Table-5. It is to be noted that the values of all the variables were less than the suggested value of 0.05. According to the Table, the value of chi square test was 23.410, with 9 degrees of freedom and a probability of less than 0.005 (p < 0.001). This reveals the fact that the data fit the hypothesized model. The result of Goodness of Fit Index (GFI) reveals the value of 1.000 at 90% confidence intervals (greater than 0.90) while the value (0.001) of Root Mean Square Residual (RMR) was less than 10% (less than 0.10) significant level. It is clearly understood that the values of CFI and RMSEA were good. Thus there was goodness of fit. Hence the null hypothesis (NH2), namely, - There is no impact of Corporate Governance Practices on Firms’ Performance, is rejected for the period from 2008 to 2013.
Figure-2 clearly displays the results of Structural Equation Modeling (SEM) in respect of model on the relationship between Corporate Governance Variables and the Performance of sample CNX Midcap companies in India from 2008 to 2013. It is understood from the Figure that only two sets of variables, namely Board variables on ROE and Tobin’s Q were significant at 1% level. The analysis of ROA shows that only one sample variable, namely, OUTDC (0.001) was significant at 1% level. The other three variables, namely, Firm Size (0.143), Board Independence (0.118) and Insider Ownership (0.443) were insignificant (values were greater than 0.001). Investors may carefully note this information and take investment decisions accordingly.
10. Suggestions of the Study
In the light of the analysis of this study and discussion with experts and corporate officials, the following suggestions are offered for the effective implication of corporate governance in India.
1. It is suggested that the role and responsibilities of directors on various committees (such as Ownership Structure, Directors Remuneration, Shareholder Information and Grievances Committee of Companies) have to be clearly defined so that the performance of firms in India would be enhanced in the long run.
2. The market value of Indian firms may grow with a greater proportion of independent directors in the board. However, the promoters who are the owners and controllers of Indian companies,
ASDF Thailand Proceedings of the International Congress 2014 [IC 2014], Bangkok, Thailand 37
Int Congress 2014 ISBN : 978-81-929742-3-1 www.intcongress.com

negatively impact the performance of independent directors. Hence the policy makers have to try to find a suitable board model for Indian companies and define the role of independent directors.
3. Policy makers and other stake holders may take appropriate steps to improve the effective implementation of corporate governance in India. The retail investors may note this information while investing their hard earned money in the stocks of the sample firms.
4. The investment opportunities of firms in these markets that raised the incentives of controlling shareholders to expropriate minority shareholders. The large separation between ownership and control rights that arises from the use of pyramidal ownership structure in these markets suggests that insiders have both the incentives and the ability to engage in expropriation.
11. Discussion and Conclusion
The present study investigated the influence of corporate governance practices on the performance of sample companies in India. The results of this study confirmed that good corporate governance is an important factor in determining and enhancing the firm performance. Many business failures are linked to the board’s inability to enhance the overall performance of firms in an effective and consistent manner. The correct structure of the board for best decision making needs to be in place and this would enable the companies to focus on sustaining high performance in the face of a rapidly changing business atmosphere. Therefore, good governance structures must be designed and implemented to improve the quality of monitoring the board decisions and for enhancing the performance of Indian firms. Good Governance Practices would result in an increase in the shareholders returns.
According to the results of earlier research studies undertaken by Agrawal .A & Knoeber, C. R (1996), Badar Khalid Al, Shabibi, & Ramesh, G. (2011), Wan Fauziah Wan Yusoff, & Idris Adamu Alhaji (2012) and Karpagam.V. & Selvam.M (2013), there was no significant relationship between Corporate Governance Practices and Firm’s Performance. In the same way, the present study also confirmed the findings of these studies. However, there are few other studies undertaken earlier by Ahmadu Sandu, Aminu S Mikailu, & Tukur Garba (2005), Maria Maher, & Thomas Andersson (2000) and Velnampy .T & Pratheepkanth .P (2013), which found that there was significant relationship between Corporate Governance Practices and Firm’s Performance. The present study did not confirm the findings of these studies.
12. Scope for Further Research
The following are pointers towards further research.
1. The study with similar objectives could be made with reference to other indices. 2. Similar research study could be made for longer period. 3. A study could be made with other variables like Audit Committee, CEO Duality, Remuneration,
Corporate Reporting, Leadership Structure etc., 4. Corporate Governance variables could be calculated by using Score Card Method. 5. A research study may be conducted in India to investigate the impact of Corporate Governance
Practices/Factors on Ownership Structure.
Reference
1. Agrawal, A., & Knoeber, C. R., (1996). Firm Performance and Mechanisms to Control Agency Problems between Managers and Shareholders. Journal of Financial and Quantitative Analysis, 31(3), 377-97.
2. Ahmadu Sandu, Aminu S Mikailu, & Tukur Garba. (2005). Corporate Governance Mechanisms and Firm Financial Performance in Nigeria. African Economic Research Consortium, 1-41.
3. Badar Khalid Al, Shabibi, & Ramesh, G. (2011). An Empirical Study on the Determinants of Dividend Policy in the UK. International Research Journal of Finance & Economics, 80, 105-120.
ASDF Thailand Proceedings of the International Congress 2014 [IC 2014], Bangkok, Thailand 38
Int Congress 2014 ISBN : 978-81-929742-3-1 www.intcongress.com

4. Bentler, P. M., & Chou, C. P., (1987). Practical Issues in Structural Modeling. Sociological Methods and Research, 16(1), 78-117.
5. Ekta Selarka. (2005). Ownership Concentration and Firm Value: A Study from Indian Corporate Sector. Emerging Markets Finance and Trade, 41(6), 1-28.
6. Karpagam, V. (2013). Impact of Corporate Governance Factors on the Firm Performance of NSE Listed Companies in India. SMART Journal of Business Management Studies, 9(2), 72-87.
7. Karpagam, V., & Selvam, M. (2013). Impact of Corporate Governance Mechanism and Firm Performance with Special Reference to BSE Listed Companies in India. (Electronic Copy Available at http://ssrn.com/abstract=2247877).
8. Karpagam, V., Selvam, M., & Babu, M. (2013). Impact of Ownership Structure on Corporate Performance with Special Reference to BSE Listed Companies. International Journal of Accounting and Financial Management Research, 3(1), 133-140.
9. Maria Maher, & Thomas Andersson. (2000). Corporate Governance: Effects on Firm Performance and Economic Growth. (Electronic Copy Available at: http://ssrn.com/abstract-218490).
10. Neeraj Dwivedi, & Arun Kumar Jain. (2005). Corporate Governance and Performance of Indian Firms: The Effect of Board Size and Ownership. Employee Responsibilities and Rights Journal, 17(3), 161-172.
11. Roszaini Haniffa, & Mohammed Hudaib. (2006). Corporate Governance Structure and Performance of Malaysian Listed Companies. Journal of Business Finance and Accounting, 33(7), 1034-1062.
12. Sanjeev Gupta. (2013). Corporate Frauds: Dimensions and Governing Legislatives. Indian Management, 52(8), 85-97.
13. Velnampy, T., & Pratheepkanth, P. (2013). Corporate Governance and Firm Performance: A Study of Selected Listed Companies in Sri Lanka. European Journal of Commerce and Management Research, 2(6), 123-127.
14. Wan Fauziah Wan Yusoff, & Idris Adamu Alhaji. (2012). Corporate Governance and Firm Performance of Listed Companies in Malaysia. Trends and Development in Management Studies, 1(1), 43-65.
Websites
www.google.com www.googlescholar.com www.investopedia.com www.jcc-ugcinfonet.in www.moneycontrol.com www.nseindia.com
Table-2: Analysis of Descriptive Statistics for Corporate Governance Practices and the Performance of CNX Midcap Firms from 1st January 2008 to 31st December 2013
ROA ROE TOBIN’S Q FSIZE BOIND INOWN OUTDC Mean 0.7383 5.8679 16.4094 7.6993 0.6318 57.6143 0.6085
Std. Dev. 0.6475 12.5480 26.9683 2.6997 0.2114 16.3892 0.1581 Maximum 2.8342 82.8368 102.1296 13.1667 0.8950 85.4000 0.8604 Minimum 0.0350 4.1881 0.1175 1.6667 0.0000 16.9840 0.0000 Skewness 1.1841 5.2244 2.2467 -0.1645 -1.4898 -0.3951 -1.2436 Kurtosis 4.1112 3.2670 6.8341 2.3669 4.7975 2.6087 6.0165
Source: Collected from Prowess Database and Computed using E-Views (6.0)
Note: ROA- Return on Asset, ROE-Return on Equity, FSIZE-Firm Size, BOIND-Board Independence, INOWN-Insider Ownership, OUTDC-Outside Directors.
ASDF Thailand Proceedings of the International Congress 2014 [IC 2014], Bangkok, Thailand 39
Int Congress 2014 ISBN : 978-81-929742-3-1 www.intcongress.com

Table-3: Analysis of Cross Correlation for Corporate Governance Practices and the Performance of CNX Midcap Firms from 1st January 2008 to 31st December 2013
ROA ROE TOBIN’SQ FSIZE BOIND INOWN OUTDC ROA Pearson Correlation 1.000
Sig. (2-tailed) . ROE Pearson Correlation -0.038 1.000
Sig. (2-tailed) 0.800 . TOBIN’SQ Pearson Correlation 0.447** 0.086 1.000
Sig. (2-tailed) 0.002 0.570 . FSIZE Pearson Correlation 0.150 0.228 0.004 1.000
Sig. (2-tailed) 0.321 0.127 0.981 BOIND Pearson Correlation 0.228 0.030 0.112 0.424** 1.000
Sig. (2-tailed) 0.127 0.843 0.459 0.003 . INOWN Pearson Correlation 0.141 -0.078 0.323* 0.160 0.256 1.000
Sig. (2-tailed) 0.351 0.605 0.029 0.287 0.086 . OUTDC Pearson Correlation -0.036 -0.102 0.100 0.009 0.086 0.158 1.000
Sig. (2-tailed) 0.812 0.498 0.509 0.955 0.568 0.294 .
**Correlation is significant at the 0.01 level (2-tailed), *Correlation is significant at the 0.05 level (2-tailed)
Sources: Collected from Prowess Corporate Database and Computed using SPSS (16.0)
Table-4: Results of Structural Equation Modeling (SEM) for Analysis of Sample Companies from 1st January 2003 to 31st December 2012
Factor Estimate S.E C.R P FSIZE <---------ROA 0.870 0.594 1.465 0.143 BOIND<---------ROA 0.074 0.047 1.561 0.118 INOWN<---------ROA -0.027 0.036 -0.767 0.443 OUTDC<---------ROA -0.378 3.549 -0.106 0.001* FSIZE <---------ROE 0.053 0.031 1.726 0.084 BOIND<---------ROE 0.001 0.002 0.262 0.001* INOWN<---------ROE -0.002 0.002 -0.822 0.411 OUTDC<---------ROE -0.141 0.183 -0.771 0.441
FSIZE <---------Tobin’s Q -0.011 0.014 -0.778 0.005* BOIND<--------- Tobin’s Q 0.000 0.001 0.050 0.007** INOWN<--------- Tobin’s Q 0.001 0.001 1.095 0.053** OUTDC<--------- Tobin’s Q 0.206 0.085 2.416 0.016**
Source: Collected from Prowess Corporate Database and computed using AMOS-20 Software
Note: *significant at 1% level, **significant at 5% level
Table-5: Results of Structural Equation Modeling (SEM) Model Fit for the Corporate Governance Variables and the Performance of CNX Nifty Firms from 1st January 2008 to 31st December 2013
Model Fit Value CMIN (Chi-square test) 23.410
ASDF Thailand Proceedings of the International Congress 2014 [IC 2014], Bangkok, Thailand 40
Int Congress 2014 ISBN : 978-81-929742-3-1 www.intcongress.com

P-value 0.005*** GFI 1.000
RMR 0.001
Source: Computed from Table-4 using Amos-20 Software
Note: *** significant at 1% level
Figure-2: Relationship between Corporate Governance Variables and Performance of Firms from 1st January 2008 to 31st December 2013
Source: Computed from Table-4 using Amos-20 Software
Annexure-1
Name of the Sample CNX Midcap Companies in NSE as on 1st January 2008 to 31st December 2013
S.No List of the Companies S.No List of the Companies 1 A B B Ltd. 26 I R B Infrastructure Developers Ltd. 2 Adani Power Ltd. 27 Indian Bank 3 Aditya Birla Nuvo Ltd. 28 Indian Hotels Co. Ltd. 4 Allahabad Bank 29 Jain Irrigation Systems Ltd. 5 Andhra Bank 30 Lanco Infratech Ltd. 6 Apollo Hospitals Enterprise Ltd. 31 Marico Ltd. 7 Bharat Electronics Ltd. 32 Motherson Sumi Systems Ltd. 8 Bharat Forge Ltd. 33 Mphasis Ltd. 9 Biocon Ltd. 34 N H P C Ltd. 10 Britannia Industries Ltd. 35 Oil India Ltd. 11 Cadila Healthcare Ltd. 36 Oracle Financial Services Software Ltd. 12 Corporation Bank 37 Piramal Enterprises Ltd. 13 Cummins India Ltd. 38 Power Finance Corpn. Ltd. 14 Dish T V India Ltd. 39 Reliance Capital Ltd. 15 Divi'S Laboratories Ltd. 40 Sun T V Network Ltd.
ASDF Thailand Proceedings of the International Congress 2014 [IC 2014], Bangkok, Thailand 41
Int Congress 2014 ISBN : 978-81-929742-3-1 www.intcongress.com

16 Engineers India Ltd. 41 Suzlon Energy Ltd. 17 Essar Oil Ltd. 42 Syndicate Bank 18 Exide Industries Ltd. 43 Tata Chemicals Ltd. 19 G M R Infrastructure Ltd. 44 Tata Global Beverages Ltd. 20 Glenmark Pharmaceuticals Ltd. 45 Tech Mahindra Ltd. 21 Godrej Consumer Products Ltd. 46 Thermax Ltd. 22 Godrej Industries Ltd. 47 Torrent Power Ltd. 23 Hindustan Petroleum Corpn. Ltd. 48 Union Bank Of India 24 Housing Development & Infrastructure Ltd. 49 Unitech Ltd. 25 I D B I Bank Ltd. 50 United Phosphorus Ltd.
Source: www.nseindia.com
ASDF Thailand Proceedings of the International Congress 2014 [IC 2014], Bangkok, Thailand 42
Int Congress 2014 ISBN : 978-81-929742-3-1 www.intcongress.com

A Study on the Implications of NPA in PSB Banks with Reference to Home Loans
Dr. P. Anbuoli, P. Vijayalakshmi, Dr. A. C. Kannan
Faculty, Management Studies, Anna University, Regional Centre, Madurai Research Scholar, Management Studies, PSNA College of Engineering & Technology, Dindigul
Professor, Management Studies, KLN College of Engineering & Technology, Madurai
Abstract: Non-performing assets are one of the major concerns for banks in India. NPAs reflect the performance of banks. The NPAs growth involves the necessity of provision, which reduces the overall profits and shareholders value. An attempt is made in the paper what is NPA? The SWOT analysis of PSB, management of credit risk and measures to control the memance of NPAs are also discussed.
Key words: Gross NPA, Net NPA
1 Introduction of the Study
The three letters “NPA” Strike terror in banking sector and business circle today. NPA is short form of “Non-Performing Asset”. The dreaded NPA rule says simply this: when interest or other due to a bank remains unpaid for more than 90 days, the entire bank loan automatically turns a non performing asset. The recovery of loan has always been problem for banks and financial institution.
Definitions
A ‘Non-Performing Asset’ (NPA) was defined as a credit facility in respect of which the interest and/ or instalment of principal has remained ‘past due’ for a specified period of time.
Types of NPA A] Gross NPA B] Net NPA
Gross NPA:
Gross NPAs Ratio=
Net NPAs =
We have taken home loan and compared its performance and the total outstanding in the shames for the past 5 years and recorded the growth NPA.
Need of the Study
The many factors affect for the Non-Performing Assets. Non-Performing Asset is main important problem for the Bank so the bank interest to know the analyses the NPA. It is helpful to improve the bank.
ASDF Thailand Proceedings of the International Congress 2014 [IC 2014], Bangkok, Thailand 43
Int Congress 2014 ISBN : 978-81-929742-3-1 www.intcongress.com

1.5 Statement of the Problem
The State bank will always face the problem of NPA because of poor recovery of advances granted by the bank and several other reasons like adopting a poor recovery strategies so when the loan is not recovered from the bank effectively and efficiently that balance amount will become the NPA to the bank it may create some huge problem to the bank’s net profit.
1.6 Objectives of the Study
Primary Objective
To Analyze the Non-Performing Assets in State Bank of India Paramakudi Branch
Secondary Objectives
To evaluate Non Performing Assets level in different loan schemes. To Know the Impact of Non-Performing Assets. To Know the Reasons for NPA and to learn Preventive Measures.
Limitations of the Study
Since my study is based on the secondary data, the practical operations as related to the NPAs are adopted by the banks are not learned.
The project only projection for average information not for accurate information. Time constraints are one of the limitations of this study.
Sampling
The Sample of five years (2009-2013) Profit & Loss A/C, Balance Sheet was used to study the analysis of Non-Performing Assets in State Bank of India Paramakudi Branch.
Data Collection Method
Nature of Data
The data collected is secondary in nature. This is due to the nature of analysis, which only identify for secondary data.
Sources of Data
The data required of this study has collected from secondary source.
Profit & Loss A/C Balance Sheet Annual Report
Tools to be used
Non-Performing Assets Ratio analysis Trend Analysis Percentage analysis
ASDF Thailand Proceedings of the International Congress 2014 [IC 2014], Bangkok, Thailand 44
Int Congress 2014 ISBN : 978-81-929742-3-1 www.intcongress.com

Data Analysis and Interpretation Gross NPA
Gross NPAs Ratio=
Table showing the gross NPAs Ratio
Year Gross NPA in Crore Gross Advances Ratio
2008 – 2009 40599430 31422506 1.29
2009 – 2010 34210399 27189942 1.25
2010 – 2011 59786433 45602864 1.31
2011 – 2012 49000899 38055752 1.28
2012 – 2013 34124609 40621750 8.40
Source: Bank annual reports 2009-2013
This table shows that gross non-performing assets ratios. The gross NPA was high in the year 2012-2013(8.40), gross NPA very low in the year 2011-2012(1.28).
Table showing the gross NPA ratio
Net NPAs
Net NPAs =
Showing the net NPAs Ratio
Year Gross NPA Gross Advances provision Ratio
2008 – 2009 40599430 31422506 3734.57 1.29
2009 – 2010 34210399 27189942 4394.83 1.25
ASDF Thailand Proceedings of the International Congress 2014 [IC 2014], Bangkok, Thailand 45
Int Congress 2014 ISBN : 978-81-929742-3-1 www.intcongress.com

2010 – 2011 59786433 45602864 10381.34 1.31
2011 – 2012 49000899 38055752 13068.95 1.28
2012 – 2013 34124609 4062175 11130.83 8.40
Source: Bank annual reports 2009-2013
This table shows that net NPAs ratio. The high net NPAs ratio is 8.40(2012-2013), the low net NPAs ratio is 1.25(2009-2010).
Table showing the net NPA ratio
Net Worth to Total Assets Ratio
Net worth to total assets ratio = Shareholder’s Funds
Total Assets
Table no 4.2.3.1 Showing the Net Worth to Total Assets Ratio
Source: Bank annual reports 2009-2013
The above table shows that the shareholders fund involved on bank’s shares. The investment of the shareholders are gradually increasing during the year 2009 to 2012.The fund has been highest during the year 2013.
YEAR
SHAREHOLDERS FUND
TOTAL ASSETS
IN TIMES
2009 6022628 99010593 0.06
2010 8004130 150864566 0.05
2011 8292412 156220062 0.05
2012 8660589 176225197 0.05
2013 10567881 209271406 0.05
ASDF Thailand Proceedings of the International Congress 2014 [IC 2014], Bangkok, Thailand 46
Int Congress 2014 ISBN : 978-81-929742-3-1 www.intcongress.com

The Net Worth to Total Assets Ratio
4.3 Home Loan
Total amount outstanding for the past five years and their respective trend values for the home loans given by the branch.
Table showing the level of NPA in home loan
YEAR NPA PERCENTAGE INCREASE TREND VALUES
2009 1856643 0 1540309.4
2010 1981430 6.72 2101724.1
2011 2456120 23.95 266313.8
2012 2734139 11.31 3224553.5
2013 4287362 56.80 3785968.2
Source: Bank Annual Reports 2009-2013
This table shows that the Home loan for the past five years. In the year 2013, maximum percentage (56.80%) of home loan followed by 2011 is 23.95, 2012 is 11.31 and minimum percentage of 2010 is 6.72%.
ASDF Thailand Proceedings of the International Congress 2014 [IC 2014], Bangkok, Thailand 47
Int Congress 2014 ISBN : 978-81-929742-3-1 www.intcongress.com

Percentage of NPA in Home Loan
Percentage of amount outstanding in home loan
Showing the percentage of NPA in home loan
Year NPA Percentage
2009 1856643 0
2010 1981430 6.72
2011 2456120 23.95
2012 2734139 11.31
2013 4287362 56.80
Source: Bank Annual Reports 2009-2013
This table shows that the Home loan for the past five years. In the year 2013, maximum percentage (56.80%) of home loan followed by 2011 is 23.95, 2012 is 11.31 and minimum percentage of 2010 is 6.72%.
Showing the percentage of NPA in home loan
Findings, Suggestions and Conclusion
Findings
Gross NPA is high in the year of 2013(8.40) and low in the year of 2010(1.25) . Net NPA is high in the year of 2012(9.40) and low in the year of 2010(1.28). The NPA for the home loans during the year 2013 is high (56.80) when compare to the other year
of home loans.
5.3 Suggestions
Special accounts should be made of the clients where monthly loan concentration reports should be made.
The bank must analyze the current financial position of the major assets and liabilities.
ASDF Thailand Proceedings of the International Congress 2014 [IC 2014], Bangkok, Thailand 48
Int Congress 2014 ISBN : 978-81-929742-3-1 www.intcongress.com

Proper monitoring of the restructured accounts because there is every possibility of the loans slipping into NPAs category again.
Proper training is important to the staff of the bank at the appropriate level with ongoing process. That how they should deal the problem of NPAs, and what continues steps they should take to reduce the NPAs.
Bank should also form a special team to inspect the site of customer to ensure the source of deployment of funds while giving a home loan.
Bank should ensure that the loan given more than 5 lakhs has been insured. While giving loan bank must insist the borrower to keep his salary account in the branch itself
which can help the bank to recover the loan through standing instructions. Complete audit must be carried out to ensure that the documents submitted by the borrower are
original and it should ensure whether the borrower and the owner of the property are same.
Conclusion
It is not possible to eliminate totally the NPAs in the banking business but can only be minimized. It is always wise to follow the proper policy appraisal, supervision and follow-up of advances to avoid NPAs. The banks should not only take steps for reducing present NPAs, but necessary precaution should also be taken to avoid future NPAs. But in the case of SBI is one of the good sign that the campaign conducted by the regional office help in bringing down the NPA level.
References
1. Bardhan, P (1989). The Economic Theory of Agrarian Institutions. Oxford, NY: Claredon Press. 2. Bell, C and T N Srinivasan (1989). Some Aspects of Linked Products and Credit Market Contracts
among Risk Neutral Agents. In Pranab K Bardhan (ed), The Economic Theory of Agrarian Institutions. Oxford: Oxford University Press.
3. Battese, GE and T J Coelli (1995). A Model for Technical Inefficiency Effects in a Stochastic Frontier Production Function for Panel Data. Empirical Economics, 20 (2): 325-32.
4. Bonin J P and Yiping H (2001). Dealing with Bad Loans of the Chinese Banks. Working paper No. 357.
5. Chaitanya V Krishna (2004). Causes of Non-performing Assets in Public Sector Banks. Economic Research, 17 (1): 16-30.
6. Chakravarty, S (1985). Report of the Committee to Review the Working of the Monetary System. Mumbai: Reserve Bank of India.
7. Das Abhiman (2002). Risk and Productivity Change of Public Sector Banks. Economic and Political Weekly, 37 (5): 437-48.
8. Gang, I N (1995). Small Firms in India: A Discussion of Some Issues. In Mookherjee, D (eds), Indian Industry: Policies and Performance. New Delhi: Oxford University Press.
9. Ghosh, S (2005). Does Leverage Influence Bank’s Non-Performing Loan?: Evidences from India. Applied Economic Letters, 12 (15): 913-18.
10. Goldsmith, Raymond W (1969). Financial Structure and Development. Yale University Press.
ASDF Thailand Proceedings of the International Congress 2014 [IC 2014], Bangkok, Thailand 49
Int Congress 2014 ISBN : 978-81-929742-3-1 www.intcongress.com

UAtilize: Interactive Visualization & Analysis of Campus Building Utilization
Suphanut Jamonnak, Bharani Anne, Nikhil Preeth, En Cheng
Department of Computer Science, The University of Akron, Akron, OH
Abstract- With the increasing popularity of Google Maps, the integration of web services with Google Maps has recently attracted considerable attention. Using Google Maps JavaScript API v3, developers can build highly customizable maps with their own content and imagery. In this paper, UAtilize -- an Interactive Visualization & Analysis of Campus Building Utilization application using Google Maps and Google Fusion Tables is presented. UAtilize provides multiple functions and dynamic visualizations of campus building utilization data and Zipcard transaction data, leveraging the comprehensiveness, accuracy, and usability of Google Maps. UAtilize is capable to integrate and transform geographical data into a map. The primary goal of UAtilize is to assist several departments at The University of Akron, including Registrar Office, Parking and Transportation Services, Police Department, and Auxiliary Business Operations. With UAtilize, users can directly and interactively analyze the data using Google Charts and Google Visualization, instead of querying relational databases.
Keywords: Data Integration, Visualization & Analysis, Google Maps, Google Fusion Tables
I. Introduction
The invention of the Internet and the emergence of the World Wide Web revolutionized our daily lives. Thanks to advanced technologies such as computers, satellites, wireless sensors, tablets, smart phones, we have been collecting tremendous amounts of data on a daily basis, because we believe that information leads to success. More data has been created in the last three years than in all the past 40,000 years, the total amount data will quadruple in the next two years, said Stephen A. Brobst, chief technology officer of Teradata Corporation [1], at The Data Warehouse Institute (TDWI) [2] World Conference in 2012. The explosion of data requires the ability to store, secure, and manage the physical data, DAMA International [3] president John Schley said, but it also demands that the stored data be useful and meaningful. Efficient database management systems have been very important assets for storing and managing a large corpus of data and especially for efficient retrieval of particular information from a large collection whenever needed. Nowadays, we have far more data than we can handle: from scientific data and business transactions, to satellite pictures, electronic patient records and clinical reports. Information retrieval is simply not sufficient anymore for decision-making. Such a situation has given rise to the emergence of new needs including automatic summarization of data, extraction of the "essence" of information stored, discovery of patterns in raw data, and interactive visualization of data.
Recently, cloud-based services have been playing an important role in large-scale Web-based applications. Google Fusion Tables [4] is a cloud-based service for data management and integration. Launched in 2009, Fusion Tables has received considerable use. Fusion Tables enables users to upload tabular data files (spreadsheets, CSV, KML), currently of up to 250 MB space per table. It supports the integration of data from multiple sources by performing joins across tables that may belong to different users. Also, Fusion Tables has the ability to filter and aggregate the data and provides multiple ways of visualizing the data (e.g., charts, maps, and timelines). Google Maps [5] is one of the increasingly popular web mapping services which have been used in a wide range of areas including real estate, tourism, and weather forecast. Using Google Maps JavaScript API v3 [6], developers can build highly customizable maps with their own content and imagery. Google Maps provides geospatial visualization of information so that users can analyze and
ASDF Thailand Proceedings of the International Congress 2014 [IC 2014], Bangkok, Thailand 50
Int Congress 2014 ISBN : 978-81-929742-3-1 www.intcongress.com

understand the relationship between data and geographic location. It provides a novel option to visualize and analyze data.
In this paper, we present an interactive visualization & analysis of UA campus building Utilization application, named UAtilize, using Google Fusion Tables and Google Maps. The primary goal of UAtilize is to assist several departments at The University of Akron (UA) [7], including Registrar Office, Parking and Transportation Services, Police Department, and Auxiliary Business Operations. UAtilize provides multiple functions and dynamic visualizations of campus building utilization data and Zip Card transaction data, leveraging the comprehensiveness, accuracy, and usability of Google Maps. UAtilize is capable to integrate and transform geographical data into a map. With UAtilize, users can directly and interactively analyze the data using Google Charts and Google Visualization, instead of querying relational databases. For example, Parking and Transportation Services can easily estimate the campus traffic and schedule parking space accordingly with the dynamic visualizations of campus building utilization provided by UAtilize. Another example, in case of campus emergencies, policy department can use UAtilize to analyze each building’s priority and take actions effectively.
The remainder of this paper is structured as follows: Section II presents an overview of UAtilize; Section III describes the system architecture of UAtilize; Section IV discusses each component in detail; Section V provides technical implementations, and Section VI concludes with discussions and some future work.
II. An Overview of UAatilize
UAtilize is primarily designed to visualize class enrollment data and Zip Card transaction data. UAtilize is a Web-based application which has two main components: 1) interactive visualization & analysis of campus building utilization; 2) interactive visualization & analysis of Zip Card utilization. Users can access UAtilize on their computers, tablets, and smart phones. UAtilize supports both traditional web browsers and mobile web browsers. For mobile web browsers, it automatically resizes its interface for the browser window using responsive actions of web application.
For the campus building utilization component, UAtilize visualizes the student intensity on each location in UA. Registrar Office at UA provided the class enrollment data for the semester of Spring 2014 to assist this project. A snapshot of this component is shown in Figure 1. Users can easily obtain the information about the number of students in each building at a certain time period. UAtilize provides options for users to choose the time period by selecting hour of day, day of week, and time of day. UAtilize visualizes the student intensity by creating a marker on each location. Users can click on each location to see the total number. In addition, UAtilize also provides building images for easy recognition.
Figure 1. A snapshot of Campus Building Utilization
ASDF Thailand Proceedings of the International Congress 2014 [IC 2014], Bangkok, Thailand 51
Int Congress 2014 ISBN : 978-81-929742-3-1 www.intcongress.com

Figure 2 A snapshot of Zip Card Utilization by locations The Zip Card is the official UA identification card. It provides easy access to UA resources and packs a multitude of campus community applications in one convenient card. The Zip Card has multiple uses: Library services; Entrance to campus buildings; fitness facilities and labs; Admittance to University athletic events; Dining plan spending; Dining and All Campus account spending; Zip Print at campus computer labs. The Auxiliary Services at UA provided de-identified Zip Card transaction data in the year of 2012 to support this project. Each card holder ID has been encrypted when the data is provided for UAtilize.
For Zip Card utilization component, UAtilize first integrates transaction data and building location data using Google Fusion Tables. Then, it provides interactive visualizations of the total transaction amount for all applicable locations, such as Library, student union, and recreation center, using Google Maps and Google Chart APIs. A snapshot of this component is shown in Figure 2. The outcome of the Zip Card Analytics system can help end users know about the usage patterns of Zip Card at vendors/events accepting zip cards. The vendors and the event managers can plan their business or events accordingly.
Figure 3. A snapshot of Zip Card Transaction Data Analysis
ASDF Thailand Proceedings of the International Congress 2014 [IC 2014], Bangkok, Thailand 52
Int Congress 2014 ISBN : 978-81-929742-3-1 www.intcongress.com

III. System Architecture of Uatilize
UAtilize is a web-based application, which supports both traditional web browsers and mobile web browsers. For mobile web browsers, it automatically resizes its interface for the browser window using responsive actions of web application. Users can access UAtilize on their computers, tablets, and smart phones. The system architecture of UAtilize is shown in Figure 4. Several frameworks (including Google Maps, Google Fusion Tables, Google APIs, and Bootstrap) and programming languages including HTML5, JavaScript, CSS, and JQuery are used to implement UAtilize.
Figure 4 shows the system architecture of UAtilize. Class enrollment data and Zip Card transaction data are originally stored in relational databases which are controlled by Registrar Office and Auxiliary Services at UA. We received class enrollment data and Zip Card transaction data in CSV files format and uploaded them to Google Fusion Tables. UAtilize is built upon four data tables which are listed in Table 1. Specifications for each data table are provided in Table 2.
Figure 4.The System Architecture of UAtilize
Table 1 The four tables used in UAtilize
ASDF Thailand Proceedings of the International Congress 2014 [IC 2014], Bangkok, Thailand 53
Int Congress 2014 ISBN : 978-81-929742-3-1 www.intcongress.com

Table 2 Specifications of four data tables listed in Table 1
According to the system architecture shown in Figure 4, the following four steps illustrate the data flows for UAtilize:
Step 1. To use the Google Fusion Table service, users send HTTP requests followed by Google APIs encrypted-key and SQL-like queries to the Google web server. Step 2. Google Web Server identifies which services user would like to use. And then send the further additional request such as SQL-like queries to the Google Fusion table services. Step 3. Google Fusion Table interprets the information we requested, and send all records to the user in JSON format. Step 4. All of the records in JSON data will be translated into geographical data by Google Maps API. Moreover, Google Maps repeatedly process the JSON data with Google APIs service, and create a stunning and interactive visualization map which will be sent back to the user devices (including laptops, tablets, and smart phones).
IV. Classroom Utilization & Zip Card Utilization
We built our application on the top of the Bootstrap [8] which contains HTML and CSS-based design templates for creating web applications. All functions for serving as user interaction purposes are implemented in JavaScript, where visualizations are interactive and dynamic based upon user’s requests. Moreover, UAtilize is compatible with the latest version of multiple major browsers such as Internet Explorer, Chrome, Firefox, and Safari. For the server-side, we used several Google services and Google mechanisms powered by Google Inc. In the following sections, we describe the implementation details for campus building utilization and Zip Card utilization.
A. Campus Building Utilization
UAtilize provides classroom utilization, which visualize the student intensity on each location in the university. Users can get benefit by knowing the amount of student in each building. For instance about the emergency scenario, we can manage to evacuate students in the nearest location to avoid the emergency issues such as fire accidents, snow storm, and so on. UAtilize provides users to adapting the time with hours of days by using the class enrollment information. UAtilize visualize the student intensity by create a marker on each location. Users can click on each location to see the amount. Moreover, UAtilize also
ASDF Thailand Proceedings of the International Congress 2014 [IC 2014], Bangkok, Thailand 54
Int Congress 2014 ISBN : 978-81-929742-3-1 www.intcongress.com

provides building image for easily recognition. Figure 5 shows an Example of student intensity in the College of Arts and Sciences building.
Figure 5 An Example of student intensity in the College of Arts and Sciences building
In addition, in order to obtain specific results, UAtilize provides several components (e.g. building name, weekdays) for filtering the result. UAtilize uses a JQRangeSlider [9] component to provide a time slider bar, which allows users to easily choose a certain time period. Moreover, in classroom utilization, we also provide charts for further data analysis by the components shown in Figure 6.
Figure 6. Components (including building and day time) for analyzing building utitlization
a. Analysis for Classroom Utilization
UAtilize also provides analysis results in tabular and pie chart format. Users can easily access the data, which represented in numerical percentages for the further analysis. Figure 7 shows an example of the analysis result in percentage following in the pie chart and tabular format.
ASDF Thailand Proceedings of the International Congress 2014 [IC 2014], Bangkok, Thailand 55
Int Congress 2014 ISBN : 978-81-929742-3-1 www.intcongress.com

Figure 7. Showing student intensity in percentage following in the pie chart and tabular format
B. Zip Card Utilization
The second component of UAtilize is the interactive visualization and analysis of Zip Card utilization. This component is built upon Google Maps and Google Chart APIs. Figure 8 shows an example of Zip Card Utilization. According to Figure 8, UAtilize provides a clear representation for Zip Card Utilization analysis. The output is created on each marker in tabular format Users can know where the transaction has occurred on the specific building, and how much money they have been made in the periods of time.
Similar to class utilization page, Zip Card Utilization also provides the time slider bar for filtering the results. Moreover, this page has go further than the class utilization page by integrating transactions results and analyzing with the information on the student table, which help users to identify total amount of student with genders, and career filters. Figure 9 shows an example of top 10 vendors and student distribution percentage. In summary, UAtilize provides an easy and effective way for users to visualize and analyze all of the data for further analysis.
Figure 8. An Example of Zip Card Utilization analysis result
ASDF Thailand Proceedings of the International Congress 2014 [IC 2014], Bangkok, Thailand 56
Int Congress 2014 ISBN : 978-81-929742-3-1 www.intcongress.com

Figure 9. Top 10 vendors and student distribution percentage
C. Challenges
There were many challenges in the early development of UAtilize. The first one is to visualize the data on UA campus map. Secondly, we faced one challenge when we integrate the slider bar between the Google Maps API and Google Fusion Tables. To overcome this, we chose to use JQuery component on the web called JQRangeSlider [9]. Last but not least, we learned new knowledge about Google Fusion Tables. The new discovery includes: can only send 25,000 query requests/day; store 250MB data for each table; a cell of data in Fusion Tables supports a maximum of 1 million characters. In addition, regarding insertion records to Fusion Tables, we observed:
Maximum data size for a single HTTP request is 1 MB
Total number of table cells being added cannot exceed 10,000 cells (not rows!)
A single request may contain up to a maximum of 500 INSERT statements
Only the first 100,000 records are mapped or included in spatial query results
When viewed on a map, map tiles may exceed the 500 feature-per-tile limit, and features will be dropped from the map.
V. Implementation
According to our case study along with several Google services such as Google Maps, Google Fusion Tables, we have selected Google Fusion Tables, Google Maps, and Google Visualization as the frameworks for UAtilize to store and visualize the data. Specifically, we use Google Fusion Tables to store four data tables which are listed in Table 1, and use Google Maps to indexes streets, displays satellite and street-level images. In addition, we also use Google Visualization APIs to provide graphs and charts to end users for further data analysis.
A. Data Collection
Google Fusion Tables allow developers to import local data from spread sheets in .CSV file format into Google cloud-base services. As a result, cloud-data can be easily integrated and linked to our website. Google Fusion Tables provides API services, which allow developers to query, gather, and process the data stored in Fusion Tables. In addition, Google Fusion Table APIs allow developers to send the HTTP requests in the form of SQL-like queries to programmatically perform all tasks such as insert, update, and delete from the table.
Step 1 – We import class enrollments, transactions, students, and location data in .CSV format from spreadsheets into Google Fusion Tables. In order to query the cloud-data, Google APIs support sending HTTP requests to Google web server:
ASDF Thailand Proceedings of the International Congress 2014 [IC 2014], Bangkok, Thailand 57
Int Congress 2014 ISBN : 978-81-929742-3-1 www.intcongress.com

Using SQL-like query followed by Google account encrypted-key in form of URL link: https://www.googleapis.com/fusiontables/v1/query?sql = {SQL query} where {SQL query} is a valid SQL-like query provided by Google Fusion Table APIs 1.0.
Step 2 – Calling APIs from a browser by using JavaScript and query parameter. This technique allows us to write a rich application that displays Google Fusion Tables data without writing any server-side code. Step 3 – Fusion Tables APIs allow us to specify data type formats. Thus, we can define the format for returning response data in .CSV or JSON file format. In this case, we have selected the default data format in JSON typed data.
JSON (JavaScript Object Notation) is a common, language-independent data format, which provides a simple test representation of arbitrary data structures. Figure 10 shows an example of response data we received by sending the HTTP request to query 10 records from Zip Card Transactions Table:
Figure10. JSON Response data, “131-01” represented as a name of vendors in the Zip Card Transaction table and “645.25” are the dollars amount they made at a time.
B. Visualization
In order to visualize the data, Google Maps JavaScript API v3 [6] allows developers to create, style, color, and display a rich application and stunning visualization, which including Geocoding, Directions, and Street view.
Step 1 – In order to use Google Maps services, we load the Google Maps API by adding URL link to Google APIs followed by an API encrypted-key:
where API_KEY parameter contains a Google APIs key getting from our Google service account
Step 2 – Loading APIs on our application, we use a window.onload response command which was written in a map options into another <script> tag. Also create an “Initiate” function in JavaScript which creates the map and specific center: to allocate where latitude and longitude position we want to focus on. And putting a DOM elements, which displaying the map on our web page followed by <div> tag. For instance:
ASDF Thailand Proceedings of the International Congress 2014 [IC 2014], Bangkok, Thailand 58
Int Congress 2014 ISBN : 978-81-929742-3-1 www.intcongress.com

Step 3 – we can call Map Objects by using provided services from Google APIs, which presented in a Map class to create a large-single map on our system by following this script format:
Styling Map Approach – Styled maps allow us to customize the presentation of the standard Google base maps, changing the visual display of such elements as roads, parks, and built-up areas. In this case, instead of implement our styled map by our own hands. We use the Styled Map Wizard [10] to set the styled map. Styled Map Wizard give us to export the JSON file format and simply put on our source code.
VI. Conclusion
In this paper, we presented UAtilize which is an Interactive Visualization & Analysis of Campus Building Utilization application using Google Maps and Google Fusion Tables. UAtilize is a web-based application, which supports both traditional web browsers and mobile web browsers. For mobile web browsers, it automatically resizes its interface for the browser window using responsive actions of web application. UAtilize is built upon several frameworks (including Google Maps, Google Fusion Tables, Google APIs, and Bootstrap) and programming languages including HTML5, JavaScript, CSS, and JQuery. UAtilize provides multiple functions and dynamic visualizations of campus building utilization data and Zip Card transaction data, leveraging the comprehensiveness, accuracy, and usability of Google Maps. UAtilize is capable to integrate and transform geographical data into a map. The primary goal of UAtilize is to assist several departments at UA, including Registrar Office, Parking and Transportation Services, Police Department, and Auxiliary Business Operations. With UAtilize, users can directly and interactively analyze the data using Google Charts and Google Visualization.
VII. Reference
1. TeraData, http://www.teradata.com/?LangType=1033 2. TDWI, http://tdwi.org/Home.aspx 3. DAMA International, http://www.dama.org/i4a/pages/index.cfm?pageid=1 4. Google Fusion Tables, https://support.google.com/fusiontables/answer/2571232 5. Google Maps. https://developers.google.com/maps/ 6. Google Maps JavaScript API v3, https://developers.google.com/maps/documentation/javascript/ 7. The University of Akron, http://www.uakron.edu/ 8. Bootstrap Framework. http://getbootstrap.com/ 9. JQRangeSlider. http://ghusse.github.io/jQRangeSlider/ 10. Google Styled Map Wizard. http://gmaps-samples-v3.googlecode.com/svn/trunk/styledmaps
/wizard/index.html?utm_medium=twitter 11. Google APIs. http://en.wikipedia.org/wiki/Google_APIs
ASDF Thailand Proceedings of the International Congress 2014 [IC 2014], Bangkok, Thailand 59
Int Congress 2014 ISBN : 978-81-929742-3-1 www.intcongress.com

Children’s Luxury Brands: An Identity Construction Tool for Young Mothers?
Christel de Lassus, Virginie Silhouette-Dercourt
Associate Professor at Université Paris Est, IRG, Institut de Recherche en Gestion, Bld. Descartes Champs sur Marne, 77454, Marne-la-Vallée Cedex 2
Associate Professor at University Paris XIII, CEPN – CNRS – UMR 7234 Centre Marc Bloch (Berlin)
Abstract: Many luxury brands are now targeting children. The children’s luxury clothing sector is growing Strongly and children’s fashion apparel trade shows have been held in a number of European cities. What can account for consumers’ keen interest in children’s luxury clothing brands? Using a qualitative netnographic approach, this study identifies the motivations for, as well as the obstacles to purchasing luxury children’s clothing. The findings underscore the importance of specific motivations, which might help mothers to build their identity.
Key words: children, luxury, brands, identity, motivations.
Introduction
Luxury brands are increasingly targeting children, especially with children’s clothing. Although Christian Dior introduced a children’s offering in 1967, other brands have only done so more recently, including Armani, Dior, Burberry, Escada, Kenzo, Marc Jacobs, Jean Paul Gaultier, and Sonia Rykiel. At the same time, concept stores have opened, such as Notsobig, Bonton, and Kidsgallery, and in January 2014 Pitti Bimbo, a specialist trade fair in infant and children’s fashion, was held in Florence.
This sector primarily targets infants (up to age 2) and children (from age 2 to 12). It is also noteworthy that the economic recession seems not to have affected this sector, with dynamic demand from consumers in France, in Europe and in Asia. Thus it may be asked what accounts for this vogue for children’s luxury brands. The aim of the present study is to understand parents’ motivations, and more specifically mothers', and thus to enable brands to familiarize themselves with these new purchasers.
The paper presents the findings of this investigation in three sections. In the first section, we look at work in the social sciences and in management studies to understand the consumption of luxury products by parents and mothers for their children. This literature review indicates the need for an exploratory stage, which we then conducted, both through qualitative interviews and by means of a netnographic study, and present in the second section of the paper. In the third section, we discuss the results of our research.
1. Literature Review
While there are many studies on consumers of luxury goods, there are very few focusing on children – despite the economic importance of this sector; and even less on mothers' motivations to engage in such behaviors. The objective of this literature review is to highlight these gaps.
For example, Bastien and Kapferer (2008) or Vigneron and Johnson (2004), or Kapferer (1998) have conducted researches on luxury brands, but which fail to adress the “children” segment of the market. On the other hand, research pertaining to children has developed in marketing due to the very considerable impact they have on family purchasing decisions. Indeed children are influential as consumers (MacNeal, 1992). But they are themselves influenced by different social agents that will determine their relationship to
ASDF Thailand Proceedings of the International Congress 2014 [IC 2014], Bangkok, Thailand 60
Int Congress 2014 ISBN : 978-81-929742-3-1 www.intcongress.com

brands in general and to luxury products in particular. In the view of some authors (for example, Moore and Moschis, 1981), there are three types of socialization agents, each generating a particular form of influence on the socialization of children such as family, peers, and the media. More specifically, the 'mother to daughter' literature in Europe or in the United States insists on the importance of the family influence (and on the key role played by mothers) in children' consumption behaviors. Mothers remain the first source of influence (Dano, Roux & Tissier - Desbordes, 2005; Martin & Bush, 2000). In the United States, intergenerational (IG) researches have shown that IG effects are potentially important depending on the product category under consideration or the market characteristics. Works conducted on mother-daughter dyads show that IG effects continue to play a role when the child becomes an adult (Moore, Willkie and Lutz 2002). Buying or consuming IG brands symbolizes loyalty and parental affiliation. Recent studies have shown that transmission within mother-daughter dyads reflects the family experience (Ladwein, Craton and Sevin, 2009).
Another line of research provides explanations for parents' motivations to transmit specific consumption behaviors as an expression of their identity. Psychologists have shown that human beings are structured through interaction with the cultural system they belong to. Erikson (1951, 1968 and 1982) considers the different stages of the construction of identity, from the stage of the baby through to the end of life. Regarding the consumer, Holbrook and Hirschman (1982) show that different cultural forces influence the purchase of products and brands which allow them to express the variability and complexity of their identities. Recent research has highlighted that fact that women buy cosmetics and fashion products for their strong identity aspect (Marion, 2003, Oswald, 2009, Silhouette-Dercourt and de Lassus, 2014).
Given the fact that literature is still scarse when it comes to luxury brands for children, it is therefore appropriate to examine, from a theoretical standpoint, the specific motivations for young mothers to purchase these brands for their children.
2. Methodology of the Research
Because of the exploratory nature of this research, it was necessary to opt for a qualitative methodology. Two data collection methods were implemented. First, 23 in-depth qualitative interviews with women in shops or in “corners” of department stores were conducted. We focused on mothers of children, aged 29 to 43, all mothers of girls up to age seven, equally proportioned between professionally active women and housewives and balanced in terms of age distribution. Interviewees were questioned after being contacted when leaving a luxury shop.
In a second step, we added a netnographic analysis stage, during 8 weeks. We collected qualitative material in the form of comments posted on forums, in response to questions about luxury clothing. We adopted a position of participant observation, taking part of these forums and asking a number of questions. This exploratory phase was important for finding out about the various constraints and motivations of buyers and prospective buyers, a distinction that is more difficult to ascertain in stores.
These in situ observations on forums complement the factors analyzed in the interviews.
We conducted a classic thematic analysis and took into account the frequency of occurrence of each theme to sharpen the descriptive character of the analysis. We followed these various steps for the first twelve interviews and then went back to the field for verification and iteration. The discourse of the interviews in this exploratory phase were fully transcribed, then subjected to a content analysis, which highlighted a number of recurring themes and sub-themes.
3. Results
Results are organised to highlight the different types of motivations expressed by mothers for buying luxury brands for their children. Such shopping is characterized by two dimensions, aesthetic and hedonic, in the
ASDF Thailand Proceedings of the International Congress 2014 [IC 2014], Bangkok, Thailand 61
Int Congress 2014 ISBN : 978-81-929742-3-1 www.intcongress.com

same way as shopping for adults. The attitudes are, in part, similar to those of individuals buying luxury brands for themselves: the aesthetic dimension is important, in line with work showing that luxury equals beauty (Kapferer 1998).
“I play around a bit with the clothes, try out new looks”
“Transforming her into a fashion victim, that slays me…
On the other hand, research shows that there are also motivations specific to shopping for children such as, but not limited to:
The pleasure of giving: mothers want to give their children what is best, and with this in mind, they are very happy to buy them luxury items.
“Nothing is too good for my daughter, she’s our princess, we dreamed about her for ages, and now she’s here, it’s my pleasure”
Motherhood celebration:
“Being a mother is a real joy, and brands allow me to celebrate it”; “It’s by buying wonderful things that I begin to play my role as a mother” “Being a mother is very new for me, and I show my baby that I’m giving her the best, with Burberry’s.” “I want to be a caring mother and at the same time fashionable and buying Baby Dior seems logical to me.”
Distinctiveness: Luxury brand clothing enables one to have a distinctive garment compared to other clothes. The mothers’ discourse refers to the motivation of conspicuous consumption, where a brand is purchased in order to assert or express their social position.
“In any case we don’t try and dress them in Roberto Cavalli or Alexander McQueen, what we want is baby Dior, with Dior quality, and the Dior image.”
Transmission of social rules: The analysis shows that mothers want to pass on to their daughters “codes of beauty”, which they have acquired in their life in society, and a grasp of which they believe is necessary.
“I want to provide her with knowledge of these brands, of that world, as quickly as possible, it’s good...”
A further motivation concerns the mother’s own childhood and “inner life”. The child is projected into an upward ideal, an ideal of a better life. “When I was her age, my mother dressed me in clothes she made herself.” “In my childhood, I was not at all spoiled, so now, since I can spoil her, I do so.”
Identity construction of young mothers: It appears from the analysis of the interviewees’ discourses, as also from responses in the forums, that this type of purchase allows these young women to come to terms with being mothers, or even defines their identity. For some of the respondents, buying luxury products enables them to develop without fear of being dowdy.
“Now being a mother is sexy, it's nothing like it was before, and fine brands help, one can be even sexier with one’s with little girl.”
Luxury clothes shopping reflects the desire of some mothers to transmit values to their daughter, and to pass on to her aspects of their own identity. But at other times, there may be identity positions with regard to the child, revealed in the discourse. For some women, it is an idealization process: the purchase of luxury clothes allows them to project a perfect child, who is not simply an ordinary infant.
“She will live better than me, she's already better than me” “I’ve been in the shop at the same time as Carla Bruni, we buy the same things”
ASDF Thailand Proceedings of the International Congress 2014 [IC 2014], Bangkok, Thailand 62
Int Congress 2014 ISBN : 978-81-929742-3-1 www.intcongress.com

For others it is also a search for appropriation: the little girl is seen as a “mini replica” of her mother, and purchases support this perception.
4. Discussion
The conclusions of this exploratory study are that young mothers build their new maternal identity and their projected relationship with their child through purchases of children’s luxury goods. These findings are consistent with those pertaining to adults, but shed light on an unexplored area, namely motivation with regard to children’s luxury products and the dynamics of mothers’ identity-building strategies.
In addition, our results complement work on the transmission of luxury goods, and further elucidate previous work on intergenerational dynamics. Indeed, they show that the purchase of luxury items for children depends on the desire mothers have for transmission and socialization with regard to their children. Our research also emphasizes the mother’s identity strategies for positioning herself in relation to her child and the dynamics this may give rise to in terms of attitudes towards the child, variously involving identification, idealization, transmission and creation.
From a managerial standpoint, this research is instructive in a various ways. Managers of luxury brands would be advised to analyze both their marketing strategies and their communication objectives, in the light of mothers' motivations. In addition, it seems important to establish links with those mothers who buy luxury items for their children, with a view to building a long-term relationship based on trust. Managers can nurture this relationship through messages about the beauty of the parent-child bond. Doing so may provide useful information for enhancing brand loyalty, and may enable managers to develop a long-term relationship between a brand and a family. A third managerial contribution concerns recommendations for communication, particularly communication on blogs, forums and other social networks. It would be in the interest of luxury fashion houses to foreground on their official page a section on parents and children's fashion, or even to introduce an interactive discussion space regarding luxury for children. There may be a number of messages on blogs linking these purchases to a growing awareness of beauty and of learning about socialization and values in society, for children.
Conclusion
The present study is an exploratory approach and offers at least three contributions to the understanding of consumption behavior in relation to luxury products for children. First, it seems important to emphasize that the feeling of achievement and the desire for the best for their children might imply a changed role for socialization agents. Indeed it appears that purchasing luxury brands for their children is a new form of socialization for mothers who want to teach important aspects of life in society to their children. These results echo the findings pertaining to literacy regarding luxury brands for consumers in emerging markets who have not had such knowledge transmitted to them (Bengtsson and Fuat Firat 2006; Oswald 2009).
Finally, the results present the various logics available to mothers with regard to their children, and show that the logic of transmission is not the only one involved in the purchase of luxury goods. The analysis reveals the mother’s identity strategies to position herself in relation to the child and the dynamics that these strategies can generate in terms of her motivations regarding the child – identification, idealization, transmission, creation.
References
1. Bastien V. and Kapferer J. N. (2008), Luxe oblige, Groupe Eyrolles, Paris. 2. Bengtsson A. and A. Fuat Firat (2006), Brand literacy: consumers’ sense-making of brand
management, Advances in Consumer research, vol 33, 375-380. 3. Erikson E.H (1950), Childhood and society, New York, Norton. 4. Fantasies, Feelings and Fun. Journal of Consumer Research, 9, 132-140.
ASDF Thailand Proceedings of the International Congress 2014 [IC 2014], Bangkok, Thailand 63
Int Congress 2014 ISBN : 978-81-929742-3-1 www.intcongress.com

5. Holbrook, M. B., & Hirschman, E. C. (1982). The Experiential Aspects of Consumption: Consumer 6. Kapferer, J.-N. (1998), Why are we seduced by luxury brands?, Journal of Brand Management, 6, 1,
pp. 44–49. 7. Ladwein R., Carton A., Sevin E. (2009), Le capital transgénérationnel: la Transmission des Pratiques
de Consommation de la Mère vers sa Fille, Recherche et Applications en Marketing, 24, 2, pp.1-27. 8. Lipovetsky, G. and Roux, E. (2003) Le Luxe Eternel: De l’âge du Sacré au temps des Marques,
Gallimard, Paris, France. 9. Marion G. (2003), Apparence et identité: une approche sémiotique du discours des adolescents à
propos de leur expérience de la mode, Recherche et Applications en Marketing, 18, 2, 1-29. 10. McNeal J.U. (1992) Kids as Customers, Lexington Books, New York. 11. Moore E.S. and Moschis G. P. (1981), The role of family communication in consumer learning,
Journal of Communication, Autumn, 42-51. 12. Moore E.S, Wilkie W.L et Lutz R.J (2002), Passing the Torch: Intergenerational Influences as a
Source a Brand of Brand Equity, Journal of Marketing, 66, April, pp.17-37. 13. Oswald L (2009), Developing Brand Literacy among Affluent Chinese Consumers, Avances in
Consumer research, 1-24. 14. Silhouette-Dercourt Virginie, De Lassus Christel, Darpy Denis (2014), How second-generation
ethnic consumers choose where to shop : a cross-cultural semiotic analysis , Journal of Retailing and Consumer Services, to be published.
15. Vigneron F. and Johnson L, (2004), Measuring perceptions of brand luxury, Journal of Brand Management, 11, 6, 484–506.
ASDF Thailand Proceedings of the International Congress 2014 [IC 2014], Bangkok, Thailand 64
Int Congress 2014 ISBN : 978-81-929742-3-1 www.intcongress.com

Rust Prevention in Structural Establishments using Cathodic Protection Technique Driven by
an MPPT based Solar Charge Controller Sai Shankar B1, K P Pranav2, Kiran Raj R3, C V Jayakumar4
Sri Sai Ram Engineering College Chennai, India
Abstract- This paper is aimed at the implementation of a novel technique to prevent the formation of rust in structural establishments. The existing metallic structures usually exceed their original design lifetime and hence require a potent protection mechanism for a rust-free life extension. The Impressed Current design of Cathodic Protection coupled with simple design features, installation procedures and cost effectiveness presents an ideal technological solution to the prevalent issue of rusting and subsequent degradation of structural establishments. This method makes use of the abundantly available Solar Energy for battery charging, which provides the required impressed current for cathodic protection. In this method, Maximum Power Point Tracking based digital charge controller is employed to ensure maximum charging efficiency and economic feasibility. The charging module is operated in buck configuration to maximize the rate of charging. This enhanced design of Impressed Current Cathodic Protection ensures precise, standard industrial levels of protective current in metallic structures used in infrastructure and commercial buildings. This process provides sufficient protection to metallic structures by ensuring efficient transfer of electrical current through the structure’s concrete sections. A suitable anodic material is cast onto the top surface of the concrete slab present above the steel frame structure. The experimental results indicate the effectiveness of the proposed design in terms of ease of design, economic considerations and superiority over existing models. The proposed model exhibits extreme potential to inhibit rust formation which can be adopted for various industrial applications.
Keywords-Impressed Current Cathodic Protection Technique, Solar Maximum Power Point Tracking, Rusting.
I. Introduction
Rusting is an electrochemical process which is characterized by the exchange of electrons. It can also be defined as the slow process of deterioration of materials due to their reaction with the environment. Various environmental factors contribute to the process of rusting. Iron oxidizes naturally into various forms of Iron Oxides which are less stable than the original form of steel/iron. Both moisture and air are required for the corrosion of metals to occur. The common methodologies employed to prevent rusting include the usage of anodic and cathodic inhibitors, application of barrier coatings and sacrificial anodic method. However, it has been proven to a great extent in various research studies that the most efficient of these methods is the process of Impressed Current Cathodic Protection. Engineering knowledge is incomplete without an understanding of rusting, its adverse effects and thereby devising a solution to overcome this undesirable phenomenon. A technique to minimize the ill effects of rusting is Impressed Current Cathodic Protection, employed when the system to be protected is subjected to an aggressive environment to a great extent to which cathodic protection is technically feasible and suitable.
This technique involves impressing current over the cathode which is the structure to be protected, by providing a stream of electrons over the metallic surface [1]. This process is clearly more preferred than the sacrificial anodic method. The voltage differences between the anode and the cathode are limited in the sacrificial anode systems to approximately one volt or less, depending upon the anode material and the particular type of environment. Impressed current systems can make use of larger values of voltage
ASDF Thailand Proceedings of the International Congress 2014 [IC 2014], Bangkok, Thailand 65
Int Congress 2014 ISBN : 978-81-929742-3-1 www.intcongress.com

differences. The larger voltages available with the impressed currents allow remote anode locations, thereby producing much more efficient and uniform current distribution patterns along the protected cathode. These larger voltages achieved are useful in low conductivity environments such as freshwater and concrete [4]. Solar Energy is used to drive the process of Impressed Current Cathodic Protection, thereby ensuring a reliable source of power supply. The process of solar charging is enhanced by utilizing a Digital Maximum Power Point Tracking based solar charge controller. In this proposed model of rust prevention using Impressed Current Cathodic Protection, an Arduino Duemilanove with ATmega 328 based solar charge controller is designed to provide the desired value of current to be impressed over the structure to be protected. In this era of energy and power crisis, it is imperative to utilize renewable energy sources like solar energy to overcome various technological challenges. In particular, this model exhibits immense potential to help mitigate corrosion in various metallic structures to a large extent.
II. Fundamentals of Rusting
A potential difference usually exists between two dissimilar metals when subjected to a corrosive or conductive environment. When metals are electrically connected or are in direct contact with each other, a corrosion cell is formed and a certain value of potential difference produces an electron flow between them. A corrosion cell is comprised of the following components:
Anode: The anode is usually represented as the negative terminal of the corrosion cell. In Impressed Current Cathodic Protection technique, the positive terminal of the battery is connected to the anode portion of the cell. The required number of anodes are installed and interconnected by means of a feeder wire. Graphite has been employed as the anode in this proposed model. Graphite happens to be a good conductor of electricity and it enhances low current density current discharge. It also further offers low resistance to the electrolyte, due its high ratio value of surface area to the weight. The consumption rate of graphite is 0.25 Kg/A/Year which makes it a favorable and an economical choice for the system, among the various anode materials available.
Cathode: The Cathode is represented as the positive terminal of the corrosion cell formed. In Impressed Current Cathodic Protection technique, the negative terminal of the battery used is connected to the cathode. The areas of the metallic structure targeted for protection constitute the cathode portion. The wire connections given to the metal provide a return path to the power supply unit, as the negative part of the circuit.
Electrolyte: The electrolyte is the electrically conductive portion of the cell that enables the flow of electrons and must be present for rusting to occur. The protective current intended for rust prevention is passed through the stonework or masonry with the help of a mortar or concrete connection with the steel frame. It is observed that freshwater sources have a great tendency to contribute to the process of rusting of metallic structures.
Table I: Current density and consumption rates of various anodic materials
ASDF Thailand Proceedings of the International Congress 2014 [IC 2014], Bangkok, Thailand 66
Int Congress 2014 ISBN : 978-81-929742-3-1 www.intcongress.com

III. Impressed Current Cathodic Protection
Impressed Current Cathodic Protection technique is employed primarily in many of the structural establishments where the electrolyte resistivity is high and it is comparatively more economically feasible than ordinary sacrificial anodic protection systems. Impressed Current Cathodic Protection (ICCP) systems use an anode which is connected to a DC power source. Anodes for ICCP systems are tubular and solid rod shapes or continuous ribbons of various specialized materials. This technique on the principle that rusting is an electrochemical reaction in which iron or steel acts as a cathode while graphite acts as the anode. At the cathode corrosion occurs as iron gives up electrons and forms soluble iron ions. At the anode the electrons released by the corrosion process combine with water and oxygen to form hydroxide ions. In this system the metal to be protected is made to act as the cathode, which is unaffected by the corrosive reaction, preventing further rusting [2]. When employed to protect structural iron and steel, this is achieved by means of passing a defined industry standard small value of electric current through the structural material. This ensures a constant stream of electrons to satisfy the cathodic reaction and thereby helps to inhibit the rusting process.
Figure 1. Impressed Current Cathodic System for Structural Establishments.
The primary advantage of Impressed Current Cathodic Protection in the protection of embedded metalwork in structures is that it provides protection from rusting without changing the immediate physical environment. It provides the electrochemical conditions to control the rusting process. The implication of this process is that there is no need to gain full access to the structure by means of removing the surrounding material and that it can remain largely intact [5]. Impressed Current Cathodic Protection has a clear advantage over other methods of corrosion prevention. It makes it possible to adjust the value of current and voltage, with an ability to provide an unlimited required current output. This technique can be adopted over a wide range of resistive environments and works extremely well on large structures which are typically employed in most of the petrochemical industrial sectors and other crucial commercial establishments [3].
IV. MPPT solar Charging System
The Maximum Power Point Tracking based solar charging unit is designed to ensure maximum efficiency in the charging rate of the battery along with minimal energy loss in the system [8]. The battery is utilized to provide the requisite industry standard value of impressed current over the cathode to drive the process of Impressed Current Cathodic Protection. The system involves dynamic measurement of voltage and current values of the Solar Panel and the DC Battery at all times. The voltage of the solar panel is sensed using a voltage divider while the current value is determined by an ACS712 Hall Effect Sensing Module. The voltage value of the battery is also measured using a voltage divider. The measured values are processed by the
ASDF Thailand Proceedings of the International Congress 2014 [IC 2014], Bangkok, Thailand 67
Int Congress 2014 ISBN : 978-81-929742-3-1 www.intcongress.com
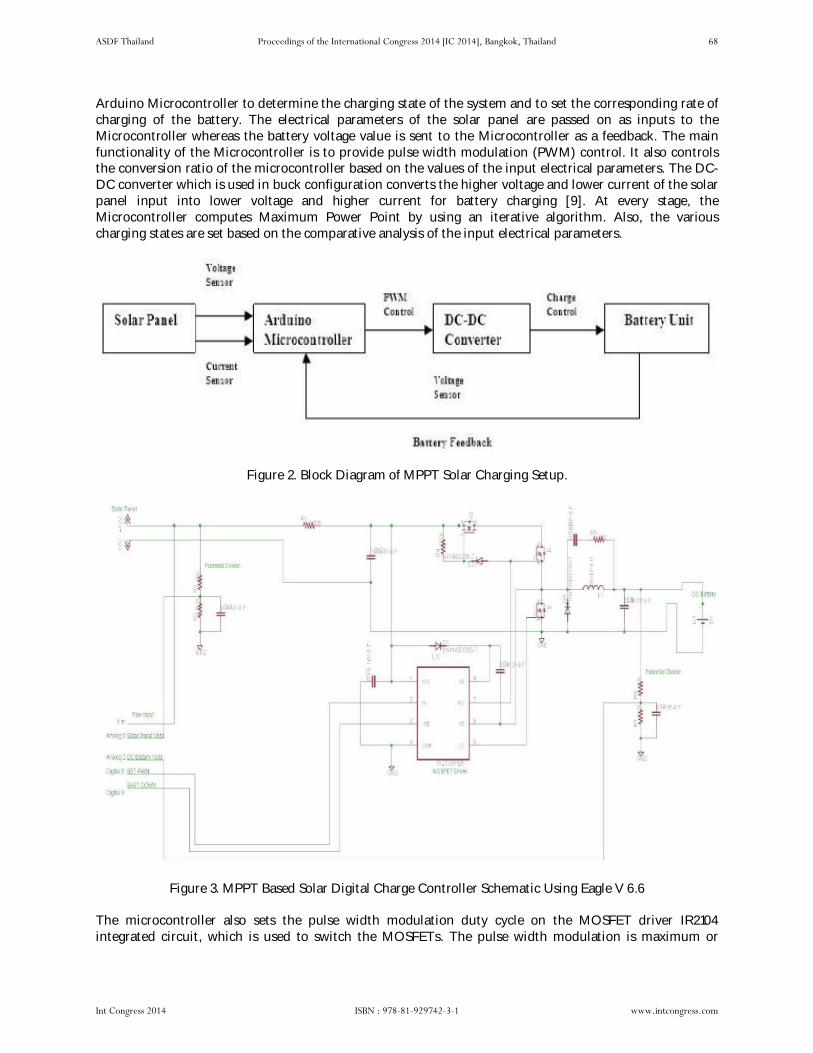
Arduino Microcontroller to determine the charging state of the system and to set the corresponding rate of charging of the battery. The electrical parameters of the solar panel are passed on as inputs to the Microcontroller whereas the battery voltage value is sent to the Microcontroller as a feedback. The main functionality of the Microcontroller is to provide pulse width modulation (PWM) control. It also controls the conversion ratio of the microcontroller based on the values of the input electrical parameters. The DC-DC converter which is used in buck configuration converts the higher voltage and lower current of the solar panel input into lower voltage and higher current for battery charging [9]. At every stage, the Microcontroller computes Maximum Power Point by using an iterative algorithm. Also, the various charging states are set based on the comparative analysis of the input electrical parameters.
Figure 2. Block Diagram of MPPT Solar Charging Setup.
Figure 3. MPPT Based Solar Digital Charge Controller Schematic Using Eagle V 6.6
The microcontroller also sets the pulse width modulation duty cycle on the MOSFET driver IR2104 integrated circuit, which is used to switch the MOSFETs. The pulse width modulation is maximum or
ASDF Thailand Proceedings of the International Congress 2014 [IC 2014], Bangkok, Thailand 68
Int Congress 2014 ISBN : 978-81-929742-3-1 www.intcongress.com
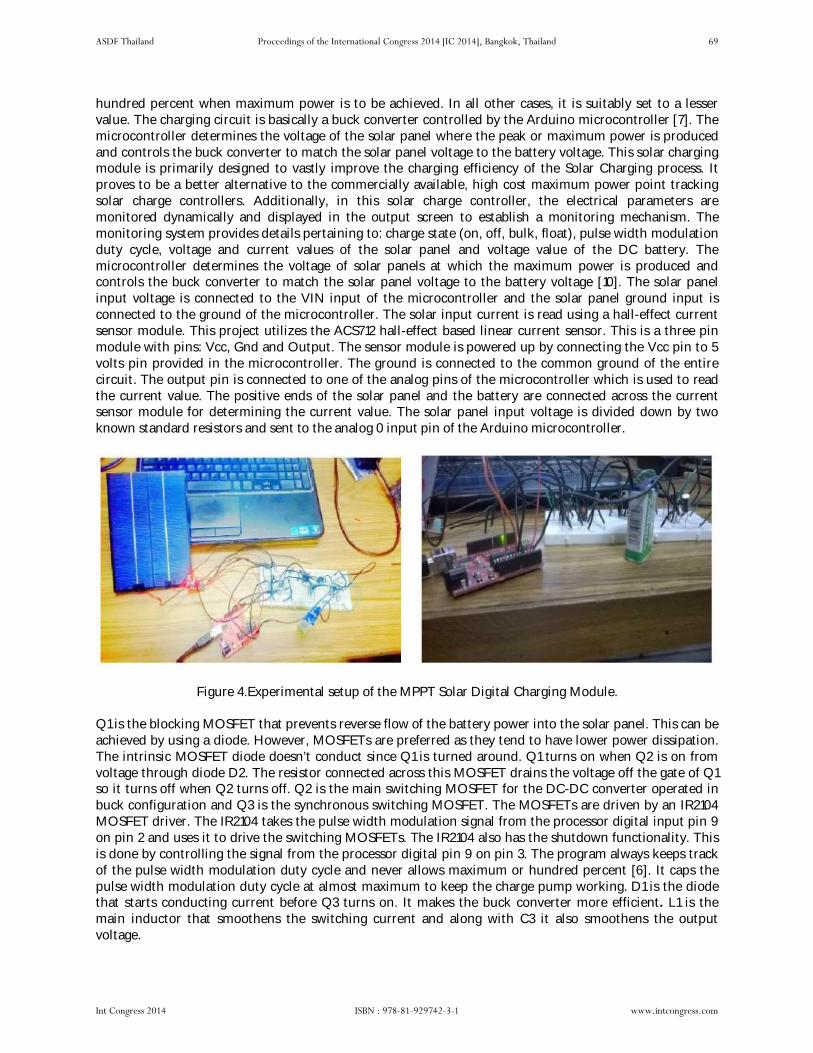
hundred percent when maximum power is to be achieved. In all other cases, it is suitably set to a lesser value. The charging circuit is basically a buck converter controlled by the Arduino microcontroller [7]. The microcontroller determines the voltage of the solar panel where the peak or maximum power is produced and controls the buck converter to match the solar panel voltage to the battery voltage. This solar charging module is primarily designed to vastly improve the charging efficiency of the Solar Charging process. It proves to be a better alternative to the commercially available, high cost maximum power point tracking solar charge controllers. Additionally, in this solar charge controller, the electrical parameters are monitored dynamically and displayed in the output screen to establish a monitoring mechanism. The monitoring system provides details pertaining to: charge state (on, off, bulk, float), pulse width modulation duty cycle, voltage and current values of the solar panel and voltage value of the DC battery. The microcontroller determines the voltage of solar panels at which the maximum power is produced and controls the buck converter to match the solar panel voltage to the battery voltage [10]. The solar panel input voltage is connected to the VIN input of the microcontroller and the solar panel ground input is connected to the ground of the microcontroller. The solar input current is read using a hall-effect current sensor module. This project utilizes the ACS712 hall-effect based linear current sensor. This is a three pin module with pins: Vcc, Gnd and Output. The sensor module is powered up by connecting the Vcc pin to 5 volts pin provided in the microcontroller. The ground is connected to the common ground of the entire circuit. The output pin is connected to one of the analog pins of the microcontroller which is used to read the current value. The positive ends of the solar panel and the battery are connected across the current sensor module for determining the current value. The solar panel input voltage is divided down by two known standard resistors and sent to the analog 0 input pin of the Arduino microcontroller.
Figure 4.Experimental setup of the MPPT Solar Digital Charging Module.
Q1 is the blocking MOSFET that prevents reverse flow of the battery power into the solar panel. This can be achieved by using a diode. However, MOSFETs are preferred as they tend to have lower power dissipation. The intrinsic MOSFET diode doesn’t conduct since Q1 is turned around. Q1 turns on when Q2 is on from voltage through diode D2. The resistor connected across this MOSFET drains the voltage off the gate of Q1 so it turns off when Q2 turns off. Q2 is the main switching MOSFET for the DC-DC converter operated in buck configuration and Q3 is the synchronous switching MOSFET. The MOSFETs are driven by an IR2104 MOSFET driver. The IR2104 takes the pulse width modulation signal from the processor digital input pin 9 on pin 2 and uses it to drive the switching MOSFETs. The IR2104 also has the shutdown functionality. This is done by controlling the signal from the processor digital pin 9 on pin 3. The program always keeps track of the pulse width modulation duty cycle and never allows maximum or hundred percent [6]. It caps the pulse width modulation duty cycle at almost maximum to keep the charge pump working. D1 is the diode that starts conducting current before Q3 turns on. It makes the buck converter more efficient. L1 is the main inductor that smoothens the switching current and along with C3 it also smoothens the output voltage.
ASDF Thailand Proceedings of the International Congress 2014 [IC 2014], Bangkok, Thailand 69
Int Congress 2014 ISBN : 978-81-929742-3-1 www.intcongress.com

V. Calculations
A crucial consideration for the design calculations in the implementation of Impressed Current Cathodic Systems on existing metallic structures is the industry standard value of current density. A metallic structure requires an industrial standard current density value of 0.2 milli ampere per square metre to be impressed on its surface.
The calculations are computed by suitably considering the coating efficiency of the metallic structure used in this particular model. The coating efficiency is approximated to eighty percent.
VI. Experimental Results
The Digital MPPT Solar Charge Controller efficiently processes the information obtained from the electrical devices: solar panel, current sensor and dc battery instantaneously. This information is used to compute the
ASDF Thailand Proceedings of the International Congress 2014 [IC 2014], Bangkok, Thailand 70
Int Congress 2014 ISBN : 978-81-929742-3-1 www.intcongress.com

iterative maximum power point algorithm to perform efficient battery charging. The use of this system ensures minimum energy loss as well as maximum utility of the solar panel. This method also provides solar panel protection by making sure that power doesn’t flow in the reverse direction from the dc battery towards the solar panel.
The exhaustive experimental analysis was performed on two sample rusted metallic structures, to exhibit the conformity of the model for real time applications. Impressed Current Cathodic Protection was applied to the one of the metallic structures whereas the other was left isolated, without being subjected to any kind of protection. The experimental setup was left undisturbed for a period of more than two weeks and then the results were observed. The metallic structure subjected to Impressed Current Cathodic Protection portrayed not even marginal corrosion signs whereas the isolated structure developed corrosion in the same duration.
Figure 8. Contrasting final states of the two metallic structures.
VII. Conclusion
This enhanced design of Impressed Current Cathodic Protection for rust prevention in structural establishments provides cost-saving in excess of fifty percent in comparison with traditional approaches like protective coating and replacement of corroded material. The power supply to this system for providing subsequent low value of impressed current is enhanced by the usage of the digital MPPT based solar charge controller. The efficiency of the solar charging process is improved by using the charge controller in buck configuration. Additionally, it also provides sufficient protection against backflow of power from the battery to the solar panel. This model adheres to the industry standard value of impressed current required for protection of metallic structures. This model also proves to be a beneficial method for rust prevention in terms of system operating parameters and economic feasibility. Thus the overall investment in a long term rust mitigation system is brought down and it serves to be an ideal strategy for protecting metallic structures.
ASDF Thailand Proceedings of the International Congress 2014 [IC 2014], Bangkok, Thailand 71
Int Congress 2014 ISBN : 978-81-929742-3-1 www.intcongress.com

Acknowledgement
The authors would like to sincerely acknowledge the immense support and guidance provided by Dr. B. K. Panigrahi, Associate Professor, Department of Electrical Engineering, Indian Institute of Technology, and New Delhi
References
1. Zaki Ahmad, “Principles of Corrosion Engineering and Corrosion Control”, Butterworth – Heinemann Publication, first edition, 2006.
2. Franco Ferraris, Marco Parvis, Emma Angelini, Sabrina Grassini, “Measuring system for enhanced cathodic corrosion protection”, Instrumentation and Measurement Technology conference, 2012 IEEE International, pp-1583– 1587.
3. Abdel Salam I S Ahdash, “Design of Impressed Current Cathodic Protection for Steel Immersed in Freshwater”, 2010.
4. R. Winston River, Herbert H Uhlig, “Corrosion and Corrosion Control; an Introduction to Corrosion Science and Engineering”, fourth edition, 2008.
5. Marcus O. Durham and Robert A. Durham, “Cathodic Protection”, IEEE Industry applications Magazine, Jan 2005.
6. D. P. Hohm, M. E. Ropp, “Comparative Study of Maximum Power Point Tracking Algorithms Using an Experimental, Programmable, Maximum Power Point Tracking Test Bed”, Photovoltaic Specialists Conference, Conference Record of the Twenty-Eighth IEEE Volume , Issue,2000 Page(s):1699 – 1702.
7. Ahmed Bin Halabi, Adel Abdennour, Hussein Mashaly, “Experimental Implementation of Microcontroller based MPPT for Solar Charge Controller”, IEEE International Conference on Microelectronics, Communications and Renewable Energy, 2013.
8. Salas V., Olias E., Barrado A., Lazaro A., “Review of the maximum power point tracking algorithms for stand-alone photovoltaic systems", Solar Energy Materials & Solar Cells 90, pp. 1555–1578,2006.
9. Yan-Fei Liu Meyer, E. Xiaodong Liu, "Recent Developments in Digital Control Strategies for DC/DC Switching Power Converters," Power Electronics, IEEE Transactions, vol.24, no.11, pp.2567-2577, Nov. 2009.
10. P. Murphy, M. Xie, Y. Li, M. Ferdowsi, N. Patel, F. Fatehi, A. Homaifar, F. Lee, “Study of Digital vs Analog Control”, Power Electronics Seminar Proceedings (CPES Center for Power Electronics Systems), pp.203-206, 2002.
ASDF Thailand Proceedings of the International Congress 2014 [IC 2014], Bangkok, Thailand 72
Int Congress 2014 ISBN : 978-81-929742-3-1 www.intcongress.com

The Thermal Phenomena of the Supercritical CO2 in the Reservoir of the Enhanced Geothermal System based on
Brinkman Model
David T.W. Lin1, J.C. Hsieh2, Y.C. Hu3, C.H. Wei1, and B.H. Lee
1Institute of Mechatronic System Engineering, National University of Tainan, 701, Taiwan, R.O.C 2Industrial Technology Research Institute,
Green Energy and Environment Research Laboratories, Hsinchu 31040, Taiwan, R.O.C 3Department of Mechanical and Electro- Mechanical Engineering,
National ILan University, ILan, Taiwan, R.O.C
Abstract-The paper is to discuss the thermal phenomena of the supercritical CO2 in the geothermal reservoir for the enhanced geothermal system. The transient heat transfer model conjugated with the Brinkman model of employed by the finite element package is used to obtain the dynamic and thermal behavior in the porous medium. The different pressure of the reservoir, the various inlet volumetric flow rate are discussed. The results show that the inlet volumetric flow rate results in the temperature difference between the wall and working fluid on the exit apparently. It can be predicted that the heat extraction will increase as the volumetric flow rate decreases. In addition, the suitable operated pressure will reach the maximum heat extraction for the reason of property of supercritical CO2.
I. Introduction
Geothermal energy can be considered as one of the important energy in future. It is one kind of renewable energy and emissions very less CO2 [1]. The geothermal system is divided into traditional geothermal system and non-traditional geothermal system. The non-traditional geothermal system is enhanced geothermal system (EGS) which injects working fluid through injected well into reservoir approximate 3000 m depth. The working fluid is heated in the reservoir through hot rock with 250℃ and flows out ground through the producted well. The water or CO2 can be chosen as the working fluid. Recently, supercritical CO2 is suggested be the one of working fluids in the enhanced geothermal system. Brown proposes the CO2-EGS in 2000 first [2].The advantages of this system are an excellent buoyant driving, the inability of dissolving with mineral species, and without the problem associated with the silica dissolution. Therefore, the thermal behavior of supercritical CO2 is the important issue at high temperature and pressure reservoir of EGS. For the purpose of practice of CO2-EGS, the properties of supercritical CO2 should be studied such as the mechanical, thermal and flow phenomena. Recently, the studies related to CO2-EGS are flourish published. Wan et al. review the impact of fluid-rock interaction on CO2-EGS in 2011 [3]. They review many researches about the CO2-EGS after Brown’s propose. Several issues have been discussed to understand the availability of the CO2-EGS, these include the CO2 mineralization, such as CO2 injection in granite and sandstone [4], the CO2 sequestration in deep-saline aquifers [5], CO2-rock interaction in elevated temperature [6]. Pruess et al. publish a series of studies of CO2-EGS, such as heat transmission [7], sequestration of carbon [8], and production behavior [9] from 2006. Pruess et al. build the numerical model TOUGH for the multiphase flow in permeable media in 2004 [10]. In addition, Xu follows the Pruess’s research to develop the advanced TOUGH [11] and process a series of numerical modeling about fluid-rock interaction [12], the effects of pH solution [13] and brine [14]. Spycher and Pruess discuss the effect of CO2-brine mixtures by TOUGH in advance [15]. The heat extraction is still the key role of the CO2-EGS. To obtain the heat extraction of the CO2-EGS, many different phenomena have been observed and studied. Several studies investigate the heat transfer phenomena related to this topic. Therefore, several flow and thermal phenomena have understand
ASDF Thailand Proceedings of the International Congress 2014 [IC 2014], Bangkok, Thailand 73
Int Congress 2014 ISBN : 978-81-929742-3-1 www.intcongress.com

well such as CO2 flow is well than water in low permeability reservoirs [16], the pressure drop and heat transfer performance of a CO2 geothermosiphon can be superior to those of water-based systems [17]. The buoyancy of super-critical CO2 in the vertical mini-tubes and porous media is discussed by Jiang et al. [18]. Liao et al. find that the buoyancy effects are significant for all the flow orientations [19, 20]. However, the above approaches have some limits in this application, for example, few studies on the supercritical fluid, the absence of experimental system for reservoir. The purpose of this study is to obtain the thermal phenomena of the supercritical CO2 in the geothermal reservoir for the enhanced geothermal system. In general, Brinkmann model, modified Navier Stokes equation, and Darcy model are used to evaluate the thermal and transport phenomena of porous flow. In this study, the transient heat transfer model conjugated with the Brinkman model employed by the finite element package is used to obtain the dynamic and thermal behavior of the supercritical CO2 in the porous medium. From the above, this paper proposes a supercritical CO2 model combined with the porous medium to solve the heat problems in order to complete the above absence. This study can reduce the cost of realistic test of enhanced geothermal system and build an effective way to simplify the evaluated procedure in the geothermal system.
II. Modeling
A geothermal model of reservoir is built in this study for examining the thermal phenomena of supercritical CO2 flow in the porous media under high preassure and temperature. 3-D brinkman momentum equation and energy balance equation are used. Fig. 1 presents a schematic illustration of the problem considered in the present analysis. As shown, the pipe combined with the applied heat fluxes on the surface is modeled as the heated CO2 flow in the geothermal reservoir. The heat applied on the surface of the pipe spreads into the CO2 flow through conduction and convection, the effect of radiation is neglected. Initially, the temperature of this model is kept as a constant temperature, Tinf . The governing equations are listed as below.
Continuity equation is
(휀휌) + ∇ ∙ (휌푢) = 푄 (1)
Momentum equation is
+ (푢 ∙ ∇) = −∇푝 + ∇ ∙ 휇 ∇푢 + (∇푢 ) − 휇(∇ ∙ 푢)퐼 − + 푢 + 퐹 (2)
here, 휇 is the viscosity, 휀 is porosity, 휅 is the permeability, 푄 is mass force, 퐹 is forced term.
The thermal properties of porous media are obtained by the average volume method for media and fluid in the porous. The heat equation for media is
(1 − 휀)휌 퐶 , 푇 − (1− 휀)∇ ∙ 푘 ∇푇 = 0 (3)
and the energy balance for fluid is
휀휌 퐶 , 푇 + ∇ ∙ 휌 퐶 , 퐷푇 − ε∇ ∙ 푘 ∇푇 = 0 (4)
here, 푇 ,푇 is the temperature of media and fluid, separately. 퐷is the Darcy velocity along the main axis of flow direction.
In this model, the heat transfer phenomena are discussed as the supercritical carbon-dioxide flows into the heated porous medium. The conditions of reservior under the depths of up to 3 kilometers are used. A 3D
ASDF Thailand Proceedings of the International Congress 2014 [IC 2014], Bangkok, Thailand 74
Int Congress 2014 ISBN : 978-81-929742-3-1 www.intcongress.com

model is established by finite element method – COMSOL multiphy package. The material of tube is stain steel. The length, outer-diameter and inner-diameter is 133 mm, 20 mm and 10 mm, respectively. The wall heating condition is subjected on the wall of tube. The supercritical properties of carbon-dioxide are modelled using interpolation functions based on data from the NIST standard reference database 69.
In addition, the initional and boundary conditions are listed as below
The temperature and inlet velocity boundary of the outer wall of the test section is−n ⋅ (k∇T) = q , and u=0 , v=0 , w=0. The temperature boundary of the inner wall of the test section is−n ⋅ (k∇T) = 0. Then, the inlet velocity and temperature isu = −U n , and T = T . The exit pressure and velocity is assumed as p = p , μ ∇u + (∇u ) n = 0.
Figure 1. The model of the test section of geothermal reservoir
III. Results and Discussion
In this study, the effects of inlet volumetric flow rate and pressure are concerned. In advance, the model with higher pressure is discussed in this study. It will apply to the non-traditional EGS for higher depth. Different kinds of pressure (10.3 Mpa, 13.8 Mpa, 17.2 Mpa, 20.6 Mpa ) and inlet volumetric flow rate (10 ml/min, 30 ml/min, 50 ml/min, 100 ml/min, 300 ml/min and 500 ml/min) are studied, respectively. The heat transfer phenomena are obtained from this 3D porous model.
For the reason of the apparent variation of the thermal properties of supercritical CO2 with different pressure and temperature, the different kinds of pressure should be discussed in the research of supercritical CO2. The porous and permeability of this model is assumed as 0.2, and 1E-13 m2. The heat flux subjected on the surface of the test section is 3160 W/m2, and the CO2 temperature on the inlet is 313.15 K. Fig. 2 is the profile of the temperature difference on the exit between the supercritical carbon-dioxide and the tube wall with different pressure. The inlet volumetric flow rate is 50 ml/min. In Fig. 2, we observe that the temperature difference (∆T) decreases as the pressure decreases. In addition, the temperature difference on the 10.3 MPa is more larger the ones on other pressure apparently. This is the reason of the special property of supercritical CO2. The specific heat of supercritical CO2 on 10.3 MPa and 313.15K is 1.75-2.5 times of the ones on the other pressure. In addition the temperature contours of test section under 10.3MPa and 20.6MPa are shown in the Figs. 3 and 4. The temperature increases gradually from inlet to exit and boundary part to inner part obviously. It represents that the heat extraction is available as the supercritical CO2 flows through the porous media. The distribution is similiar as the pressure is 10.3 MPa and 20.6 MPa. The major discrepancy is the temperature of exit, which is 420K and 370K under 10.3MPa and 20.6 MPa, respectively. It will illustratte the effect of specific heat of supercritical CO2 in advance.
ASDF Thailand Proceedings of the International Congress 2014 [IC 2014], Bangkok, Thailand 75
Int Congress 2014 ISBN : 978-81-929742-3-1 www.intcongress.com

Figure 2. The temperature difference between inlet and exit with the different pressure (volumetric flow rate is 50ml/min).
Figure 3.The temperature contour of test section (P is 10.3 MPa, volumetric flow rate is 50ml/min).
Figure 4. The temperature contour of test section (P is 20.6 MPa, volumetric flow rate is 50ml/min).
ASDF Thailand Proceedings of the International Congress 2014 [IC 2014], Bangkok, Thailand 76
Int Congress 2014 ISBN : 978-81-929742-3-1 www.intcongress.com

For EGS, the pump work is important to inject the working fluid. Therefore, the discussions of the effect of the volumetric flow rate is necessary for the efficiency of EGS. This study will observe the temperature difference and heat extraction affected by the volumetric flow rate. The volumetric flow rate discussed in this study is 10 ml/min, 30 ml/min, 50 ml/min, 100 ml/min, 300 ml/min and 500 ml/min, separately. The profiles of temperature difference with different volumetric flow rate and pressure are shown in Fig. 5. We observe clearly that the temperature difference decreases as the volumetric flow rate decreases. We can find that ∆T is 10 K at 500 ml/min, and approaches to 250K at 10 ml/min. It illustrates that the volumetric flow rate will affect the heat extraction apparently. The behaviour of supercritical fluid is similar to the general fluid. The slower flow can extract the more heat from the environment. It can apply to the better heat extraction under the lower inlet velocity. Slower the flow is, more heat absorption are.
Figure 5. The temperature difference between inlet and exit with the different pressure and volumetric flow rate (qw is 3160W/m2).
Through the comparison with Fig. 2, we find that the temperature difference decreases as the pressure decreases for the condition is that the volumetric flow rate is lower than 100ml/min. As the volumetric flow rate is larger than 100ml/min, the variation of temperature difference is not apparent with the different pressure but increasesas slightly as the pressure decreases. The major reason is the faster velocity results in the negative effect of the heat extraction.
To examine the effects of inlet volumetric flow rate and pressure more clearly, Fig. 6 presents the heat extraction related to the inlet volumetric flow rate and pressure. According to Fig. 6, the heat extraction is 0.145 W as the volumetric flow rate is 50 ml/min and pressure is 10.3 MPa. Here, a maximun heat extraction is reached. Therefore, we prove that the heat extraction will reach an optimal value for the suitable volumetric flow rate. This conclusion can be suggested to the realistic EGS. The suitable combination of depth and inlet volumetric flow rate will reach the maximun heat extraction and provide the maximun geothermal source.
This study will model the heat extraction of CO2-EGS on the porous media. We expect these results can result in the better operating conditions for the improvement of the efficiency of the CO2-EGS.
ASDF Thailand Proceedings of the International Congress 2014 [IC 2014], Bangkok, Thailand 77
Int Congress 2014 ISBN : 978-81-929742-3-1 www.intcongress.com

Figure 6. The heat extraction with the different pressure and volume flow rate (qw is 3160W/m2).
IV. Conclusions
This study is to discuss the thermal phenomena of the supercritical CO2 in the geothermal reservoir for the enhanced geothermal system. In this study, the transient heat transfer model conjugated with the model of Brinkman equation employed by the finite element package is used to obtain the dynamic and thermal behavior in the porous medium. The sensitivity parameter study under the various inlet volumetric flow rate and pressure are discussed. The effects of lower pressure and slower flow will increases the heat extraction effectively. This study can enhance the heat extraction and reduce the cost of realistic test of enhanced geothermal system. We expect these results can result in the better operating conditions for the improvement of the efficiency of the CO2-EGS. In addition, this proposed model will build an effective way to simplify the evaluated procedure in the geothermal system.
Acknowledgment
The financial support provided to this study by the National Science Council of the Republic of China under Contract No. MOST 103-3113-M-024 -001 is gratefully acknowledged. The authors would like to express gratitude to the Bureau of Energy of the Ministry of Economic Affairs, Taiwan, for supporting this research with Energy R&D foundation funding.
References
1. I. B. Fridleifsson, “Geothermal energy for the benefit of the people,” Renewable and Sustainable Energy Reviews, vol. 5, issue 3, pp. 299–312, 2001.
2. D. W. Brown, “A hot dry rock geothermal energy concept utilizing supercritical CO2 instead of water,” Twenty-Fifth Workshop on Geothermal Reservoir Engineering, 2000.
3. Y. Wan, T. Xu, and K. Pruess, “Impact of fluid-rock interactions on enhanced geothermal systems with CO2 as heat transmission fluid,” Thirty-Sixth Workshop on Geothermal Reservoir Engineering Stanford University, 2011.
4. L. Liu, Y. Suto, G. Bignall, N. Yamasaki, and T. Hashida, “CO2 injection to granite and sandstone in experimental rock/hot water systems,” Energy Conversion & Management, vol. 44, pp. 1399-1410, 2003.
ASDF Thailand Proceedings of the International Congress 2014 [IC 2014], Bangkok, Thailand 78
Int Congress 2014 ISBN : 978-81-929742-3-1 www.intcongress.com

5. R. J. Rosenbauer, T. Koksalan, and J.L. Palandri, “Experimental investigation of CO2- brine-rock interactions at elevated temperature and pressure: Implications for CO2 sequestration in deep-saline aquifers,” Fuel Processing Technology, vol. 86, pp. 1581-1597, 2005.
6. A. Ueda, K. Kato, T. Ohsumi, T. Yajima, H. Ito, and H. Kaieda, “Experimental studies of CO2-rock interaction at elevated temperatures under hydrothermal conditions,” Geochem.J, vol. 39,pp. 417–425, 2005.
7. K. Pruess, and M. Azaroual, “On the feasibility of using supercritical CO2 as heat transmission fluid in an engineered hot dry rock geothermal system,” Proceedings of the Thirty-First Workshop on Geothermal Reservoir Engineering, pp. 386–393, 2006.
8. K. Pruess, “Enhanced geothermal systems (EGS) using CO2 as working fluid - a novel approach for generating renewable energy with simultaneous sequestration of carbon,” Geothermics, vol. 35, pp. 351-367, 2006.
9. K. Pruess, “On production behavior of enhanced geothermal systems with CO2 as working fluid,” Energy Conversion and Management, vol. 49, pp. 1446-1454, 2008.
10. K. Pruess, “The TOUGH Codes - A family of simulation tools for multiphase flow and transport processes in permeable media,” Vadose Zone Journal, vol. 3, pp. 738-746, 2004.
11. T. Xu, E.L. Sonnenthal, N. Spycher, and K. Pruess, “TOUGHREACT: A simulation program for non-isothermal multiphase reactive geochemical transport in variably saturated geologic media,” Computers & Geosciences, vol. 32, pp. 145-165, 2006.
12. T. Xu, K. Pruess, and J. Apps, “Numerical studies of fluid-rock interactions in enhanced geothermal systems (EGS) with CO2 as working fluid,” Thirty-third Workshop on Geothermal Reservoir Engineering Stanford University, pp. 28- 30, 2008.
13. T. Xu, P. Rose, S. Fayer, and K. Pruess, “On modeling of chemical stimulation of an enhanced geothermal system using a high pH solution with chelating agent,” Geofluids,vol. 9, pp. 167-177, 2009.
14. T. Xu, Y.K. Kharaka, C. Doughty, B.M. Freifeld, and T.M. Daley, “Reactive transport modeling to study changes in water chemistry induced by CO2 injection at the Frio-1 brine pilot,” Chemical Geology, vol. 271, pp. 153-164, 2010.
15. N. Pycher, and K. Pruess, “A phase- partitioning model for CO2–brine mixtures at elevated temperatures and pressures: application to CO2-enhanced geothermal systems,” Transport Porous Media, vol. 82, pp. 173–196, 2010.
16. A. D. Atrens, H.Gurgenci, and V. Rudolph, “Electricity generation using a carbon-dioxide thermosiphon,” Geothermics, vol. 39, pp. 161–169, 2010.
17. M. Haghshenas Fard, K. Hooman, and C.H. Chua, “Numerical simulation of a supercritical CO2geothermosiphon,”International Communications in Heat and Mass Transfer, vol. 37, pp. 1447–1451, 2010.
18. P. X. Jiang, Y.J. Xu, J. Lv, R.F. Shi, S. He, and J.D. Jackson, “Experimental investigation of convection heat transfer of CO2 at super critical pressures in vertical mini-tubes and in porous media,” Applied Thermal Engineering, vol. 24, issue 8–9, pp.1255–1270, 2004.
19. S. M. Liao,and T.S. Zhao, “An experimental investigation of convection heat transfer to supercritical carbon dioxide in miniature tubes,” International Journal of Heat and Mass Transfer, vol. 25, issue 45, pp. 5025–34, 2002.
20. X. L. Cao, Z.H. Rao, and S.M. Liao, “Laminar convective heat transfer of supercritical CO2 in horizontal miniature circular and triangular tubes,” Applied Thermal Engineering, vol. 31, issue 14–15, pp. 2374–2384, 2011.
ASDF Thailand Proceedings of the International Congress 2014 [IC 2014], Bangkok, Thailand 79
Int Congress 2014 ISBN : 978-81-929742-3-1 www.intcongress.com

Kinetics of Sodium Borohydride Hydrolysis on Cobalt with Different Structures
E. Norkus, L. Tamašauskaitė-Tamašiūnaitė, S. Lichušina, D. Šimkūnaitė, A. Žielienė, I. Stalnionienė, L. Naruškevičius, A. Selskis, B. Šimkūnaitė-Stanynienė
Center for Physical Sciences and Technology, A. Goštauto 9, Vilnius LT-01108, Lithuania
Abstract- In the present study cobalt with a fiber and smooth structures were deposited onto the titanium surface. The morphology, structure and composition of the prepared catalysts were examined by means of Field Emission Scanning Electron Microscopy and Energy Dispersive X-ray Spectroscopy. The catalytic activity of cobalt with a fiber and smooth structures deposited onto the titanium surface was investigated towards the hydrolysis of sodium borohydride. It was found that a fiber structure Co shows higher activity towards the hydrolysis of sodium borohydride as compared with that of Co with a smooth structure.
I. Introduction
Among chemical hydrides sodium borohydride is an attractive alternative fuel for application in fuel cells as alternative hydrogen sources (indirect borohydride fuel cells (IDBFC)) due to its advantages of high hydrogen storage efficiency (10.8 wt.%), stability in air at high pH values, easily controlled generation of hydrogen and high purity of hydrogen obtained from the catalytic hydrolysis of sodium borohydride solution, non-flammability and side product recyclability[1, 2]. The development of low-cost non-noble metal catalysts with high activity with respect to the hydrolysis reaction of borohydride and durability plays an important role in the hydrogen generation for fuel cells.
In the present study cobalt with a fiber and smooth structures were deposited onto the titanium surface (denoted as Cofiber/Ti and Cosmooth/Ti) by means of electrodeposition and electroless metal plating. The morphology, structure and composition of the prepared catalysts were examined by means of Field Emission Scanning Electron Microscopy and Energy Dispersive X-ray Spectroscopy. The catalytic activity of cobalt with a fiber and smooth structures deposited onto the titanium surface was investigated towards the hydrolysis of sodium borohydride.
II. Experimental Details
Chemicals
Titanium sheets (99.7% purity, 0.127 mm thickness), NaBH4 and CoCl2 were purchased from Sigma-Aldrich Supply. H2SO4 (96%) and NaOH (99%) were purchased from Chempur Company. All chemicals were of analytical grade. Deionized water with the resistivity of 18.2 M cm–1 was used to prepare all the solutions.
Fabrication of Catalysts
Cobalt coatings with a smooth structure were deposited by electroless deposition. Prior to electroless cobalt deposition, the titanium sheets (1 x 1 cm) were degreased with ethanol, rinsed with deionized water and dried in an Ar stream. Then the cobalt coatings were deposited on the titanium surface according to the following procedures: a) activation of the Ti surface in a 0.5 g/l PdCl2 solution for 60 s; b) subsequent rinsing of the activated surface with deionized water; c) followed by immersion of the activated sample into an electroless cobalt bath for 45 min [3]. The bath operated at a temperature of 25 ± 2 oC. The surface-to-volume ratio was 1.3 dm2 l–1.
ASDF Thailand Proceedings of the International Congress 2014 [IC 2014], Bangkok, Thailand 80
Int Congress 2014 ISBN : 978-81-929742-3-1 www.intcongress.com

Cobalt coatings with a fiber structure and the thickness of 3 m were deposited onto the titanium surface (1 x1 cm) via electro deposition [4, 5]. Prior to deposition of the Co coating with a fiber structure, the titanium plates were degreased with acetone and then pretreated in diluted H2SO4 (1:1 vol) at 90 oC for 10s.
Then, Co coatings deposited onto the titanium surface were used for measurements of hydrogen generation from the sodium borohydride solution without any further treatment.
Characterization of Catalysts
The morphology and composition of the fabricated catalysts were characterized using a SEM/FIB workstation Helios Nanolab 650 with an energy dispersive X-ray (EDX) spectrometer INCA Energy 350 X-Max 20.
Kinetic Studies of the Catalytic Hydrolysis of NaBH4
The amount of generated hydrogen was measured by using a classic water-displacement method with the aim to characterize the catalytic effectiveness of the Cosmotth/Ti and Cofiber/Ti catalysts. In a typical measurement the reaction solution containing NaBH4 and NaOH was thermostated in an airtight flask fitted with an outlet for collection of evolved H2 gas, and then the Cosmotth/Ti and Cofiber/Ti catalysts were immersed into the designated temperature solution to initiate hydrolysis reaction. As the reaction proceeded, the water displaced from a graduate cylinder connected to the reaction flask was continually monitored. The rate of generation of hydrogen was measured at different solution temperatures (25, 35, 45 and 55 oC) in order to determine the activation energy.
III. Results and Discussion
Figure 1a shows FESEM image of as-prepared Cosmooth/Ti, from which evident that the layer of polycrystalline Co with the average size of crystallites ca. 400-900 nm was deposited onto the titanium surface. The thickness of the electroless Co layer was from ca. 500 nm up to 1 m. As seen from Figure 1b, a fiber structure Co was electrodeposited onto the titanium surface with the fibers in the order of tens of nanometers in thickness and hundreds of nanometers in length [4, 5]. Cobalt coatings with the thickness of 3 m were deposited on the titanium surface.
Figure 1. FESEM images of Co layers with a smooth (a) and fiber (b) structure deposited onto the titanium surface.
The activity of the Cosmooth/Ti and Cofiber/Ti catalysts was investigated towards the catalytic hydrolysis of NaBH4. Figure 2 presents the volume of generated hydrogen with respect to reaction time with the Cosmooth/Ti and Cofiber/Ti catalysts in a 0.05 M NaBH4 + 1 M NaOH solution at the temperature of 35 oC.
ASDF Thailand Proceedings of the International Congress 2014 [IC 2014], Bangkok, Thailand 81
Int Congress 2014 ISBN : 978-81-929742-3-1 www.intcongress.com
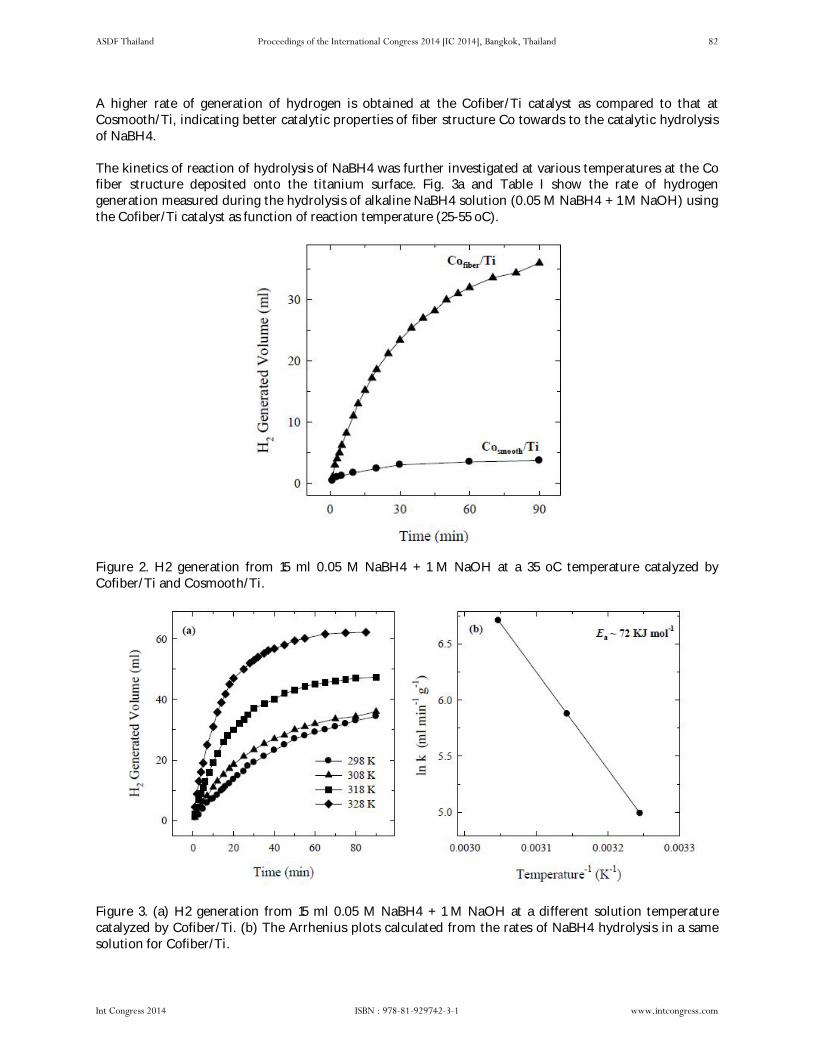
A higher rate of generation of hydrogen is obtained at the Cofiber/Ti catalyst as compared to that at Cosmooth/Ti, indicating better catalytic properties of fiber structure Co towards to the catalytic hydrolysis of NaBH4.
The kinetics of reaction of hydrolysis of NaBH4 was further investigated at various temperatures at the Co fiber structure deposited onto the titanium surface. Fig. 3a and Table I show the rate of hydrogen generation measured during the hydrolysis of alkaline NaBH4 solution (0.05 M NaBH4 + 1 M NaOH) using the Cofiber/Ti catalyst as function of reaction temperature (25-55 oC).
Figure 2. H2 generation from 15 ml 0.05 M NaBH4 + 1 M NaOH at a 35 oC temperature catalyzed by Cofiber/Ti and Cosmooth/Ti.
Figure 3. (a) H2 generation from 15 ml 0.05 M NaBH4 + 1 M NaOH at a different solution temperature catalyzed by Cofiber/Ti. (b) The Arrhenius plots calculated from the rates of NaBH4 hydrolysis in a same solution for Cofiber/Ti.
ASDF Thailand Proceedings of the International Congress 2014 [IC 2014], Bangkok, Thailand 82
Int Congress 2014 ISBN : 978-81-929742-3-1 www.intcongress.com

As seen from the data given in Table I, the rate of catalytic hydrolysis of NaBH4 in alkaline solutions increases exponentially with increase in reaction temperature, and a maximum value of 821 ml min–1 g–1 is obtained at 55 oC. Temperature dependence of the rate of generation of hydrogen is expressed by the Arrhenius equation:
k = Ae–Ea/RT, (1)
where Ea is the activation energy (J), A - the frequency factor, R - the general gas constant (8.314 J mol–1 K–1). In order to find activation energy and frequency factor, the Arrhenius plot of ln(k) vs 1/T was constructed from the data presented in Fig. 3a and is given in Fig. 3b. The Arrhenius plot gives activation energy of 72 kJ mol–1. The obtained data confirm that the fiber structure Co layer deposited onto titanium catalyzes efficiently the hydrolysis reaction of NaBH4 in alkaline solutions. Table I. Dependence of hydrogen generation rate on temperature obtained at Cofiber/Ti in a 0.05 M NaBH4
IV. Conclusions
A fiber structure Co was electrodeposited onto the titanium surface with the fibers in the order of tens of nanometers in thickness and hundreds of nanometers in length via electrodeposition. The Co with a smooth structure was deposited by electroless deposition of Co. The layer of polycrystalline Co with the average size of crystallites ca. 400-900 nm was deposited onto the titanium surface. It was found that a fiber structure Co shows higher activity towards the hydrolysis of sodium borohydride as compared with that of Co with a smooth structure.
References
1. S. C. Amendola, S. L. Sharp-Goldman, M. S. Janjua, N. C. Spencer, M. T. Kelly, P. J. Petillo, et al., “A safe, portable, hydrogen gas generator using aqueous borohydride solution and Ru catalyst”, Int. J. Hydrogen Energy, 25 (2000) 969-975.
2. S. C. Amendola, S. L. Sharp-Goldman, M. S. Janjua, M. T. Kelly, P. J. Petillo, and M. Binder, “An ultrasafe hydrogen generator: aqueous, alkaline borohydride solutions and Ru catalyst“, J. Power Sources, 85 (2000) 186-189.
3. A. Vaškelis, A. Jagminienė, I. Stankevičienė, and E. Norkus. “Electroless deposition of cobalt alloys”. US patent 7,794,530 B2 (2010).
4. S. Lichušina, A. Chodosovskaja, A. Selskis, K. Leinartas, P. Miečinskas, and E. Juzeliūnas, “Pseudocapacitive behaviour of cobalt oxide films on nano-fibre and magnetron-sputtered substrates“, Chemija, 19 (2008) 7-15.
5. S. Lichušina, A. Chodosovskaja, K. Leinartas, A. Selskis, and E. Juzeliūnas, “Sulfide-enhanced electrochemical capacitance of cobalt hydroxide on nanofibered parent substrate“, J. Solid State Electrochem., 14 (2010). 1577-1584.
ASDF Thailand Proceedings of the International Congress 2014 [IC 2014], Bangkok, Thailand 83
Int Congress 2014 ISBN : 978-81-929742-3-1 www.intcongress.com

Graphene Supported Platinum-Cobalt Nanoparticles as Anode Electrocatalyst for Direct
Methanol Fuel Cell V. Kepenienė, L. Tamašauskaitė-Tamašiūnaitė, J. Jablonskienė, M. Semaško,
J. Vaičiūnienė, R. Kondrotas, E. Norkus
Center for Physical Sciences and Technology, A. Goštauto 9, Vilnius LT-01108, Lithuania
Abstract- In the present study the graphene supported platinum-cobalt nanoparticles were prepared via microwave synthesis. The composition of prepared catalysts was examined by Inductively Coupled Plasma Optical Emission Spectroscopy. The shape and size of catalyst particles were determined by Transmission Electron Microscopy. The electrocatalytic activity of the graphene supported platinum-cobalt nanoparticles was investigated towards the electrooxidation of methanol in an alkaline medium. It was found that the graphene supported platinum-cobalt nanoparticles having the Pt:Co molar ratio 1:7 shows highest activity towards the electro-oxidation of methanol as compared with that of catalysts with the Pt:Co molar ratios equal to 1:1 and 1:44 and the graphene supported bare Co or commercial Pt/C with 10 wt.% Pt loading.
I. Introduction
Among the supports for the Pt-based catalysts such as carbon black, graphite nanofibres and carbon nanotubes [1-3], graphene as a catalyst support has incurred an intense interest in fuel cell applications due to its unique, outstanding physicochemical properties, such as an extremely high specific surface area (2600 m2g–1), a superior electronic conductivity, a high surface to volume ratio and a high stability [4, 5]. The combination of metal nanoparticles and graphene opens up new possibilities for design of the next generation catalysts [6].
In our previous works [7, 8] it has been shown that the graphene supported platinum-cobalt catalysts prepared by means of microwave synthesis enhance electrocatalytic activity towards the oxidation of borohydride and ethanol in an alkaline medium and are promising anode materials for direct borohydride fuel cells (DBFCs) and ethanol fuel cells (DEFCs). In the present study the activity of the graphene supported platinum-cobalt nanoparticles towards the electro-oxidation of other fuel, i.e. methanol, in an alkaline medium was investigated. The composition of prepared catalysts was examined by Inductively Coupled Plasma Optical Emission Spectroscopy (ICP-OES). The shape and size of catalyst particles were determined by Transmission Electron Microscopy (TEM).
II. Experimental Details
Fabrication of Catalysts
The graphene supported platinum-cobalt nanoparticles (denoted as PtCo/GR catalyst) with the different Pt:Co molar ratios were prepared by microwave heating of ethylene glycol (EG) solutions of Pt(IV) and Co(II) salts as was described in [7, 8]. Briefly: 0.25 ml of 0.096 M H2PtCl6 and 0.6 ml solution of different concentrations of CoCl2 were mixed with 18 ml of EG. Then, pH of the solution was adjusted to 11.7 by adding dropwise a 1 M NaOH solution. 100 mg of graphene (purity of 97%, specific surface area - 60 m2/g) was added to the mixture and sonicated for 30 min. The reduction of Pt and Co nanoparticles was carried out in the microwave reactor Monowave 300 (Anton Paar) at a temperature of 170°C for 30 min. For comparison, the graphene supported cobalt nanoparticles (denoted as Co/GR catalyst) were prepared under the same conditions. After preparation, the synthesized catalysts were washed with acetone, ultra-pure water with the resistivity of 18.2 M cm–1, then filtered and dried in a vacuum oven at 80°C for 2 h.
ASDF Thailand Proceedings of the International Congress 2014 [IC 2014], Bangkok, Thailand 84
Int Congress 2014 ISBN : 978-81-929742-3-1 www.intcongress.com

Characterization of Catalysts
The shape and size of catalyst particles were examined using a transmission electron microscope Tecnai G2 F20 X-TWIN equipped with an EDAX spectrometer with an r-TEM detector. For microscopic examinations, 10 mg of sample were first sonicated in 1 ml of ethanol for 1 h and then deposited on Cu grid covered with a continuous carbon film.
The composition of the PtCo/GR catalysts was estimated from ICP-OES measurements. The ICP optical emission spectra were recorded using an ICP optical emission spectrometer Optima 7000DV (Perkin Elmer).
Electrochemical Measurements
The working electrode was a thin layer of Nafion-impregnated PtCo/GR, Co/GR and commercial Pt/C with 10 wt.% Pt loading catalysts cast on a glassy carbon electrode, a Pt sheet was used as a counter electrode and an Ag/AgCl/KCl (3 M KCl) electrode was used as reference. The catalyst layer was obtained according to the following steps: at first 10 mg of the PtCo/GR or Co/GR catalysts were dispersed ultrasonically for 1 hour in a solution containing 0.25 μl of 5 wt.% Nafion (D521, 1100 EW) and 0.75 μl deionized H2O, while 10 mg of Pt/C with 10 wt.% Pt loading were dispersed ultrasonically for 1 hour in a solution containing 0.25 μl of 5 wt.% Nafion and 0.75 μl 2-propanol solution, to produce a homogeneous slurry. Then 5 μl of the prepared suspension mixture was pipetted onto the polished surface of a glassy carbon electrode with a geometric area of 0.07 cm2 and dried in air for 12 h.
All electrochemical measurements were performed with a Zennium electrochemical workstation (ZAHNERElektrik GmbH & Co.KG). Steady state linear sweep voltammograms were recorded in a 1 M CH3OH + 0.5 M NaOH solution at a linear potential sweep rate of 50 mV s–1 from -0.5 to 0.3 V at a temperature of 25 oC. The electrode potential is quoted versus the standard hydrogen electrode (SHE). The presented current densities are normalized with respect to the geometric area of catalysts.
The chronoamperometric curves for the investigated Pt/C and PtCo/GR catalysts were recorded in a 1 M CH3OH + 0.5 M NaOH solution at a constant potential value of 0 V vs. SHE for 5 min. All solutions were deaerated by argon for 15 min prior to measurements.
III. Results and Discussion
In the study presented herein a rapid microwave heating method was used to prepare the graphene supported platinum-cobalt nanoparticles with the different Pt:Co molar ratios. The composition of the prepared catalysts was determined by ICP-OES. It was found that the graphene supported platinum-cobalt catalysts with the Pt:Co molar ratios equal to 1:1, 1:7 and 1:44 (denoted as PtCo(1:1)/GR, PtCo(1:7)/GR and PtCo(1:44)/GR) were synthesized by means of rapid microwave heating.
Fig. 1 shows HRTEM images and corresponded EDX spectra of the Pt/C (a, e) and graphene supported PtCo nanoparticles with the Pt:Co molar ratios equal to 1:1 (b, f), 1:7 (c, g) [7] and 1:44 (d, h) [7]. According to the data of TEM analysis of the graphene supported PtCo and Pt/C catalysts, the Pt nanoparticles of ca. 1-3 nm in size were deposited on the surfaces of graphene and carbon. Pt nanoparticles were uniform and well dispersed on the surfaces of graphene and carbon.
ASDF Thailand Proceedings of the International Congress 2014 [IC 2014], Bangkok, Thailand 85
Int Congress 2014 ISBN : 978-81-929742-3-1 www.intcongress.com

Figure 1. HRTEM images and corresponded EDX spectra of Pt/C (a, e), PtCo(1:1)/GR (b, f), PtCo(1:7)/GR (c, g) and PtCo(1:44)/GR (d, h).
The EDX spectra confirm the presence of Pt and Co nanoparticles in the investigated PtCo(1:1)/GR, PtCo(1:7)/GR and PtCo(1:44)/GR catalysts (Fig. 1 (f-h)).
Data of XRD analysis of the investigated catalysts described in Refs. [8] confirm that the crystallites of Pt in the synthesized graphene supported PtCo catalysts are very small, whereas the metallic Co crystallites of ca. 12 nm in size with an increased hexagonal crystal lattice (a = 0.25083 nm, c = 0.40824 nm) are predominant in the PtCo/GR catalysts. It should be noted that the increase in a lattice parameter could be caused by formation of platinum solid solution in cobalt.
The electrocatalytic activity of the graphene supported PtCo catalysts with the different Pt:Co molar ratios towards the electro-oxidation of methanol in an alkaline medium was compared with that of the commercial Pt/C catalyst with 10 wt.% Pt loading. The Pt/C, PtCo(1:1)/GR, PtCo(1:7)/GR and PtCo(1:44) catalysts with the Pt loadings of 0.385, 0.160, 0.165 and 0.125 mg Pt cm–2, respectively, were used for
ASDF Thailand Proceedings of the International Congress 2014 [IC 2014], Bangkok, Thailand 86
Int Congress 2014 ISBN : 978-81-929742-3-1 www.intcongress.com
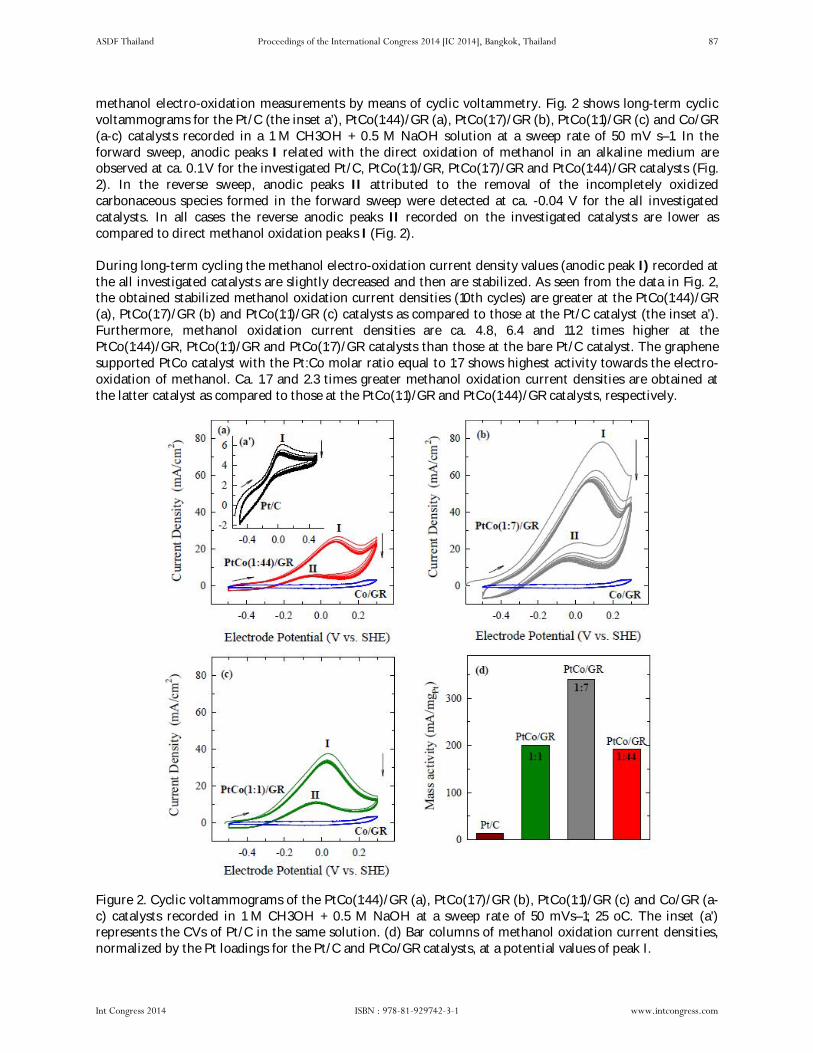
methanol electro-oxidation measurements by means of cyclic voltammetry. Fig. 2 shows long-term cyclic voltammograms for the Pt/C (the inset a’), PtCo(1:44)/GR (a), PtCo(1:7)/GR (b), PtCo(1:1)/GR (c) and Co/GR (a-c) catalysts recorded in a 1 M CH3OH + 0.5 M NaOH solution at a sweep rate of 50 mV s–1. In the forward sweep, anodic peaks I related with the direct oxidation of methanol in an alkaline medium are observed at ca. 0.1 V for the investigated Pt/C, PtCo(1:1)/GR, PtCo(1:7)/GR and PtCo(1:44)/GR catalysts (Fig. 2). In the reverse sweep, anodic peaks II attributed to the removal of the incompletely oxidized carbonaceous species formed in the forward sweep were detected at ca. -0.04 V for the all investigated catalysts. In all cases the reverse anodic peaks II recorded on the investigated catalysts are lower as compared to direct methanol oxidation peaks I (Fig. 2).
During long-term cycling the methanol electro-oxidation current density values (anodic peak I) recorded at the all investigated catalysts are slightly decreased and then are stabilized. As seen from the data in Fig. 2, the obtained stabilized methanol oxidation current densities (10th cycles) are greater at the PtCo(1:44)/GR (a), PtCo(1:7)/GR (b) and PtCo(1:1)/GR (c) catalysts as compared to those at the Pt/C catalyst (the inset a’). Furthermore, methanol oxidation current densities are ca. 4.8, 6.4 and 11.2 times higher at the PtCo(1:44)/GR, PtCo(1:1)/GR and PtCo(1:7)/GR catalysts than those at the bare Pt/C catalyst. The graphene supported PtCo catalyst with the Pt:Co molar ratio equal to 1:7 shows highest activity towards the electro-oxidation of methanol. Ca. 1.7 and 2.3 times greater methanol oxidation current densities are obtained at the latter catalyst as compared to those at the PtCo(1:1)/GR and PtCo(1:44)/GR catalysts, respectively.
Figure 2. Cyclic voltammograms of the PtCo(1:44)/GR (a), PtCo(1:7)/GR (b), PtCo(1:1)/GR (c) and Co/GR (a-c) catalysts recorded in 1 M CH3OH + 0.5 M NaOH at a sweep rate of 50 mVs–1; 25 oC. The inset (a') represents the CVs of Pt/C in the same solution. (d) Bar columns of methanol oxidation current densities, normalized by the Pt loadings for the Pt/C and PtCo/GR catalysts, at a potential values of peak I.
ASDF Thailand Proceedings of the International Congress 2014 [IC 2014], Bangkok, Thailand 87
Int Congress 2014 ISBN : 978-81-929742-3-1 www.intcongress.com

It should be noted that the investigated PtCo(1:1)/GR, PtCo(1:7)/GR and PtCo(1:44)/GR catalysts outperformed the bare Co/GR catalyst. Since the Co/GR catalyst exhibits significantly lower anodic currents as compared to those of the graphene supported PtCo catalysts with the different Pt:Co molar ratios, the enhanced electrocatalytic activity of the synthesized PtCo/GR catalysts may be ascribed to PtCo alloy formation and Pt electronic structure change due to the presence of Co [9-12].
To represent the mass activity of the Pt/C and graphene supported PtCo catalysts, methanol oxidation current densities were normalized by the Pt loadings for each catalyst. Figure 2d shows bar columns of methanol oxidation mass activities for the investigated catalysts at a the potential values of peak I. Methanol oxidation current densities normalized by the Pt loadings are ca. 14.8, 15.4 and 26.2 times higher at the PtCo(1:44)/GR, PtCo(1:1)/GR and PtCo(1:7)/GR catalysts as compared to those at Pt/C (Fig. 2d). It has been found that the graphene supported PtCo catalysts with the Pt:Co molar ratios equal to 1:1, 1:7 and 1:44 show an enhanced electrocatalytic activity towards the electro-oxidation of methanol in an alkaline medium as compared with that of the bare Pt/C catalyst.
The electrochemical stability of catalysts for methanol electro-oxidation was investigated by means of chronoamperometry. Fig. 3 shows the data obtained at the PtCo(1:1)/GR, PtCo(1:7)/GR, PtCo(1:44)/GR and Pt/C catalysts recorded at a constant potential of 0 V in a 1 M CH3OH + 0.5 M NaOH solution at 25 oC at the end of experimental period (t = 5 min). As evident from Fig. 3a, at the end of experimental period (t = 5 min), the current densities recorded at the PtCo(1:44)/GR, PtCo(1:1)/GR and PtCo(1:7)/GR catalysts are ca. 3.1, 4.8 and 7.9, respectively, are greater as compared to those at Pt/C, whereas ca. 1.6 and 2.6 times higher current densities are obtained at PtCo(1:7)/GR than those at PtCo(1:1)/GR and PtCo(1:44)/GR, respectively.
Figure 3. Bar columns of methanol oxidation current densities (a) and those normalized by the Pt loadings for each catalyst (b) obtained at the end of experimental period of 5 min, recorded at 0 V vs. SHE in 1 M CH3OH + 0.5 M NaOH at 25 oC.
The Pt mass current values for the electro-oxidation of methanol, recorded on the PtCo(1:7)/GR catalyst, are also ca. 1.6 and 1.9 times greater than those on the PtCo(1:1)/GR and PtCo(1:44)/GR catalysts, respectively (Fig. 3b). It should be noted that the investigated PtCo(1:1)/GR, PtCo(1:7)/GR and PtCo(1:44)/GR catalysts outperformed the bare Pt/C catalyst, i.e., the Pt mass current values are ca. 9.5, 11.6 and 18.4 times higher at PtCo(1:44)/GR, PtCo(1:1)/GR and PtCo(1:7)/GR than those at Pt/C. These data confirm the data obtained by cyclic voltammetry.
IV. Conclusions
The graphene supported platinum-cobalt catalysts with the Pt:Co molar ratios equal to 1:1, 1:7 and 1:44, with Pt nanoparticles of ca. 1-3 nm in size, were prepared by microwave synthesis. Highest electrocatalytic
ASDF Thailand Proceedings of the International Congress 2014 [IC 2014], Bangkok, Thailand 88
Int Congress 2014 ISBN : 978-81-929742-3-1 www.intcongress.com

activity towards the electro-oxidation of methanol shows the graphene supported PtCo catalyst with a Pt:Co molar ratio equal to 1:7 as compared with those at the graphene supported PtCo catalyst with the Pt:Co molar ratios equal to 1:1 and 1:44 and bare Co catalysts and the commercial Pt/C catalyst with 10 wt.% Pt loading. The graphene supported PtCo catalysts synthesized by means of rapid microwave synthesis seem to be a promising anode material for direct methanol fuel cells.
Acknowledgments
This research was funded by a Grant (No. ATE-08/2012) from the Research Council of Lithuania. V. Kepenienė acknowledges Postdoctoral fellowship is being funded by European Union Structural Funds project”Postdoctoral Fellowship Implementation in Lithuania”.
References
1. X. Yu and S. Ye, “Recent advances in activity and durability enhancement of Pt/C catalytic cathode in PEMFC Part II: Degradation mechanism and durability enhancement of carbon supported platinum catalyst,” J. Power Sources, 172 (2007) 145-154.
2. J. Wang, G. Yin, Y. Shao, S. Zhang, Z. Wang, and Y. Gao, “Effect of carbon black support corrosion on the durability of Pt/C catalyst,” J. Power Sources, 171 (2007) 331-339.
3. Y. Shao, G. Yin, and Y. Gao, “Understanding and approaches for the durability issues of Pt-based catalysts for PEM fuel cell,” J. Power Sources, 171 (2007) 558-566.
4. G. Zibao, Z. Xiuwen, W. Dailing, H. Qitu, Z. Aihua, Z. Xu, et al., “One-pot synthesis of one-dimensional array Pt nanoparticles on carbon nanotubes via a facile microwave polyol method,” Superlattice Micros., 47 (2010) 705-709.
5. S. Stankovich, D. A. Dikin, R. D. Piner, K. A. Kohlhaas, A. Kleinhammes, Y. Jia, et al., “Synthesis of graphene-based nanosheets via chemical reduction of exfoliated graphite oxide,” Carbon, 45 (2007) 1558-1565.
6. H. Huang, H. Chen, D. Sun, and X. Wang, “Graphene nanoplate-Pt composite as a high performance electrocatalyst for direct methanol fuel cells,” J. Power Sources, 204 (2012) 46-52.
7. L. Tamašauskaitė-Tamašiūnaitė, A. Radomskis, K. Antanavičiūtė, J. Jablonskienė, A. Balčiūnaitė, A. Žielienė, et al., “Graphene supported platinum-cobalt nanocomposites as electrocatalysts for borohydride oxidation,” Int. J. Hydrogen Energy, 39 ( 2014) 4282-4290.
8. V. Kepenienė, J. Jablonskienė, J. Vaičiūnienė, R. Kondrotas, R. Juškėnas and L. Tamašauskaitė-Tamašiūnaitė, “Investigation of graphene supported platinum-cobalt nanocomposites as electrocatalysts for ethanol oxidation,” ECS Transactions, 59 (2014) in press.
9. T. Toda, H. Igarashi, H. Uchida, and M. Watanabe, “Enhancement of the electroreduction of oxygen on Pt alloys with Fe, Ni, and Co,” J. Electrochem. Soc., 146 (1999) 3750-3759.
10. J. Greeley and M. Mavrikakis, “Alloy catalysts designed from first principles,” Nat. Mater., 3 (2004) 810-815.
11. J. Greeley and M.Mavrikakis, “Near-surface alloys for hydrogen fuel cell applications,” Catal. Today, 111 (2006) 52-58.
12. S. Papadimitriou, A. Tegou, E. Pavlidou, S. Armyanov, E. Valova, G. Kokkinidis, et al., “Preparation and characterization of platinum- and gold-coated copper, iron, cobalt and nickel deposits on glassy carbon substrates,” Electrochim. Acta, 53 (2008) 6559-6567.
ASDF Thailand Proceedings of the International Congress 2014 [IC 2014], Bangkok, Thailand 89
Int Congress 2014 ISBN : 978-81-929742-3-1 www.intcongress.com

Accuracy of Contemporary Parametric & Non Parametric Software Estimation Models: A
Comparative Analysis Dr. Aruna Deoskar, Jyoti Mokashi, Rinku Dulloo
Principal, ATSS, India Assistant Professor, RSCOE, India
Abstract: - In IT industry, the achievement of project depends upon the way desired product or application delivered in stipulated time, with negligible deviation on schedule & most important cost within limits. Here software project management plays a challenging and onerous role to pull off success and for which smart project planning with broad thought process is required.
This paper highlights the common size estimation metrics as a number of estimation models depend on a software size as an input. Also discuss different algorithmic & non algorithmic cost estimation models that have been anticipated and used successfully in the industry. Every cost estimation model has its own pros and cons. At the end of paper, comparative analysis of various estimation models is provided in the company of correlation of cost estimation models with project parameters. Keywords:-Source Line of Code (SLOC), Function Point (FP), Constructive Cost Model, Software Lifecycle Management(SLIM), EAF (Effort Adjustment Factor),Cost Estimation, Effort Estimation.
I. Introduction
For software project management, cost estimation is the most demanding tasks. Software cost estimation is a composite activity that requires awareness of the number of parameters about the project for which the estimate is constructed. Software practitioner knows the significance of realistic estimation of effort to the successful organization of software projects. Pragmatic estimation at the commencement of project’s life cycle permits project managers & development organizations to manage resources effectively. Software cost estimation is usually deliberate in terms of effort. For any type of software development there are some important indicators to consider
1. Size of project 2. Effort required 3. Cost essential to develop project
4. Time/Schedule taken by the project
The full paper is organized in sections which are listed as below. Section II describes related work in estimation field, Section III describes the problem statement, Section IV discuss the literature review, Section V explains size estimation, Section VI explains various algorithmic & non algorithmic estimation techniques, Section VII describes comparative analysis of various estimation techniques, Section VIII includes proposed metric and Section IX includes the conclusion and future work.
II. Related Work
Defining the project estimation early in the development life cycle is supreme challenge. K. Ramesh et al. [4] analyze algorithmic & non-algorithmic models and provide depth review of software and project estimation techniques existing in industry. Vahid et al. [3] focused on all the existing methods for software cost estimation methods and comparing their features. It is useful for selecting the special
ASDF Thailand Proceedings of the International Congress 2014 [IC 2014], Bangkok, Thailand 90
Int Congress 2014 ISBN : 978-81-929742-3-1 www.intcongress.com

method for each project. Lionel et al. [5] investigate data-driven approach for software cost estimation. They investigate which estimation technique produces accurate results either using typical software development cost data or organization specific data. Lalit et al. [2] represents modern idea which is based on PCA (Principal Component Analysis) with Artificial Neural Network by keeping the base of Constructive Cost Model II model. Where PCA can filters multiple input values into a few certain values. It also helps in reducing the gap between actual and estimated effort. Lionel et al.[8] replicates a comprehensive comparison of common estimation techniques within different organizational contexts.
Barry Boehm et al. [6] summarizes several classes of software cost estimation models and techniques. Abedallah et al. [7] describes the issues in software cost estimation (SCE) where they mentioned that SCE is a process used in software development industry to estimate or predict the resource, efforts, cost of any development process.
III. Problem Statement
To support the cost estimation as one of the major project failure reason, it is extremely necessary to understand the correct way of such estimation(s). The basic objective of this paper is
1. To propose a consolidated document highlighting the comparative analysis of estimation techniques.
2. To propose a metric this can suggest the suitable estimation technique for different types of projects.
IV. Literature Review
Software cost estimation is totally fluctuating as it does not denote the accurate values. There are lots of reasons which affect the accurate cost estimation and the reasons are:
1. Lack of user involvement, 2. Improper use of cost estimation technique due to failure in understanding project parameters, 3. Poor Planning, 4. Requirements of projects are changing continuously, 5. New requirements are added, but the original estimation cannot be changed, 6. Lack of awareness in understanding the estimating techniques, 7. Historical data is seldom available for calibration of estimates.
V. Size Estimation
Exact estimation of development effort and cost is totally depending on accurate prediction of the software size. Two such common techniques are
1. SLOC 2. FP Size Estimation
SLOC – Source Line of Code is the oldest metric for estimating project size. SLOC is nothing but the number of lines of the delivered source code of the software; SLOC estimation of a software system can be obtained from experience, the size of previous project, the size of a competitor’s project, and breaking down the system into smaller modules and estimating the SLOC of each module. SLOC is calculated by considering a as smallest, b as largest and m as most likely size (Roger S. Pressman, 2005).
Table 1: Stepwise SLOC Calculation
Steps Formulas Steps Formulas
ASDF Thailand Proceedings of the International Congress 2014 [IC 2014], Bangkok, Thailand 91
Int Congress 2014 ISBN : 978-81-929742-3-1 www.intcongress.com

Expected SLOC for Module Ei
Expected SLOC for
entire software system E
Standard deviation of each of
the estimates
Ei
SD of the expected SLOC for
entire software system
Note:- n is the total number of module.
FP Size Estimation - Function point is introduced by Allan Albrecht (1983) of IBM. The FP is programming language independent. FP is based on the number of ‘functions' that software has to fulfill.
Table 2: Stepwise FP Calculation
Steps Execution
I. Identify the function for a given indicator, Rate the function’s complexity must as low,
average, or high. It is necessary to define a weight for each above indicator which can be between 3 & 15.
Ii. Unadjusted
function points
UFP for entire system=Sum of (Each function count X weight associated with its complexity )i.e.
Where Wij - is the weight for row i and column j Xij - is the function count in cell i,j.
III. Calculating
adjusted function points
UFP do not consider environment variables for calculating effort. List of 14 general system indicators are rated from 0 to 5 with respect to their likely effect for the system being
counted.
Where Ci - Value of general system characterstic i , for 0<=Ci<=5
IV. FP FP=UFP X VAF V. Size in
FP Size(KLOC) = (FP X Selected Language)/1000
VI. Cost Estimation Techniques
More than 40 years, many more estimation models have been proposed. They fall in two categories
1. Algorithmic Approach 2. Non Algorithmic Approach
Algorithmic (Conventional) Software Cost Estimation
It uses parametric models which are derived from the statistical project data. Algorithmic Methods are
1.Putman Model (SLIM) 2. Seer-Sem 3.Linear Model 4. Multiplicative Model
5.Checkpoint 6. Boehm’s Model (COCOMO 81 & II)
ASDF Thailand Proceedings of the International Congress 2014 [IC 2014], Bangkok, Thailand 92
Int Congress 2014 ISBN : 978-81-929742-3-1 www.intcongress.com

Non-Algorithmic (Non Parametric) Software Cost Estimation
It is based on soft computing technique. Soft computing consists of distinct concept & techniques which aim to overcome difficulties encountered in real world problems. Non Algorithmic methods are
1. Estimation By Analogy 3. Machine Learning Models a. Neural Network b. Regression Model c. Fuzzy Logic d. Genetic Algorithm
2. Expert judgment
1. Putman’s Model
This model has been proposed by Putman according to manpower distribution and the examination of many software projects [3]. It is used for cost estimation and manpower scheduling of software. Equation is [3]
Where Effort is the effort in person-year
E-Environment factor that gives development capability S-Size in LOC
D0-Manpower build-up factor, ranges from 8(new software) to 27 (rebuilt software).
In the late 1970's, Larry Putnam developed the Software LIfecycle Model (SLIM). SLIM is based on Putnam’s analysis of the life cycle in terms of a so called Rayleigh distribution of project personal level versus time [6].
2. SEER-SEM (Software Evaluation and Estimation of Resources-Software Estimating Model)
SEER-SEM model is proposed in 1980 by Galorath [3]. It covers all phases of the project life-cycle, from specification through design, development, delivery and maintenance. It grip a mixture of environmental & application configurations like client–server, standalone, distributed, graphics, etc. SEER SEM uses sizing metrics as SLOC and FP.
3. Linear models
It is used in the large, revolutionary software cost estimation study carried by System Development Corporation. Linear model consist of straightforward construction with a plain equation:
Where xi - Cost driver variables ai - Set of coefficients which provide finest to a set of practical data points
4. Multiplicative Model
Multiplicative cost estimating model uses following form:
Where a0..….... an - set of coefficients, xi . . . . . . xn - cost driver variables.
ASDF Thailand Proceedings of the International Congress 2014 [IC 2014], Bangkok, Thailand 93
Int Congress 2014 ISBN : 978-81-929742-3-1 www.intcongress.com

Here xi can obtain only 3 possible values: -1, 0, +1. This model works fine if the variables chosen are sensibly independent [3].
5. Checkpoint
Checkpoint is a commercial proprietary model developed by T. Capers Jones of Software Productivity Research, Inc and is based on actual historical information from approximately 4,700 software projects [6]. Checkpoint analyzes the project classification information like nature, scope, class and kind. An exclusive aspect of the CHECKPOINT model is based on FP. Checkpoint predicts the initial staffing, effort, schedules, and the costs of producing the project's deliverables.
6. Boehm’s Model (COCOMO 81 & COCOMO II)
COCOMO model used by thousands of software project managers and it is the study of 100s software projects, this model calculate project effort and development time. It is structured into two parts
1. COCOMO I or COCOMO '81 2. COCOMO II (Advanced Model)
COCOMO I
Boehm proposed 3 levels of the model: Basic, Intermediate, Detailed COCOMO. It calculates Development Effort using:
Effort = a * (KLOC) b . . . . . expressed in person months (PMs) or Man-Month (MM).
Coefficients a & b depend on mode of the development. There are 3 modes of development.
Table 3: Development modes
Development Mode Project Characteristics
Size Innovation Constraints Dev. Environment Organic Small Little Not Tight Stable
Semi Detached Medium Medium Medium Medium Embedded Large Greater Tight Complex Hardware
Table 4: Comparative Information of COCOMO I
Factors Basic COCOMO Intermediate COCOMO Detailed COCOMO
Basic Info Good for quick, early,
rough estimation.
In addition, 15 cost drivers are rated to calculate effort
multiplier. EAF uses 15 parameters
covering Product, Personnel, Computer, and Project
familiarity.
It include all uniqueness of intermediate version with an
assessment of cost driver‘s impact on each step (analysis,
design, etc.) of software engineering process [14].
Applicable Small to medium products
Medium sized projects. Cost drivers are based on
product reliability, database size, execution & storages.
Team size is medium.
Large sized projects. Cost drivers are based on
requirements, analysis, design, testing and maintenance.
Team size is large.
ASDF Thailand Proceedings of the International Congress 2014 [IC 2014], Bangkok, Thailand 94
Int Congress 2014 ISBN : 978-81-929742-3-1 www.intcongress.com

Formula Effort = a * ( KLOC )b EAF= E1 * E2 * … * E15
Effort = a * EAF * (KLOC)b
It uses Effort Multipliers for every phase of a project. Four
phases: RPD - Requirements Planning &
Product Design DD - Detailed Design
CUT - Code & Unit Test IT - Integrate & Test
Values of a, b, c for 3 developme
nt mode
COCOMO Values
a (Basic)
a (Intermediate)
b C
Organic 2.4 3.2 1.05 0.38 Semi-Detached 3.0 3.0 1.12 0.35
Embedded 3.6 2.8 1.20 0.32
Analyst capability effort multiplier
COCOMO II
COCOMO II was developed in 1995 by Barry Boehm & his team. Similar to the COCOMO I, but uses more complex formula. It reflects recent software development processes and comes in three versions:
1. Application Composition Model 2. Early Design Model 3. Post Architecture Model
Table 5: Comparative Information of COCOMO II
Parameters Application composition model Early design model Post architecture model
Applicable for Project
Like
Rapid application development or Prototype development.
Useful when only requirements are
available & design has not yet started.
It is used during the actual development & maintenance
of software products.
Equation
Effort=NOP/PROD
where NOP is no. of object point
PROD is the productivity rate
Where Effort is in person-months & Size is in KSLOC
A- Constant derived from historical project data B - Exponent which is replaced by 5 scale factors
EMi- Effort multiplier(7-Early design,17-Post architecture) for ith cost driver.
Sizing Object Points are used. Uses FP which then converted to SLOC.
Details
Uses no of screens, reports, & 3GL components that will comprise
application. Object Type
Complexity Weight S. M. D.
Screen 1 2 3 Report 2 5 8 3 GL 10
S - Simple
7 Cost Drivers are 1. Product reliability
2. Required Reuse 3. Platform Difficulty
4. Personnel Capability
5. Personnel Experience
6. Faculties 7. Schedule
Cost Drivers are based on 1. Product, 2. Platform,
3. Personnel and 4. Project
ASDF Thailand Proceedings of the International Congress 2014 [IC 2014], Bangkok, Thailand 95
Int Congress 2014 ISBN : 978-81-929742-3-1 www.intcongress.com

M - Medium D - Difficult
5 Scale Factors are 1. Precedent 2. Team Cohesion
3. Development/Flexibility 4. Process Maturity 5. Architecture Risk Resolution
Table 6: Differences Between COCOMO I and COCOMO II
Parameters COCOMO I COCOMO II Development Life
Cycle Useful in waterfall models Useful in non-sequential, rapid development, reengineering and reuse models of software.
Size Delivered Source Instructions (thousands) i.e. KDSI as an input. Object Points or FP or KSLOC.
Equation Exponent
Effort equation's exponent is determined by 3 development
modes.
Effort equation's exponent is determined by 5 scale factors.
Cost Driver 15 cost drivers attributes 17cost drivers attributes Estimation Accuracy
It provides estimates of effort and schedule.
Provides estimates that represent one standard deviation around the most likely estimate.
Data Points 63 Projects Referred 161 Projects Referred
Model Difference
Model based upon 1. Linear reuse formula
2. Assumption of reasonably stable requirements.
Other enhancements : 1. Non Linear reuse formula
2. Reuse model which looks at effort needed to understand & assimilate.
Non-Algorithmic Technique
1. Estimation by Analogy (EbA): EbA is based on finding efforts for similar projects from the project repository. EbA compare the projected project with earlier accomplished analogous project where the project development information is known. This method can be used either at the total project level or at subsystem level. [10]
Major issues are: the selection of appropriate similarity or distance functions, the selection of applicable project attributes (in our case cost-drivers), and the assessment about the number of similar projects to retrieve (analogies). EbA is comparatively straightforward. Actually in some admiration, it is a systematic form of expert decision since expert often searches for similar situations so as to inform their opinion.
2. Expert Judgment Method: Expert judgment methods rely on the use of human expertise to estimate software cost. This method takes advices from experts who have extensive experiences in similar projects. The experts provide estimates using their own methods and experience [4][14]. This method is usually used when there is limitation in finding data and gathering requirements. Consultation is the basic issue in this method [3]. Delphi provides a broad communication bandwidth for the experts to exchange the volume of information necessary to calibrate their estimates with those of the other experts [4].
3. Machine Learning Models: Machine learning explores the mechanism through which knowledge is gained based on experience. It is used to assemble a bunch of techniques which symbolize some of the facts of human mind. It covers Artificial Neural Networks (ANN), which is a simplified model of brain. ANN is a machine learning approach that models human brain & encompass number of artificial neurons. ANN is organized in 3 layers: Input Layer, Intermediate or Hidden Layer, Output Layer
ANN is used in cost estimation because of its ability to learn from earlier data. It is also able to model complex interaction between the dependent (effort) & independent variables (cost drivers).
ASDF Thailand Proceedings of the International Congress 2014 [IC 2014], Bangkok, Thailand 96
Int Congress 2014 ISBN : 978-81-929742-3-1 www.intcongress.com

Regression Model: Regression analysis is a statistical technique for modeling and analyzing variables. It models the relation between a set of input variables, and one or more output variables, which are considered somewhat dependent on the inputs, on the basis of a finite set of input/output observations.
Fuzzy Logic: All systems, which work based on the fuzzy logic try to replicate human behavior and reasoning. Many times, decision making is very hard and circumstances are vague, fuzzy systems are an efficient tool in such situations [3]. Fuzzy is nothing but the thing which is not accurate, understandable or distinct; blurred. Fuzzy Logic is a method to resolve troubles which are too multifaceted to be comprehend quantitatively. It is a multi-valued logic, which allows halfway values to be defined between straight evaluations like high/low, yes/no and true/false. Each problem must symbolize in terms of fuzzy set like, Fuzzy set = {Slowest, Slow, Fast, Fastest} instead of only {Slow, Fast}, Fuzzy set= {0.0-0.15, 0.15-0.30, 0.30-0.45, 0.45-0.60}
For the software cost estimation, it can be used with COCOMO. Steps involved are: Step 1: Fuzzification has been done by scale factors, cost drivers and size . Step 2: Principles of COCOMO are considered. Step 3: De Fuzzification is accomplished to gain effort.
Genetic Algorithm (GA): GA is used to solve a problem for which little is known. They are very general algorithms & work well in any search space. It does not require any prior knowledge, expertise or logic related to the particular problem being solved [20]. GA generates a family of randomly generated solutions to the problem being investigated. Each of the solutions is evaluated to find out how fit it is, and a suitable value is assigned to each solution. Using GA, given a number of data values for a set of i/p parameters and one o/p parameter, construct an expression of the i/p parameters which best predicts the value of the o/p parameter for any set of values of the i/p parameters. The result obtained depends on the fitness function used.
VII. Comparative Analysis
Table 7: Comparative analysis of various estimation techniques
Model Advantages Disadvantages
SLIM 1. Use of SLOC.
2. Easy to modify i/p data. 3. Easy to filter & customize formulas. 4. Objectively calibrated to experience.
1. Highly dependent on the SLOC. 2. Incapable to handle exceptional
conditions. 3. Some experience & factors can't be
quantified. 4. Not suitable for small projects.
Seer-Sem
1. Systematize project fundamentals into WBS for convenient planning & control.
2. Estimation is based on sizable knowledge of existing projects.
1. Project exact size is key concern in this model.
COCOMO
1. Easy to adapt, use & very understandable.
2. Works on historical data & hence is more predictable & accurate.
3. Consider various factors that affect cost of project.
4. Works well on similar projects. 5. Conquer the problem of reengineering
and reuse of software modules.
1. Much data is required & not suitable for all project
2. It ignores requirements and all documentation.
3. It ignores hardware issues. 4. Dependent on the totality of time spent in
each phase. 5. Personnel experience may be obsolete.
6. Must know the cost drivers.
ASDF Thailand Proceedings of the International Congress 2014 [IC 2014], Bangkok, Thailand 97
Int Congress 2014 ISBN : 978-81-929742-3-1 www.intcongress.com

Estimating by Analogy
1. Depend on actual project data & past experience.
2. Estimators past knowledge can be utilize which is not easy to quantify.
1. Representativeness of the experience 2. Comparable projects may not exist; 3. Historical data may not be accurate.
Experts Judgment
1. Expert with significant knowledge can offer good estimation. Fast estimation. 2. Experts can factor in discrepancy between precedent project experience &
necessities of the projected project.
1. Totally dependent on the 'expert' 2. This method can't be quantified.
3. Difficult to document factors used by experts.
4. Expert may be optimistic and unfair.
Neural Network
1. Highly non-linear modeling which needs less formal statistical training.
2. It can handle large amount of data sets; 3. Do not require a priori knowledge
about the data. 4. Have strength & fault-tolerant
capability.
1. It cannot extrapolate the results. 2. Extracting the knowledge is too difficult. 3. Immaterial variables may include further
noise. 4. Input dimensionality boost computational
complexity & memory requirements of model increase.
Fuzzy Logic
1. Accurate estimation & understandability. 2. It is inherently robust since it does not
require precise, noise-free inputs. 3. Can control nonlinear systems
4. Training is not required.
1. Hard to use, maintaining the degree of meaningfulness is difficult.
2. Need enough expert knowledge for the formulation of the rule base, mixture of
the sets and the de-Fuzzification.
Genetic Algorithm
1. Applied to optimization problem. 2. Does not rely upon specific knowledge
of the problems. 3. Robust & flexible so that they applied &
work well in complex systems.
1. The genetic algorithm is more complex to implement.
VIII. Researcher Proposed Model
Cost of software is heavily depending upon the software quality. Quality is a relative term and mainly relates with the customer / end user perception in terms of getting satisfaction when using that software. Quality of Software is about magnification of the extension of software desirable characteristics. Till now as per the literature survey it has been observed that costing of a project is done based on the manpower requirements and the time requirements. But project costing should consider project parameters also. Quality of software project affects project cost and software project quality depends upon software project performance. Software project performance can be measured through its functional and nonfunctional attributes. It will be good if cost estimation model can be applied after considering the software parameters and attributes depending upon software project type. Researcher would like to suggest the existing cost estimation model which can be applicable to various software projects. This is a review based analysis. Practical implications would be implemented in future for getting primary results.
FIG. 1: Project cost performance correlation with project parameters
ASDF Thailand Proceedings of the International Congress 2014 [IC 2014], Bangkok, Thailand 98
Int Congress 2014 ISBN : 978-81-929742-3-1 www.intcongress.com

Table 8: Suggested cost model(S) based on project parameters
S.NO. Project type Project parameters Suggested cost model(s)
1
System Software (e.g. Operating Systems, Utility
Programs, Drivers)
Architecture Complexity
Compatibility
Memory Organization
Performance
Risk Management Security Development Environment,
Integrity
Usability
Checkpoint COCOMO Fuzzy Logic ANN
Expert Judgment
2 Application Software (e.g. General Purpose, Tailor Made Software)
Configuration Maintainability Security Portability Usability Compatibility
Complexity Scalability Adaptability Performance
GA Estimation By Analogy Expert
Judgment
3
Research Oriented Software
(e.g.Anti-Virus, Network Utilities)
Speed Performance Reliability Usability Security Maintainability
Efficiency Development Mode
Checkpoint ANN COCOMO Expert
Judgment
IX. Conclusion & Future Work
In this paper, Researcher(s) have compared techniques for predicting software project effort and cost. These techniques have been compared in terms of accuracy, transparency and ease of configuration. Despite finding that there are dissimilarity in forecasting precision, researchers fall out that there may be other characteristics of these technique that will have an equal, if not greater, impact upon their adoption. The results shown in all these approach demand additional investigation, particularly to explore the effect of various parameters on the models in term of improving robustness and accuracy. It also offers the potential to provide more transparent solutions but this aspect also requires further research.
References
1. Magne Jørgensen and Martin Shepperd, “A Systematic Review of Software Development Cost Estimation Studies”, IEEE Transactions on Software Engineering, Vol. 33, No. 1
2. Lalit V. Patil, Rina M. Waghmode, S. D. Joshi, V. Khanna, “Generic Model Of Software Cost Estimation: A Hybrid Approach”, IEEE International Advance Computing Conference (IACC)2014
3. Vahid Khatibi, Dayang N. A. Jawawi “Software Cost Estimation Methods: A Review “ 4. K. Ramesh, P. Karunanidhi , “Literature Survey on Algorithmic And Non- Algorithmic Models For
Software Development Effort Estimation”, International Journal Of Engineering And Computer Science ISSN:2319-7242
5. Lionel C. Briand, Khaled El Emam Dagmar Surmann, Isabella Wieczorek, Katrina D. Maxwell, “An Assessment and Comparison of Common Software Cost Estimation Modeling Techniques”, ICSE ‘99 Los Angeles CA ACM 1999 I-581 13-074-0/99/05.
6. Barry Boehm, Chris Abts and Sunita Chulani, “Software development cost estimation approaches–A survey”, Annals of Software Engineering 10 (2000) 177–205.
7. Abedallah Zaid, Mohd Hasan Selamat, Abdual Azim Abd Ghani, Rodziah Atan and Tieng Wei Koh,” Issues in Software Cost Estimation”, IJCSNS International Journal of Computer Science and Network Security, 350 VOL.8
8. Lionel C. Briand, Tristen Langley. Isabella Wieczorek, ”A replicated Assessment and Comparison of Common Software Cost Modeling Techniques”, ICSE 2000,Limerick Ireland
9. Brad Touesnard, “Software Cost Estimation: SLOC-based Models and the Function Points Model”
ASDF Thailand Proceedings of the International Congress 2014 [IC 2014], Bangkok, Thailand 99
Int Congress 2014 ISBN : 978-81-929742-3-1 www.intcongress.com

10. Hareton Leung,Zhang Fan, “Software Cost Estimation”. 11. Z. Zia, A. Rashid and K. uz Zaman, “Software cost estimation for component-based fourth-
generation-language software applications”, Institution of Engineering and Technology (IET) Software, Vol. 5
12. Marcio Rodrigo Braz, Silvia Regina Vergilio, “Software Effort Estimation Based on Use Cases”, Computer Software and Applications Conference, Vol. 1, pp. 221-228, Sept. 2006.
13. Geetika Batra, Kuntal Barua, M.Tech Scholar, "A Review on Cost and Effort Estimation Approach for Software Development", International Journal of Engineering and Innovative Technology (IJEIT) Volume 3
14. Sweta Kumari , Shashank Pushkar, " Performance Analysis of the Software Cost Estimation Methods: A Review ", International Journal of Advanced Research in Computer Science and Software Engineering Volume 3, Issue 7, July 2013 ISSN: 2277 128X
15. Geeta Nagpal, Moin Uddin and Arvinder Kaur, "A Comparative Study of Estimation by Analogy using Data Mining Techniques", J Inf Process Syst, Vol.8, No.4, December 2012, pISSN 1976-913X eISSN 2092-805X
16. Ömer Faruk SARAÇ, Nevcihan DURU, "A Novel Method For Software Effort Estimation: Estimating With Boundaries",978-1-4799-0661-1/13/$31.00 ©2013 IEEE
17. Poonam Pandey," Analysis Of the Techniques for Software Cost Estimation ", 2012 Third International Conference on Advanced Computing & Communication Technologies, 978-0-7695-4941-5/12 $26.00 © 2012 IEEE DOI 10.1109/ACCT.2013.13
18. Ashita Malik, Varun Pandey, Anupama Kaushik, "An Analysis of Fuzzy Approaches for COCOMO II", I.J. Intelligent Systems and Applications, 2013, 05, 68-75 Published Online April 2013 in MECS DOI: 10.5815/ijisa.
19. Iman Attarzadeh, Siew Hock Ow, "Improving Estimation Accuracy of the COCOMO II Using an Adaptive Fuzzy Logic Model",2011 IEEE International Conference on Fuzzy Systems June 27-30, 2011, Taipei, Taiwan
20. Colin J. Burgess, Martin Lefley, "Can genetic programming improve software effort estimation? A comparative evaluation", Information and Software Technology 43(2001) 863-873
21. Capers Jones, "Social and Technical Reasons for Software Project Failures" from Software Productivity Research, LLC.
22. Chris F. Kemerer, “Reliability of Function Points Measurement. A Field Experiment,” Communications of the ACM, Vol.36, No.2, pp. 85-97.
ASDF Thailand Proceedings of the International Congress 2014 [IC 2014], Bangkok, Thailand 100
Int Congress 2014 ISBN : 978-81-929742-3-1 www.intcongress.com

A Novel Algorithm to improve QoS for Heterogeneous Mobile Devices A. Haja Alaudeen1, Dr. E. Kirubakaran2 and Dr. D. Jeya Mala3
1Asst.Professor, Dept of Software Engineering, Periyar Maniammai University, Vallam, Thanjavur, India
2AGM, SSTP (Systems), Bharat Heavy Electricals Limited, Tiruchirappalli, India 3Associate Professor, Dept of Computer Applications, Thiagarajar College of Engineeering, Madurai,India
Abstract- The next generation of wireless communication systems will be based on heterogeneous concepts and technologies that are still evolving. Ongoing world-wide adoption of heterogeneous mobile devices has created an unprecedented demand for data access by the user in the field of e-commerce or social media or entertainment applications from anywhere, at any time with enhanced Quality of Services (QoS). Heterogeneous devices used by the divergent users are characterized by different bandwidth, latency and jitter requirements. This divergence characteristic of devices reduces the QoS by the service provider to end users. To overcome this issue, we introduce a novel algorithm to enhance the QoS for heterogeneous mobile devices. Evaluation of our proposed algorithm results in improvement of QoS parameters such as bandwidth, delay, and jitter during data request and retrieval. The increasing importance of such diverse scenarios in which mobile networks concatenated with multiple subnets are connected to a backbone IP has recently been recognized by the Internet Engineering Task Force (IETF), where the working group will study the Network Mobility (NEMO) these and other scenarios.
I. Introduction
The location-based services (LBS) term is a recent concept that denotes applications integrating geographic location (ie, the spatial coordinates) with the general notion of services. With the development of mobile communication, these applications represent a challenge both conceptually and technically novel. Clearly, most of these applications will be part of daily life tomorrow that runs on computers, personal digital assistants (PDAs) [1], phones, and so on. By providing users added value to the mere location information is a complex task. Given the variety of possible applications, the basic requirements of LBS are numerous. Among them we can mention the existence of rules, to computationally efficient, powerful and yet user-friendly human-machine interfaces. This work aims to understand and describe in an accessible manner the different concepts that support mobile LBS. It is written by experts in the relevant subjects. The main issues to consider when it comes to LBS [2]. Location-based services are mainly used in three areas: military and government industries, emergency services, and the commercial sector. As mentioned above, the first location system in use was based on the GPS satellite, which allows precise location of people and objects up to 3 feet or more precision. In this article, Member States are asked to develop national standards for mobile operators to impose the automatic positioning of emergency calls: "Member States shall ensure that undertakings which operator public telephone networks make information call location available of emergency management authorities. “Technical feasibility "in this context means that unlike in the United States, European regulators do not meet the highest levels of precision such as GPS for locating emergency [3]. Though GPS allows a cell phone to be located accurately, European operators have the right to start with precision levels of their mobile networks can offer right now. Given that over 80% of European operators have launched the so-called Cell-ID [CI03] technology for positioning Mobile, very low levels of accuracy can only be offered by now in emergency: 100 meters potentially in urban areas, but only up to 3 -kilometer accuracy in rural areas. In this case, the local content is local to the immediate location of the consumer. Some of these applications couple LBS with notification services, automatically alerting users when they are near a preset destination. LBS Proponents believe that these services will create new markets
ASDF Thailand Proceedings of the International Congress 2014 [IC 2014], Bangkok, Thailand 101
Int Congress 2014 ISBN : 978-81-929742-3-1 www.intcongress.com

and new revenue opportunities for device manufacturers, wireless service providers, and application developers. The main objective of this project is to propose a novel algorithm to improve the QoS for Heterogeneous mobile devices [4] which makes the discovery of available heterogeneous devices around the user and provide qualitative QoS to the users irrespective of their devices. The interconnection of these various wireless technologies for the efficient delivery of services and value-added applications takes several difficult issues. Some of these problems are related to architectures, resource allocations, mobility management, provision of quality of service (QoS) and security.
II. Related Work
The existing work on Location based service is evaluated and the observation made as follows. For the method of measurement without GPS, in DL / UL, AMS receives / transmits signals to / from multiple measurement LBS ABSs. As is known for single carrier operation, most LBS measurement methods (such as TOA and TDOA) should be performed between multiple ABS AMS and at different times. AMS means that only receives / transmits measurement signals to / from an ABS by chance transmits / receives. For example, when it is performing the U-TDOA measurement, serving ABS must negotiate with neighboring ABSs get dedicated ranging resource for location measurement, and sending these measurement parameters to AMS. Then, AMS can use the parameters ranging from information and send as dedicated CDMA codes dedicated to these securities through a single carrier in different moments of meeting. Location based service (LBS) [5] are information services accessible with mobile devices through the mobile network and utilizing the ability to make use of the location of the mobile device. The use of mobile networks is rapidly increasing day by day. There are two aspects in mobile networks and host mobility and network mobility. Protocols used to host mobility handle only a single node to be connected to the Internet. But the protocols used for network mobility care of the entire network to be connected to the Internet with the help of mobile router. The need for the Support Network Mobility (NEMO) is inevitable in mobile platforms such as car, bus, train, etc. The Internet Protocol Mobile 6 (MIPv6) version and NEMO Basic Support Protocol (BSP) are used to support the host mobility and network mobility, respectively.
The management strategy based on a message is sent to a neighbor that is closer to the direction of destination. To send a data message to a destination, a source node draws a circle around the probable target location and makes an application area by drawing two tangents on either side of the circle. In addition, each intermediate node repeats the same process until the data message is delivered to the destination. Upon receipt of the data message, the destination sends an acknowledgment source. If the acknowledgment is not received within stipulated source assumes failure and floods the message route data across the network as recovery routine. If the target location information is outdated, the source floods the message data across the network instead of creating an area of request.
Table 1 QoS Technology over 4G networks
ASDF Thailand Proceedings of the International Congress 2014 [IC 2014], Bangkok, Thailand 102
Int Congress 2014 ISBN : 978-81-929742-3-1 www.intcongress.com

III. Methodology
A. Device Discovery and Service Selection Algorithm
Pseudo code for the device discovery and service selection algorithm is shown in Figure 1and the process flow shown below. We present our approach to the discovery of network nodes and the connectivity between them. Since our approach is mainly based on first major management information base (MIB) [7] objects needed are analyzed to build our algorithm. We then use to build a discovery algorithm, which is basically divided into three different modules, namely, device discovery, device discovery, discovery and connectivity. The user Device section describes the behavior of the client device as it initiates inquiry about the location based services. The Service Device section describes the behavior of the server device as it is discovered. Note that the service device must be in a state of responding to user Device requests in order to assist in the location based services.
Let u be the user device Let s be the service device Let LAu be the address of the user device Let LAs be the address of the service device Let QRr be the IAS Query Response from the service device Let DD be a list of discovered devices, where DDn is device n in the list Let IASla be the IAS entry for the each device
User Device Service Device Begin Begin DD = Discover(); LAu = RetrieveUserAddress(); if(size(DD) == 0) IASla = CreateIASEntry(LAu); return; while(true) { Connect(DD0); switch(Event) { QRr = IASQuery(DD0, “:Address”); UD_DISCOVER: if(QRr == null) DiscoveryResponse(); return; BAs = IRIAS_GetUserString(QRr); UD_CONNECT: ServiceConnect(BAs); ConnectResponse(); End. UD_IASQUERY:
UDResponse(IASba); LBS_CONNECT: LBSConnectResponse(); }
End
IV Case Study
A. First Review
To recruit the subjects for our study we conducted a survey asking mobile users for their socio-economic status (age, occupation, education level and family status), how long they have used mobile technologies (year started), type of and provider for their current phone, how they think they use their current phones for voice communication and data, which applications they use and with what frequency, general experience with their phone, and whether their expectations (and which ones) were being met, and to which extent. We used the responses to this survey to randomly select 30 subjects for our four-week long study. Android Context Sensing Software (CSS)[8] Application With the rapid development of wireless
ASDF Thailand Proceedings of the International Congress 2014 [IC 2014], Bangkok, Thailand 103
Int Congress 2014 ISBN : 978-81-929742-3-1 www.intcongress.com

communication networks are expected to be launched the fourth generation mobile systems in a matter of decades. 4G mobile systems focus on seamlessly integrating the existing wireless technologies including GSM, wireless LAN, and Bluetooth.
V Preliminary Results
By the end of the study, we collected a total of 15 GB of data from all users. The largest sized log files belonged to the accelerometer, magnetometer and orientation CSS modules. The most energy consuming modules were the location log module (including Global Positioning System (GPS) sensor), WLAN sensor and accelerometer, magnetometer, orientation, illumination and proximity modules [12].
Figure 1. Scanning delay for one user with an increasing number of access points
Our goal is to evaluate the impact of jamming broadcasts in the process of scanning a mobile node. A growing number User randomly placed in the BSS, generate CBR traffic for access 10Mbps point. We can see that the delay introduced in access the medium is still negligible compared to the loss of time to wait Probe responses. Based on these observations, this paper aims to reduce transfer delay in WLANs access architecture using a two-tier consists of a sensor control plane overlay data onto a plane.
Figure 2. Scanning delay for several users with one access point
ASDF Thailand Proceedings of the International Congress 2014 [IC 2014], Bangkok, Thailand 104
Int Congress 2014 ISBN : 978-81-929742-3-1 www.intcongress.com

A QoE Ratings
In total we have received around 7500 QoE ratings from all users. In the first week we collected around 1300 ratings from our users, in the second 1700, in the third 2500, while in the last week there were 2000 ratings. The high ratings (4 and 5) are much frequent than low ratings (1, 2, 3) for all the users as depicted in Fig. 5. We conclude that in general, people seem to find their QoE to be acceptable in most cases. We expect such results since if the user was not happy with an application, she will likely not continue using it.
Figure 3 QoE scores ratings from all users
if(Debug("Router.SendLSP")) { cout << "SendLSP: Node: "<< node << " at:" << Time::Now()<<endl; } // Sends out LSP Packet Router_DB_Entry index; Packet p; String ListNeighbors; String d = ":#:"; String h = ""; index = cDB[node]; if (index.cValid == 0) { // XXX node not valid in cDB cout << "FATAL ERROR SendLSP: Node not valid in LSB Database!\n"; exit(0); } // Extract LSP information and turn into String typedef map<String, int>::const_iterator CI; for (CI i=index.cNeighbor_list.begin();i!=index.cNeighbor_list.end();++i) { h = h + i->first + d + String::Convert(i->second) + d; } // Construct LSP Packet p["opcode"] = OP_LSP; p["src"] = cLocalNode; p["node"] = node; p["hops"] = String::Convert(index.cHops+1);
ASDF Thailand Proceedings of the International Congress 2014 [IC 2014], Bangkok, Thailand 105
Int Congress 2014 ISBN : 978-81-929742-3-1 www.intcongress.com
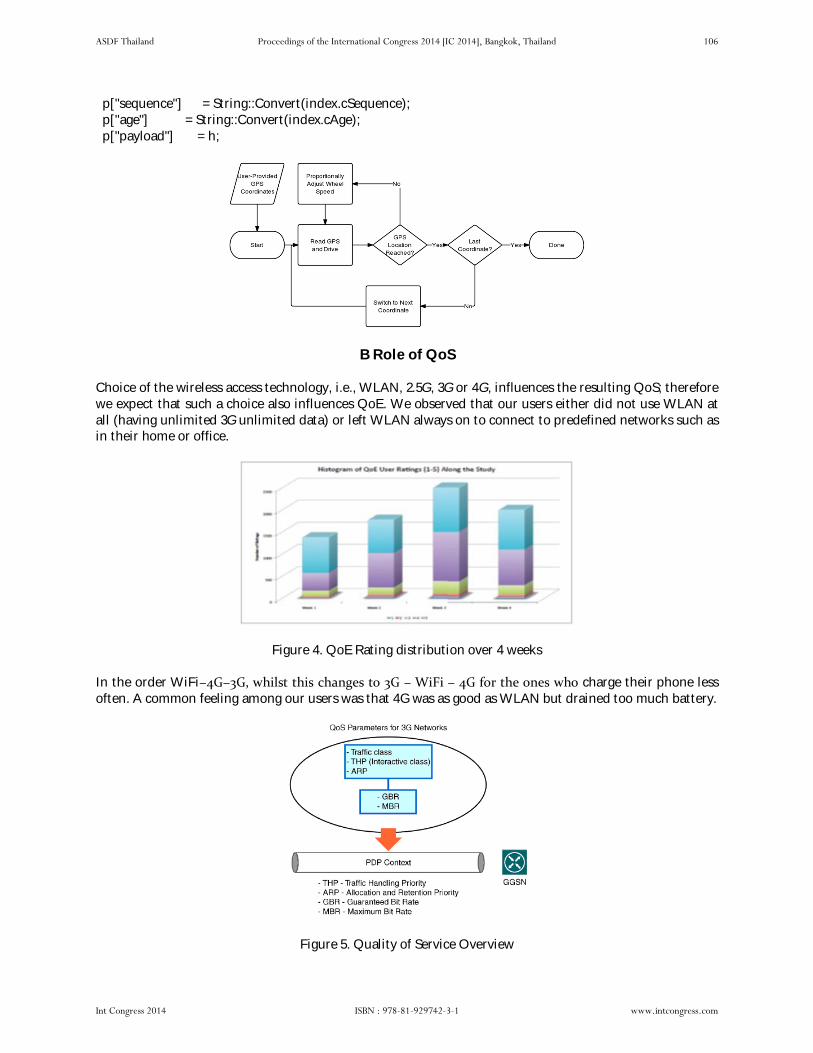
p["sequence"] = String::Convert(index.cSequence); p["age"] = String::Convert(index.cAge); p["payload"] = h;
B Role of QoS
Choice of the wireless access technology, i.e., WLAN, 2.5G, 3G or 4G, influences the resulting QoS; therefore we expect that such a choice also influences QoE. We observed that our users either did not use WLAN at all (having unlimited 3G unlimited data) or left WLAN always on to connect to predefined networks such as in their home or office.
Figure 4. QoE Rating distribution over 4 weeks
In the order WiFi−4G−3G, whilst this changes to 3G − WiFi − 4G for the ones who charge their phone less often. A common feeling among our users was that 4G was as good as WLAN but drained too much battery.
Figure 5. Quality of Service Overview
ASDF Thailand Proceedings of the International Congress 2014 [IC 2014], Bangkok, Thailand 106
Int Congress 2014 ISBN : 978-81-929742-3-1 www.intcongress.com

C. Some Factors Influencing QoE
For most of our users, it was not natural to talk about their QoE experiences; they implicitly assumed that with the study instruments being used, we could measure and understand all the factors influencing itWe observed that user’s QoE is influenced by application designs such as web browser page scrolling capabilities, or a specification of the built-in dictionary for messaging. This is one of the biggest problems that we will face in our final data analysis: a user scores an application with a particular QoE value due to any subjective reason, including an interface-related reason. For example, if a person uses an application, in which a slider is too small for her fingers, and she constantly has trouble interacting with it, her subjective experience will be low, despite having an excellent QoS.
VI Conclusion
A lot of research has been done toward finding solutions for the mobile QoS. As Wireless technology matures and wider bandwidth spectrum is allocated to mobile users, wireless data customers will demand accuracy in data services. This paper identifies major problems, challenges and requirements in providing QoS enabled mobile applications and their corresponding candidate solutions. Some existing work is outlined as a survey, while some new ideas and proposals are presented from the research viewpoint. Clearly, the interaction of IP-level QoS signaling protocol with advanced mobility management at the IP level MOWLAM and other scenarios is still an exciting research topic. Furthermore, the problem of minimizing the cost of resources over multiple wireless hops to one QoS requirement of end-to-end as is an area for future research. The implications for design based on these factors are numerous and our future work includes further analysis of the collected data and identification of these implications for design.
References
1. Nair, H., Chintagunta, P., & Dubé, J. P. (2004). Empirical analysis of indirect network effects in the market for personal digital assistants. Quantitative Marketing and Economics, 2(1), 23-58.
2. Filjar R, Busic L, Desic S, Huljenic D. (2008) “LBS Position Estimation by Adaptive Selection of Positioning sensors Based on Requested QoS,” Next Generation Teletraffic and Wired/Wireless Advanced Networking: 8th International Conference, Russia, September 3-5, 2008, Proceedings, pp 101-109
3. Silventoinen, M. I., & Rantalainen, T. (1996, February). Mobile station emergency locating in GSM. In Personal Wireless Communications, 1996., IEEE International Conference on (pp. 232-238). IEEE.
4. Wilson, A., Lenaghan, A., & Malyan, R. (2005, September). Optimising wireless access network selection to maintain qos in heterogeneous wireless environments. In Wireless Personal Multimedia Communications (pp. 18-22).
5. U. Leonhardt, Supporting Location-Awareness in Open Distributed Systems Ph.D. Thesis, Department of Computing, Imperial College, London (Imperial College, 1998).
6. Stahl, F., Gaber, M. M., Bramer, M., & Yu, P. S. (2010, October). Pocket data mining: Towards collaborative data mining in mobile computing environments. In Tools with Artificial Intelligence (ICTAI), 2010 22nd IEEE International Conference on (Vol. 2, pp. 323-330). IEEE.
7. Sarkar, S., & Boyer, K. L. (1993). Integration, inference, and management of spatial information using bayesian networks: Perceptual organization. Pattern Analysis and Machine Intelligence, IEEE Transactions on, 15(3), 256-274.
8. Burns, M. N., Begale, M., Duffecy, J., Gergle, D., Karr, C. J., Giangrande, E., & Mohr, D. C. (2011). Harnessing context sensing to develop a mobile intervention for depression. Journal of medical Internet research, 13(3).
9. Farhan Siddiqui, Sherali Zeadally, “An efficient wireless network discovery scheme for heterogeneous access environments”, International Journal of Pervasive Computing and Communications, Year: 2008, Volume: 4 Issue: 1 pp: 50 – 60, DOI: 10.1108/17427370810873101.
ASDF Thailand Proceedings of the International Congress 2014 [IC 2014], Bangkok, Thailand 107
Int Congress 2014 ISBN : 978-81-929742-3-1 www.intcongress.com

10. Consolvo, S., & Walker, M. (2003). Using the experience sampling method to evaluate ubicomp applications. IEEE Pervasive Computing, 2(2), 24-31.
11. Kim, H. J., Lee, D. H., Lee, J. M., Lee, K. H., Lyu, W., & Choi, S. G. (2008, September). The QoE evaluation method through the QoS-QoE correlation model. In Networked Computing and Advanced Information Management, 2008. NCM'08. Fourth International Conference on (Vol. 2, pp. 719-725). IEEE.
12. Savarese, C., Rabaey, J. M., & Beutel, J. (2001). Location in distributed ad-hoc wireless sensor networks. In Acoustics, Speech, and Signal Processing, 2001. Proceedings.(ICASSP'01). 2001 IEEE International Conference on (Vol. 4, pp. 2037-2040). IEEE.
13. Borkowski J.M. (2003) “Performance of Cell ID + RTT Hybrid Positioning Method for UMTS”. Master of Science Thesis. Department of Information Technology, Tampere University of Technology. Pp 94 – 122
14. N. Davies, The impact of mobility on distributed systems platforms Proceedings of the IFIP/IEEE Int’l Conf. on Distributed Platforms, Dresden,Chapman & Hall, 1996, pp. 18–25.
15. Zhuang, W., Gan, Y. S., Loh, K. J., & Chua, K. C. (2003). Policy-based QoS-management architecture in an integrated UMTS and WLAN environment. Communications Magazine, IEEE, 41(11), 118-125.
16. Zimmerman, T. G. (1999). Wireless networked digital devices: A new paradigm for computing and communication. IBM Systems Journal, 38(4), 566-574.
ASDF Thailand Proceedings of the International Congress 2014 [IC 2014], Bangkok, Thailand 108
Int Congress 2014 ISBN : 978-81-929742-3-1 www.intcongress.com

Critical Components Identification for Effective Regression Testing M. Ramalakshmi Praba, D. Jeya Mala
Assistant Professor – Dept.of MCA, KLN College of Information Technology, Madurai Associate Professor, Dept.of Computer Applications, Thiagarajar College of Engineering, Madurai
Abstract—Regression testing is to check program correctness after it was changed. But during regression testing, due to the stopping criteria followed by industries, some of the critical components and their dependent components might have been missed. This leads to catastrophic failure in terms of cost, time and human life. To address this most important and critical problem this paper proposes a novel method to identify the critical components and prioritize them for testing based on their dependency and complexity metrics before the software is delivered to the customer side.
Keywords: Software Testing, Regression Testing, Component based Testing, Critical component, Metrics.
1. Introduction
Testing is the one of the ways of assuring the quality of the product. According to 40-20-40 rule, software development consumes 40% of total time for project analysis and design, 20% for programming and rest of 40% for testing [17]. Hence better testing methodology should be followed by the industries for producing better product.
Component based system development is desired by the industries because of its flexibility, reusability, extensibility etc., Even though the industries followed better testing methodology and produce quality product, the customer may return back the product to the industry for feature enhancement or modification of the existing functionality or for defect fixing. After changing the product, based on the customer’s requirements, the product has to be tested. This type of testing which is known as regression testing, consumes significant portion of development and maintenance costs [19]. Regression testing is an important but expensive way to build confidence that software changes introduce no new faults as software evolves [20]. In reality, the industries skip testing some components during regression testing, in order to manage the release schedule and cost. Now, the problem occurs if some of these skipped components are critical components which have their impact or side effect on other components. One solution is to test potentially risky components or critical components rigorously during regression testing prior to other components in the system.
This paper proposes a novel method to identify the critical components being tested rigorously using known metrics and measures. Also, the proposed regression testing method identifies the dependent components of each changed component. Then prioritization takes place during regression testing, which will reduce the threats related to the critical components.
2. Related Work
Jerry GAO [10, 11], proposed a model to measure the maturity levels of a component testing process.
According to McGregor [12]. All the components were classified according to three risk categories and components falling in one category were tested at the same coverage level. But exact quantification of the risks associated with each component is not possible using this technique and it fails to give an account of number of most critical components that need to be tested.
ASDF Thailand Proceedings of the International Congress 2014 [IC 2014], Bangkok, Thailand 109
Int Congress 2014 ISBN : 978-81-929742-3-1 www.intcongress.com

Jeya Mala et.al. [13] Proposed a technique for optimizing the test cases to improve the efficiency of the testing process using various coverage metrics.
Srivastava [22] suggested prioritizing test cases according to the criterion of increased APFD and proposed a new algorithm which could be able to calculate the average number of faults found per minute by a test case and using this value to sort the test cases in decreasing order.
Rothermel et al [23], have described several techniques for test case prioritization and empirically examined their relative abilities to improve how quickly faults can be detected by those suites. The objective is to detect faults as early as possible so that the debugger will not sit idle.
Mao and Lu [20] proposed a testing method; Component developers should calculate the change information from labeled method call graph and provide it to component users via XML files. Component users use this change information and their instrumentation records together to pick out test cases for next-round testing.
Malishevsky et al [21] proposed cost models that would help them assess the cost-benefits of techniques. The cost-benefits models were used for regression test selection, test suite reduction, and test case prioritization.
Jeya Mala et.al.[24,25] Proposed the metrics for critical component identification.
The dependency based test prioritization improves the early fault detection when compared to traditional test prioritization as well as total number of fault detection. The experiments result suggested that quality of a system can be improved in terms of effectiveness using test prioritization.
3. Problem Formulation
A component based system consists of ‘n’ number of components and, most of the components are dependent on each other. During regression testing, the verification and validation of a component based system is a tricky task, because testing all the components with all possible inputs is a challenging one. The main challenge is to identify and test the components that are critical for the overall working of the system. Also, the testers should know about the information of the modified component to identify those components which are dependent on the modified component. Hence, the research problem here is to find out the dependent components of each of the modified components and locating potentially risky or highly critical components among the dependent components and finally prioritize them during regression testing.
In this research work, the component based system (CBS) is represented by means of a specific graphical representation called as Component Execution Sequence Graph (CESG). This graph is a network representation of the CBS and it consists of nodes to represent the components and edges. Figure1 is a typical Component Execution Sequence Graph G which contains five nodes, N (G) = {A, B, C, D, E} With Edges L (G) = {i, j, k, l, m}
Figure 1. Component Execution Sequence Graph
ASDF Thailand Proceedings of the International Congress 2014 [IC 2014], Bangkok, Thailand 110
Int Congress 2014 ISBN : 978-81-929742-3-1 www.intcongress.com

A. Critical Value Calculation
The critical value for each component is calculated as the summation of a specific class of metrics. The selection of such metrics focuses on identifying the critical components. They are classified as external metrics and internal metrics. The external metrics shows the dependence value of the modified component quantitatively and are derived from the dependence attributes of the components such as
1) Fanin, 2) Fanout and 2) Coupling between the Objects.
The internal metrics shows the potential complexity value of each component. The internal metrics are
1) Weighted Methods per Class (WMC), 2) Lack of Cohesion of Methods (LCOM) , 3) Number of static methods (NSM), 4) Depth in Tree( DIT), 5) Number of static Attributes (NSA), 6) Number of Children (NSC), and 7) Method lines of code (MLOC).
Metrics and their definitions are shown in Table I.
4. Proposed Approach for Effective Regression Testing
A. Proposed Framework
The proposed framework is shown in Figure2. In this framework, the given software under test (SUT) is analyzed and the components are extracted from it. For each component, the proposed component prioritize module calculates the external metric values with respect to the modified component. Based on these values, the dependent component list for each modified component is prepared.
Then the Internal metric value for each component in the dependent component list is measured. After that the total critical value for each component is calculated as the sum of internal metric values and external metric values. The prioritizer module then prioritizes the components based on their criticality value and the final list will be generated for effective testing. These component lists along with their test cases are kept in the regression test database (RTDB). This module also provides the provision for visual representation of critical components as Component Execution Sequence Graph (CESG). From the visual representation, the tester can easily identify the dependent components. So he can easily choose the suitable test cases for rigorous testing.
5. Experimental Setup and Result Analysis
For identifying the critical component list, the class files are necessary for each component. To calculate the various metrics, the Java Byte code Analysis is applied. The class files for Software under Test (SUT) are generated by using Java compiler. This compiled format is not in the human readable format. Hence, from the class file the Oolong file was created, in this research work. Oolong is an assembly language for the Java Virtual Machine (JVM), it is nearly equivalent to the class file format but in the human readable form. For each component, the Oolong instructions are analyzed and then the proposed component prioritizer module calculates the External metric value and generates the dependent component List. The Internal metric values and the external metric value for each dependent component are measure to identify the critical components and they are prioritized based on that value.
A range of case studies are taken from the online project libraries such as (1000projects.org, www.itprojectsforyou.com, www.javaworld.com) for effective regression testing. These case studies are varied in its number of classes and Lines of codes. Each case study is analyzed and the proposed metrics were measured. The Experiment result shows that, time taken for proposed metric calculation is very tiny, when compare with overall time taken for testing all the components.
ASDF Thailand Proceedings of the International Congress 2014 [IC 2014], Bangkok, Thailand 111
Int Congress 2014 ISBN : 978-81-929742-3-1 www.intcongress.com

Figure2. Framework for Critical Component Prioritization
Table I: Metrics and its definition
Metrics Description Definition Fanin (M1)
The number of other classes that reference a class. Fanin = number of other classes that reference a class
Fanout (M2)
The number of other classes referenced by a class Fanout = number of other classes referenced by a class
CBO (M3) Coupling between the objects
n m Count cp = ∑ Ii + ∑ MINVj
i=0 j=0
Where k
Cob = ________________ Count cp
Where k = 1 and is a proportionality constant which may be adjusted as experimental verification [18] Mi Method I, Argm is
the Argument of method. WMC (M4) Weighted Methods per Class Sum of the McCabe Cyclomatic Complexity for all methods in
a class
LCOM (M5)
Lack of Cohesion of Methods.A measure for the
Cohesiveness of a class.
m= number of procedures (methods) in class a= number of variables (attributes) in class
mA= number of methods that access a variable (attribute) LCOM2 = 1 - sum(mA)/(m*a)
NSM (M6) Number of static methods NSM= Number of static methods
DIT (M7). Depth in Tree. Distance from class Object in the inheritance
hierarchy.
DIT = maximum inheritance path from the class to the root class
NSA(M8) Number of static Attributes NSA= Number of static attributes
NSC(M9) Total number of direct subclasses of a class. NSC = number of immediate sub-classes of a class
MLOC (M10) Method lines of code MLOC MLOC = number of non-blank and non-comment
lines inside method
m
imiINV ArgMM
0046.01
ASDF Thailand Proceedings of the International Congress 2014 [IC 2014], Bangkok, Thailand 112
Int Congress 2014 ISBN : 978-81-929742-3-1 www.intcongress.com

A. Case Study
For the first case study, ‘Vehicle Management System’ is taken. It is application software. It consists of thirty components and 5511 lines of codes.
Figure 3. Component Execution Graph of the Vehicle Management
To calculate the proposed metrics, initially all the components are identified in the ‘Vehicle Management System’. For all the changed components, external metrics are assessed. Then for each dependent component the internal metrics are calculated. Each component is assigned a weight as the sum of external and internal proposed metrics called as criticality value. The TABLE II shows the Vehicle Management System project’s components and their corresponding criticality value. Using this value, the priority value is assigned to each component. Then each component is tested based on this priority value which thus helps in rigorous testing of components without missing any of the critical components. The CESG for the Vehicle Management System shown in Figure 3.
Table II: Metric values for vehicle management System
Component Name
Fani
n
Fano
ut
CBO
NSM
NSF
NSC
MLO
C
DIT
LCO
M
WM
C
Tota
l
Prio
rity
AddEntry 1 1 0.58 0 2 0 139 5 1.19 9 158.761 14 AddNewEntry 2 1 1.53 0 2 0 293 5 1.00 27 332.532 3 AddPassenger 1 1 0.58 0 0 0 194 5 0.98 14 216.555 11
AddRoute 0 1 0.00 0 2 0 223 5 1.05 26 258.045 8 Booking 3 1 0.67 0 0 0 368 5 0.89 33 411.551 1
Booking_report 0 2 0.00 0 1 0 79 5 1.15 6 94.154 22 Buses 3 1 1.43 1 2 0 171 5 0.91 12 197.343 13
Bus_Details 0 2 0.00 0 4 0 84 5 1.14 6 102.143 20 DateChooser 0 1 0.00 0 10 0 153 6 0.85 48 218.850 10
Employee 3 2 0.96 1 5 0 127 5 0.00 7 150.956 15 employee_report 0 2 0.00 0 1 0 85 5 1.00 8 102.000 21
LoginScreen 1 1 0.33 0 0 0 95 6 0.75 8 112.083 19 Main 2 0 2.00 1 0 0 4 1 0.00 3 13.000 26
MDIWindow 12 1 11.47 0 1 0 242 6 0.85 18 292.324 5 NewEntry 1 1 0.55 0 2 0 338 5 0.82 27 375.366 2 NewUser 0 1 0.00 0 0 0 111 5 0.00 11 128.000 18
Passengers 2 1 0.96 1 5 0 109 5 0.00 8 131.956 17 Payment 2 2 1.24 0 0 0 218 5 0.97 16 245.205 9
Route 2 1 0.48 1 5 0 114 5 0.00 10 138.478 16
ASDF Thailand Proceedings of the International Congress 2014 [IC 2014], Bangkok, Thailand 113
Int Congress 2014 ISBN : 978-81-929742-3-1 www.intcongress.com

Schedule 3 1 1.04 0 2 0 263 5 0.91 21 296.950 4 Scheduling_report 0 2 0.00 0 1 0 77 5 1.14 6 92.143 23
Show_Booked 0 1 0.00 1 5 0 66 5 0.00 6 84.000 25 Show_schedules 0 1 0.00 1 5 0 73 5 0.00 6 91.000 24
UpdateEntry 1 1 0.28 0 1 0 193 5 0.55 9 210.826 12 UpdatePass 1 1 0.28 0 0 0 250 5 0.88 14 272.156 7
UpdateRoute 0 1 0.00 0 1 0 242 5 0.70 25 274.700 6
In the case study, ‘Vehicle Management System’, the components Schedule, Booking, Employee, passenger, payment are taken for modification by means of the defect injection in the components as per the Offutt’s [9] mutant guidelines method. The components which are dependent on the modified component are identified using the external metric value associated with the modified component. Then, the internal metric value for each component in critical component list is calculated. Based on this value the components are prioritized. The priority value is called as the critical value and the dependent components are listed as critical component test based on their critical value.
a. Comparison with Existing Approaches
To analyze the efficiency of the proposed approach the existing two basic regression testing methods such as Full Regression testing and Unit Regression testing are applied. In the Full Regression testing method all the components in the software, are tested. In the unit regression testing method only the modified component is tested.
During the application of each of the method, the time taken to reveal the defect is calculated. TABLE III shows time taken by Basic Regression testing methods and the proposed regression testing method. It is depicted in Figure 4. The following inferences have been made from the critical values.
As full Regression testing method tests all the components in the software, it takes long time to complete the testing. Unit Regression testing method takes very little amount of time because it focuses only on the modified component. In the proposed regression testing technique based on critical component identification, the focus is not only on the modified component but also on the dependent component. During the dependent components testing, the critical components are identified and they are tested with higher priority than the other. And comparatively it takes more time than unit regression testing, and less time than Full Regression testing. Even though the time complexity shown in TABLE III indicates the Unit Regression testing takes less time, it is not a reliable one as the dependent components of the modified components or the components which are being dependent by the modified components will not be covered by it.
Figure 4. Time Comparison for different Regression Testing Methods
ASDF Thailand Proceedings of the International Congress 2014 [IC 2014], Bangkok, Thailand 114
Int Congress 2014 ISBN : 978-81-929742-3-1 www.intcongress.com

Table III: Time Taken by various Regression testing and percentage of error free S.
No Defect
No.
Defect Injected
Component
Time Taken by various Regression Testing( in Sec) and % of Error free in terms of Requirement satisfaction in the total system
Full Regression Testing Unit Regression Testing
Proposed Criticality based prioritization
Approach Time Taken
( in Sec)
% of Requirement Satisfaction
Time Taken
( in Sec)
% of Requirement Satisfaction
Time Taken
( in Sec)
% of Requirement Satisfaction
1 Defect#1 Schedule 300.23 100% 92.1 93% 155.63 100% 2 Defect#2 Booking 298.26 100% 90.3 90% 123.56 100% 3 Defect#3 Employee 315.71 100% 91.2 75% 187.89 99% 4 Defect#4 Passenger 299.65 100% 81.18 78% 145.21 100% 5 Defect#5 Payment 302.68 100% 85.3 80% 170.34 100%
This may yield negative results during its execution. Hence, based on the analysis the proposed regression testing has been identified as a better method to yield reliable results for retesting. The above three Regression testing methods are applied in ten different projects. For each projects, three components are modified. For each component testing, the time taken for the Full Regression testing, Unit Regression testing methods and Proposed Regression testing methods is noted. In all the case studies takes less time for proposed regression testing method when compared with time taken for full regression testing method.
Conclusion and Future Work
In the proposed method, initially component’s dependency is measured and critical components are identified. Then its criticality value is calculated for each dependent component and components are prioritized based on the critical value. Efficiency of the above method is confirmed by ten projects. The future work plans to provide some more dependency factors in the analysis of large systems and provide the visualization tool that helps the testers.
Acknowledgment
This work is the part of UGC research project supported by University Grants Commission, New Delhi, India.
References
[1] Thomas Zimmermann,, Nachiappan Nagappan,, Kim Herzig , Rahul Premraj and Laurie Williams “An Empirical Study on the Relation between Dependency Neighborhoods and Failures”, In the proceedings of 2011 Fourth IEEE International Conference on Software Testing, Verification and Validation
[2] Renee C Brcyce, Sreedevi Sampath, Atif M Memon ”Developing a Single Model and Test Prioritization Strategies for Event Driven Software” IEEE Transaction on software Engineering, Vol. X, no X, January 2010.
[3] P. K. Suri, Sandeep Kumar ”Simulator for Identifying Critical Components for Testing in a component Based Software System”, IJCSNS International Journal of Computer Science and Netwok Security Vol. 10, no 6,June 2010.
[4] Katerina Goseva - Popstojanova ”Guest Editors’ Introduction to the Special Section on Evalution and Improvement of Software Dependability” IEEE Transaction on software Engineering, Vol.36, no 3,May/June 2010.
ASDF Thailand Proceedings of the International Congress 2014 [IC 2014], Bangkok, Thailand 115
Int Congress 2014 ISBN : 978-81-929742-3-1 www.intcongress.com

[5] Mariani, L., et al, “Compatibility and Regression Testing of COTS- Component Based Software,” In the proceedings 0f 29th IEEE conference on Software Engineering, 2007, pp. 85-95.
[6] Xiaofang Zhang; Changhai Nie; Baowen Xu; Bo Qu “Test Case Prioritization Based on Varying Testing Requirement Priorities and Test Case Costs” In the proceedings of Seventh IEEE Conference on Quality Software (QSIC 2007)
[7] Jasmine K. Sl Dr. R. Vasantha “Identification of software performance bottleneck components in Reuse based software products with Application of Acquaintanceship Graphs. In proceedings of the IEEE conference on Software Engineering Advances (ICSEA 20007)
[8] www.Projectparadise.com [9] Jingyu Hu, Nan Li and Jeff Offutt “An Analysis of OO Mutation Operators” In the proceedings of
24th Annual International Computer Software and Application Conference, Taipei, Taiwan, Oct 2000.
[10] Zheng Li, Mark Harman, and Robert M. Hierons “Search Algorithms for Regression Test Case Prioritization” IEEE Transaction on Software Engineering, April 2007.
[11] Gao, J., “Testing Coverage Analysis for Software Component Validation,” In the proceedings of 29th Annual International Computer Software and Applications Conference, Edinburgh, Scotland, July 26-28, 2005.
[12] McGregor, J.D., “Component Testing,” Journal of Object Oriented programming, Vol. 10, No. 1, 1997. pp. 6-9.
[13] D. Jeyamala, V. Mohan, M. Kamalapriya, “Automated Software Test Optimization Framework - an Artificial Bee Colony Optimization based Approach”, International Journal - IET - Software ,Vol.4, No.5, pp.334-348, 2010
[14] OO Design Quality Metrics An Analysis of Dependencies By Robert Martin October 28,1994 [15] Programming for the Java™ Virtual Machine By Joshua Engel [16] Ilene Burnstein, “Practical Software Testing”, Springer International Edition, Chennai, 2003. [17] Roger S. Pressman, “Software engineering - A practitioner ’s Approach ”,McGraw-Hill International
Edition, 6th edition, 2005. [18] A. Mitchell and J.F. Power. “Run-time cohesion metrics: An empirical investigation.” In
International Conference on Software Engineering Research and Practice, pages 532-537, Las Vegas, Nevada, USA, June 21-24 2004.
[19] “Reduce, Reuse, Recycle, Recover: Techniques for Improved Regression Testing” Mary Jean Harrold College of Computing Georgia Institute of Technology Atlanta, GA 30332-0280 [email protected]
[20] “Configuration aware prioritization techniques in regression testing” Xiao Qu Dept. of Comput. Sci. & Eng., Univ. of Nebraska, Lincoln, NE. IEEE Confreence (2009)
[21] “Regression testing for component-based software systems by enhancing change information “Chengying Mao Coll. of Comput. Sci. & Technol., Huazhong Univ. of Sci. & Technol., China Yansheng Lu APSEC '05. 12th - Asia-Pacific Software Engineering Conference, 2005.
[22] P. R. Srivastava, “Test Case Prioritization,” Journal of Theoritical And Applied Information Technology. JATIT 2008.
[23] Rothermel, R.H. Untch, C.Chu ,M.J.Harrol, ” Test Case Prioritization: An Emperical Study,” In Proceedings of the24thIEEE International Conference Software Maintenance (ICSM ) Oxford, U.K, September 1999.
[24] M.Ramalakshmi Praba, Dr. D.Jeyamala, “Critical Component Analyzer - A Novel Test Prioritization Framework for Component Based Real Time Systems” ,MySec 2011 - organized by IEEE-Malaysia and Institute of Technology, Malaysia,IEEExplore.
[25] D.Jeyamala,Critical Components Identification and Verification for effective software Test Prioritization,International Conference on Advanced Computing 2011 Organized by Anna University, Chennai,IEEExplore.
ASDF Thailand Proceedings of the International Congress 2014 [IC 2014], Bangkok, Thailand 116
Int Congress 2014 ISBN : 978-81-929742-3-1 www.intcongress.com

Utilizing Enterprise Architecture for More Effective Requirements Engineering
Ömer Korkut, Devrim Barış Acar, Erhan Keleş, Oral Gürel
STM A.Ş. Consultancy Services Department, Ankara Teknoloji Geliştirme Bölgesi, Cyberplaza C Blok 2.Kat Ankara, Turkey
Abstract-Requirements Engineering (RE) plays a vital role in successful software-intensive systems development. Generally, requirements have a tight relationship with organizational goals and constraints which can be contributed by an Enterprise Architecture (EA). This paper discusses the link between RE activities and EA paradigm. Our experiences in developing requirements for a series of large-scale software integration projects in both public and private sectors inspired the content of the paper.
I. Introduction
Developing software-intensive systems has remained a challenging activity in spite of remarkable progress in computing domain. Furthermore, rapidly evolving technology and sophisticated business requirements are placing ever-increasing pressure on software development process. Especially large-scale software projects continue to fail at an unacceptable rate. One of the main reasons for these failures is the inability of conveying requirements to intended software product. Therefore, the following statement emphasizing the utmost importance of an effective RE still preserves its topicality. “The hardest part of building a software system is deciding precisely what to build. No other single part of the conceptual work is as difficult as establishing the detailed technical requirements, including all of the interfaces to people, to machines, and to other software systems. No other part of the work so cripples the resulting system if done wrong. No other part is more difficult to rectify later” [1].
RE process aims to determine a baseline for requirements correctly first and then manage it throughout the software development phase. In order not to fail at the first step, it is crucial to detect the right sources to derive requirements. Ideally, both strategic goals and tactical demands are the motivation behind requirements. The Open Group Architecture Framework (TOGAFTM) puts goals and requirements in the heart of the architecture development process. Business goals are identified explicitly in EA which is a conceptual blueprint that defines the structure and operation of an organization [2]. For the last two decades, EA has evolved as a practice providing pragmatic artifacts such as requirements, specifications, guiding principles, and conceptual models that describe the next major stage of evolution of an organization, often called the “future state” [3]. With its dynamic nature, EA may become not only a valuable resource to refer during requirements development phase, but also an important reference usable throughout the entire RE process.
In this paper, we present and argue our premise that EA should play a more significant role in RE process. We specifically emphasize that lack of a solid EA in a large organization may cause severe consequences regarding requirements development. The remainder of this paper is organized as follows: Section II provides a general overview of RE process focusing on requirements development. Section III discusses EA paradigm and accentuates its benefits for the employing enterprise. Section IV conveys our findings and recommendations in RE gained in the course of a variety of complex software integration projects realized for not only governmental but also private organizations in different domains such as finance, healthcare, construction, energy and technology. Finally, Section V concludes with a brief summary of the subject matter and our suggestions for future work.
ASDF Thailand Proceedings of the International Congress 2014 [IC 2014], Bangkok, Thailand 117
Int Congress 2014 ISBN : 978-81-929742-3-1 www.intcongress.com

II. Requirements Engineering
RE is the set of activities on identifying and communicating the purpose of a software system and the cases in which it will be used. RE connects real-world needs of stakeholders (users, customers and other participants) to a software based system’s capabilities. Basically, RE is made up of two major processes: requirements development and requirements management [4].
A. Requirements Development
Requirements Development phase is constructed from elicitation, analysis, specification and validation steps. At the end of the development phase a series of baseline documents such as Software Requirements Specification (SRS), User Requirements Specification (URS) or Business Requirements Document (BRD) will be generated. Requirements development steps may be executed iteratively if a defect or gap is detected prior to the baseline [5].
Requirements Elicitation
Elicitation step is the process of determining the needs of all stakeholders. Therefore, the first activity of elicitation step is defining the stakeholders. The elicitation step aims to collect requirements by approaching from different directions such as business requirements, customer requirements, user requirements, constraints, security requirements, information requirements, standards etc. The specification of software requirements starts with observing, interviewing people or investigating any documentation owned by the stakeholder that defines their processes. The resultant product of elicitation step is not a well-formed specification document. It is rather a long list of items that defines what the stakeholders plan to perform with the system.
Requirements Analysis
Requirements Analysis is the process of detailing and prioritizing the requirements, organizing the requirements in a hierarchical manner and evaluating the feasibility of the requirements by building proof of concept products or prototypes. One of the main goals of analysis step is verifying that there is no gap in the requirements.
Requirements Specification
Specification step is the period in which all the requirements are documented. The crucial point of specification is that, the generated document will be the starting point of traceability. Therefore, each requirement written in the specification should be atomic, comprehensible, and should not conflict with any other.
Requirements Validation
Validation is the last step of requirements development phase. In this step, documented requirements are reviewed by the stakeholders to confirm that they satisfy customer needs. At the end of the validation step a baseline requirements document is generated.
B. Requirements Management
In the course of project lifecycle, requirements will continue to change, so the requirements document. Requirements Management encompasses activities of managing and tracking changes in requirements. Managing changes involves, creating a change management process (and a control board), performing
ASDF Thailand Proceedings of the International Congress 2014 [IC 2014], Bangkok, Thailand 118
Int Congress 2014 ISBN : 978-81-929742-3-1 www.intcongress.com

impact analysis on changes and generating new versions of requirements document. Tracking process is saving the history of each requirement, tracking the status and establishing the traceability matrix.
Fig. 1 Phases of Requirements Engineering
III. Enterprise Architecture
A project is initially defined by its scope and vision that describes the high-level business requirements, stakeholders and system boundaries in general. The scope and vision, thus, constrains the set of requirements described by the project. However, for large scale enterprises, we believe that defining the project’s scope and vision is not enough for successful RE activities because they don’t refer to organizational context and rationale of business requirements which EA provides.
A. Definition
Reference [6] describes EA as a high-level representation of the enterprise, used for managing the relation between business and IT. EA is also defined as “strategic approach which takes a systems perspective, viewing the entire enterprise as a holistic system” [7]. According to [8], EA provides:
Strategic context for the evolution of IT System by describing the organizational context of the business requirements,
General guidelines for design.
B. Enterprise Frameworks
In an architectural approach, a framework is needed for the communication of the decisions, requirements, constraints, enablers and feedback among the stakeholders [9]. EA frameworks like TOGAFTM and Zachman [10] provide guidance on how to conduct and structure the artifacts of an EA. In general, these frameworks define layered architectures. For example TOGAFTM presents four architecture domains [8]:
Business architecture defines the business strategy, governance, organization and key business processes.
Data architecture describes the structure of an organization’s logical and physical data assets and data management resources.
Applications architecture provides a blueprint for the individual applications to be deployed, their interactions, and their relationships to the core business processes of the organization.
ASDF Thailand Proceedings of the International Congress 2014 [IC 2014], Bangkok, Thailand 119
Int Congress 2014 ISBN : 978-81-929742-3-1 www.intcongress.com

Technology architecture includes IT infrastructure, middleware, networks, communications, processing, standards, etc.
With respect to RE, the artifacts of these four domains generally help providing the initial set of requirements and a general set of constraints and guidelines for the further requirements development. This encourages requirements reuse as stated in [11] [12]. For example, as demonstrated in [9], the enterprise wide security requirements once defined are used by different systems.
C. Enterprise Architecture Benefits
The benefits of following an EA are not limited to requirements reuse. One of the main advantages of establishing an EA is helping enterprises to align business and IT processes. As McKeen and Smith [13] argues, the above mentioned strategic alignment is possible only when an organization’s goals, activities and the information systems that support them remain in harmony.
Several researches have been conducted to assess the further benefits of EA. According to [14], the primary goals of EA with respect to practitioners are:
To get the holistic view on the IT landscape as well as supported business processes by creating transparency,
To manage complexity by using the holistic view and then consolidating IT applications or standardizing processes,
To align business and IT.
This holistic approach provides the enterprise architects the opportunity to understand their as-is organization. Using this information, they can identify the bottlenecks, unnecessary processes or applications and points of further innovation, by which they form the shape of the future to-be architecture. This to-be architecture, described and used as a reference is generally dynamic in nature, and makes use of requirement engineering activities as pictured in Fig.2 [8]. For projects, by the help of requirements engineering activities, the reference architecture is adapted and specialized, and where appropriate these adaptations are generalized in reference architecture for future re-use. This process is named as architecture development cycle.
Fig. 2 Architecture Development Cycle
Taking these benefits into consideration, we think that the lack of a solid EA in a large organization results in poor coordination between departments, cost increases, requirement conflicts across projects and other undesired consequences.
ASDF Thailand Proceedings of the International Congress 2014 [IC 2014], Bangkok, Thailand 120
Int Congress 2014 ISBN : 978-81-929742-3-1 www.intcongress.com

IV. Findings and Recommendations
We gained experience from various software projects realized for different organizations of which the majority did not have an EA. In this section, we will share our findings and recommendations regarding to the correlation between effective RE activities and a solid EA.
A. Better Scope Management
High level organizational goals and strategies are either stated or referred in EA. While working with an organization not having an EA on a software project, we went through a serious scope creep problem. The reason for that was all stakeholders were trying to realize their own goals since the organizational ones were not clearly identified and communicated. One of our major lessons learned after this particular project was that an organization should have a solid EA to achieve projects aligned with its goals and strategies.
B. Faster Requirements Elicitation
Considering that EA contains organizational goals, guidelines, principles, policies, capabilities and constraints; its relevant parts can provide the initial set of requirements that can be input to elicitation step [12].
We discovered that some requirements elicited by inspecting EA were mature enough to be directly used in requirements analysis step while some of them provided guidelines but needed to be further detailed. For the latter, we recommend additionally performing traditional elicitation techniques such as devising surveys and questionnaires, organizing workshops with stakeholders, observing in force work processes and building use-cases. Even for these cases, since there was a starting point coming from EA, we experienced that the overall elicitation process was less time consuming.
C. More Organizational Requirements
Utilizing EA also assures that the determined requirements are more organizational and less personalized. In one specific software project we were involved, because of the lack of an EA, we only used traditional techniques for requirements elicitation. During this step, we witnessed that interfering stakeholder interests and frequent stakeholder turnover resulted in numerous repetitions. Therefore, in order to minimize the risk that may be caused by stakeholder turnover and conflicting benefits, we recommend referring to EA in elicitation process, if it is available.
D. Requirements Re-use
Our team had the opportunity to take part in requirements development of two different projects for the same organization. Some of the functional and most of the non-functional requirements dictated by EA in the first project were used with minimal or no modification in the second project. Hence, we deduced that EA driven elicitation approach enables re-use of once determined requirements as a source for other projects in the same organization.
E. Supporting Requirements Analysis
EA provides information about the business, application, data and technology architecture. Having this knowledge in hand eases breaking down the elicited requirements into more detailed and technical ones thus reducing the difficulty and complexity of the analysis step. In one of our projects, we elicited a user requirement for redundancy in a multi-located distributed system. In analysis step, we examined the
ASDF Thailand Proceedings of the International Congress 2014 [IC 2014], Bangkok, Thailand 121
Int Congress 2014 ISBN : 978-81-929742-3-1 www.intcongress.com

organization’s well-defined technology and data architecture and in result clearly identified the desired requirements to achieve high availability.
F. Requirements Specification Structuring
In our works we observed that using EA provided architectural layers such as business, data, application and technology facilitate classification of requirements in the specification step. When there is an EA available we utilized architectural layers to categorize and specify analyzed requirements recorded in relevant documents. This methodology improved the structure of the specification documents, thus ensuring stakeholders to have a better grasp of the project.
G. Validation and Stakeholder Management
EA driven requirements development reduces time spent to acquire a formal validation from stakeholders by eliminating the expected gaps and defects in former steps through double checking user requirements with written organizational goals and reference EA. In integration projects for organizations without EA we had difficulties in successfully completing the validation step due to the problem of a large variety of stakeholders coming from different organizational cultures. In these cases, even after exhausting communication sessions with stakeholders in both elicitation and analysis steps it was almost impossible to reach a consensus among stakeholders in the first iteration of validation step. The main reason of this failure was the conflicting interests and undetermined stakeholder hierarchy.
V. Conclusions
With all the studies and widely accepted processes about RE, the ability to effectively derive, trace and re-use software requirements has still some room for improvement with regard to large-scale complex systems. Enterprise level architectural approach has recently emerged as a candidate concept that can have positive impact on RE processes. In our opinion, this approach should be used to complement current well-defined and widely used RE processes and not to replace any of them.
In this paper, we investigated and listed some of the relationships between EA and RE with reference to our experience in various software projects. Our conclusion is that, an established EA improves the requirements gathering, analysis, specification and validation steps of requirements development.
In an era of fast-changing technology and business requirements, EAs also need to be updated and managed dynamically. As the use of architectural approach in RE becomes more prevalent, we may have the chance of using well-defined and performed RE processes to evolve and improve already established EAs. We suggest that this would be a remarkable topic for future work.
References
1. F. Brooks, “No Silver Bullet: Essence and Accidents of Software Engineering.”,[IEEE Computer Magazine , 20, 1987], pp. 10-19.
2. Enterprise Architecture, http://searchcio.techtarget.com/definition/enterprise-architecture. 3. The Federation of Enterprise Architecture Professional Organizations, “A Common Perspective on
Enterprise Architecture”, [Architecture & Governance Magazine vol. 9 issue 4 (2013)], pp. 10-16. 4. K. Wiegers and J. Beatty, Software Requirements, Third Edition, p.15. 5. I. Summerville, Software Engineering, Eighth Edition. Addison-Wesley, p.143. 6. W. Engelsman and R. Wiering, “Goal-Oriented Requirements Engineering and Enterprise
Architecture:Two Case Studies and Some Lessons Learned”, REFSQ 2012, Springer-Verlag, p.306. 7. D. J. Nightingale and D. H. Rhodes, “Enterprise Systems Architecting: Emerging Art and Science
within Engineering Systems”, p.1.
ASDF Thailand Proceedings of the International Congress 2014 [IC 2014], Bangkok, Thailand 122
Int Congress 2014 ISBN : 978-81-929742-3-1 www.intcongress.com

8. The Open Group, TOGAF Version 9.1, p.6, p.48. 9. M. Pulkkinen, A. Naumenko, K. Luostarinen, “Managing information security in a business
network of machinery maintenance services business – Enterprise architecture as a coordination tool”, [The Journal of Systems and Software 80], p.1609.
10. Zachman Framework, http://www.zachman.com/about-the-zachman-framework. 11. V. Voucharas, M. V. Steenbergen, S. Jansen, S.Brinkkemper, “The Contribution of Enterprise
Architecture to the Achievement of Organizational Goals: Establishing the Enterprise Architecture Benefits Framework”, Technical Report (June 2010), p.42.
12. W. Engelsman, M. E. Iacob, H. M. Franken, “Architecture-Driven Requirements Engineering”, p.2.
13. J. D. McKeen, H. A. Smith, Making IT Happen: Critical Issues in IT Management, Wiley 2003. 14. M. Lange, J. Mendling, “An Experts’ Perspective on Enterprise Architecture Goals, Framework
Adoption and Benefit Assessment”, p.5.
ASDF Thailand Proceedings of the International Congress 2014 [IC 2014], Bangkok, Thailand 123
Int Congress 2014 ISBN : 978-81-929742-3-1 www.intcongress.com

Solving Connectivity Issues in Wireless Sensor Networks using Anchor Nodes
Sumathi S1, Dr. M. Chandrasekaran2
1Associate Professor, Dept. of Information Technology, St. Joseph’s College of Engg, Chennai 2Professor, Department of Electronics and Communication Engg, Govt. College of Engg., Bargur
Abstract - Wireless sensor network consists of battery powered nodes with fixed amount of energy that are randomly deployed in an area to gather data from its surroundings and send the collected data to the sink. The routing in the network is done by finding the lowest cost path. In case of failure of a neighbor node, routing is done via alternate path. In this paper, we propose a route recovery scheme considering the possibility of failure of all the neighbor nodes in the system. Route recovery scheme can be extended to multiple failures until there is at least one neighbor available for routing. The entire area is divided into grids where each grid consists of S number of nodes. We bring a new mobile node (anchor node) and position it at the center of the grid which contains the failed nodes. ICCA-map is performed to find the relative coordinates of all the nodes in the grid. The position of the mobile node is altered to bring in the node without any neighbor within its coverage range and it is anchored at that position. Thus, an alternative routing path is established
Index Terms— Fault location, Anchor Nodes, Disjoint Network, Failure recovery, Wireless Sensor Networks.
I. Introduction
Wireless Sensor Networks (WSNs) use a large quantity of sensors in a target area for performing surveillance tasks such as environmental monitoring, military surveillance, animal tracking, and home applications. Each sensor collects information by sensing its surrounding region and transfers the information to a sink (also called a data center) via wireless transmission. Because of the features of sensors, WSNs have been implemented in harsh environments such as in the deep sea, arctic areas, and hazardous war zones. Different from other battery-powered apparatuses, recharging a sensor’s battery is generally impossible. Although solar and wind energy can be used, such energy supplies are not reliable. Equipped with limited energy supplies, WSNs are much more demanding on energy conservation than the other kinds of networks. How to maximize the network’s lifetime is a critical research topic in WSNs.
Various methods have been proposed in the literature for organizing energy efficient WSNs, in which sensing the coverage and network connectivity are two fundamental issues. Most of the controlled deployment methods aim at assigning the smallest number of sensors under the cost limitation in an area.
Sensors are battery powered stationary nodes which are distributed randomly in a target area. The information is transmitted from one node to another using low cost routing (LCR). LCR is the process of finding the most inexpensive and the most efficient path between the nodes to route the information from the source to the sink.
II. Literature Survey
The WSN may be of any area and is theoretically considered to be a square or a rectangle. The main aim is to deploy minimum number of sensors and yet establish a proper coverage [1]. The nodes deployed may be static or mobile. The failure may occur due to various reasons and the failure recovery has impacts of features life the network lifetime, quality of the information transmitted, efficiency and performance of the
ASDF Thailand Proceedings of the International Congress 2014 [IC 2014], Bangkok, Thailand 124
Int Congress 2014 ISBN : 978-81-929742-3-1 www.intcongress.com

network. To simplify the fault recovery we divide the entire area into series of grids as in [2]. Previous proposals for fault recovery concentrate on reestablishing a working path again from source to destination. For example in [3] the failed nodes are identified and already existing sensor nodes are moved to reestablish the route. In [4] “RIM” is used to handle more than one node failure and the neighbors of the failed node are relocated establish connection. In [5] of nodes relocated are no path between any pair of nodes is extended. But the main disadvantage of these approaches is that they may introduce new failures or holes in the network, more energy can be wasted in moving the nodes over a distance. Also there exist constraints in the number of nodes that can be moved.
In [6], DARA, Distributed Actor Recovery Algorithm, is used to restore the connectivity of a network in a pre-node failure level. It has two variants namely, DARA-1C and DARA-2C. DARA-1C picks up and replaces one of the neighbors of a failed node and aims in minimizing the total distance travelled. DARA-2C strives to restore the bi-connectivity. In [7] single route or multiple path failure is handled. Self-Healing algorithm is used in order to overcome single route failure where each node checks for a shortest distance neighbor having the highest energy of all to transfer the control. In multiple path failure transmission Range increased, but the main disadvantage is that it reduces the life time of the network and may be used only when there is an emergency message to communicate, say for example the fact that the node’s neighbours have failed can be informed to the sink. When all the above methods may prove to be un- useful we search for a method that does not introduce new failures or holes in the network, and there must be no constraint in the number of nodes that can be introduced or moved. For this purpose we introduce anchor nodes in the network .In [8] a path planning scheme for the mobile node is proposed to with the aim of minimizing the localization error the entire mobile node must be able to determine their locations. In [9] the localization protocols are proposed to without using hardware such as GPS receivers, which increases node costs. Here Curvilinear Component Analysis (CCA-MAP) protocol is used that uses a technique of patching together relative-coordinate, local maps into a global-coordinate map. Thus uses minimum number of anchor node to give the exact location of the node in the network. This CCA-MAP can be performed only once to find the location and for the optimal position finding we may move the anchor node and check for coverage for that we use an improvised version of CCA-MAP algorithm called iCCA-MAP [10] that does the procedures of CCA-MAP algorithm iteratively until the node is placed optimally. Though the results of every level of both if the algorithms are same the main advantage is that the computational time required for obtaining location estimates using iCCA-MAP is far smaller than the original CCA-MAP. The main aim is to use minimum number of anchor nodes and efficiently find their positions and reestablish the lost connectivity in the network.
III. Problems and Assumptions
Problem
Every node in the WSN transfers data to the destination in a single-hop or multi-hop fashion. In the multi-hop routing the connection between a node and its neighbor is very essential. The failure of a node may cause disconnection in the network. A node can fail for any of a variety of reasons, e.g., broken node hardware, a broken network, software bugs, or inadequate hardware resources.
If the neighbor of a low cost fails, the node selects alternate route in the following way
If The failure in node has been found then Repeat //Whether there is path to next hop neighbor //Whether there is reply for “NEW PATH” Message Until (A neighbor for transmission has been found) End if
ASDF Thailand Proceedings of the International Congress 2014 [IC 2014], Bangkok, Thailand 125
Int Congress 2014 ISBN : 978-81-929742-3-1 www.intcongress.com

Similarly if this node also fails the next best route selection in this process is possible until the node has at least one neighbor node, if all the neighbors fail the node becomes disjoint as in Fig 1.
Figure 1 Disjoint Network
Thus, to establish reconnection in the network, some means has to be carried out. In this paper we propose the usage of mobile nodes that we call anchor nodes. These anchor nodes are mobile nodes until they are anchored to their positions. The anchor nodes are moved from the sink to the location where the connectivity is needed.
Assumptions
The following assumptions were made.
The mobile node's identity is known as a result of the application context. If the application context is such that it does not provide the mobile node's identity, we would at best be able to determine relative mobility by detecting neighborhood changes through periodic Hello messages.
All nodes have the same transmission range, which is assumed to be a perfect circle. All messages are sent and received without error and/or collision All nodes have the same computational power and memory capacity. Anchor nodes have exact information regarding their location. This is a realistic assumption since
anchors nodes could be mounted with a GPS module which obtains the global position of the node.
Other techniques are also possible, such as manually placing the anchor nodes and keeping track of their location either by using GPS or an arbitrary user-defined positioning system.
We take,
an= current position (coordinates) of the anchor nodes Ni= position of the nodes without any neighbors in every grid(it may be N1,N 2,N 3,N 4 etc)
Rsen =sensing radius of the anchor node.
IV. Recovery from Failure
The area under consideration (the area deployed with WSNs) is divided into grids as in Fig 2.
ASDF Thailand Proceedings of the International Congress 2014 [IC 2014], Bangkok, Thailand 126
Int Congress 2014 ISBN : 978-81-929742-3-1 www.intcongress.com

Figure 2 Area under consideration
Each and every node in all the grids is checked. If any node has no neighbors at all, that is, if every possible neighbor of the node had failed, then it is considered as a lone node.
The number of lone nodes is counted. If any grid has 1 or more lone nodes, then the grid is said to be suffering from multiple node failure.
The number of grids containing multiple node failures is found out. The same number of mobile nodes is taken. One anchor node is allotted for every grid with failures
The following steps are done only for the grids with failure simultaneously.
A. Placing the anchor nodes B. The iCCA-MAP Algorithm C. Checking coverage.
A. Placing the Anchor Nodes
The anchors are placed at the center of the rectangular grid. The point of intersection of the2 diagonal of the rectangle is considered to be the center of the rectangular grid.
B. The ICCA-Map Algorithm
The iCCA-MAP algorithm computes a single local map for the mobile node rather than computing the local map of every node in the network as is performed in CCA-MAP. In iterative Curvilinear Component Analysis- Mobile Anchor Point (iCCA-MAP) algorithm, a local map is built for every mobile node in the network. This is usually done in a range-based scheme where the local distance between mobile node and all the stationary nodes is measured and used as input in the form of local distance matrix. The local distance matrix of the local map is computed and used as the approximate distance matrix. Each mobile node then applies the CCA algorithm generating the relative coordinates for every node in its local map by giving the local distance matrix as the input. The local maps are generated iteratively. A linear transformation is applied for merging a new local map into the current map. Using the anchor nodes the relative local map can be translated to an absolute local map, where coordinates reflect the node positions based on the coordinates used to localize the anchor nodes.
C. Checking Coverage
After finding the coordinates of all the nods in the grid, an inspection is performed to check whether all the lone nodes in the grid come within the sensing radius of the anchor node. It’s done by checking whether he
ASDF Thailand Proceedings of the International Congress 2014 [IC 2014], Bangkok, Thailand 127
Int Congress 2014 ISBN : 978-81-929742-3-1 www.intcongress.com

distance between the anchor node and the lone node is less than the sensing radius. If it is within the range the connection is established and the routing can be performed via the anchor node. Otherwise if any of the lone nodes are not covered by the newly anchor fixed anchor node then the anchor node is moved for a random distance along the diagonal near the coordinates of the lone node. Again the iCCA-MAP algorithm is performed and again the coverage is checked. These steps are repeated until all the lone nodes in the particular grid come under the coverage of the anchor node. Thus a new routing path is established. The recovery from failure can be summarized in the form of algorithm
Start Divide the total area into rectangular grids For all grids Do For all nodes in the grid Do If (no of neighbors of any node=0) Ni=node having no neighbors i++ Else No problem in the grid End if End If i>0 The grid has multiple node failure n=no. of grids with multiple node failure No. of anchor nodes needed=n For (j=0; j<=n; j++)
1. P=the point to intersection of the diagonals of the rectangular grid
2. Move the anchor node and place it at point p //performing ICCA-MAP 3. Use CCA-MAP to estimate the location of all nodes in the grid 4. Construct the local map of the grid using the anchor node as reference 5. Compute the shortest distance matrix of the anchor node and use it as the approximate distance matrix. 6. Apply the CCA algorithm on the anchor node 7. Input the local distance matrix and Generate the relative coordinates of neighbor node of the
anchor node. 8. Merge the local map of the anchor node with the original relative local map. 9. Transform the relative map to an absolute map 10. for all nodes without neighbors If distance (an, Ni) < Rsen Alternate route established Else Until distance (an, Ni) < Rsen
Move the anchor node along the diagonal near the coordinate of Ni End if
Repeat steps 3 to 8 Establish the alternate route
ASDF Thailand Proceedings of the International Congress 2014 [IC 2014], Bangkok, Thailand 128
Int Congress 2014 ISBN : 978-81-929742-3-1 www.intcongress.com

End End if
End End
V. Lifetime Estimation in the Failure Recovery Process
The initial lifetime of the network as given in [11]
EN0= ∗
(1)
Here E0 is the initial energy of the network. Eidle is the energy wasted while the nodes are being idle p is the total power consumed by the network. R is the rate of transmission of date from one node to the other and Etrans is the energy spent in that transmission. This lifetime is applicable when all the nodes in the grid and subsequently all the grids and ultimately the entire network is properly working without any failure.
When nodes start failing the energy of the system decreases and in turn the total life time decreases.
Consider a network that is divided into N number of grids. Each grid contains S number of nodes and S is a variable. When failure occurs the number of nodes decreases. Let us assume that the number of nodes failed in a grid to be n. and the number of grids without any failure to be X. The lifetime of the network after some data transactions is
Eg = ∗
. Here Epres = E0-∑ (t ∗ r ∗ Etrans) (2)
is the present energy of the grids and is obtained by subtracting the total energy spent in data transmission from the initial network energy.
This equation is summed from 1 to the maximum number of grids having failure that is got by subtracting the number of properly working grids from the total number of grids. The life time of every single grid with failure is obtained by . The life time of every single node in grid is obtained by
∗ and is summed over a
limit of 1 to the number of failed nodes (n) to get the total lifetime of the failed nodes. Using these equations, the equation for the lifetime of entire grids with failure is obtained by subtracting the total lifetime of all the failed nodes in the grids from the total life time of the grids suffering from failure Thus the life time of grids with failure is equal to
∑ -∑ ∑
∗ (3)
To cope up with the failure methods like redefining the nodes and increasing the transmission power etc., are used until there is at least one neighbor node to do the transmission. When all those means cannot be implemented then a mobile node (anchor node) is introduced.
The lifetime of the mobile node is Emob it is the total of energy needed to move and fix the anchor node in the middle of the grid (Efix) and the energy required to move it along the diagonal and fix it at the correct location to establish coverage using iCCA-MAP algorithm (Map). It is summed over the limit of 1 to the total number of anchor nodes in the network. That is represented by
∑ ∑ Emob (4)
The life time of the network after introducing the anchor nodes in increased and is represented as
ASDF Thailand Proceedings of the International Congress 2014 [IC 2014], Bangkok, Thailand 129
Int Congress 2014 ISBN : 978-81-929742-3-1 www.intcongress.com

Eam =∗
(5)
Here Epresm=E0-∑ (t ∗ r ∗ Etrans)+∑ Eom is the present energy of the grids after introducing the anchor node and is obtained by subtracting the total energy spent in data transmission from the initial network energy and the initial energy of the mobile node is added to it.
The equation is summed over a limit of 1 to the sum of number of properly working node in the network to the number of mobile nodes in it (S-n+m). It is represented by
∑ ∑ Eam (6)
The total life time of the grids without any failure is got by summing Eg over a limit of 1 to the total number of properly working grids in the network it’s represented as
∑ Eg (7)
The network lifetime is defined as the amount of time until any sensor runs out of energy [8], thus in our problem the total life time of the network EL is the sum of the initial lifetime of the network, the life time of grids with failure, lifetime of the mobile node, The life time of the network after introducing the anchor nodes, life time of the grids without any failure(adding -(1) ,(3) ,(5) ,(6) ,(7) ). Thus
EL = EN +∑ -∑ ∑
∗+∑ ∑ Emob +∑ ∑ Eam + ∑ Eg (8)
Thus from the equation (8) the total life time of the network until the entire energy drains out is given by
EL=EN +∑ (( −∑
∗) +∑ Emob +∑ Eam ) + ∑ Eg (9)
VI. Conclusion
In this paper, we have introduced a route recovery scheme for multiple route failures that happens as the result of an energy loss and there is no possibility to transfer the data. When there is no way of transmitting the data new node is introduced in the place of failures by means of localization algorithm and A model has been created for network lifetime with which it can be proven that there will be increase in lifetime.
VII. References
1. Jennifer C. Hou, David K. Y. Yau, Chris Y. T. Ma, Yong Yang, Honghai Zhang, I-Hong Hou, Nageswara S. V. Rao, Mallikarjun Shankar, “Coverage in Wireless Sensor Networks” Thesis Performance and simulation analyses of sensor area coverage.
2. Wei-Chieh Ke, Bing-Hong Liu, and Ming-Jer Tsai1, ,“Constructing a Wireless Sensor Network to Fully Cover Critical Grids by Deploying Minimum Sensors on Grid Points is NP-Complete”, IEEE Transactions on Computers,Volume56, Issue 5,May 2007.
3. Shanthi Vemulapalli, Kemal Akkaya, “Mobility-based Self Route Recovery from Multiple Node Failures in Mobile Sensor Networks”, IEEEE Conference on Local Computer Networks, LCN 2010, 10 – 14 October 2010.
4. Mohamed F. Younis, Sookyoung Lee, and Ameer Ahmed Abbasi, “A Localized Algorithm for Restoring Node Connectivity in Network Moveable Sensors”, IEEE Transactions on Computers, Volume 59, Issue 12, Dec 2010.
ASDF Thailand Proceedings of the International Congress 2014 [IC 2014], Bangkok, Thailand 130
Int Congress 2014 ISBN : 978-81-929742-3-1 www.intcongress.com

5. Ameer A. Abbasi, Mohamed F. Younis, Uthman A. Baroudi, “Recovering From a Node Failure in Wireless Sensor-Actor Networks With Minimal Topology Changes", IEEE Transactions On Vehicular Technology, Vol. 62, No. 1, January 2013.
6. Ameer Ahmed Abbashi, Mohammed FYounis , and Utman A Baroudi , “Movement – Assisted Connectivity Restoration in Wireless Sensor and Actor Networks”, IEEE Transactions on parallel and Distributed Systems, Volume 20, Issue 9, September 2009.
7. Sumathi S, Dr. Chandra Sekaran M, "Enhancing the Lifetime in Wireless Sensor Networks Using Automatic Route Recovery" unpublished
8. T. S. Lokhande, Prof. R. R. Shelke, “Path Planning Algorithm for Mobile Anchor- Based Localization in Mobile Networks”, IEEE Sensors Journal, Volume 13, Issue 2, Feb 13.
9. Thomas Kunz and Benjamin Tatham, “Localization in Wireless Sensor Networks and Anchor Placement”, Journal of Sensor and Actuators Networks, 2012.
10. Shafagh Alikhani “A Mobile Node Localization Algorithm for Wireless Sensor Networks”, May 2010. 11. Yunxia Chen, and Qing Zhao, “On the Lifetime of Wireless Sensor Networks”, IEEE
Communication Letters, Nov 2005.
ASDF Thailand Proceedings of the International Congress 2014 [IC 2014], Bangkok, Thailand 131
Int Congress 2014 ISBN : 978-81-929742-3-1 www.intcongress.com

Trust Metrics for Group Key Management in Malicious Wireless Networks
1V.Bhuvaneswari, 2 Dr. M. Chandrasekaran
1Government Polytechnic College, Department of Computer Engineering, Dharmapuri, India 2Government College of Engineering,
Department of Electronics and Communication Engineering, Bargur, India
Abstract: Group communication is accomplished with the aid of group key management by preventing non-group members from accessing data exchanged. For improving security in wireless networks trust information has been widely used. In this work trust is used as a criterion for cluster formation.Direct trust and indirect trust is computed to identify Cluster Heads (CH) and the concept of backup cluster head is introduced for effective key management. Simulation results show the proposed method performs better in group key management than other techniques found in literature.
Keywords: Mobile ad hoc networks (MANETs), Dynamic Source Routing (DSR), Malicious Nodes, Clustering and Key Management.
I. Introduction
In Adhoc network, each node acts like a router and forwards the packets from one peer node to other peer nodes. The wireless channel is accessible in both legitimate network users and for malicious attackers. As a result, there is a blurry boundary which separates the inside network from the outside world [1]. Also in MANET, all networking functions including routing and data transmission, are performed by the nodes without the need for a central point to control and organizes the resource management process. Therefore security is a very challenging task. Security vulnerabilities for a network includes of the following aspects: Confidentiality, integrity, authentication, non-repudiation [2].
Encryption is the process of converting a plain text “unhidden”, into a cryptic text “hidden” to secure it against data thieves. This process also consists of another part where cryptic text needs to be decrypted on the other end to be understood.
Many encryption algorithms are available and used in information security widely. They can be categorized into Symmetric (private) and Asymmetric (public) keys encryption algorithms. In Symmetric keys encryption or secret key encryption, only one key is used for encrypting and decrypting the data. In Asymmetric keys, two keys are used such as private and public keys. Public key is used for an encryption and private key is used for the decryption technique (for e.g. RSA and ECC) [4].
Key management is the most important issues in security protocol design. In a secure group communication, key management techniques are used to provide a correct distribution and easy maintenance of cryptographic keys. The cryptographic keys, which can be used to encrypt Group Key (GK), are called as Key Encryption Key (KEK). As a result, key management problem can be considered as the secure and efficient distribution of KEKs and GK to only valid members [5]. The KEK is derived directly from the Authentication Key (AK), and it is 128 bits long. The KEK is not used for encrypting traffic data. Traffic Encryption Key (TEK) is generated as a random number generating in the Base Station (BS) using the TEK encryption algorithm where KEK is used as the encryption key. TEK is then used for encrypting the data traffic [6]. The TEK distribution mode is used to securely distribute TEKs only. The TEK distribution mode uses asymmetric-key based proxy re-encryption schemes, and the data transfer mode uses symmetric-key based proxy re-encryption schemes [7].
ASDF Thailand Proceedings of the International Congress 2014 [IC 2014], Bangkok, Thailand 132
Int Congress 2014 ISBN : 978-81-929742-3-1 www.intcongress.com

The study is organized as follows: Section 2 reviews some of the related works available in the literature, section 3 details the methodology used in this investigation, section 4 is proposed method, section 5 gives the results and section 6concludes the paper.
II. Literature Survey
Cryptography plays an integral role in secure communication and is usually the strongest link in the chain of security. Multilanguage cryptography, an advancement of classical cryptography, may evolve as a choice of classical cryptography lovers seeking a better security. Srivastava, et al., [8] proposed an algorithm in Multilanguage approach, which generated different cipher texts at different time for the same plaintext over a range of languages supported by Unicode. It has a better frequency distribution of characters in the cipher text than previous work on this approach. Bouassida, et al., [9] showed the specific challenges towards key management protocols for securing multicast communications in ad hoc networks, and provides taxonomy of these protocols in MANETs. A new approach, called BALADE, was also presented. It was based on a sequential multi-sources model, and taken into account both localization and mobility of nodes, while optimizing energy and bandwidth consumptions.
Chen, et al., [10] proposed a scheme for secure group key management using uni-directional proxy re-encryption in which each group member holds just one secret auxiliary key and logN public auxiliary keys. This scheme was immune to the collusion attack of other members. Rahman, et al., [11] proposed a new key management protocol which provides a support for both pair-wise and group-wise key management with identity pre-distributed secret. This protocol was efficient in terms of communication and storage overhead.
Gomathi and Parvathavarthini [12] proposed new Cluster Based Tree (CBT) for the secure multicast key distribution. DSDV routing protocol was used for collecting its one hop neighbours to form a cluster. John and Samuel [13] proposed a hierarchical key management scheme using a stable and power efficient cluster management technique. The overhead on centralized server has been reduced with these techniques.
Niu [14] proposed a scheme using soft encryption combined with multipath routing to provide security of data transmission over MANETs. This approach substantially reduces the computational overhead of using cryptographic method to encrypt entire message while security has been ensured.
Wu, et al., [15] introduced a MANET setting adapted, simple group key management scheme in which a multicast tree is formed for efficiency. To achieve fault tolerance, two multicast trees are constructed and maintained parallels. When one tree links is broken, it is substituted by the other. One tree is named blue and the other red. Group members act as group coordinators in rotation to compute/distribute intermediate keying materials to members through active tree links. This work is undertaken in rounds with the coordinator being selected in a distributed way. The latter is also responsible to maintain multicast group connections. Group coordinators compute/distribute intermediate keying materials through the underlying tree links to all members.
An authenticated key transfer protocol based on secret sharing scheme that KGC can broadcast group key information to all group members was proposed by Harnand Lin [16]. Here group key recovery is only through authorized group members. Information is theoretically secure due to the confidentiality of this transformation. Group key transportation authentication is provided.
Lim and Lim [17] suggested two group key management schemes for hierarchical self-organizing wireless sensor network architecture, designed so that the forwarding node has more computational and communication burden with a similar load being kept very low with other sensor nodes. This also ensures multilevel security to sensor groups at various levels. Sensor network implements these encryption primitives efficiently without sacrificing strength.
ASDF Thailand Proceedings of the International Congress 2014 [IC 2014], Bangkok, Thailand 133
Int Congress 2014 ISBN : 978-81-929742-3-1 www.intcongress.com

A cluster-based group key management scheme for wireless sensor networks aimed at reducing communication overhead and sensor nodes storage cost was proposed by Zhang, et al., [18]. The procedure includes group key generation through cluster head collaboration with cluster nodes. Cluster heads are responsible to reconstruct and delivery group key. Performance evaluations reveal that the scheme has good security while simultaneously reducing communication overhead when compared to existing schemes like large scale WSN.
Drira, et al., [19] proposed a group key management framework based on a trust oriented clustering scheme. It was demonstrated that trust is a relevant clustering criterion for group key management in MANETs. Trust information enforce authentication and is disseminated by the mobility of nodes. Furthermore, it helps to evict malicious nodes from the multicast session even if they are authorized members of the group. Simulation results show that the solution is efficient and typically adapted to mobility of nodes.
III. Methodology
The Dynamic Source Routing (DSR) is the routing protocol which uses the source routing approach (i.e., every data packet carries the whole path information in its header) to forward packets. Before a source node sends the data packets, it must know the total path going to be taken for transmitting packets to the destination. Otherwise, it will initiate a route discovery phase by flooding a Route Request (RREQ) packet message. DSR is a simple and loop-free protocol. However, it may waste bandwidth if every data packet carries the entire path information along with it. The response time may be large since the source node must wait for a successful RREP if no routing information’s to the intended destination are available. Additionally, if the destination is unreachable from the source node due to a network partition, the source node will continue to send RREQ messages, possibly congesting the network [20]. In DSR, the response time may be large if the source node's routing table has no entry to the destination and thus it discovers a path before the message transmission. Advantages of DSR are that it does not use any periodic routing messages (e.g. no router advertisements and no link-level neighbor status messages). Hence, DSR reduces network bandwidth overhead, conserves battery power, and avoids the propagation of potentially large routing updates throughout the ad hoc network [21].
Ad-hoc On-demand Distance Vector (AODV) is a routing protocol which is designed for MANETs and it employs the on-demand routing method to establish the routes between nodes. The main benefit of this protocol is establishment of desired route to destination when the source code requires, and it keeps the routes as long as they are needed. Also, AODV has proper quality to support broadcast, multicast and unicast routing with a scalable characteristic and self-starting. AODV allows mobile nodes for forwarding the packets through their neighbors which may not have a direct communication to the destination until the destination node receives the data packets. This protocol is able to find the shortest and loop free routes to transmit data packets. Also, AODV creates a new route in case of link downs or changes in route [22]. Some advantages of AODV are that the routes are established on demand and destination sequence numbers are used to find the latest route to the destination. Then the connection setup delay is lower. Also, it responds very quickly to the topological changes that affects the active routes. The Time-To-Live (TTL) field in the IP header of the RREQ packets controls the search. If a route to a previously known destination is needed, the prior hop-wise distance is used to optimize the search. This enables computing the TTL value dynamically.
In 1976, Whitfield Diffie and Martin Hellman were influenced by the work of Ralph Merkle on a public key distribution, and proposed an algorithm for key exchange which uses exponentiation in a finite field. Today, Diffie Hellman (DH) algorithm is used in a variety of protocols and services. It is used in interactive transactions, than compared with use in a batch transfer from a sender to a receiver. The algorithm is used when data is encrypted on the Web by using either SSL or TLS and in VPN. Therefore its security is of utmost importance [23].A shared secret is important between two parties who may not have ever communicated previously, so that they can encrypt their communications. As such, it is used by several
ASDF Thailand Proceedings of the International Congress 2014 [IC 2014], Bangkok, Thailand 134
Int Congress 2014 ISBN : 978-81-929742-3-1 www.intcongress.com

protocols, including Secure Sockets Layer (SSL), Secure Shell (SSH), and Internet Protocol Security (IPSec). These protocols will be discussed in terms of the technical use of the DH algorithm and the status of the protocol standards established or still being defined. The mathematics behind this algorithm is conceptually simple. The fundamental math includes the algebra of exponents and modulus arithmetic.
IV. Proposed Method
A rekeying process restores the group key after change of each group membership, i.e. join or leave operation. So rekeying may encourage communication overhead during change of frequent group membership. Rekeying mechanism includes property as 1-affects-n scalability which measures how well it scales to large and dynamic groups [19]. To enhance 1-affects-n scalability, some GKM solutions propose to organize the secure group based on logical topology (cluster). Using clusters with different local TEK, the impact of the key updating process (1-affects-n) gets reduces, but needs decryption and re-encryption operations between clusters.
The estimated distance between nodes is graphically represented in figure 1. The cluster head on the formed clusters is selected based on the energy availability.
a) Original data (b) distance=1 (c) distance=2 (d) distance=3
Figure 1. Cluster formation based on distance
In the proposed work, trust is used as the clustering similarity. The cluster formation is adapted from [24]. Also the technique determines the similarity between each pair of clusters named as iC and jC with their
relative inter-connectivity RI. iC ; jC and their relative closeness RC iC ; jC . The hierarchical clustering
algorithm selects to merge the pair of clusters where both RI. iC ; jC and RC iC ; jC are high. Through this
selection procedure, [24] overcomes the limitations of existing algorithms.
The inter cluster connectivity between a pair of clusters iC and jC is defined as the absolute inter cluster
connectivity between iC and jC is normalized with the internal inter cluster connectivity of the two
clusters iC and jC . The absolute inter cluster connectivity between a pair of clusters iC and jC is defined as
the sum of weight of edges that connects vertices in iC to vertices in jC . This is the Edge Cut (EC) of the
cluster containing two clusters mentioned above. The cluster connectivity of a cluster iC is captured by the
size of its min-cut bisector [26, 27]. Thus the relative inter-connectivity (RI) between a pair of clusters iCand jC is given by
ASDF Thailand Proceedings of the International Congress 2014 [IC 2014], Bangkok, Thailand 135
Int Congress 2014 ISBN : 978-81-929742-3-1 www.intcongress.com

{ , }| |( , ) | | | |
2
i j
i j
C Ci j
C C
ECRI C C EC EC
(1)
which normalizes the absolute inter cluster connectivity with the average internal inter-connectivity of the two clusters. By focusing on the relative inter cluster connectivity between clusters, [25] overcomes the limitations of existing algorithms that use static inter cluster connectivity models. For instance, Figure 1 shows that how the clusters are merged (a) and (b) over clusters (c) and (d), because the relative inter cluster connectivity between clusters (a) and (b) is higher than the relative inter cluster connectivity between clusters (c) and (d), even though the later pair of clusters have a higher absolute inter-connectivity. Hence, the relative inter cluster connectivity is taken into account differences in shapes of the clusters as well as differences in degree of connectivity of different clusters.
The absolute similarity between a pair of clusters is captured in different ways [27]. A drawback of these schemes is that by relying only on a single pair of points, they are less tolerant to outliers and noise. So, the closeness of two clusters is measures by computing the average similarity between the points in iC that are
connected to points in jC . Since these connections are determined by distance between nodes, their
average strength provides a good measure of the affinity between the data items along the interface layer of the two sub-clusters. The internal similarity of each cluster iC is measured in different ways. The average
weights of the edges on the internal bisection of iC and jC is smaller than the average weight of all the
edges in these clusters. But the average weight of these edges is a better indicator of the internal similarity of these clusters. Hence the relative closeness between a pair of clusters iC and jC is computed as,
{ , }( , ) | || || | | | | | | |
C Ci j
C Ci j
EC
i jji
EC ECi j i j
SRC C C CC S S
C C C C
(2)
whereCiECS and
C jECS are the average weights of the edges that belong in the min-cut bisector of clusters
iC and jC ,respectively, and SECf iC ; jC gives the average weight of the edges that connect vertices in iC to
vertices in jC . Also a weighted average of the internal closeness of clusters iC and jC is used to normalize
the absolute similarity ofthe two clusters, that favors the absolute similarity of cluster that contains the larger number of vertices.
A. Cluster Head Selection Using Trust
Figure 2. General Architecture of the proposed work
ASDF Thailand Proceedings of the International Congress 2014 [IC 2014], Bangkok, Thailand 136
Int Congress 2014 ISBN : 978-81-929742-3-1 www.intcongress.com

Figure.2. Illustrate the main features and elements of the proposed architecture. Each cluster composed of cluster head, backup node and members of the cluster. The cluster head is the node that identifies the cluster. It is responsible for communication within the members of the cluster and between the clusters. The backup node is responsible for ensuring the redundancy. In case of failure of the cluster head, the backup node will act as the cluster head. Remaining nodes in the cluster are known as the members of the clusters that are not the cluster head and the backup nodes. The cluster head, backup nodes and the members are forming the key agreement zone and generate the group key for cluster.
Trust is one of the basic levels of security. Trust is calculated by each node and the values are stored locally and regular updating is performed based on new interactions. The trust values are expressed between 0 and 1. 0 indicates a complete mistrust and 1 indicates complete trust. When a new or unknown node y enters the neighbouring hood of node x, the trust agent of node x calculates the trust value of node y.
Direct Trust Direct trust value is evaluated basing on the direct experience that one node may have on another node. Such direct experience can be either full or nil. Full experience increases credential and nil experience decreases credential accordingly. The number of experiences may be unlimited. But the computation trust value is within the range between 0 and 1.
Indirect Trust When node x doesn’t have enough direct experience on node y, the node x may enquire to a third node for recommendation.
A cluster head is chosen and it checks the required trust in the network. The algorithm compares the node’s trust value by combining direct and indirect trusts to achieve whole trust. Trust value (Ttheroshold) is associated with each job that is processed till all the Cluster Heads (CH) is selected. Trust (T) is then tested against trust sources with direct trust value (Dt), indirect trust value (It), and total trust value (Tt). If the Tt
is higher than or equal to required trust value then the node is selected as the CH provided none of the two hop nodes that have higher Trust value than the current node. The next highest trust value within the two hop node is named as backup node.
The CH is elected i.e. if a node (X) become a cluster head, then check whether it had any earlier experience with its neighbourhood nodes and if so, the direct trust value (Dt) is represented as shown in equation
1
i
ni y
ti i
wT xD
w (3)
where, Tyi(x) is the sum of its trust value with its two hop neighbors and described later in this section.
If Dt Tmax, then the associated risk is lower than risk threshold and the node (X) becomes CH where there is no node that has higher T value than current node (X). So the indirect trust value (It) is represented as in equation
1
m
yy
t
T xI
m
(4)
Where Ty(x) trust value of node X based on recommendations from its two hop neighbors.
If It Tmax then associated risk is lower than risk threshold so that node(X) becomes CH provide that there are no neighbour nodes with higher T values. If node (X) value T is lower than Tmax then total trust value (Tt) is computed as
tT * *t A t BD W I W (5)
where WA and WB are weights assigned. If (Tt) is greater than/equal to (Tthreshod) then the process is continued as above.
ASDF Thailand Proceedings of the International Congress 2014 [IC 2014], Bangkok, Thailand 137
Int Congress 2014 ISBN : 978-81-929742-3-1 www.intcongress.com

In case if all CH is not discovered Tthreshold is decreased.
Once CH is selected, the trust value certificates can be used by the nodes when it moves to adjacent clusters and this count is used to compute indirect trust. The indirect trust uses communication data rate (Rc) is the rate of successful communication with evaluated nodes with values between 0 and 1 and initial value is 1. The data delivery rate (Rd ) is the rate of successful packet delivery by the evaluated node. The indirect trust is the weighted sum of Trust value certificate and communication data rate.
The CH and the backup node are termed the “control set”. The CH, backup node and all the members of the cluster are generating the TEK agreement using A-GDH.2 from the clique’s protocol [22]. It is based on Diffie-Hellman (DH) [23] key agreement method that is responsible for key authentication. The backup node is responsible to maintain the redundant details of CH and it will be the CH if CH is left from the cluster. The pseudo code of A-GDH.2 protocol algorithm is shown below.
1
*
M = , .. , b e s e t o f u s e r s w a n t in g to s h a re k e y S.2 e x e c u te s n ro u n d s
In i t ia liz e :L e t p b e a p r im e a n d q a p r im e d iv is o r o f p -1
L e t G b e u n iq u e c y c lic s u b g ro u p o f o f o rd e r q
L e t b e a g e n e r
n n
p
L e t M MA G D H
Z
1
1
1
*
.... .
1
*
. . . .
a to r o f GR o u n d i 0
1 . M s e le c ts r
2 . M M : 1, ,
n
1 . M s e le c ts r
2 . M M : 1, .
U p o n r e c e ip t o f th e a b o v e , e v e ry M c o m p u t
i
j i
iin
j
i i p
r rr r r
i i
n n p
r r Kr
n i
i
i n
R
j i
R o u n d
R
A L L i n
Z
Z
11
1
. . . . . .. .
e s :
iin in i
j n
r r K K rr r r
nS
Figure 3. A-GDH.2 Protocol
The concept of number of Data Transfer Communication (DTC) is represented as:
,0,
Tm nt
m n
nDTC
T
(6)
Where T is the time period, m and n is the nodes through which data are transferred. If two nodes enter each other’s wireless transmission range then ,m nn is 1 else 0.
Number of Successful Delivery (SD) can be represented as:
, , ,0
T
m n m n n mt
SD S S
(7)
ASDF Thailand Proceedings of the International Congress 2014 [IC 2014], Bangkok, Thailand 138
Int Congress 2014 ISBN : 978-81-929742-3-1 www.intcongress.com

Duration within Communication Range (CR) can be represented as:
0,
broad cast ack recieved
number of broadcasts
T
tm n
No ofCR
Total
(8)
The direct trust can be calculated as:
1 , 2 , 3 ,3
1
Trust = m n m n m n
kk
DTC SD CRDirect
(9)
V. Results and Discussion
Simulations were run using 150 nodes over an area of 1500 sq m. Experiments were conducted for different computed trust and mobility with DSR as the underlying routing protocol. The impact of Diffie Hellman (DH) and GDH for key management was studied. The number of clusters formed, route discovery time, end to end delay and packet delivery ratio respectively was measured.
Figure 4. Formation of Number of Clusters
From figure 4 it can be seen that higher trust values increase the number of clusters formed and thus provides better intra cluster communication with very low energy cost. At trust value of 0.7 the inter cluster connectivity and the intra cluster connectivity is balanced for all node motilities.
The cluster head formation over time shows improvement and stability of the proposed technique compared to [19].
Figure 5. Cluster Formations over Time
ASDF Thailand Proceedings of the International Congress 2014 [IC 2014], Bangkok, Thailand 139
Int Congress 2014 ISBN : 978-81-929742-3-1 www.intcongress.com

In [19], the security was enhanced by the clustering criterion that monitors the trust relations continuously and detects the malicious nodes. Two steps discussed to enhance the efficiency of cluster method and to have accurate trust values are
a) Special traffic and interactions were generated to measure trustworthiness of neighbors and b) Recommendation is sent to initiate the trust vales for the unknown neighbors.
Proposed method reduces the time for cluster formation when compared to method proposed in [27]. Table 1 shows the average route discovery time and End to End Delay in seconds for different techniques.
Table 1 Route discovery time in seconds and end to end delay in seconds
Techniques Route Discovery Time in Seconds
End to End Delay in Seconds
DSR 0.962 0.0104 AODV 1.04 0.011
Trust model proposed by Drira et al., 1.114 0.00928
Proposed DSR with GDH 1.06 0.00817 Proposed DSR with DH Key Management 1.03 0.00836
Figure 6. Route Discovery Time
Results show that route discovery time of proposed DSR with Diffie-Hellman (DH) key management is increased as 7.07% than DSR, but reduced as 0.96% than AODV, as7.54% than trust model proposed by Drira and as2.83% than proposed DSR with GDH. From table 1 it is observed that the End to End Delay is achieved by comparing with different methods. Results show that End to End Delay of proposed DSR with DH key management is decreased as 19.62% than DSR, as 24% than AODV, as 9.91% than trust model proposed by Drira but increased as 2.33% than proposed DSR with GDH.
Table 2 Packet delivery ratios
DSR 0.904
AODV 0.86
Trust Model Proposed by Drira et al.,
0.914
Proposed DSR with GDH 0
ASDF Thailand Proceedings of the International Congress 2014 [IC 2014], Bangkok, Thailand 140
Int Congress 2014 ISBN : 978-81-929742-3-1 www.intcongress.com

.932
Proposed DSR with DH Key Management
0.917
Figure 7. Packet Delivery Ratios
From table 2 and figure 7 it is observed that the Packet Delivery Ratio is achieved by comparing with different methods. Results show that Packet Delivery Ratio of proposed DSR with DH key management is increased with1.44% when compared to DSR, with6.63% than AODV, with0.33% than trust model proposed by Drira but decreased as 1.61% than proposed DSR with GDH.
VI. Conclusion
Key management is crucial for MANET security. In MANET, all networking functions including routing and data transmission are done by the nodes without the need for a central point to control. In a secure group communication, key management techniques are used to provide a correct distribution and easy maintenance of cryptographic keys. This study investigates network performance degradation due to such attacks when trust is used. Trust based clusters are formed based on intermediate nodes trust values. A control group generating the group key is proposed as a new technique in group key management. This includes construction of a group with total users N being divided into many clusters. Secure key management is performed by malicious nodes being avoided due to cluster heads exchanging keys based on trust. Simulation shows the effectiveness of the proposed routing. End to end delay is considerably reduced and packet delivery ratio increases with the proposed method. It is also observed that the performance of proposed routing is considerably better in larger networks.
References
1. Raj, P. N., & Swadas, P. B. (2009). Dpraodv: A dyanamic learning system against blackhole attack in aodv based manet. arXiv preprint arXiv:0909.2371.
2. Ramesh, P. S. T. (2013). Secure Routing using Reverse Method and Malicious Node Detection using Global Trust Scheme in MANET.
3. Singh, S. P., & Maini, R. (2011). Comparison of data encryption algorithms. International Journal of Computer Science and Communication, 2(1), 125-127.
4. Elminaam, D. S. A., Abdual-Kader, H. M., & Hadhoud, M. M. (2010). Evaluating The Performance of Symmetric Encryption Algorithms. IJ Network Security, 10(3), 216-222.
5. Yavuz, A. A., AlagOz, F., & Anarim, E. (2010). A new multi-tier adaptive military MANET security protocol using hybrid cryptography and signcryption. Turkish Journal of Electrical Engineering & Computer Sciences, 18(1), 1-21.
6. Kahya, N., Ghoualmi, N., & Lafourcade, P. (2012). Secure Key Management Protocol in WIMAX. International Journal, 4.
ASDF Thailand Proceedings of the International Congress 2014 [IC 2014], Bangkok, Thailand 141
Int Congress 2014 ISBN : 978-81-929742-3-1 www.intcongress.com

7. Chiu, Y. P., Huang, C. Y., & Lei, C. L. (2012). SEMPRE: Secure Multicast Architecture Using Proxy Re-Encryption. International Journal Of Innovative Computing Information And Control, 8(7 A), 4719-4748.
8. Srivastava, A. K., Sharma, S., &Sahu, S. (2012). Msmet: A Modified & Secure Multilanguage Encryption Technique. International Journal on Computer Science and Engineering, 4(3).
9. Bouassida, M. S., Chrisment, I., &Festor, O. (2008). Group Key Management in MANETs. IJ Network Security, 6(1), 67-79
10. Chen, Y. R., Tygar, J. D., &Tzeng, W. G. (2011, April). Secure group key management using uni-directional proxy re-encryption schemes. In INFOCOM, 2011 Proceedings IEEE (pp. 1952-1960). IEEE.
11. Rahman, M., Sampalli, S., &Hussain, S. (2010, December). A robust pair-wise and group key management protocol for wireless sensor network. In GLOBECOM Workshops (GC Wkshps), 2010 IEEE (pp. 1528-1532). IEEE.
12. Gomathi, K., & Parvathavarthini, B. (2010, December). An efficient cluster based key management scheme for MANET with authentication. In Trendz in Information Sciences & Computing (TISC), 2010 (pp. 202-205). IEEE.
13. John, S. P., & Samuel, P. (2010, October). A distributed hierarchical key management scheme for mobile ad hoc networks. In Information Networking and Automation (ICINA), 2010 International Conference on (Vol. 1, pp. V1-308). IEEE.
14. Niu, Q. (2009, October). A Trust-Based Message Encryption Scheme for Mobile Ad Hoc Networks. In Computer Science and Engineering, 2009. WCSE'09. Second International Workshop on (Vol. 1, pp. 172-176). IEEE.
15. Wu, B., Wu, J., & Dong, Y. (2009). An efficient group key management scheme for mobile ad hoc networks. International Journal of Security and Networks, 4(1), 125-134.
16. Harn, L., & Lin, C. (2010). Authenticated group key transfer protocol based on secret sharing. Computers, IEEE Transactions on, 59(6), 842-846.
17. Lim, S. Y., & Lim, M. H. (2011). Energy-Efficient and Scalable Group Key Management for Hierarchical Sensor Network. Journal of Ubiquitous Systems & Pervasive Networks, 2(1), 39-47.
18. Zhang, Y., Shen, Y., & Lee, S. (2010, April). A cluster-based group key management scheme for wireless sensor networks. In Web Conference (APWEB), 2010 12th International Asia-Pacific (pp. 386-388). IEEE.
19. Drira, K., Seba, H., & Kheddouci, H. (2010). ECGK: An efficient clustering scheme for group key management in MANETs. Computer Communications, 33(9), 1094-1107.
20. Fotino, M., Gozzi, A., De Rango, F., Marano, S., Cano, J. C., Calafate, C., & Manzoni, P. (2007, July). Evaluating Energy-aware behaviour of proactive and reactive routing protocols for mobile ad hoc networks. In 10th International Symposium on Performance Evaluation of Computer and Telecommunication Systems (SPECTS’07) (pp. 16-18).
21. Tamilarasi, M., Palanivelu, T. G., Rajan, B., & Das, S. K. (2005). Node Optimization in MANETs for Maximum Throughput Using On-Demand Routing Protocols. In Proceedings of the Eleventh National Conference on Communications: NCC-2005, 28-30 January, 2005 (p. 66). Allied Publishers.
22. Carts, D. A. (2001). A review of the Diffie-Hellman algorithm and its use in secure internet protocols. SANS institute, 1-7.
23. Pereira, O., & Quisquater, J. J. (2002). Security analysis of the cliques protocols suites: first results. In Trusted Information (pp. 151-166). Springer US.\Karypis, G., Han, E. H., & Kumar, V. (1999). Chameleon: Hierarchical clustering using dynamic modeling. Computer, 32(8), 68-75.
24. Karypis, G., Han, E. H., & Kumar, V. (1999). Chameleon: Hierarchical clustering using dynamic modeling. Computer, 32(8), 68-75.
25. Karypis, G., & Kumar, V. (1995). Metis-unstructured graph partitioning and sparse matrix ordering system, version 2.0.
26. Karypis, G., & Kumar, V. (1998). A fast and high quality multilevel scheme for partitioning irregular graphs. SIAM Journal on scientific Computing, 20(1), 359-392.
27. Guha, S., Rastogi, R., & Shim, K. (1998, June). CURE: an efficient clustering algorithm for large databases. In ACM SIGMOD Record (Vol. 27, No. 2, pp. 73-84).
ASDF Thailand Proceedings of the International Congress 2014 [IC 2014], Bangkok, Thailand 142
Int Congress 2014 ISBN : 978-81-929742-3-1 www.intcongress.com

Image Steganography Technique using Radon Transform and Neural Network with the Wavelet
Transform 1S. Thenmozhi, 2Dr. M. Chandrasekaran
1Research scholar, Anna University, Chennai, Tamilnadu, India 2Professor & Head, Dept of ECE, GCE, Bargur, Tamilnadu, India
Abstract- Steganography is the art and science of communicating secret data by hiding information in plain sight without being noticed within an innocent cover data so as not to arouse an observer’s suspicion. The vital goal here is to conceal the very existence of the embedded data. It is used to achieve secure data transmission over internet. In this paper, a novel steganography technique for hiding data in digital images by combining wavelet transform, neural network and radon transform is proposed. The cover image is decomposed into four parts by applying discrete wavelet transform. Radon transform is applied on secret image. Finally Back propagation neural network is used to conceal the transformed secret data in wavelet coefficients of the cover image. From our experimental results it can be shown that the proposed system hides information effectively, better secrecy and maintains a better visual display of stego image than the traditional methods.
Keywords: Back propagation neural network, discrete wavelet transform, frequency domain, Steganography and radon transform
I. Introduction
The enormous development in the internet technology has raised the demand of a private and secured communicational environment. With the increased number of users, the necessity for information concealing has become as a critical issue in the World Wide Web (WW). The users are concerned about maintaining and conserving the confidentiality of the secret messages transmitted through the Internet. Steganography is one of the powerful techniques in which information is being concealed using a carrier for the secret message. There are different types of steganography and every one of them has its own specific characteristics and applications. On the other hand, there are various types of carriers that have been used to conceal the data such as text, audio, video and digital images files. Digital images are extensively used in the steganography area.
Steganography is originally composed of two Greek words steganos (secret) and graphic (writing) which means "covered writing”. Steganography is defined by Markus Kahn as follows, “Steganography is the art and science of communicating in a way which hides the existence of the communication”. So, steganography is the process of hiding secret data within public information. Image based steganography is the most common system used since digital images are widely used over the Internet and Web. Digital image steganography is a technique of secret communication that aims to convey a huge amount of secret data relatively to the size of cover image between two communicating parties. Furthermore, it also aims to avoid the suspicion of non-communicating parties to this kind of communication.
There are a number of steganography methods that embed secret message in an image file. These steganography methods can be classified according to the format of the cover image or the hiding method. Based on embedding domain steganography methods are divided into two: Spatial domain and transform domain. The Least Significant Bit (LSB) substitution is the example of spatial domain methods [1]. The main idea in LSB is the direct replacement of LSBs of noisy or unused bits of the host image with the secret message bits. Still LSB is the most preferred system used for data hiding because it is very simple to
ASDF Thailand Proceedings of the International Congress 2014 [IC 2014], Bangkok, Thailand 143
Int Congress 2014 ISBN : 978-81-929742-3-1 www.intcongress.com

implement offers high hiding capacity, and provides an easy way to control stego-image quality but it has low robustness to modifications [2] made to the stego-image including low pass filtering and low imperceptibility. Some examples to hide data in spatial domain using LSB approach can be found in [3], [4].
The other type of embedding method is the transform domain techniques which appeared to overcome the robustness and imperceptibility problems found in the LSB substitution techniques. There are many transforms that can be used in data hiding, the most widely used transforms are; Discrete Cosine Transform (DCT), Discrete Wavelet Transform (DWT) and Discrete Fourier transform (DFT). Examples to data hiding using DCT can be found in [5], [1].Most recent researches are directed to the use of DWT since it is used in the new image compression format JPEG and MPEG4, examples of using DWT can be found in [6], [7], [8]. In [9] the secret message is embedded into the high frequency coefficients of the wavelet transform while leaving the low frequency coefficients sub band unaltered.
In this paper, a new steganography scheme to embed the secret message in the cover image is presented. This proposed technique is based on training Back Propagation Neural Network (BPNN) in the discrete wavelet transform domain. BPNN is implemented for embedding and extracting the message. From the results it is observed that the proposed steganography method can embed the secret message effectively without degrading the quality of cover image.
The rest of this paper is organized as follows: section 2 describes the preliminaries including DWT, radon transform and neural network. Section 4 presents the proposed image steganography approach. The experimental results and performance comparisons are given in section 5. Finally, Section 5 concludes this paper followed by relevant references.
II. Preliminaries
A. Discrete Wavelet Transform (DWT)
Wavelet transforms have become one of the most important and powerful tool of signal representation. Nowadays, it has been used in image processing, data compression, and signal processing. The simplest of DWT is Haar - DWT where the low frequency wavelet coefficients are generated by averaging the two pixel values and high frequency coefficients are generated by taking half of the difference of the same two pixels [10]. For 2D-images, applying DWT will result in the separation of four different bands. LL is the lower resolution approximation of the image. HL is the horizontal, LH is the vertical, HH is the diagonal component. These bands are shown in Figure 1.
Figure 1.Sub bands of 1 level 2 dimensional Discrete Wavelet Transform
With the DWT, the significant part of the spatial domain image exist in the approximation band that consists of low frequency wavelet coefficients and the edge and texture details usually exist in high frequency sub bands, such as HH, HL, and LH. The secret images are embedded to the High Frequency components as it is difficult for the human eye to detect the existence of secret data.
ASDF Thailand Proceedings of the International Congress 2014 [IC 2014], Bangkok, Thailand 144
Int Congress 2014 ISBN : 978-81-929742-3-1 www.intcongress.com

B. Radon Transform
The Radon transform on an image f (x,y) for a given set of angles can be thought of as computing the projection of the image along the given angles. The resulting projection is the sum of the intensities of the pixels in each direction, i.e. a line integral. The result is a new image R(휌, 휃).An image can be represented as:
r = x cos휃+y sin휃 (1) after which the Radon transform can be written as ∫ ∫ 푓(푥, 푦)훿(휌 − 푥푐표푠휃 − 푦푠푖푛휃)푑푥푑푦 (2) where 훿 (·) is the Dirac delta function.
C. Back Propagation Neural Network (BPNN)
A neural network represents a highly parallelized dynamic system with a directed graph topology that can receive the output information by means of reaction of its state on the input nodes [11]. The ensembles of interconnected artificial neurons generally organized into layers of fields include neural networks. The behavior of such ensembles varies greatly with changes in architectures as well as neuron signal functions. Artificial neural networks are massively parallel adaptive networks of simple non liner computing elements called neurons which are intended to abstract and model some of the functionality of the human nervous system in an attempt to partially capture some of its computational strengths. Neural networks are classified as feed forward and feedback networks. Back propagation network is of feed forward type. In BPNN the errors are back propagated to the input level. The aim of this network is to train the net to achieve the balance between the ability to respond correctly to the input pattern that are used for training and the ability to provide good response to the input that are similar. Back Propagation Neural Network has good nonlinear approximation ability. It can establish the relationship between original wavelet coefficients and stego image coefficients by adjusting the network weights and bias before and after embedding watermark. Owning to the use of neural network, we can extract watermark without the original image and thus reduce the limit in practical applications.
III. Proposed Method
In this section, we explain how proposed system embeds secret information in cover image and how we retrieve secret data from the stego-image. In this method, the use of Back Propagation Neural Network (BPNN) is the key technique. First, a cover image is decomposed into four sub bands using haar wavelet filter. Vertical sub band is selected for embedding. Radon transform is applied on both selected sub band and secret message. The back propagation neural network is implemented to embed and extract the watermark in this method
A. Information Concealing Algorithm
In the proposed scheme, the host image is decomposed into four sub bands using DWT. Vertical sub band is selected for embedding. Radon transform is applied to secret message and sub band. BPNN is used for embedding and extracting the secret message. The training process is completed before embedding. After getting the coefficients from the stego image, the relationship between the wavelet coefficients and the watermark can be established. The additional information is used to train the neural network to make it sure it must have the capability of memorizing the characteristics of relations between the stego image and the secret message. The hidden layer transfer function considered to be sigmoid, and linear for the output layer. Secret message embedding using BPNN in wavelet domain is shown in Fig.2.
ASDF Thailand Proceedings of the International Congress 2014 [IC 2014], Bangkok, Thailand 145
Int Congress 2014 ISBN : 978-81-929742-3-1 www.intcongress.com

Figure 2. Block diagram of secret message embedding procedure of steganography
Input: An m × n cover image, key and a secret message or image. Output: An m × n stego-image. Algorithm:
1. Read the cover image and secret message or image. 2. Apply DWT to decompose the cover image into four sub bands. 3. Select the vertical sub band 4. Apply radon transform to the sub band and secret message. 5. Apply BPNN to embed the secret message 6. Perform Inverse Discrete Wavelet Transform (IDWT) on the output of BPNN. 7. Prepare stego image to display 8. Compute Peak to Signal Noise Ratio between stego image and the cover image
B. Information Extraction Algorithm
In this step extraction of secret message is carried out. The secret message extraction process is the anti- process of message embedding. The trained neural network is used in the extraction process. Secret message extraction procedure using BPNN is shown in Fig.3.
Figure 3. Block diagram of extraction of secret message from a stego object
ASDF Thailand Proceedings of the International Congress 2014 [IC 2014], Bangkok, Thailand 146
Int Congress 2014 ISBN : 978-81-929742-3-1 www.intcongress.com

Input: An m × n stego-image and key. Output: a secret message or image. Algorithm:
1. Read the stego image and key 2. Decompose the stego image by using Haar wavelet transform 3. Select the specific sub band 4. Extract the secret message by applying sub band and key as an input to BPNN 5. Prepare secret image to display
IV. Implementation and Measures
MATLAB platform is chosen to develop the above steganography algorithm. In MATLAB software there are extensive libraries and efficient functions of image processing and neural network which is very useful in steganography. Developers may use other programming language also. Peak to Signal Noise Ratio (R) can be used to evaluate the performance of the proposed data hiding scheme.
A. Peak Signal to Noise Ratio (PSNR)
The weighted mean squared error between the cover image and the stego-image can be used as one of the measures to assess the relative perceptibility of the embedded message. Mean square error (MSE) and Peak Signal to Noise Ratio (PSNR) can be used as metrics to measure the degree of imperceptibility.
The PSNR of the watermarked image is calculated using the formula 푃푆푁푅 = 10푙표푔 ∗ (3) Where R=256, MSE is defined as:
푀푆퐸 = ∑ ∑ [ ( , ) ( , )]∗
(4)
Where I is the cover image and I’ is the stego image. PSNR is measured in Decibels (dB) and the bigger the PSNR value is, the better the message conceals.
V. Result Analysis
In this experiment we used JPEG, PNG and BMP images of various resolutions as cover image. We train a set of 100 images which is randomly taken from web. These images have various memory sizes. The example of opted cover images are as follows:
(a) (b)
Figure.4. (a) Cover images (b) Secret images
ASDF Thailand Proceedings of the International Congress 2014 [IC 2014], Bangkok, Thailand 147
Int Congress 2014 ISBN : 978-81-929742-3-1 www.intcongress.com

Table I. Comparison of PSNR value for different cover and secret images
Cover Image Secret Image PSNR
Blue Hills.JPG horse 36.6977
taj 37.8191 tiger 41.26
Flower.JPG horse 32.3704
taj 32.6755 tiger 33.4983
Peppers.PNG horse 33.7979
taj 34.2259 tiger 35.4734
Apple.BMP horse 34.8935
taj 35.6777 tiger 37.4468
Icecream.PNG horse 32.7179
taj 33.0638 tiger 33.9354
Table I summarizes the results of proposed steganography method for the images of blue hills, flower, peppers, apple and ice cream. From the above table, we can notice that better results are obtained.
VI. Conclusion
In this paper, a novel steganography algorithm based on radon transform and BPNN in wavelet domain was presented. Wavelet domain is powerful and efficient transform domain than previously used other transforms. The proposed method maintains the prime objective of steganography, which is the secrecy. It has been shown that the stego image preserve the visible quality of the cover image. This approach succeeds to keep intact the original image, after the extraction of embedded secret message. so, this proposed algorithm for steganography can be termed as successful new technique. However for the future work of this technique, we recommend the secret message should be compressed before the hiding process takes place. This is very important because in this way we will reduce the amount of information that is sent, and hence minimizing the chance of degrading the image.
References
1. Chia-Chen Lin,”High capacity data hiding scheme for DCT-based images”, Journal of Information Hiding and Multimedia Signal Processing, 1, 2010.
2. N. Wu and M. Hwang. "Data Hiding: Current Status and Key Issues," International Journal of Network Security, Vol.4, No.1, pp. 1-9, Jan.2007.
3. R. Chandramouli and N. Memon, “Analysis of LSB based image steganography techniques,” in Proc. ICIP, Oct. 2001.
4. Ajit Danti and Preethi Achary,” Randomized embedding scheme based on DCT coefficients for image steganography”, IJCA Special Issue on Recent Trends in Image Processing and Pattern Recognition, 2010
5. Ali Al-Ataby and Fawzi Al-Naima,” A modified high capacity image steganography technique based on wavelet transform”, The International Arab Journal of Information Technology, 7:358–364, 2010.
ASDF Thailand Proceedings of the International Congress 2014 [IC 2014], Bangkok, Thailand 148
Int Congress 2014 ISBN : 978-81-929742-3-1 www.intcongress.com

6. M Anjunatha, H S. and Raja K B,” High Capacity and Security Steganography using Discrete Wavelet Transform”, International Journal of Computer Science and Security (IJCSS), 3: Issue (6), 2010.
7. V. Kumar and D. Kumar,” Performance evaluation of DWT based image steganography. In Proceedings of Advance Computing Conference (IACC)”, 2010 IEEE 2nd International, pages 223–228, 2010.
8. Bibi Isac and V. Santhi, ”A Study on Digital Image and Video Watermarking Schemes using Neural Networks‖, International Jounal of Computer Applications, Vol. 12, No. 9, Jan 2011.
9. W. Chen, "A Comparative Study of Information Hiding Schernes Using Amplitude, Frequency and Phase Embedding," PhD Thesis, National Cheng Kung University, Tainan, Taiwan, May 2003.
10. Liu Shaohui, Yao Hongxun and GAO Wen “Neural Network based Steganalysis in Still Images” Proceedings of IEEE ICME 2003.
11. Shadrokh samavi, Vajiheh Sabeti,Mojtaba Mahadevi and Shahram Shirani,”Steganalysis of embedding in difference of image pixel pairs by neural network”, Journal of ISeCure, volume 1, pages 17-26, January 2009.
ASDF Thailand Proceedings of the International Congress 2014 [IC 2014], Bangkok, Thailand 149
Int Congress 2014 ISBN : 978-81-929742-3-1 www.intcongress.com

A New CSK Communication System With Display and Cameras
Atsuya Yokoi1, Sangon Choi2 and Hiroki Mizuno1
1Samsung R&D Institute Japan, 2-7, Sugasawa-cho, Tsurumi-ku, Yokohama-si, Kanagawa, Japan 2Samsung Electronics, 416, Maetan 3-dong, Yeongtong-gu, Suwon-si, Gyeonggi-do, Korea
Abstract- Color Shift Keying (CSK) is one of the modulation schemes for Visible Light Communication (VLC) that was approved as the IEEE802.15.7-VLC standard in 2011. CSK has some advantages over conventional modulation schemes for VLC. In this paper, the principle and the performance of the basic CSK system are shown and a new CSK communication system from display to cameras on mobile devices is proposed. In experiments with non-real time test system, the proposed system achieved 240 kbps data rate using 64×64 SDM-16CSK. A real time prototype system that can send some contents from display to smart phone, achieved 6kbps data rate with 16×16SDM-4 CSK.
I. Introduction
Visible Light Communication (VLC) is one of the most attractive technologies for the next indoor or outdoor high speed and high security communication network [1]. In 2008, Color Shift Keying (CSK) was proposed to the IEEE standard association as a new modulation scheme for VLC [2-3]. In 2011, CSK was approved as one of the physical layers in the IEEE802.15.7-VLC standard [4].
CSK is a new modulation scheme that uses visible colors for data transmission. It uses VLC systems consisting of multi-color light sources and photo detectors. In such multi-color systems, a Wave-length Division Multiplexing (WDM) scheme with an On-Off Keying (OOK) modulation is generally used for VLC [5]. Each light source in a WDM system independently transmits information. On the other hand, CSK systems transmit information using mixed color generated by the multi-color light sources. Although WDM is a good solution for increasing the data rate using multi-color light sources, CSK has the following advantages over the conventional WDM-OOK system.
(1) Good Connectivity
Future VLC systems will consist of various light sources, illuminations, LED displays, LCDs, etc. Therefore, we have to consider the connectivity among these various devices, which have different color characteristics. In WDM, the connectivity is guaranteed by the wavelength matching between the light source on the transmitter and the photo detector on the receiver. Thus, the connectivity directly depends on the characteristics of the light devices. However, in CSK, information data is transformed into a mixed color that is generated by multi-color light sources. The mixed color is defined as a color point of the CSK constellation on the color coordinates plane. Therefore, the connectivity is guaranteed by the color coordinates even among different devices.
(2) High Speed and Variable Data Rate
One of the issues with VLC is that the frequency responses of light sources (LED, etc.) are generally insufficient for high speed modulation. In OOK modulation, the bit rate is decided by only the symbol rate for the optical modulation. This means the OOK bit rate is limited by the frequency response of the light source. In CSK, the bit rate is decided by not only the symbol rate, but also the number of color points in the CSK constellation. This means that the CSK bit rate is not limited by the frequency response of the light sources. If the Signal-to-Noise Ratio (SNR) is higher, the CSK system can obtain a higher bit rate.
ASDF Thailand Proceedings of the International Congress 2014 [IC 2014], Bangkok, Thailand 150
Int Congress 2014 ISBN : 978-81-929742-3-1 www.intcongress.com

(3) Constant Total Power
The total power of all the CSK light sources is constant although each light source may have a different instantaneous output power. Thus, there is no flicker issue associated with CSK due to amplitude variations. Also, the total power can be changed independently of the mixed color. Therefore, dimming control is simultaneously possible in CSK data communications.
In this paper, firstly, the principle and performance of the basic CSK system are shown in section Ⅱ. Next, a new CSK communication system with display and cameras is proposed, and some experimental results for evaluating the proposed system are shown in section Ⅲ.
II. BASIC CSK SYSTEM
A. Principle
A basic CSK system configuration consisting of multi-color (RGB) LEDs and photo detectors with RGB color filters in Figure 1. Figure 2 shows an example of CSK color symbol mapping on CIE1931 x-y color coordinates [6]. In this figure, R(xR,yR), G(xG,yG), and B(xB,yB) are the x-y color coordinates of the RGB LEDs, and (xp,yp) is the one for the allocated color point used as a CSK symbol.
The information data in Figure 1 are coded into x-y values by the color mapping block, according to the color mapping rule shown in Figure 2. In this example, four color points are placed in the RGB triangle as CSK symbols. This means the system can send 2 bits of data per CSK symbol. Those allocated color points are called a CSK color constellation. Moreover, the example constellation with four color points is called 4CSK. Then, the x-y values are transformed into PR, PG, and PB, which are the emission powers of the RGB LEDs. The color of point (xp,yp) is generated according to the ratio of the 3 LEDs’ powers PR, PG, and PB. The relation among (xR,yR), (xG,yG), (xB,yB), (xp,yp), PR, PG, and PB is shown by the following simultaneous equations.
)3(1)2(
)1(
BGR
BBGGRRp
BBGGRRp
PPPyPyPyPy
xPxPxPx
As the last equation shows, the total power (PR+PG+PB) is always constant. Furthermore, those power values are normalized ones. Therefore, the actual total power can be arbitrarily set up and can be changed even during the CSK communication. The x-y values at the receiver side are calculated from the received RGB light power PR’, PG’, and PB’. Then, the x-y values are decoded into the received data. As mentioned above, the CSK symbols are provided as the visible colors that are created by the RGB light sources, and the information is transmitted as the intensity ratio among the RGB light sources.
Figure 1. CSK basic system configuration.
D/A
D/A
D/A
Opticalsources
xyto
PR,PG,PB
ColorMapping
x
y
PR
PG
PB
LEDR
LEDG
LEDB
A/D
A/D
A/D
PhotoDetectors
PR,PG,PB
toxy
x’
y’
ColorDe-mapping
Data
PR’
PG’
PB’
PDR
PDG
PDB
Data
ASDF Thailand Proceedings of the International Congress 2014 [IC 2014], Bangkok, Thailand 151
Int Congress 2014 ISBN : 978-81-929742-3-1 www.intcongress.com
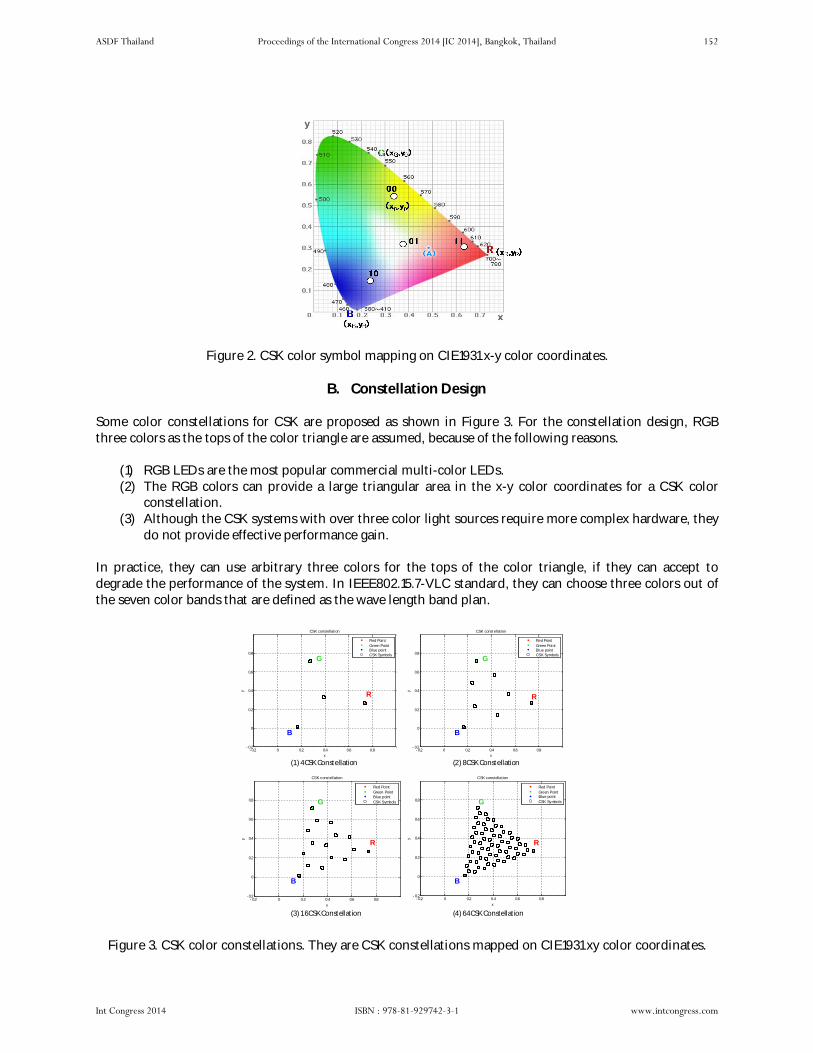
Figure 2. CSK color symbol mapping on CIE1931 x-y color coordinates.
B. Constellation Design
Some color constellations for CSK are proposed as shown in Figure 3. For the constellation design, RGB three colors as the tops of the color triangle are assumed, because of the following reasons.
(1) RGB LEDs are the most popular commercial multi-color LEDs. (2) The RGB colors can provide a large triangular area in the x-y color coordinates for a CSK color
constellation. (3) Although the CSK systems with over three color light sources require more complex hardware, they
do not provide effective performance gain.
In practice, they can use arbitrary three colors for the tops of the color triangle, if they can accept to degrade the performance of the system. In IEEE802.15.7-VLC standard, they can choose three colors out of the seven color bands that are defined as the wave length band plan.
Figure 3. CSK color constellations. They are CSK constellations mapped on CIE1931 xy color coordinates.
-0.2 0 0.2 0.4 0.6 0.8-0.2
0
0.2
0.4
0.6
0.8
x
y
CSK constellation
Red Point
Green PointBlue pointCSK Symbols
-0.2 0 0.2 0.4 0.6 0.8-0.2
0
0.2
0.4
0.6
0.8
x
y
CSK constellation
Red Point
Green PointBlue pointCSK Symbols
-0.2 0 0.2 0.4 0.6 0.8-0.2
0
0.2
0.4
0.6
0.8
x
y
CSK constellation
Red Point
Green PointBlue point
CSK Symbols
-0.2 0 0.2 0.4 0.6 0.8-0.2
0
0.2
0.4
0.6
0.8
x
y
CSK constellation
Red Point
Green PointBlue point
CSK Symbols
(1) 4CSK Constellation (2) 8CSK Constellation
(3) 16CSK Constellation (4) 64CSK Constellation
R
B
G
R
B
G
R
B
G
R
B
G
ASDF Thailand Proceedings of the International Congress 2014 [IC 2014], Bangkok, Thailand 152
Int Congress 2014 ISBN : 978-81-929742-3-1 www.intcongress.com

C. Performance
Basic CSK system consists of a transmitter with multi-color LED light sources, and a receiver with a color sensor that has high speed photo detectors with RGB color filters. It is assumed that high speed CSK systems communicate from illuminations, digital signage boards, traffic lights or other light sources with multi-color LEDs, to mobile terminals or other receivers with color sensors. The main feature of this system is its high speed data bit rate. The bit rate of CSK is not limited by the frequency response of the LEDs based on this principle. However, a faster bit rate requires a higher SNR, because the distance between the color points on the x-y coordinates is shorter. Therefore, CSK can expect a faster bit rate within a higher SNR environment. In any case, the CSK data communication of the basic CSK system is unrecognizable to humans. The light in CSK communication is sighted as the center color of the color triangle on the x-y color coordinates.
In experiments, we confirmed that 100Mbps is available using commercial devices with 16CSK at 25MHz symbol rate. Figure 4 shows the received 16CSK signals at 25 MHz symbol rate with 100 Mbps bit rate. Figure 4 (1) is the three colors' signals within the given time domain that are received by the color sensors. Figure 4 (2) is the demodulated color constellations on the x-y color coordinates.
Figure 4. Received 16CSK signals at 100Mbps bit rate. (1) Three filtered color signals on time domain that are received by color sensors.
(2) Demodulated color constellations on x-y color coordinates
III. Proposed CSK Communication System
A. Proposed System
Proposed new CSK communication system consists of a transmitter with a Liquid Crystal Display, Plasma Display, OLED or other color display, and a receiver with a color image sensor, i.e., a digital camera. It is assumed that the CSK systems communicate from TVs, PC displays, digital signage boards, displays on mobile terminals or other color displays, to mobile terminals or other receivers with digital cameras. The main feature of the system is that it can be created by using commercial hardware devices such as smart phones. Another feature of the system is its visibility. The CSK codes displayed as animations on displays are recognizable by humans. Therefore, when a user points a camera towards a CSK code, he or she can acquire the presented information.
CSK is a very suitable communication method from a display to cameras, because it uses visible colors for the communication. However, a high data rate cannot be expected, because the symbol rate is limited by the frame rates of cameras. Generally, the frame rate of common cameras is 30 fps. In this case, the symbol rate of CSK should be 15 Hz when considering it should be two times over sampling. Therefore, the data bit
-0.2 0 0.2 0.4 0.6 0.8-0.2
0
0.2
0.4
0.6
0.8
x
yDemodulated Signal Simbol for CMC with symbol points (datadem)
R position
G position
B positionSymbol position
Demodulated Signal
0 20 40 60 80 100 120 140 160 180 2000
0.5
1Syncronized Signal on Red (A/D A on Slot2)
0 20 40 60 80 100 120 140 160 180 2000
0.5
1Syncronized Signal on Green (A/D A on Slot1)
0 20 40 60 80 100 120 140 160 180 2000
0.5
1Syncronized Signal on Blue (A/D B on Slot1)
(1) Received signals on time domain (2) Demodulated constellation on xy coordinates
Received signal with Red color filter
Received signal with Green color filter
Received signal with Blue color filter
ASDF Thailand Proceedings of the International Congress 2014 [IC 2014], Bangkok, Thailand 153
Int Congress 2014 ISBN : 978-81-929742-3-1 www.intcongress.com

rate would be at most 60 bps when using 16CSK. We present and discuss a method for increasing the bit rate in the following section.
B. Space Division Multiplex for the Proposed System
A color display can display animations of two-dimensional images, and digital cameras can take them. Therefore, we can adopt two-dimensional CSK codes for the communication from displays to cameras. We call the scheme Space Division Multiplex CSK (SDM-CSK). SDM-CSK is very effective for increasing the data bit rate. If we use a 4×4 cell sized CSK code for SDM-CSK, the bit rate increases 16 times compared with normal CSK.
The proposed two-dimensional CSK codes at 16CSK are shown in Figure 5. Each cell of the two-dimensional CSK code in this figure transmits each data sequence. Although the data sequences are independent of each other, the symbol rate is the same. The cameras on the receiver side accept the CSK code in movie mode, recognize it, and demodulate the data in each cell.
C. Color Calibration for the Proposed System
In the proposed CSK system, the color calibration is more important than basic CSK system, because the color characteristics of displays and cameras are complex and dynamic. Therefore, we propose another color calibration method that uses color reference cells. Figure 6 shows a proposed CSK code with reference cells. It is an example for 4CSK-16x16SDM. The top and end of lines of the CSK code are color reference cells. Reference cells include all colors of the CSK color symbols mapped on the x-y color coordinates. The receiver demodulates data cells by comparing the colors with the color reference cells. Because the color reference cells are included in all CSK codes, it is highly effective against dynamic change of the optical environment.
D. Performance Evaluation with Non-Real Time Test System
The non-real time test system consists of a display(32-inch, Full HD) , a camera(4M pixels, 60fps) and a personal computer for de-modulating CSK codes. The display shows CSK test codes repeatedly with 15Hz symbol rate. The performance of the proposed CSK system is affected by various parameters, such as the display refresh rate, display pixel size, camera frame rate, camera pixel size, display-camera distance, CSK color point number, CSK cell number, and the CSK code size. Figure 7 shows the Bit Error Rate (BER) performance along with the display-camera distance and CSK code size without error correction. The CSK cell numbers for SDM are 64×64 with 16CSK, and the CSK cell sizes are 5-20 cm square. The display-camera distance is 1-3 meters. The bit error rate is under 10-6, if the CSK cell size is more than 10×10 cm square of the code size at 1 meter. Therefore, this system is available for 240kbps data transmission using 64×64SDM-16CSK.
Figure 5. Two dimensional CSK code for proposed CSK system.
ASDF Thailand Proceedings of the International Congress 2014 [IC 2014], Bangkok, Thailand 154
Int Congress 2014 ISBN : 978-81-929742-3-1 www.intcongress.com

Figure 6. Two Dimensional CSK code with Color Reference Cells. It is an example for 4CSK-16x16SDM.
Figure 7. BER Performance of Proposed CSK system with 64x64SDM-16CSK at 15Hz symbol rate. Data Rate:240kbps.
E. Real Time Prototype System
The real time prototype system consists of a display(32-inch, Full HD) and a camera(13M pixels, 30fps) on a smart phone(Android). The display shows CSK codes repeatedly with 15Hz symbol rate. The system can send test data for evaluation or some content data such as pictures or sounds for demonstration. Figure 8 shows the prototype system overview. Some CSK codes are displayed, which send different content to each other. When a user points a camera towards a CSK code, he or she can acquire the presented information.
Figure 9 shows the BER performance along with the display-camera distance and CSK code size without error correction. The CSK cell numbers for SDM are 16×16 with 4CSK, and the CSK cell sizes are 3,5,10 cm square. The display-camera distance is 1-3 meters. The BER of 16×16SDM-4CSK is under 10-3, when the CSK cell size is more than 5×5 cm square at 1meter. Although BER performance is lower than the non-real time test system, it is available to communicate for short content data which is displayed repeatedly. Furthermore, we can expect to improve BER performance after error correction. Figure 10 shows captured CSK code by camera and demodulated constellation on x-y color coordinates.
Reference Cells (Upper)
Data Cells (14×16)
Reference Cells (Lower)
1.0E-06
1.0E-05
1.0E-04
1.0E-03
1.0E-02
1.0E-01
1.0E+00
2017.51512.5107.55
Bit E
rror
Rat
e
CSK code size [cm]
1m
2m
3m
ASDF Thailand Proceedings of the International Congress 2014 [IC 2014], Bangkok, Thailand 155
Int Congress 2014 ISBN : 978-81-929742-3-1 www.intcongress.com
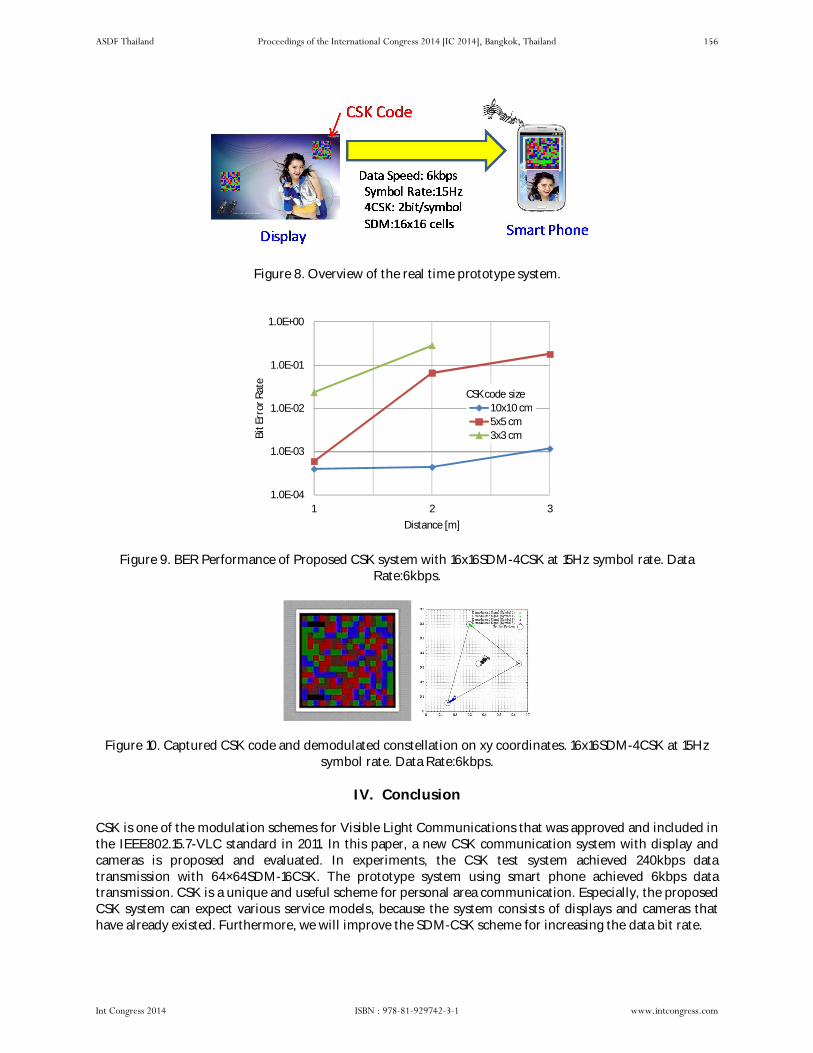
Figure 8. Overview of the real time prototype system.
Figure 9. BER Performance of Proposed CSK system with 16x16SDM-4CSK at 15Hz symbol rate. Data Rate:6kbps.
Figure 10. Captured CSK code and demodulated constellation on xy coordinates. 16x16SDM-4CSK at 15Hz symbol rate. Data Rate:6kbps.
IV. Conclusion
CSK is one of the modulation schemes for Visible Light Communications that was approved and included in the IEEE802.15.7-VLC standard in 2011. In this paper, a new CSK communication system with display and cameras is proposed and evaluated. In experiments, the CSK test system achieved 240kbps data transmission with 64×64SDM-16CSK. The prototype system using smart phone achieved 6kbps data transmission. CSK is a unique and useful scheme for personal area communication. Especially, the proposed CSK system can expect various service models, because the system consists of displays and cameras that have already existed. Furthermore, we will improve the SDM-CSK scheme for increasing the data bit rate.
1.0E-04
1.0E-03
1.0E-02
1.0E-01
1.0E+00
1 2 3
Bit E
rror
Rat
e
Distance [m]
10x10 cm5x5 cm3x3 cm
CSK code size
ASDF Thailand Proceedings of the International Congress 2014 [IC 2014], Bangkok, Thailand 156
Int Congress 2014 ISBN : 978-81-929742-3-1 www.intcongress.com

Acknowledgment
The authors are grateful to their colleagues at Samsung Electronics for their discussions and assistance with this work. The authors also would like to thank the anonymous reviewers whose comments have greatly improved this paper.
References
(1) T. Komine and M. Nakagawa, “Fundamental Analysis for Visible-Light Communication System using LED Lights,” IEEE Transactions on Consumer Electronics, vol. 50, no. 1, pp. 100-107, Feb. 2004.
(2) A. Yokoi, et al., “Color Multiplex Coding for VLC”, in IEEE 802.15.7 contri¬bution 15-08-0743-01, Nov. 2008.
(3) A. Yokoi, et al., “More description about CSK constellation,” in IEEE 802.15.7 contri¬bution 15-10-0724-00-0007, Sep. 2010.
(4) Sridhar Rajagopal, et al., “IEEE 802.15.7 Visible Light Communication: Modulation Schemes and Dimming Support”, IEEE Communications Magazine, Vol.50, N0.3, pp72-82, Mar. 2012.
(5) K. Suzuki, ” Visible Light Communication System for Application to ITS”, TOSHIBA REVIEW ,Vol.61, No.8, pp20-23, 2008.
(6) CIE (1932) Commission internationale de l'Eclairage proceedings, Cambridge University Press, Cambridge, 1931.
ASDF Thailand Proceedings of the International Congress 2014 [IC 2014], Bangkok, Thailand 157
Int Congress 2014 ISBN : 978-81-929742-3-1 www.intcongress.com

Table of Contents
Volume 01 Issue 01 Month November Year 2014
International Congress Full Poster
Titles & Authors Pages
Design and Numerical Analysis into Slop-Climbing Capability of PEMFC Scooter by Jenn-Kun Kuo pp 01
The Comparison of Perceived Stress Type, Resilience and Depression in Male and Female College Students by YoungSuk Park
pp 01
Development of Site Support System based on VIGNSS for Underground Structure Construction Sites by Yonggu, Jang
pp 02
Network Architecture Design of Field Information in USFSS Based on VI-GNSS by Changkyun, Oh pp 02
Raman spectroscopy of ZnS Nanoparticles by Nebojsa Romcevic pp 03
Design of Microbial Fuel Cells using Bimetallic Oxygen Reduction Catalysts by Youngrok Lee pp 03
Computer Simulation of Rotating Anode X-ray Tube with Two-Track Target for Digital Radiography by Seokmoon Lee
pp 04
Development of Microbial Fuel Cells using Polyviologen as a Molecular Wire Applied to the Anode by Jun Hyun Kim
pp 04
Highly Conductive, Flexible, and Stable Ag Nanowire/Carbon Nanotube Hybrid Transparent Electrodes by Plasmonic Welding by Ju Yeon Woo
pp 05
Protect Hosts to Protect Tenants: The Case of Frogs Strictly Living in Their Host Bromeliads by Carlos Frederico Duarte Rocha
pp 05

Design and Numerical Analysis into Slop-Climbing Capability of PEMFC Scooter
Jenn-Kun Kuo
33 Sec. 2, Shu-Lin Street, Tainan City, Taiwan 70005, Taiwan
Abstract
Fuel cell hybrid scooters provide an adequate performance on horizontal road surfaces, but perform less well when climbing slopes. In the present study, the slope-climbing capability of a fuel cell hybrid scooter is examined in simulations. The simulations focus specifically on the effects of the slope inclination angle, riding speed and rider weight on the power consumption, hydrogen consumption, and maximum travel range of the scooter. The validity of the numerical model is confirmed by comparing the numerical results for the power consumption of the scooter with the experimental and analytical results presented in the literature. The simulation results show that the power consumption and hydrogen consumption increase with an increasing slope inclination angle, riding speed and rider weight. Moreover, it is shown that given an initial hydrogen mass of 90 g, a constant riding speed of 40 km h-1, and a rider weight of 60 kg, the maximum travel range reduces from 47 km to 5 km as the slope inclination angle is increased from 0° to 40°. In general, the results presented in this study confirm that the proposed simulation model provides a valid means of characterizing the performance of a fuel cell hybrid scooter under typical urban riding conditions.
The Comparison of Perceived Stress Type, Resilience and Depression in Male and Female
College Students YoungSuk Park
86, Dahakno, Jongno-Gu, Department of Nursing, Korea Open National University Seoul, Seoul Metropolitan 110-791, South Korea
Abstract
Purpose: The purpose of this research was to investigate gender differences in perceived stress type, resilience and depression of college students. Methods: This study was a cross-sectional survey and participants were collected by Perceived Daily Life Stress Scale, Resilience Scale and Beck Depression Scale from May to September, 2012 in South Korea. Data of 213 college students were analyzed by using one-way MANCOVA etc. of the SPSS 21 program. Results: Friend relationship (F=5.29, p=.022), professor relationship (F=8.70, p=.004) and interpersonal dimension (F=4.62, p=.033) among various life stress of female college students were significantly higher compared to male college students. All subcategories of resilience including controllability, positivity and sociality were not different between male and female students. Total score (F=5.41, p=. 021), physiological dimension (F=6.84, p=.010) and severity (χ2=7.97, p=.047) of depression of females were significantly higher than male students. Conclusion: Gender differences of college students were significant in some aspects of perceived stress type and depression. It is needed to focus particularly on perceived stress type and physiological symptoms of depression related to gender differences for early detection and management of depression in college students.
ASDF Thailand Proceedings of the International Congress 2014 [IC 2014], Bangkok, Thailand 1
Int Congress 2014 ISBN : 978-81-929742-3-1 www.intcongress.com

Development of Site Support System based on VI-GNSS for Underground Structure Construction
Sites Yonggu, Jang
(Daehwa-Dong) 283, Goyangdae-Ro ilsanseo-Gu, Goyang-Si 411-712, South Korea
Abstract
Among construction sites, underground structure construction sites have very poor environments due to the presence of much noise, vibration, moisture, dust, etc., because the underground space is characteristically secured through excavation, unlike aboveground spaces. Thus, life-threatening accidents are frequent at underground structure construction sites; and worse, rescue operations are not rapidly implemented.
This paper introduces the development details of a construction site support system based on VI-GNSS (Voice-Integrated Global Navigation Satellite System), which is currently under development, for environment-friendly underground structure constructions sites. It also investigates the study results obtained through the site application tests on an actual long tunnel section. It was confirmed, through previous studies up to date, that the development of the support system for underground structure construction sites have been conducting final step. And applicability verification be performing now.
Network Architecture Design of Field Information in USFSS Based on VI-GNSS
Changkyun, Oh
(Daehwa-Dong) 283, Goyangdae-Ro ilsanseo-Gu, Goyang-Si 411-712, South Korea
Abstract
The utilization of technology integrated with IT technology is in demand for effectiveness of field management together with the prevention and prompt correspondence to safety related accidents at construction site. In addition, the establishment of construction site support system is necessary to implement the securing of worker's safety, smooth work instruction, efficiency in construction, and others.
Data standardization and network architecture regarding data and sound information for data transmission between systems and management were designed to construct integrated VI-GNSS technology based USFSS currently under research. In regards to the data transmission stability among stability test of data for each system constructed through data standardization and network architecture design, the stability of about 98% between workers and transfer vehicle system within underground structure and field server system and about 100% between field server system and control system could be secured. Also, in regards to sound transmission stability test, the reliability of about 99% could be secured with 1km distance as its standard in case of sound transmission to underground structure construction site and field office near the field through wireless FRS system.
ASDF Thailand Proceedings of the International Congress 2014 [IC 2014], Bangkok, Thailand 2
Int Congress 2014 ISBN : 978-81-929742-3-1 www.intcongress.com

Raman spectroscopy of ZnS Nanoparticles Nebojsa Romcevic
Institute of Physics Belgrade, Pregrevica 118 11080 Zemun-Belgrade, Serbia Belgrade, Serbia and Montenegro
Abstract
Cubic ZnS nanoparticles were obtained by high-energy milling. Milling time was 5, 10 and 20 min. Weighted crystallite size ZnS nanoparticles and their separation depend on the milling time. The morphology of samples has been investigated by scanning electron microscopy (SEM), while structural characteristics were obtained by XRD powder technique. The crystallite size was calculated from XRD spectra by application of Scherrer's equation. The weighted crystallite size ZnS nanoparticles was estimated as 1.9 nm (after 5 min milling time), 2.3 nm (10 min) and 2.4 nm (20 min). The optical properties were studied by Raman spectroscopy. Raman scattering spectra were analyzed using a Lorentzian function and deconvolution of the spectra to the individual Lorentzian curves. The dominant structures in our spectra are at about 157, 263 and 345 cm-1. That correspond to the second overtone of TA mode which originate from a zone boundary and TO and LO modes near the zone center, respectively. The theoretical model was used to calculate the relative contribution of the confined Raman scattering modes of the ZnS quantum dots. Satisfactory agreement with experimental results was obtained.
Design of Microbial Fuel Cells using Bimetallic Oxygen Reduction Catalysts
Youngrok Lee
Konkuk Univ., Hwayang-dong, Gwangjin-gu, Seoul,, Seoul, 143-701, South Korea
Abstract
Microbial fuel cells (MFCs) have emerged as a promising yet challenging technology in recent years. In MFCs, microorganisms act as biocatalysts to oxidize organic substances producing electrons which are transferred to the anode and used together with protons to reduce oxygen to water. It is therefore of importance to develop cost effective oxygen reduction catalysts. In this study, we have developed non-platinic bimetallic oxygen reduction catalysts for MFCs. The M-Pd (M=V or Zn) system was synthesized from a mixture of metal salt precursor with a nitrogen-donating compound (N) and carbon nano powder (C) by heat treatment based on thermodynamic principles. Catalyst performance was evaluated by rotating disc and rotating ring disc techniques. The onset potentials of oxygen reduction reaction (ORR) were 0.087 V and 0.146 V for V/Pd/N/C and Zn/Pd/N/C, respectively. This result shows that ORR is more favorable on the bimetallic system than on individual components. From RRDE experiments we calculated the percentage of hydrogen peroxide formation. These bimetallic ORR catalysts have been applied to the cathode of MFCs and enhancement in power density was observed although the best result was obtained with a Pt-incorporated cathode. This work shows the importance of developing bimetallic ORR catalysts as an alternative to Pt and these catalysts could be applied to MFCs for the power enhancement.
ASDF Thailand Proceedings of the International Congress 2014 [IC 2014], Bangkok, Thailand 3
Int Congress 2014 ISBN : 978-81-929742-3-1 www.intcongress.com

Computer Simulation of Rotating Anode X-ray Tube with Two-Track Target for Digital
Radiography Seokmoon Lee
Kumoh National Institute of Technology Green-energy building 201-7 Daehak-ro 61 (Yangho-dong), Gumi, Gyeongbuk 730-701, South Korea
Abstract
We study Rotating Anode X-ray Tube with two-track Target to enhance the reliability of the target. The X-ray Tube is the single most important component of the radiographic system. It is the part that produces the X-rays. The Target is the area of the anode struck by electrons from cathode. The Target is usually made of rhenium-tungsten faced molybdenum to keep the high temperature around 2,500 degree. Because of the low efficiency of the conversion of the electrons' kinetic energy into X radiation, more than 99% of the energy introduced into the X-ray Tube has to be carried off in the form of heat. The problems to be solved are those heat distributions in the anode and of the dissipation of the heat to the surroundings. The Rotating anode is the one of the key solutions. The X-ray Tube has two types of focal spot such as large focal spot and small focal spot so two types of filament are also needed. The Target is the most important component to get a long life of X-ray Tube. So we investigate the two- track Target to increase the Target reliability due to the small focal spot area in the X-ray Tube for Digital Radiography by using Computer Simulation. The result of ANSYS simulation can show that two track Target is better performance compared to single track Target.
Development of Microbial Fuel Cells using Polyviologen as a Molecular Wire Applied to the
Anode Jun Hyun Kim
Department of Bioscience and biotechmology, Kunkuk University Hwayang-dong, Gwangjin-gu, Seoul, Seoul 143-701, South Korea
Abstract
Microbial fuel cells (MFCs) are excellent devices that convert a wide range of organic or inorganic substrates including wastewater to electric energy. Microorganisms functioning as biocatalysts oxidize substrates producing electrons which are transferred to the cathode where they meet oxygen and protons to produce water. The key process in MFCs is the electron transfer process from microorganisms to the anode. Although several mechanisms have been identified, none of them are fast enough to produce high current. The general way to transfer electrons to the anode that can be applied either to exoelectrogens or to non-exoelectrogens needs to be developed so that MFCs could find their application in the real world. Here we present our preliminary results in which electrons produced in an inner membrane of Gram-negative electrochemically inactive bacteria could be effectively transferred to the electrode through polyviologen (PV) which functioned as a molecular wire. PV having six or senven viologen units undergoes very reversible redox reactions whose formal potential is positive enough to take electrons from NADH inside bacteria. PV was synthesized from 4, 4’-dipyridyl and 1,12-dibromododecane and characterized by NMR. When PV was applied to MFCs having Escherichia coli, a large power enhancement was observed, proving that the molecular wire concept also works in MFCs.
ASDF Thailand Proceedings of the International Congress 2014 [IC 2014], Bangkok, Thailand 4
Int Congress 2014 ISBN : 978-81-929742-3-1 www.intcongress.com

Highly Conductive, Flexible, and Stable Ag Nanowire/Carbon Nanotube Hybrid Transparent
Electrodes by Plasmonic Welding Ju Yeon Woo
School of Mechanical Engineering, Korea University Anam-Dong, Seongbuk-Gu, Seoul, Seoul 136713, South Korea
Abstract
Here, we report highly transparent and flexible AgNW/SWCNT hybrid networks on PET substrates combined with plasmonic welding for securing ultrahigh stability in mechanical and electrical properties under severe bending. Plasmonic welding produces local heating and welding at the junction of AgNWs and leads strong adhesion between AgNW and SWCNT as well as between hybrid structure and substrate. The initial sheet resistance of plasmon treated AgNW/SWCNT hybrid film was 26 ohm/square, with > 90 % optical transmittance over the wavelength range 400-2700 nm. Following 200 cycles of convex/concave bending with a bending radius of 5 mm, the sheet resistance changed from 26 to 29 ohm/square. This hybrid structure combined with the plasmonic welding process provided excellent stability, low resistance, high transparency, and suitable for highly flexible electronics applications, including touch panels, solar cells, and OLEDs.
Protect Hosts to Protect Tenants: The Case of Frogs Strictly Living in Their Host Bromeliads
Carlos Frederico Duarte Rocha
Department of Ecology, Institute of Biology, Universidade do Estado do Rio de Janeiro Rua São Francisco Xavier 524, Rio de Janeiro 20550-013, Brazil
Rio de Janeiro, Rio de Janeiro 20550-013, Brazil
Abstract
Amphibians are the vertebrate group with the highest proportion of threatened species worldwide, mainly because of habitat loss, pollution, diseases, and vulnerability of most species due to their high degree of habitat specialization. A large portion of amphibian species in the neotropics are strictly associated with bromeliads and one crucial point needing attention is the mutual relationship between some amphibian species that depend strictly on bromeliads to develop their entire life cycle - the “bromeligenous frogs” and the tank bromeliads inside which they live. Not only frogs benefit from the structural environment of bromeliads for their life cycle but the host bromeliad benefits from nutrients enriched (e.g. nitrogen) frogs’ feces deposited into the bromeliads that are absorbed by the plant. Following the IUCN criteria, in the case of taxa obligatory dependent on other taxa for all or part of their life cycles, biologically appropriate values for the host taxon should be used. In this study we surveyed the 90 known cases of frog species that breed in bromeliads together with their current red list status. Our data show that the loss of bromeliads can be a crucial problem to their conservation. We found that nearly 33.0% of the bromeligenous frogs are currently threatened, while another third are data deficient. These data point out for the relevance of the preservation of this mutual interaction. The conservation of bromeligenous frogs must be carefully considered in terms of the conservation of the relationship between them and their host bromeliad species they depend.
ASDF Thailand Proceedings of the International Congress 2014 [IC 2014], Bangkok, Thailand 5
Int Congress 2014 ISBN : 978-81-929742-3-1 www.intcongress.com

Participate in the International Congress 2016 at
Bangkok, Kingdom of Thailand between 16th
November, 2016 and 18th November, 2016.
Visit www.intcongress.com
Participate in the 5G Summit 2015 at London,
Thailand, Dubai, Kenya, Hong Kong and India.
Visit www.5gsummit2015.com
For more conferences and events visit www.asdf.org.in and become a member to get the digest of
the events across the globe.
Published By
Association of Scientists, Developers and Faculties
India
www.asdf.org.in www.technoforum.co.in [email protected]
Price : $ 200