
International comparisons of public engagement in culture ... · Department for Culture, media and...
38
International comparisons of public engagement in culture and sport Orian Brook, ESRC Placement Fellow August 2011 1
Transcript of International comparisons of public engagement in culture ... · Department for Culture, media and...

International comparisons of public engagement in culture and sport Orian Brook, ESRC Placement Fellow August 2011
1

Department for Culture, media and Sport | International comparisons of public engagement in culture and sport, 2011
Abstract
This report discusses comparative research on public engagement in sport and culture. It summarises the various issues which have impeded the conduct of this research. It then uses recent Eurobarometer, Eurostat and other data which avoid many of these problems to produce some initial findings: cultural attendance and sports participation are both higher than the average for Europe; higher rates of personal fulfilment are found for those that attend all kinds of culture, compared to those that do not; and rates of attendance between countries seem to be related to levels of government spend on culture, even once population differences are controlled for, although improved data and country contextualisation are required to substantiate this.
2

Department for Culture, media and Sport | International comparisons of public engagement in culture and sport, 2011
Contents
Summary .............................................................................................................................................. 4
1.1. Cultural engagement in Europe ................................................................................................ 4
1.2. Sports participation ................................................................................................................. 11
Full Report .......................................................................................................................................... 13
2.1. Background ................................................................................................................... 13
2.2. Cultural engagement in Europe .............................................................................................. 14
2.3. Sports participation ................................................................................................................. 30
Appendix A: Worksheets on cultural engagement. ............................................................................. 36
Appendix B: Contextual data available ............................................................................................... 38
3
Department for Culture, media and Sport | International comparisons of public engagement in culture and sport, 2011
1. Summary
There is a considerable body of literature on the problems with conducting international comparisons in public engagement in culture and sport, (Schuster, 2007; Allin, 2000; Madden, 2004; Cushman et al., 2005). A key problem identified for both kinds of activities was the lack of truly comparable data. The recent release of relevant Eurobarometer surveys, and additional country-level data available from Eurostat and other agencies, has made improved international comparisons possible for European states; the findings presented here should, however, be treated as signposts for further research rather than definitive in themselves, given the lack of qualitative or in-depth contextualisation (see 2.1).
1.1. Cultural engagement in Europe
Cultural engagement, attitudes, values and associations are included in a Eurobarometer survey conducted February to March 2007 (face to face, with a sample size of c1,000 in each state including Great Britain, plus 500 in Northern Ireland – results here are reported for GB). Attendance levels in GB are found to be broadly comparable to those found by Taking Part; participation tends to be higher according to the Eurobarometer survey, but the questions are less specific (see 2.2.1). Key findings of analysis of cultural attendance from this survey include:
1.1.1 Levels of Attendance
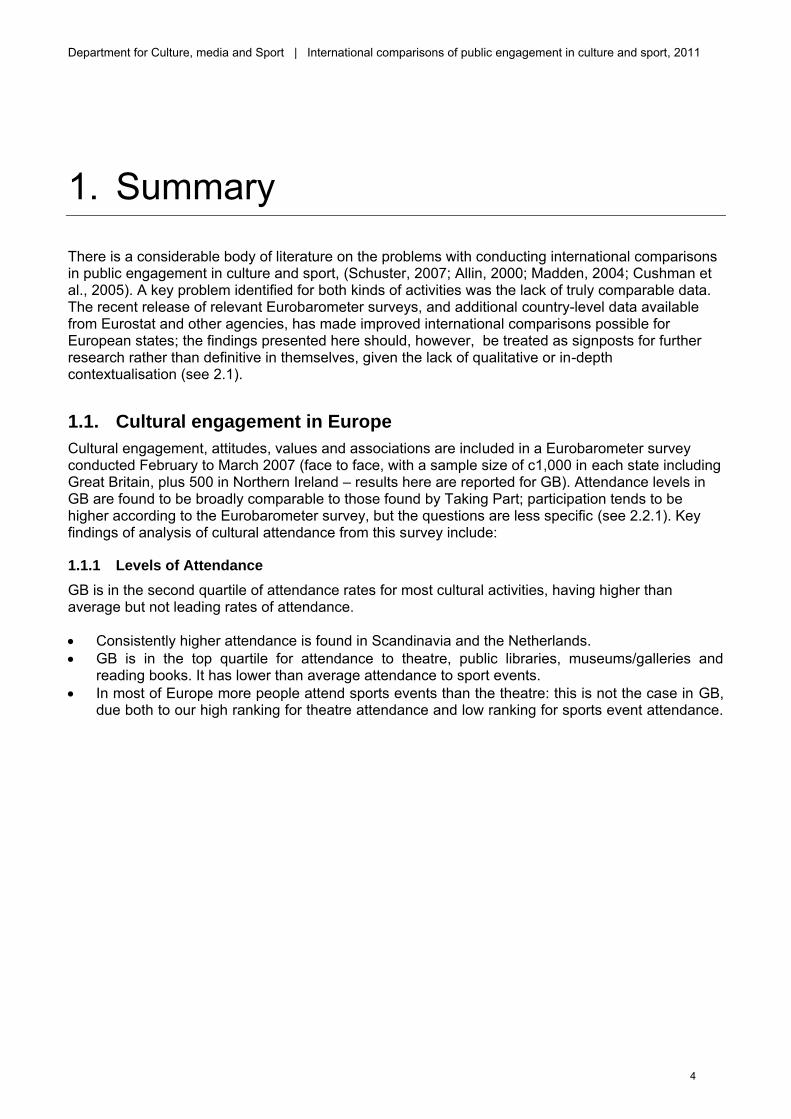
GB is in the second quartile of attendance rates for most cultural activities, having higher than average but not leading rates of attendance.
Consistently higher attendance is found in Scandinavia and the Netherlands. GB is in the top quartile for attendance to theatre, public libraries, museums/galleries and
reading books. It has lower than average attendance to sport events. In most of Europe more people attend sports events than the theatre: this is not the case in GB,
due both to our high ranking for theatre attendance and low ranking for sports event attendance.
4

Department for Culture, media and Sport | International comparisons of public engagement in culture and sport, 2011
Cultural attendance: rank of GB in European countries, compared to % attending in GB
0
10
20
30
40
50
60
70
80
90
100
Public
Librar
y
Read a
Book
Theatre
Museu
m/Gall
ery
Ballet/
Dance
/Ope
ra
Heritage
Cinema
Concert
Via TV/R
adio
Perf Arts Arts
Culture
Sports
Event
% a
tten
din
g
-1
4
9
14
19
24
29
Ran
k
% attendingGB rank (of 33)
Notes Performing arts includes Theatre, Concerts, Ballet/Dance/Opera Arts includes Performing Arts plus Cinema and Museum/Gallery Culture includes Arts plus Public Library, Reading a Book, Heritage and consuming via TV/Radio – but not attending Sports events
Cultural attendance in European countries
Note Representation of former West and East Germany is schematic, not geographically accurate
5

Department for Culture, media and Sport | International comparisons of public engagement in culture and sport, 2011
1.1.2 Factors influencing attendance
For cultural attendance overall, income, type of area (ie rural or urban), sex and national background are less influential on attendance in GB than in Europe on average. Education, occupation and age are more influential (though note that the sample sizes do not support statistically significant comparisons of levels of attendance between subgroups and countries).
Education has below average influence on use of public libraries in GB; all demographic indicators have below average influence on cinema attendance.
When asked about the factors which prevent them from accessing cultural activities, GB respondents score lower than average on all barriers.
“Lack of time” was the most often quoted barrier, both across Europe (44%) and in GB (39%). In GB, “lack of interest” came second, “too expensive” was third – in Europe as a whole these were third and second respectively.
GB respondents are less likely than average to agree that culture is personally important to them. However, there was little correspondence between this answer and levels of cultural attendance in each country.
Personal importance of culture by European country
1.1.3 Compared to contextual data
Country-level contextual data are generated by agencies including Eurostat and the European Audiovisual Observatory, which have been brought together in two reports commissioned by the European Commission (KEA European Affairs, 2006, 2009).
Of particular interest is the comparison with direct public spending on culture, which needs to be treated with caution, as different definitions are used and different time periods covered (KEA European Affairs, 2006, p123-124). Nevertheless, a pattern seems to emerge: levels of public attendance to culture seem to be related to levels of direct government funding. According to this analysis, the UK is estimate to have 5% higher cultural attendance than the European trend would predict. Improved figures on funding, and country-level contextualisation, are required to substantiate this.
6

Department for Culture, media and Sport | International comparisons of public engagement in culture and sport, 2011
Direct government funding for culture per thousand people compared to public attendance to cultural events
Source: Eurobarometer 67.1/KEA 2006 Note The best fit line for direct spend is a logarithmic curve, meaning that increasing spend per head by any given amount has a greater effect if a country‟s current spend is low There is a strong relationship between the number of cinemas in a country and the level of cinema attendance. In this case, GB seems to generate precisely the proportion of adults attending the cinema that would be expected given the number of cinemas: Number of cinemas per thousand people compared to public attendance to cinema
0
10
20
30
40
50
60
70
80
Sweden
Irelan
dSpa
in
France
Denmark
Austria
Czech
Rep
ublic
German
y
Finlan
d
Great B
ritain
Italy
Sloven
ia
Portug
al
Estonia
Belgium
Slovak
ia
Netherl
ands
Poland
Hunga
ry
Lithu
ania
Bulgari
a
Roman
ia
% a
tte
nd
ing
0
2
4
6
8
10
12
14C
ine
ma
s p
er
tho
us
an
d p
op
% attending cinemaCinemas per thousand popLog. (Cinemas per thousand pop)Linear (% attending cinema)
Source: Eurobarometer 67.1/European Audiovisual Observatory
7

Department for Culture, media and Sport | International comparisons of public engagement in culture and sport, 2011 Note The best fit line for direct spend is a logarithmic curve, meaning that increasing spend per head by any given amount has a greater effect if a country‟s current spend is low
Conversely, there is little relationship between levels of cultural attendance, or government spend, and how many people say that culture is personally important to them: Percentage attending any cultural event and percentage respondents saying culture and the arts were personally important to them
30%
40%
50%
60%
70%
80%
90%
100%
Sweden
The N
etherl
ands
Denmark
Finlan
d
Irelan
d
United
King
dom
Czech
Rep
ublic
France
German
y
Austria
Belgium
Slovak
iaLa
tvia
Estonia
Malta
Sloven
iaSpa
inIta
ly
Hunga
ry
Greece
Lithu
ania
Poland
Portug
al
Roman
ia
Bulgari
a
Attended Culture
Culture Personally Important
Linear (Culture Personally Important)
Source: Eurobarometer 67.1/KEA 2006
There is if anything an inverse relationship between levels of attendance and people agreeing that being able to afford to go out is necessary to a decent standard of living:
8

Department for Culture, media and Sport | International comparisons of public engagement in culture and sport, 2011
Agreement that being able to afford to go out at least monthly, including to cultural events, is necessary to a decent standard of living
Source: Eurobarometer 67.1K
A map of the of the levels of agreement with the necessity of going out reveals geographic clustering, with a north vs. south grouping being challenged by Italy and the Baltic states.
Agreement that being able to afford to go out at least monthly, including to cultural events, is necessary to a decent standard of living
Source: Eurobarometer 67.1K
9

Department for Culture, media and Sport | International comparisons of public engagement in culture and sport, 2011
Comparing the levels of those claiming to be fulfilled in their private lives to the levels of those attending culture and the arts, we can see a mild relationship between cultural attendance and a stronger one with arts attendance:
% Fulfilled in private life compared to cultural and arts attendance
Source: Eurobarometer 67.1K We were also able to look at the different levels of personal fulfilment amongst those attending culture compared to those that did not (although, given sample sizes, such comparisons will mostly not be statistically significant for individual countries). Higher levels of personal fulfilment were found among those that attended almost any artform in all countries. The chart below shows, for each country, the difference that attending various cultural activities made to levels of fulfilment. We can see that overall attending a museum or gallery made the most difference – in Bulgaria, attenders had a 50% higher rate of personal fulfilment than non-attenders. In GB, and other countries where personal fulfilment overall was above 80%, personal fulfilment amongst those that attended the arts was typically 5% higher than for those that did not; greater effects were seen in countries with lower levels of personal fulfilment overall.
10

Department for Culture, media and Sport | International comparisons of public engagement in culture and sport, 2011
Index of personal fulfilment amongst arts attenders vs. non-attenders
Source: Analysis based on Eurobarometer 67.1
To conclude, the data seem to suggest that levels of cultural attendance are related to levels of provision rather than attitudes to culture within Europe. By comparison, respondents‟ statements about their barriers to attendance do not have a strong relationship with actual levels of attendance. Attending culture seems to consistently positively impact on levels of personal fulfilment. GB achieves slightly higher levels of attendance than would be expected for the level of government spending. Improved figures on government spending, and further data on other funding for culture, would enable greater confidence in this finding.
1.2. Sports participation
Data enabling international comparisons of public participation in sports are even scarcer than for culture. For the purposes of this project, Eurobarometer Survey 64.3 was used, conducted November-December 2005. It includes questions on levels of physical activity for leisure purposes, and what obstacles respondents faced to being physically active in their leisure time. Eurobarometer 72.3 was subsequently released, containing more specific questions about sports participation, unfortunately too late to be included in this analysis, although headlines will be referred to.
GB respondents are more recreationally active than average: 46% of UK respondents said that they exercise or play sport at least once a week, compared to 40% in Europe (Eurobarometer 72.3).
11

Department for Culture, media and Sport | International comparisons of public engagement in culture and sport, 2011
1.2.1 Factors influencing sports participation
The major motivation for exercise was to improve health, which was even more important in the UK than Europe (65% vs. 61%), as were other health-related reasons including improving fitness and weight control: in addition, having fun and being with friends were also more important motivations for UK respondents compared to the European average (Eurobarometer 72.3).
GB respondents were more likely than average to say that they did not have time to take up local opportunities to be physically active (77% vs. 66%) (Eurobarometer 64.3).
Almost no contextual data were available relating to sport. We compared the percentage of compulsory school hours (primary and secondary) spent on sports with levels of sports participation, but any relationship was very weak.
12

Department for Culture, media and Sport | International comparisons of public engagement in culture and sport, 2011
2. Full Report
2.1. Background
There is a considerable body of literature on the problems with conducting international comparisons in public engagement1 in culture and sport. These concerns have been expressed in both policy and academic circles, including by UNESCO, the Office for National Statistics and the International Federation of Arts Councils and Culture Agencies (Allin, 2000; Madden, 2004; Lievesley, 2000). The most comprehensive summary of issues directly relating to international comparisons of public attendance (as opposed to economic impact and other cultural indicators) was authored by the late academic J Mark Schuster (2007), who tabulates the attendance studies available internationally at that date, alongside considering the arguments against using this comparison.
The issues identified centre on the true comparability of the data, which include but are not limited to differences in: the scope and purpose of the research; populations, especially the lower and upper age limits; methodologies; ways in which cultural activities are categorised and defined; and socio-demographic definitions. These problems are of course more severe in surveys which were not designed to be comparable, but issues also exist in comparative surveys such as Eurobarometer, including inaccuracies in translations; local habits in survey methodology overcoming internationally-agreed methodologies; whether the same term is understood identically in different contexts; and whether there are other cultural differences, for example in social desirability bias, affecting responses (Jowell, 1998). In short, the challenge is to be confident that any international differences in participation are due to actual differences in the population rather than measurement error.
The problem is even more pronounced in sport, where until recently only parallel comparisons have been available, with no comparative surveys carried out at all (Cushman et al., 2005).
It should be acknowledged, however, that there are many involved in comparative research that use cross-national surveys, and even separate surveys in parallel, with no such concerns or caveats, for example Ultee et al. (1993), and there is of course much policy (and academic) research published on the basis of these imperfect data sources.
It was agreed that that this report should take a pragmatic approach and identify the international comparisons which might most appropriately be made. This should be achieved by using only the most comparable data; by using contextual data; and by treating the findings as signposts for further research rather than definitive in themselves, given the lack of qualitative or in-depth exploration of the detailed circumstances in each country.
1 „Engagement‟ here is used to refer to any cultural or sporting activity or attitudes. „Attendance‟ is used for the consumption of culture or sport (which some might characterise as passive); „participation‟ for actually “doing” culture or sport. This is adopted from terminology used elsewhere, especially in the Taking Part survey. However, terms are not necessarily used identically in either the reports or the surveys referred to: many refer to participation when they are exclusively discussing attendance.
13
Department for Culture, media and Sport | International comparisons of public engagement in culture and sport, 2011
2.2. Cultural engagement in Europe
2.2.1. Data on cultural engagement
Cultural engagement, attitudes, values and associations are included in Eurobarometer survey 67.12. The population is residents aged 15 plus of the member states, using a multi-stage, random (probability) sampling. Sampling points in each country are drawn with probability proportional to population size and population density: they thus represent the whole territory of the countries surveyed, and the distribution of the population in terms of metropolitan, urban and rural areas (Eurobarometer 67.1, 2007). The results are post re-weighted according to educational attainment levels (by age, gender and region) (Skaliotis, 2002, p19).
Comparing attendance levels in GB according to Eurobarometer to those found in England by the Taking Part survey across a range of artforms, attendance is either very similar (within 1% for Cinema and Heritage) or higher according to Eurobarometer (the greatest difference being for attendance to Dance or Opera, 20% vs. 12%). Cumulatively results are similar: for all Performing Arts, for example, attendance is 58% according to Eurobarometer and 54% according to Taking Part.
There is some thought that Eurobarometer systematically over-estimates results due to the way that it handles non-response, apparently oversampling younger and more educated respondents (Morrone, 2006, p11). However this is not borne out by the comparison with Taking Part, as differences are not more pronounced for artforms to which attendance is more affected by age or education. Another possible explanation is that the Eurobarometer survey is both much shorter and covers a wider range of topics, which will affect non-response bias. Estimates of attendance levels from Taking Part had also been found to be lower than those found by the ONS Omnibus Survey (ACE, 2007).
However, there is a much greater difference in the levels of participation identified by Eurobarometer compared to Taking Part. For this type of activity, Eurobarometer‟s questions were more openly phrased, both in including activities done through school or college, and in the description of the activity. For example:
I am going to read out a list of artistic activities. Please tell me if, in the last twelve months, you have either on your own or as a part of an organised group or classes…? (not in a professional way – amateur activities)
Sung
compared to Taking Part‟s
In the last 12 months, have you done any of these activities? Remember don’t include paid work, school or academic activities.
Sang to an audience or rehearsed for a performance.
For this reason, participation was analysed in brief but not prioritised for further analysis.
A range of questions on cultural engagement were analysed and cross-tabulated with demographic variables. Only the headline findings are presented here. For a summary of the analyses available see Appendix A.
2.2.2. Levels of Attendance
GB is in the second quartile of attendance rates for most cultural activities, having higher than average but not leading rates of attendance.
2 Conducted face-to-face February to March 2007, with a total sample size of 27,466 (c1,000 per country, UK is sampled for Great Britain and Northern Ireland separately, with the latter having a sample of 500)
14

Department for Culture, media and Sport | International comparisons of public engagement in culture and sport, 2011
Consistently higher rates of attendance are found in Scandinavian countries and the Netherlands. GB is in the top quartile for attendance to theatre, public libraries, museums/galleries, reading
books GB is below average in attendance at concerts, sports events, and consuming culture via
TV/Radio, but these differences are not statistically significant More people in GB attend the theatre than sports events: while the difference is not statistically
significant, in all other countries except for Estonia and the Netherlands the order is reversed, and differences are significant. This is due to GB‟s high ranking for theatre attendance and low ranking for sports event attendance.
More people also attend museums and galleries than sports events, which is also the case in 11 other countries.
Cultural attendance: rank of GB in European countries, compared to % attending
0
10
20
30
40
50
60
70
80
90
100
Public
Librar
y
Read a
Book
Theatre
Museu
m/Gall
ery
Ballet/
Dance
/Ope
ra
Heritage
Cinema
Concert
Via TV/R
adio
Perf Arts Arts
Culture
Sports
Event
% a
tten
din
g
-1
4
9
14
19
24
29
Ran
k
% attendingGB rank (of 33)
Notes Performing arts includes Theatre, Concerts, Ballet/Dance/Opera Arts includes Performing Arts plus Cinema and Museum/Gallery Culture includes Arts plus Public Library, Reading a Book, Heritage and consuming via TV/Radio – but not attending Sports events
15

Department for Culture, media and Sport | International comparisons of public engagement in culture and sport, 2011
Cultural attendance in European countries
Source: Eurobarometer 67.1
2.2.3. Factors influencing attendance
Demography and socio-economic status
It is simple to compare the attendance levels of different demographic groups in each country, to see what kind of gradient varying levels of education, for example, produces, or how attendance among the mostly highly-educated in each country compares. However, such an analysis would not allow easy comparison of the gradient caused by each socio-demographic variable, nor would it allow for structural differences in each country. For example, in Denmark 62% of respondents completed full time education aged 20+, compared to 11% in Portugal. Moreover, such comparisons would not by and large be statistically significant, given the sample size for each country.
A stratification index was therefore devised, which measures by how much the rate of attendance varies between demographic groups, combined with how large each group is: in essence, a measure of how much inequality in this type of attendance there is in society according to each socio-demographic factor. This is calculated by multiplying the square of the difference between the rate of attendance for each demographic group and the rate for that country overall, summed for all demographic groups and taking the square root.
The socio-demographic variables analysed for this project were: age when completed full time education; gender; age; current occupation; perceived relative income (respondents were asked the lowest income they would need to make ends meet, then how their own income compared to this, much higher to much lower); place (rural/village, small-medium town or large town); where respondents were born, and where their parents were born. See Appendix A.for a full list of analyses available and further explanation of the stratification indices.
In presenting separate analyses of different socio-demographic variables it must be noted that these factors will interact, so that major differences found for, for example, different occupational groups, might be found in a multivariate model to be statistically insignificant once years of education was controlled for. Furthermore, some variables (for example, years of education) may reflect procedural differences between countries rather than variances in the final education levels of the population. In
16

Department for Culture, media and Sport | International comparisons of public engagement in culture and sport, 2011
particular, it is difficult to generalise about the effect of national background, because immigrants from one region to for example Estonia might be very different from immigrants from the same region to Belgium or the UK.
Headline findings for socio-demographic influences on attendance were:
Attendance at cultural events in general was more influenced in GB by terminal education, occupation and age compared to Europe on average. Unlike in sport, we do not see a relationship between high levels of socio-demographic stratification and low levels of attendance (ie countries with high levels of attendance overall display no less inequality in who is attending).
For education in particular, GB had above average stratification for most types of cultural event, including sports events. Cinema and public libraries were the exception, where educational stratification of attendance was lower in GB than average. Educational stratification was most pronounced in the performing arts:
Performing arts attendance: stratification by terminal education compared to % attending
0
10
20
30
40
50
60
70
80
90
MALTA
POLAND
GERMANY WEST
LITUANIA
PORTUGAL
AUSTRIA
BULGARIA
GERMANY EAST
CYPRUS
GREAT BRITAIN
BELGIU
M
SWEDEN
SLOVENIA
ESTONIATota
l
SLOVAKIA
LUXEMBOURG
NETHERLANDS
IRELA
NDITALY
GREECE
DENMARK
NORTHERN IRELA
ND
FINLA
NDSPAIN
FRANCE
LATVIA
HUNGARY
ROMANIA
CZECH REPUBLIC
Education stratification index% Attending Performing Arts
Source: Eurobarometer 67.1
Income, type of area (ie rural or urban), sex and national background make less of a difference in GB compared to Europe as a whole.
Use of cinemas is less influenced than average by any demographic indicator. Income and education is more influential on attendance to sports events while occupation, age,
national background and sex are less influential
Motivational/perceptual factors
Eurobarometer asks respondents what factors make it difficult for them to access culture or take part in cultural activities:
GB respondents score lower than average on all barriers.
17

Department for Culture, media and Sport | International comparisons of public engagement in culture and sport, 2011
Lack of time was the most often quoted barrier, both across Europe and in GB (44% and 39%). In GB, lack of interest came second, too expensive was third – in Europe as a whole these were reversed.
Sometimes people find it difficult to access culture or take part in cultural activities. Which of the following, if any, are the main barriers for you? (selected countries)
0%
10%
20%
30%
40%
50%
60%
Lack Of Time Too Expensive Lack Of Interest Limited Choice/Poor
Quality Of Culture In
Area
Lack Of Information Lack Of
Knowledge/Cultural
Background
None
TotalGreat BritainNorthern IrelandIrelandNetherlandsDenmarkFrancePolandGermany WestItalySpainSweden
Source: Eurobarometer 67.1
Eurobarometer 67.1 also asks respondents how personally important culture is to them.
GB respondents are less likely than average to agree that culture is personally important to them. However, there was little correspondence between this answer and levels of cultural attendance.
18

Department for Culture, media and Sport | International comparisons of public engagement in culture and sport, 2011
Personal importance of culture by European country
Source: Eurobarometer 67.1
Respondents were asked a free response question “please tell me what comes to mind when you think about the word “culture”, the responses to which were coded to various categories. This analysis is of course subject to much interpretation of the respondents‟ words, and the distinctions between the codes used are not always clear.
GB respondents were among the least likely to mention the performing and visual arts, museums or literature, and among the most likely to mention values, beliefs, customs and languages.
Please tell me what comes to mind when you think of the word “culture”? Please tell me what comes to mind when you think about the word “culture“.
0%
10%
20%
30%
40%
50%
60%
70%
80%
Civilization(Western,Asian Etc)
History Knowledge,Science
(Research)
Education,Family
(Upbringing)
Values,Beliefs
Customs,Languages,
Communities
Lifestyle,Manners
Leisure,Sports, Fun
Arts(Performing& Visual)
Literature Museums
Great BritainIrelandNetherlandsDenmarkSwedenFranceTotal
Source: Eurobarometer 67.1
19
Department for Culture, media and Sport | International comparisons of public engagement in culture and sport, 2011
These are complex data which might benefit from factor analysis or latent class modelling, as well as more detailed cultural contextualisation for each country.
2.2.4. Compared to contextual data
There are various categories of contextual data generated by agencies including Eurostat and the European Audiovisual Observatory, which have been brought together in two reports commissioned by the European Commission (KEA European Affairs, 2006, 2009).
Of particular interest is the comparison of direct public spending on culture, a conservative estimate for which was made by Michael Söndermann of the Eurostat Task Force on Cultural Statistics using data provided by Eurostat, the Council of Europe‟s Compendium for Cultural Policies and European statistical offices and cultural ministries. These data should be treated with caution: different government departments are included; national and local funding can be difficult to separate; and different years are provided (KEA European Affairs, 2006, p123-124). The table with explanatory notes is reproduced below (Table 1).
20

Department for Culture, media and Sport | International comparisons of public engagement in culture and sport, 2011
Table 1: Direct funding of culture in Europe
Country Direct public expenditure (millions)
Year
Austria € 1,890 2002
Belgium € 3,000 20021,2
** and ***)
Bulgaria € 66 2004
Czech Republic € 654 2004
Denmark € 1,480 2002
Estonia € 86 20053,4
Finland € 745 20015
France € 8,444 2002
Germany € 8,000 2004
Greece € 300 20053
Hungary € 445 2003
Iceland € 199 2001
Ireland € 124 20063
Italy € 1,860 20063
Latvia € 135 20041
Liechtenstein € 13 19993
Lithuania € 96 2003
Malta € 9 2004
Norway € 2,000 20041,6
Poland € 1,000 2004
Portugal € 632 2003
Romania € 302 2003
Slovakia € 121 20063
Slovenia € 194 2003
Spain € 5,100 19992
Sweden € 1,880 20021,2
The Netherlands € 3,000 2003
United Kingdom € 5,100 2004/056
Notes (1) Including license fees for public broadcasting systems (radio and TV). (2) Including sports. (3) Excluding local authorities' cultural expenditure. (4) Excluding Cultural Endowment. (5) Including financing from the state monopoly on lotto, lottery and sports. (6) Excluding National Lottery grants
Source: Kea European Affairs (2006, p123-124).
It is instructive to compare the spend per person in each country to the level of attendance: for this a special definition of cultural attendance was created which includes only those categories of culture which are in receipt of the majority of funding included in the direct spend figures above: attending Sports Event Cinema or Public Library, Reading a Book and consumption via TV/Radio are excluded. The attendance period (Feb/Mar 2006-2007) does not match the spend years, although some lag in effect of spending might be anticipated.
Notwithstanding these caveats, levels of public attendance to culture seem to be related to levels of government spend: the correlation at a country level between attendance and the log of funding is 0.72, meaning that 52% of variation in attendance is potentially explained by levels of funding. Moreover, GB has 5% higher cultural attendance than the European trend would predict (significant at 99% confidence).
Direct government funding for culture per thousand people compared to public attendance to cultural events
21

Department for Culture, media and Sport | International comparisons of public engagement in culture and sport, 2011
Source: Eurobarometer 67.1/KEA 2006 Note The best fit line for direct spend is a logarithmic curve, meaning that increasing spend per head by any given amount has a greater effect if a country‟s current spend is low
Unsurprisingly, there is also a strong relationship between the number of cinemas in a country and the level of cinema attendance. The correlation between cinema attendance and the log of the number of cinemas per thousand population is 0.915, suggesting that 83.7% of cinema attendance is explained by cinema availability, or conversely that the supply of cinemas in each country very closely matches demand.
In this case, Great Britain seems to generate precisely the proportion of adults attending the cinema that would be expected given the number of cinemas:
22

Department for Culture, media and Sport | International comparisons of public engagement in culture and sport, 2011
Number of cinemas per thousand people compared to public attendance to cinema
0
10
20
30
40
50
60
70
80
Sweden
Irelan
dSpa
in
France
Denmark
Austria
Czech
Rep
ublic
German
y
Finlan
d
Great B
ritain
Italy
Sloven
ia
Portug
al
Estonia
Belgium
Slovak
ia
Netherl
ands
Poland
Hunga
ry
Lithu
ania
Bulgari
a
Roman
ia
% a
tte
nd
ing
0
2
4
6
8
10
12
14
Cin
em
as
pe
r th
ou
sa
nd
po
p
% attending cinemaCinemas per thousand popLog. (Cinemas per thousand pop)Linear (% attending cinema)
Source: Eurobarometer 67.1/ European Audiovisual Observatory
Note
The best fit line for cinemas per thousand population is a logarithmic curve, meaning that increasing the number of cinemas by any given amount has a greater effect if a country‟s current number is low
Conversely, there is little relationship between how much each country spends on culture and how many respondents say that culture is personally important to them:
23

Department for Culture, media and Sport | International comparisons of public engagement in culture and sport, 2011
Direct government funding for culture per thousand people compared to percentage respondents saying culture and the arts were personally important to them
€ 0
€ 50
€ 100
€ 150
€ 200
€ 250
€ 300
Belgium
Denmark
Austria
Sweden
The N
etherl
ands
Finlan
d
France
Spain
German
y
Sloven
ia
United
King
dom
Estonia
Czech
Rep
ublic
Portug
al
Latvi
a
Hunga
ryIta
ly
Irelan
d
Lithu
ania
Greece
Poland
Slovak
iaMalt
a
Roman
ia
Bulgari
a
50%
55%
60%
65%
70%
75%
80%
85%
90%
95%
Direct Spend/1,000 people
Culture Personally Important
Source: Eurobarometer 67.1/KEA 2006
There is if anything an inverse relationship between levels of attendance and people agreeing that being able to afford to go out is necessary to a decent standard of living:
24

Department for Culture, media and Sport | International comparisons of public engagement in culture and sport, 2011
Agreement that being able to afford to go out at least monthly, including to cultural events, is necessary to a decent standard of living
Source: Eurobarometer 67.1
A map of the of the levels of agreement with the necessity of going out reveals geographic clustering, with a north vs. south grouping being challenged by Italy and the Baltic states.
25

Department for Culture, media and Sport | International comparisons of public engagement in culture and sport, 2011
Source: Eurobarometer 67.1
Higher levels of personal fulfilment were found among those that attended almost any artform in all countries.
The chart below shows for each country, in pink, the overall percentage of people who said that they were personally fulfilled (measured on the right hand axis) and in the other colours, the difference that attending various cultural activities made to levels of fulfilment. We can see that overall attending a museum or gallery made the most difference – in Bulgaria, attenders had a 50% higher rate of personal fulfilment than non-attenders.
In GB, and other countries where personal fulfilment overall was above 80%, levels of personal fulfilment among those that attended the arts were typically 5% higher than for those that did not; greater effects were seen in countries with lower levels of personal fulfilment overall.
However, care should be taken with these figures that personal fulfilment may be correlated with other variables that predict arts attendance: a multivariate analysis would be preferred to explore the issue in more detail.
26

Department for Culture, media and Sport | International comparisons of public engagement in culture and sport, 2011
Index of personal fulfilment amongst arts attenders vs. non-attenders compared to levels of personal fulfilment overall
90%
100%
110%
120%
130%
140%
150%
160%
Denmark
Sweden
Finlan
d
Netherl
ands
Northe
rn Ire
lend
German
y Wes
tMalt
aSpa
in
BelgiumFran
ce
Luxe
mburg
Great B
ritain
Irelan
d
Sloven
ia
Austria
Czech
Rep
ublic
PolandIta
ly
German
y Eas
tTota
l
Slovak
ia
Estonia
Cyprus
Greece
Hunga
ry
Lithu
aniaLa
tvia
Portug
al
Roman
ia
Bulgari
a
Inde
x
30%
40%
50%
60%
70%
80%
90%
100%
% fu
lfille
d
Attending ArtsAttending HeritageAttending museum/galleryReading a book% Fulfilled
Source: Analysis based on Eurobarometer 67.1
Other types of available contextual data are listed in Appendix B: Contextual data available
To conclude, the data seem to suggest that levels of cultural attendance are related to levels of provision rather than attitudes to culture within Europe, and that GB achieves slightly higher levels of attendance than that which would be expected for the level of government spending. Care should be taken with this finding as the attributes of a country that leads it to subsidise culture may be correlated with those that lead to higher levels of attendance. Improved figures on government spending, and further data on other funding for culture, and a multivariate analysis, would enable greater confidence in this finding.
2.2.5. Multivariate modelling
While the Eurobarometer data would lend itself to multilevel modelling to better understand predictors of attendance and how they vary between countries, this was beyond the scope (and not the focus) of this project. However, a simple multivariate model is capable of enabling the calculation of a “country effect” which has the advantage of controlling for socio-demographic differences between countries.
A simple logistic regression was run at the respondent level, with having attended subsidised culture (as defined above) as the outcome. First of all, the coefficients for socio-demographic variables are presented. Reference categories were chosen as the most prevalent: retired women, with finishing education aged 16-19, on relatively lower income than they would wish, living in a rural or village setting. Odds Ratios were calculated to aid interpretation of the coefficients: for example, holding all other variables constant, a woman in the reference category would only be 70% as likely to attend subsidised culture if she were a man in the same circumstances.
27

Department for Culture, media and Sport | International comparisons of public engagement in culture and sport, 2011
Table 2: Logistic regression, having attended subsidised culture
Age completed education
Up to 15 - 0.645 0.040 - 16.26 - 52%
16-19 100% 20+ 0.767 0.045 16.98 - 215% Still Studying (dropped due to collinearity) No FT education - 1.274 0.172 - 7.39 - 28% DK - 0.289 0.129 - 2.24 0.025 75%
Sex Male - 0.301 0.032 - 9.34 - 74% Female 100%
Age Age - 0.011 0.001 - 8.00 - 99% Occupation Self-Employed 0.479 0.074 6.50 - 161%
Managers 1.157 0.083 13.87 - 318% Other white collars 0.675 0.070 9.61 - 196% Manual workers 0.142 0.054 2.63 0.009 115% House person - 0.099 0.062 - 1.60 0.110 91% Unemployed - 0.235 0.073 - 3.22 0.001 79% Retired 100% Students 1.400 0.101 13.79 - 406%
Income (compared to amount required for decent standard of living)
Much higher 0.495 0.102 4.87 - 164% Higher 0.463 0.050 9.31 - 159% More or less the same 0.153 0.044 3.50 - 117% Lower 100% Much lower - 0.416 0.046 - 9.11 - 66% DK 0.041 0.060 0.69 0.492 104%
Rural/Urban Rural/village 100% S/M Town 0.223 0.036 6.22 - 125% Large town 0.350 0.041 8.57 - 142% DK 0.116 0.262 0.44 0.658 112%
Constant 1.508 0.131 11.54 -
While these results are not intended to be a definitive model for socio-demographic predictors of attendance, the direction and relative strength of relationships are in reasonable agreement with Taking Part: education and occupational group are highly influential, income, age and sex less so. National background of the respondent or their parents is omitted from the model due to its highly variable effects in different countries.
Having controlled for these population variables, we can look at the country effect. In this case, GB was chosen as the reference category, and the results are again shown as Odds Ratios for attending subsidised culture. In this case, the same category of person living in the Netherlands instead of GB appears to be more than 50% more likely to attend subsidised culture, whereas living in France or Italy they are about half as likely to attend. Note that the country effects for the Denmark, Finland, Czech Republic and Latvia are not significant at 95% confidence, so it appears that their (higher) levels of attendance are largely explained by population differences compared to GB.
28

Department for Culture, media and Sport | International comparisons of public engagement in culture and sport, 2011
Table 3: Odd Ratios for attending subsidised culture in each country compared to GB
Coef. Std. z P>|z| OR
Sweden 0.561 0.138 4.08 - 175% Netherlands 0.429 0.131 3.27 0.001 154% Luxembourg 0.301 0.154 1.96 0.050 135% Denmark 0.211 0.134 1.58 0.115 123%
Czech Republic 0.087 0.118 0.73 0.463 109%
Finland 0.050 0.120 0.42 0.676 105%
Germany East 0.020 0.138 0.15 0.884 102%
Latvia 0.013 0.119 0.11 0.911 101%
Great Britain 100% Estonia - 0.129 0.116 - 1.11 0.268 88%
Germany West - 0.201 0.113 - 1.78 0.075 82%
Slovenia - 0.236 0.113 - 2.10 0.036 79% Slovakia - 0.247 0.111 - 2.22 0.026 78% Northern Ireland - 0.323 0.159 - 2.03 0.042 72% Ireland - 0.455 0.112 - 4.04 - 63% Austria - 0.506 0.110 - 4.62 - 60% Malta - 0.512 0.131 - 3.90 - 60% Hungary - 0.541 0.110 - 4.92 - 58% Lithuania - 0.547 0.113 - 4.84 - 58% Belgium - 0.561 0.111 - 5.07 - 57% Spain - 0.609 0.110 - 5.54 - 54% France - 0.680 0.109 - 6.21 - 51% Italy - 0.706 0.110 - 6.42 - 49% Poland - 1.080 0.109 - 9.88 - 34% Cyprus (Republic) - 1.174 0.130 - 9.03 - 31% Portugal - 1.186 0.109 - 10.91 - 31% Romania - 1.249 0.111 - 11.28 - 29% Bulgaria - 1.328 0.110 - 12.10 - 26% Greece - 1.357 0.110 - 12.33 - 26%
It is also possible to compare these results to the direct spend on culture in each country:
29

Department for Culture, media and Sport | International comparisons of public engagement in culture and sport, 2011
Odds Ratios for attending subsidised culture in each country compared to GB, with spend per head
With this multivariate approach, the explanatory power of each country‟s spend per head is reduced once some population characteristics are controlled for. Nevertheless, there is a moderate positive relationship between rates of attendance in different countries and spend on culture, with a correlation of 0.598. There are some dramatic departures from the trend in Denmark, Belgium and Austria in particular. Again, GB seems to be achieving attendance above what would be anticipated by the level of funding, once population differences are controlled for.
Again, it should be emphasised that this modelling is preliminary, more detailed contextualisation, better spend data and further modelling work should be done for robust results.
2.3. Sports participation
Data enabling international comparisons of public participation in sports are even scarcer than for culture. For the purposes of this project, Eurobarometer Survey 64.3 was used, conducted November-December 2005. It includes questions on levels of physical activity for leisure purposes, and what obstacles respondents faced to being physically active in their leisure time. Eurobarometer 72.3 has subsequently been released, which contains more specific questions about sports participation, unfortunately too late to be included in this analysis, although headlines will be referred to.
Headline findings for those participating in sport are:
GB respondents are more recreationally active than average in Europe: 46% of UK respondents said that they exercise or play sport at least once a week, compared to 40% in Europe (Eurobarometer 72.3).
30

Department for Culture, media and Sport | International comparisons of public engagement in culture and sport, 2011
In the last 7 days, how much physical activity did you get from recreation, sport and leisure time activities?
In the last 7 days, how much physical activity did you get from recreation, sport
and leisure time activites?
0% 10% 20% 30% 40% 50% 60% 70% 80% 90% 100%
Finland
The Netherlands
Germany East
Germany West
Lithuania
Ireland
Luxembourg
Sweden
Austria
France
Belgium
Great Britain
Denmark
Hungary
Total
Slovenia
Spain
Cyprus (Republic)
Northern Ireland
Czech Republic
Estonia
Malta
Poland
Cyprus (TCC)
Italy
Slovakia
Latvia
Bulgaria
Portugal
Turkey
Croatia
Romania
Greece
A lotSomeLittleNone
Source: Eurobarometer 64.3
In the UK 73% also said that they engaged in physical activity outside sport (eg dancing, walking, gardening, cycling) at least once a week, compared to 65% in Europe (Eurobarometer 72.3).
31

Department for Culture, media and Sport | International comparisons of public engagement in culture and sport, 2011
2.3.1. Factors influencing sports participation
Most socio-demographic factors including age, sex, marital status, occupation and education are less influential on whether or not people participate in sport in GB compared to Europe a whole. A logistic model predicting attendance by age of terminal education for GB explained only 2.3% of variance, whereas a model for all other countries explained 6.2%
There is a clear association between higher levels of participation in sport and lower levels of demographic influence on participation, by country, ie the more people do sport, the less participation is influenced by demographic factors. This relationship was not found within cultural domains. This is illustrated below using stratification according to terminal age of education: graphs of the other stratification indices are similar, although GB is particularly below average here.
Sports participation: stratification by terminal education compared to % attending
-
10.0
20.0
30.0
40.0
50.0
60.0
70.0
80.0
90.0
Greece
Roman
ia
Portug
al
Turkey
Estonia
Hunga
ryLa
tvia
Poland
Northe
rn Ire
land
Croatia
Cyprus
(Rep
ublic)
Sloven
ia
Bulgari
a
Slovak
iaMalt
aTota
l
Cyprus
(TCC)
Czech
Rep
ublicIta
lySpa
in
France
Luxe
mbourg
BelgiumIre
land
German
y Eas
t
German
y Wes
t
Austria
Great B
ritain
Denmark
Finlan
d
Lithu
ania
Sweden
The N
etherl
ands
0%
10%
20%
30%
40%
50%
60%
70%
Education StratificationActive leisureLinear (Active leisure)
It is evident also that in relation to GB‟s lower than expected levels of stratification on terminal education, the percentage of people participating in sport in GB is lower than the trend would predict. This is also true of most of the other demographic variables.
The major motivation for exercise was to improve health, which was even more important in the UK than Europe (65% vs 61%), as were other health-related reasons including improving fitness and weight control: however, having fun and being with friends were also more important motivations for UK respondents compared to the European average (Eurobarometer 72.3).
When asked whether there were opportunities locally to be active, UK respondents were slightly less likely than average to agree (72% vs 75%), but they were also more likely to disagree that their Local Authority didn‟t do enough for its citizens in relation to physical activity – and both percentages have improved slightly since 2005 (Eurobarometer 72.3). However, none of these findings are significant at 95%.
GB respondents were more likely than average to say that they did not have time to take up local opportunities to be physically active (77% vs 66%) (Eurobarometer 64.3).
32

Department for Culture, media and Sport | International comparisons of public engagement in culture and sport, 2011
There are opportunities to be physically active in my area, but I don't have time to take advantage of them
There are opportunities to be physically active in my area, but I don't have time
to take advantage of them
0% 10% 20% 30% 40% 50% 60% 70% 80% 90% 100%
Denmark
The Netherlands
France
Germany West
Belgium
Luxembourg
Austria
Finland
Sweden
Ireland
Great Britain
Germany East
Spain
Northern Ireland
Slovenia
Total
Malta
Italy
Estonia
Greece
Czech Republic
Latvia
Cyprus (Republic)
Hungary
Portugal
Croatia
Lithuania
Slovakia
Poland
Romania
Cyprus (TCC)
Turkey
Bulgaria
Strongly agreeTend to agreeTend to disagreeStrongly disagree
33

Department for Culture, media and Sport | International comparisons of public engagement in culture and sport, 2011
Almost no contextual data relating to sport could be discovered. We were able to compare the percentage of compulsory school hours (primary and secondary) spent on sports with levels of sports participation, but any relationship was very weak.
34

Department for Culture, media and Sport | International comparisons of public engagement in culture and sport, 2011
References
Arts Council England. 2007. Final Report on PSA Target 2 on the take-up of cultural opportunities by people aged 20 and over from priority groups.
Allin, P. 2000. The development of comparable European cultural statistics. Cultural Trends 10 (37):65 - 75.
Cushman, G., A. Veal, and J. Zuzanek. 2005. Free time and leisure participation: international perspectives: CABI.
Eurobarometer 67.1. 2007. European Cultural Values: The European Commission.
Jowell, R. 1998. How Comparative Is Comparative Research? American Behavioral Scientist 42 (2):168-177.
KEA European Affairs. 2006. The Economy of Culture in Europe. Brussels.
KEA European Affairs. 2009. The Impact of Culture on Creativity. Luxembourg.
Lievesley, D. 2000. Commentary: Extending the debate to comparable worldwide cultural statistics. Cultural Trends 10 (37):77 - 81.
Madden, C. 2004. Making cross-country comparisons of cultural statistics: Problems and solutions. Australia Council Research Centre Working Paper 2.
Morrone, A. 2006. Guidelines for Measuring Cultural Participation. Montreal: UNESCO.
Schuster, J. M. 2007. Participation Studies and Cross-National Comparison: Proliferation, Prudence, and Possibility. Cultural Trends 16 (2):99 - 196.
Skaliotis, M. 2002. Key figures on cultural participation in the European Union. Paper read at Proceedings of the International Symposium on Culture Statistics, at Montreal.
Ultee, C., R. Batenburg, and H. Ganzeboom. 1993. Cultural Inequalities in Cross-National Perspective: A Secondary Analysis of Survey Data for the 1980s. In Cultural Participation. Trends Since the Middle Ages., eds. A. Rigby and D. Fokkema. Amsterdam/Philadelphia: John Benjamins Publishing Company.
35

Department for Culture, media and Sport | International comparisons of public engagement in culture and sport, 2011
Appendix A: Worksheets on cultural engagement
Analysis based on Eurobarometer survey 67.1 (Feb-Mar 2007). Data sheets are published with this report.
Appendix A - Attendance.xls – analysis of attendance at various types of cultural facility/event, plus attending sport events, consuming culture on TV/Radio and reading books. Also created some umbrella categories – Performing Arts, Arts, and Culture (all categories except sport), plus a count of how many respondents are attending more than one kind of culture.
Appendix A - Participation.xls – analysis of engagement in various cultural activities, plus umbrella categories: performing arts, culture (excluding crafts as this question also covers DIY and gardening) and how many different activities were engaged with.
Appendix A - Barriers.xls – analysis of agreement with various possible barriers to attendance, plus respondents attitudes to free events. The first data sheet has detailed responses to each response, the second summarises all barriers for each country, sorted by the proportion of respondents saying that cost was a barrier. The All chart shows all barriers for all countries – hard to read. All barriers has only major European states, All countries shows only the proportion stating cost and interest as barriers. Then each barrier is charted.
Appendix A - Assoc.xls – analysis of associations with the word culture, plus agreement with whether culture is of personal importance to respondents. The All assoc chart shows all categories of response for key countries, All Countries shows key categories for all countries, sorted by the proportion that mentioned the arts.
Appendix A - Living.xls analyses whether respondents agreed that affording to go out, take part in leisure/sports, and buy reading materials are necessary for a decent standard of living. NB the data sheet includes other possible responses, including affording an annual holiday and buying presents.
Appendix A - Fulfil.xls analyses whether respondents felt fulfilled in their personal and professional lives.
Appendix A - International.xls looks at to what extent respondents are interested in culture from their own country, other countries in Europe, or countries further afield. It also analyses whether respondents agree that there is no separate European culture, but a global western culture which is the same in the US and Europe.
36

Department for Culture, media and Sport | International comparisons of public engagement in culture and sport, 2011
Internet.xls shows the frequency with which respondents claim to use the internet, other than for work, plus a range of activities which they use it for – culturally relevant users are graphed, but others are included in the data sheet, which can be shown using the pivot chart.
Demographics of cultural attendance
Demographic analyses from the Eurobarometer survey 67.1, for various types of cultural attendance: Appendix A - Performing Arts.xls
Appendix A - Museums & Galleries.xls
Appendix A - Library.xls
Appendix A - Heritage.xls
Appendix A - Cinema.xls
Appendix A - Book.xls
Appendix A - Sports Events.xls
Appendix A - Culture.xls
In each spreadsheet, the first sheet, demographics, gives absolute figures for people attending in the first column set of columns, and absolute figures for the whole population in the second. So there were 106 respondents in Belgium who were still studying, 106 of whom had attended the cinema. (Some absolute figures have decimal places, due to weighting).
The second sheet, penetration, shows what proportion of each demographic group is attending, plus the proportion overall. So 88% of those still studying in Belgium had attended the cinema, compared to 50% of the population as a whole.
The third sheet, index values, first of all compares the rate of attendance of each demographic group to the rate of attendance across the country. So the cinema attendance rate of those still studying in Belgium is 175% of the attendance rate of the population as a whole (in GB it is 171%).
A stratification index was also created for each demographic variable, which measures by how much the rate of attendance varies between demographic groups – in essence, a measure of how much division in society there is in this type of attendance along this demographic “axis” – how dramatic the differences are, and how big the demographic groups (so it will give a low weighting to the fact that unemployed people in a country have a much lower rate of attendance if there are very low levels of unemployment). Technically, this is created by multiplying the square of the difference between the rate of attendance for each demographic group and the rate for that country overall, summed for all demographic groups and taking the square root. It was calculated only for key demographic variables, and charted only for education and occupation, though other charts are sorted by this where it has been calculated.
37

Department for Culture, media and Sport | International comparisons of public engagement in culture and sport, 2011
Appendix B: Contextual data available
Much of this is taken from KEA European Affairs, 2006, The Economy of Culture in Europe, http://www.keanet.eu/ecoculture/studynew.pdf or from KEA European Affairs, 2009, The Impact of Culture on Creativity, http://www.keanet.eu/impactculturecreativityfull.pdf, in particular pages 193-195 of the latter, which lists the existing and proposed data that they suggest incorporating into a European Creativity Index. Not all contextual data suggested by them is included here. Those in roman letters are included in the worksheets supplied; those in italics are not.
Spend o Direct public expenditure on culture (KEA European Affairs, 2006, p125) o % Household spend, recreation/culture (Eurostat: Household Budget Survey 2007 o Sponsorship: 5-country study including the UK from 2004 (KEA European Affairs, 2006)
Cultural industries o Contribution of cultural and creative industries to GDP (Eurostat/Amadeus quoted in KEA
European Affairs, 2006) o Cultural employment and cultural tourism employment (Eurostat 2004 and 2005, quoted in
KEA European Affairs, 2006) o Number of cinema screens by country (European Audiovisual Observatory) o Turnover music industries per capita (www.ifpi.org) o Turnover book industries per capita (Eurostat) o Turnover cinema industries per capita (European Audiovisual Observatory) o Number of Feature Films produced per year per capita (European Audiovisual
Observatory) o Number of recordings released per capita (www.ifpi.org) o Number of books published per year per capita (Unesco)
Education o hours spent on arts and sports in primary and secondary school (Eurydice) o number of arts schools per million population (European Leagues of Institutes of the Arts
(Elia))
Other o Share of population interested in arts and culture in other European countries
(Eurobarometer) o Market shares of non-national European film (European Audiovisual Observatory) o Time spent on cultural activities (Eurostat) o Time spent watching TV, listening to Radio, reading newspaper, using internet for cultural
purposes (ESS) o Social trust, happiness, social activities etc (ESS) o Membership of sporting or cultural organisation (World Values Survey)
38