International Comparative Study of Mortality Tables for ... · 1 Second International Comparative...
30
1 Second International Comparative Study of Mortality Tables for Pension Fund Retirees T.Z.Sithole (Kingston University), S.Haberman (Cass Business School, City University London) and R.J.Verrall (Cass Business School, City University London) Abstract This paper contains an update to the study carried out by Verrall et al. (2006a,b). It examines the mortality assumptions used in the valuation of pension liabilities in a number of different countries. The results are considered in relation to the underlying population mortality rates, in order to isolate the strength of the mortality assumptions being applied. It is found that there is evidence of a lack of consistency between countries, and that this has not changed since the previous study. Keywords Mortality, Pensions, Risk Acknowledgements The study is an update and extension of the original study which was funded by the UK Actuarial Profession and a group of firms of consulting actuaries. Summaries of this can be found in Verrall et al. (2006a,b) and the complete report is available on request from the authors. This project was requested by the IAA Mortality Task Force because new mortality tables have been adopted in some countries since the original study, and, in many cases, the population mortality data have also been updated. The underlying research work has been funded by the UK Actuarial Profession through the Mortality Research Steering Group. We would also like to thank the anonymous scrutineers for their helpful comments.
Transcript of International Comparative Study of Mortality Tables for ... · 1 Second International Comparative...

1
Second International Comparative Study of Mortality Tables for
Pension Fund Retirees T.Z.Sithole (Kingston University), S.Haberman (Cass Business School, City
University London) and R.J.Verrall (Cass Business School, City University
London)
Abstract This paper contains an update to the study carried out by Verrall et al. (2006a,b). It examines the mortality assumptions used in the valuation of pension liabilities in a number of different countries. The results are considered in relation to the underlying population mortality rates, in order to isolate the strength of the mortality assumptions being applied. It is found that there is evidence of a lack of consistency between countries, and that this has not changed since the previous study. Keywords Mortality, Pensions, Risk
Acknowledgements
The study is an update and extension of the original study which was funded by the
UK Actuarial Profession and a group of firms of consulting actuaries. Summaries of
this can be found in Verrall et al. (2006a,b) and the complete report is available on
request from the authors. This project was requested by the IAA Mortality Task Force
because new mortality tables have been adopted in some countries since the original
study, and, in many cases, the population mortality data have also been updated. The
underlying research work has been funded by the UK Actuarial Profession through
the Mortality Research Steering Group. We would also like to thank the anonymous
scrutineers for their helpful comments.

2
1. Introduction
Corporate pension liabilities are a material item in the balance sheets of many
companies and are hence of interest to investment analysts, accountants, auditors as
well as actuaries. The current accounting rules mean that key assumptions need to be
disclosed; however, more attention has been focused on discount rates and inflation
assumptions than on the underlying mortality assumptions. The current trends in
longevity mean that these mortality assumptions can have a notable effect on the
estimates of a company’s defined benefit pension liabilities, especially in an
environment where real interest rates are low (see, for example, Dushi et al 2010 for
an analysis in relation to the US).
This is the second study of the mortality assumptions used in the estimation of
pension liabilities for company sponsored defined benefit pension schemes, the first
having been completed in 2005 (see Verrall et al. 2006a,b). (We should clarify that we
are not considering the mortality assumptions used for the purposes of the funding of
pension liabilities) Mortality tables are used in the calculation of pensions liabilities
on company balance sheets, but the assumptions made can vary considerably by
country. In this study, we consider the mortality tables used for these calculations
throughout the EU and other selected countries, and compare them with the
corresponding population tables. Thus, we compare the strength of the mortality
assumptions across countries, taking into account differences in the underlying
population mortality data. By referring to population data, the aim is to eliminate as
far as possible differences in the mortality assumptions used in the calculation of
pension liabilities which can be attributed to factors other than a decision about how
strong these assumptions should be. Clearly, using a strong assumption (where life
expectancy is assumed to be high) will produce higher liabilities than a weaker
assumption (where retirees are expected to die sooner, on average). Given that the life
expectancy assumptions have to be produced by projecting forward mortality rates
from the current estimated values (Pitacco, 2004; Pitacco et al, 2009), it is necessary
to take a view about whether life expectancy will increase in the future and, if so, by
how much. This process of estimation and projection of mortality rates for use in the
calculation of pension liabilities has been central to actuarial work for many years, in
both the private and public provision of retirement benefits (see, for example, Booth
and Tickle, 2008 and Pitacco et al, 2009 and the references cited therein).

3
It would not be appropriate to move away from country-specific tables, but it is
necessary to understand the extent to which there are systematic differences between
standard tables that could be accounted for by methodological differences in their
construction or differences in the underlying data, assumptions and projections. Such
systematic differences can only be accounted for by a different view being taken
within each country of these factors. While this may not cause any issues when
considering each country in isolation, it can clearly cause difficulties for multinational
companies in relation to any regulatory requirements, and to the valuation of a
company whose liabilities move from one country’s regulatory jurisdiction to another
– for example through a take-over. Also, it would be best practice to share experience
across countries and to question and examine the process for arriving at the mortality
assumptions in order to improve and gain greater confidence across the board.
It is not the purpose of this paper to consider in any detail the method by which
mortality rates are projected, or to examine any of the methodologies which might be
used in this process. Instead, we simply look at the results of these assumptions about
the future direction of life expectancy and compare these across different countries.
The rationale behind these comparisons is that, in general, a similar methodology is
used within each country although we recognise that adjustments are frequently made
to the “base-line” assumptions in order to try to tailor them to the particular set of
lives being considered. Thus, while it may be true that there is some consistency in the
assumptions used within each country, Verrall et al. (2006a,b) found some notable
differences between those assumptions that were being used in different countries. It
is likely that the assumptions used in each country are arrived at through a rational
process of careful consideration of all relevant factors, and yet it is still the case that
this can result in quite different views about the appropriate strength of the mortality
assumptions between different countries. The purpose of this paper is:
• to set out the assumptions generally used in each country
• to compare with the underlying population mortality data
• to illustrate the differences between countries
• to compare the situation now with what was found in 2005

4
• to illustrate the impact of the mortality assumptions on the valuation of
pension liabilities, and
• to clarify what assumptions (eg current mortality and future mortality
improvements) are mandated by the authorities.
This paper is set out in 4 sections. In Section 2, we give the background to the study
and outline the methodology used. Also in this Section, a full description of the data is
given. Section 3 contains an analysis of the data, together with comparisons across the
different countries included in the study. Section 4 contains the conclusions.
2. Background, Methodology and Data
Central to the main purpose of this paper is a comparison of the mortality assumptions
currently used in European countries. For this reason, the countries covered in the
study of Verrall et al. (2006a,b) were Austria, Belgium, Denmark, Finland, France,
Germany, Ireland, Italy, Netherlands, Norway, Spain, Sweden, Switzerland and the
UK together with the USA and Canada. While maintaining the focus on the same
European countries, the current study has been widened in scope to include Australia
and Japan. Thus, the study in this paper covers the following countries:
Australia, Austria, Belgium, Canada, Denmark, Finland, France, Germany, Ireland,
Italy, Japan, Netherlands, Norway, Spain, Sweden, Switzerland, UK and USA.
Since the 2005 study, some of the mortality tables used in these countries have been
updated and changed. Unfortunately, information about any changes to the mortality
tables for a number of countries has not been made available to us. For these
countries, it has been assumed that the mortality assumptions used in the valuation of
pension liabilities are constructed on the same basis as in the previous study. This
applies to Denmark, Netherlands, Norway, Sweden and Switzerland.

5
It is essential to make all comparisons on as consistent a basis as possible. For clarity,
the methodology and the data sources used are set out in detail in the following
sections. There are two aspects to this. Firstly, in Section 2.1 we describe the data
used to determine the mortality tables used in valuing the pension liabilities.
Secondly, in Section 2.2 we give details of the data which has been used to determine
the underlying level of population mortality rates. These are needed so that cross-
country comparisons can be made on a consistent basis, with underlying differences in
the mortality experiences in different countries removed. What then remains is the
focus of this study: the strength of the mortality assumptions in relation to the current
underlying population mortality rates. We examine the differences between different
countries in this respect, and discuss some of the potential reasons for any differences.
It is quite possible that there are valid fundamental reasons for using mortality
assumptions of different strengths in different countries: for example, it is possible
that the make-up of the lives constituting the pension liabilities is different in
character in the different countries. If this were the case, then it would be entirely
justifiable to use different relative strengths for the mortality assumptions in different
countries. We believe that this study should provide useful information in the
consideration of these issues, and that greater consideration should be given to the
justification of any differences between countries. We would draw this matter to the
attention of professional bodies, standard setting agencies and regulators of financial
reporting (eg the Accounting Standards Board in the UK and the International
Accounting Standards Board).
2.1 Methodology and Data Sources for Pension Mortality Tables
Since we are considering pension liabilities, we only use data for mortality rates for
ages 50 and over in all of the analyses. We use similar sets of data and make the same
comparisons as in the previous study. Thus, for each country, we provide tabular and
graphical comparisons in order to highlight the impact of the typical mortality
assumptions used to assess retirement liabilities within (defined benefit) pension fund
valuations. We use a set of mortality statistics and compare them with the national
population statistics: the data used for the population statistics is described in section
2.2. In this paper, we concentrate on a subset of the statistics which we have

6
investigated: for more details of the complete analysis see Sithole et al. (2011). The
statistics that we have used in this paper are as follows:
the probability of death ( xq rates) for males and females from age 50 upwards;
the expected future lifetime for an individual aged x years, for x from 50 upwards;
probabilities of survival to all greater ages, conditional on reaching ages 50, 60, 65 and 70;
the expected present value of annuities at a reference rate of interest (taken to be
3% and 6%) for:
─ a male aged 50, 60, 65 and 70;
─ a female aged 50, 60, 65 and 70;
─ a male aged x, with a reversion of 60% to a female aged three years younger
(assuming a rate of interest of 3%), where x = 60 and 65;
The mortality tables assumed for retirement liability purposes for each country and
details of the methodology of construction of the tables have been obtained with the
assistance of the IAA Mortality Task Force. The specific tables assumed in this study
and those assumed in the previous study are summarised in Table 2.1.
For the UK, the CMI_2009 Projection refers to the Continuous Mortality
Investigation (CMI) Working Papers 38, 39 and 41 which featured a mortality
improvement projection model for practical use. A key feature of this model is the
blending of the most current recent mortality experience available with a long-term
rate of improvement in mortality rates. The model assumes that for the immediate
future, the likely rate of improvement in mortality rates would be guided by the most
recently observed actuarial experience. However, for the long term, the model takes
more account of expert opinion and the available data on long term patterns of
change. Thus, the model assumes that rates of mortality improvement will continue to
accelerate in the short term prior to decelerating in the longer term.

7
Table 2.1: Summary of mortality tables and/or mortality experiences used in the study
Pension – related mortality tables
Population Data – extracted on 18/11/09
2005 study Current study General Comments
Australia Not applicable Mercer 0205 tables updated to 2007
2006 -HMD
Austria
AVOE 1999P – Pagler and Pagler Based on 1973-1998 Social Security Data
OVE 2008- P Pagler and Pagler. Based on Austrian social insurance data from 1973 to 2007
Projected table for the 1950 generation used
2005 -HMD
Belgium
MR – male FR – female based on 1989-1991 population mortality tables
MR – male FR – female based on 1989-1991 population mortality tables
No mortality improvements assumed
2006 - HMD
Canada
RP2000 projected to 2000 Observation Period: 1983-1990
UP94 projected to 2020
Projected using US projection scale AA
2006 - HMD
Denmark
G82 Based on 1980’s population mortality
Tables not provided 2007-HMD
Finland
Standard TEL – updated 19/12/2001
Standard TyEL – updated to 2008 - Rates applicable to attained age in 2008 assumed
Calculation includes an age adjustment term depending on gender and year of birth
2007-HMD
France
TPRV93 Based on female population data 1961-1987
TPG05 generation mortality tables
Projected table for the 1950 generation used
2007-HMD
Germany
Richttafeln 1998 Data collection: 1995-1997
Richttafeln 2005G generation mortality tables
Smoothing by cubic splines extrapolation by a modified Gompertz approach short term and long term projections
2006 - HMD
Ireland
PMA92C2010 PFA92C2010 Based on UK pensioners’ experience: 1991-1994
PMA92C2010 PFA92C2010 Based on UK pensioners’ experience: 1991-1994
Amounts based experience. Projected to 2010 Approval of new basis awaited
2006 - HMD
Italy RG48 - projected table for the RG48 - projected table for IPS55 also in 2006 -

8
1948 generation the 1948 generation use – projected table for the 1955 generation
HMD
Japan Not applicable Standard mortality tables prescribed in 2005 based on the 19th population mortality tables
Tables developed using the 2000 Census, taking the Employees’ Pension Insurance experience
2007 - HMD
Netherlands
GB 1995-2000 Based on 1995-2000 population data
Tables not provided 2006 -HMD
Norway
K-63 in use since 1963
Tables not provided 2007 - HMD
Spain
PERM/F2000 P for policies issued after 3/10/2000
PERM/F2000 P for policies issued after 3/10/2000
Projected table for the 1955 generation assumed
2007 - HMD
Sweden
FFFS 2001:13
Tables not provided 2007 - HMD
Switzerland
EVK2000 Based on experience of the Federal Pension Fund members
Tables not provided 2007 - HMD
UK PMA92C2010 PFA92C2010 Pensioners’ experience: 1991-1994
S1PMA and S1PFA CMI_2009. Pensioners experience of UK self administered pension schemes: 2000-2006 experience
S1 series tables projected using CMI_2009 Projection Model assuming Long Term Rates of Improvement of 1% and 1.25%
2006 –HMD
US RP – 2000 RP2000 projected to 2010 Observation Period: 1983-1990
Projected using US projection scale AA
2006- HMD
2.2 Population Estimates
As a base-line to standardise the mortality assumptions used in each country, we
employ similar methods to those described in Section 2.1, but with the national
population mortality rates instead of those used in the calculation of pension
liabilities. For this, we used the most recent national mortality experiences which have

9
been obtained from the Human Mortality Database (HMD) website
(http://www.mortality.org). No adjustments have been made to the data, and, in all
cases, period life tables have been used to derive the relevant population mortality
statistics. Period life tables are based on mortality rates derived from observations in a
specific period of time. It is implicitly assumed in their construction that the mortality
pattern does not change in the future and so period life tables present a static picture
of the prevailing mortality patterns (Pitacco at al 2009).
Table 2.2 shows the latest available census dates and mid-year population estimates
for 2008 or 2009 for the countries covered in this study. The data have been obtained
from the United Nations Statistics Division website:
http://unstats.un.org/unsd/demographic/products/vitstas/serATab2.pdf
Table 2.2: Population estimates for 2008 or 2009 and latest available census date (source: United Nations Statistics Division, Population and Vital Statistics Report: Series A, updated 4 May 2011) Last Census date Mid- year population
estimate: 2008 or 2009 Australia 2006 21,955,256 Austria 2001 8,363,040 Belgium 2001 10,666,866 Canada 2006 33,720,184 Denmark 2001 5,519,441 Finland 2000 5,311,276 France 2006 64,540,518 Germany 2004 81,902,307 Ireland 2006 4,458,942 Italy 2001 60,192,698 Japan 2005 127,558,000 Netherlands 2002 16,530,388 Norway 2001 4,828,726 Spain 2001 45,929,476 Sweden 2003 9,298,515 Switzerland 2000 7,743,822 UK 2001 61,792,000 US 2010 307,006,550
2.3 Cross-country Analysis: methodology
In order to make comparisons between countries, a number of statistics have been
chosen which are representative of the strength of the mortality assumptions being

10
used. Each of these has its particular advantages and disadvantages: a single statistic
can only convey a certain amount of information. For example, the life expectancy at
age 65 is very easy to understand, but it may not provide enough information to
enable a proper assessment of the impact of mortality on the valuation of pension
liabilities. On the other hand, an expected present value of an annuity would provide
better information for the comparison of liabilities, but it would also be more difficult
to understand for the lay person. In the comparisons described in Section 3, we focus
on age 65 and compare the following statistics:
national probabilities of death and probabilities of death assumed for retirement
pension purposes across the countries referenced for an individual aged 65;
expected future lifetime based on mortality tables assumed for retirement pension
purposes and of the population as a whole, across the countries referenced;
expected present value of annuities at a rate of discount of 3%;
A more comprehensive report has been prepared by the authors, giving detailed
analyses of the data and providing many more graphs and figures (Sithole et al, 2011).
In the current report, we have extracted the relevant tables and figures and presented
them in a way to facilitate obtaining a good overview.

11
3. Cross – country analysis
In this section, we present some of the more significant results which illustrate the
similarities and differences between the countries studied. For a more detailed
analysis of each individual country, the reader is referred to the complete report:
Sithole et al (2011). Since the focus of the study is the liability of pensioners in each
country, the figures presented here show some of the important results for an
individual aged 65.
It should be noted that for Denmark, Norway, Sweden and Switzerland, the mortality
tables assumed for pension benefits are the same tables assumed in the 2005 study.
Mortality tables currently in use for pension benefits were not made available for
these countries.
3.1 A comparison of current pension liability mortality assumptions.
The first important point to note is that the underlying population mortality rates differ
from country to country. Although this is a well-known phenomenon, it is clearly not
something that can be ignored and it must be taken into account in any comparisons
that we make of the mortality assumptions used in valuing pension liabilities. We
therefore begin by considering the differences in the underlying life expectancy in
each of the countries being studied. Figures 3.1 to 3.4 show the comparisons for males
aged 65 and Figures 3.5 to 3.8 show the same comparisons for females aged 65.
Figure 3.1 shows the variation in observed population life expectancy for a male aged
65, and Figure 3.2 shows the variation in the typical assumed life expectancy for a
male 65-year-old member of a company defined benefit pension scheme. It can be
noted that there is quite a wide variation in the population mortality rates: there is a
difference in Figure 3.1 of more than two years between Australia with the longest life
expectancy and Denmark with the shortest. More importantly from our point of view
are the variations in assumed life expectancy in the tables used for valuing pension
liabilities, which are much wider than in the observed male population life
expectancy. In this case, France has the highest assumed life expectancy of 27.5 years
while Denmark has the shortest of 15.1 years: this is a difference of more than 12
12
years. It should be noted that for France this difference can be partly explained by the
fact that the mortality rates assumed in the determination of pension benefits for both
males and females are based on the female mortality experience.
Figure 3.3 illustrates this further by showing the difference for each country between
the observed national population life expectancy and the assumed life expectancy for
pensioners in company pension schemes. It can be seen that there is a wide variation
here with Denmark, Netherlands, and Switzerland (using the tables assumed in the
previous study) indicating that the assumed mortality tables for pension benefits give
a lower life expectancy for a 65-year old male member of a pension scheme than a
male from the general population. For the other countries, the greatest difference is
about 9 years for France, down to about 3 months in Sweden, Japan and Norway.
A similar picture can be seen by considering the ratio of the mortality rates from the
tables used for pension schemes to the population mortality rates. For males aged 65
Figure 3.4 shows that the probability of death used in the pension scheme assumptions
ranges from being 38% higher than the male population mortality in Denmark to
being 75% lower in France.
For females, Figure 3.5 shows the variation in observed population life expectancy at
age 65. In this case, there is a difference of 4.5 years between Japan with the longest
life expectancy and Denmark with the shortest. For a female member of a company
pension scheme, Figure 3.6 shows the variation in the typical assumed life expectancy
at age 65. Again, the variations in assumed life expectancy are much wider than in the
observed female population life expectancy. Spain has the highest life expectancy of
27.6 years while Denmark has the shortest life expectancy of 17.8 years, a difference
of more than 9.8 years.
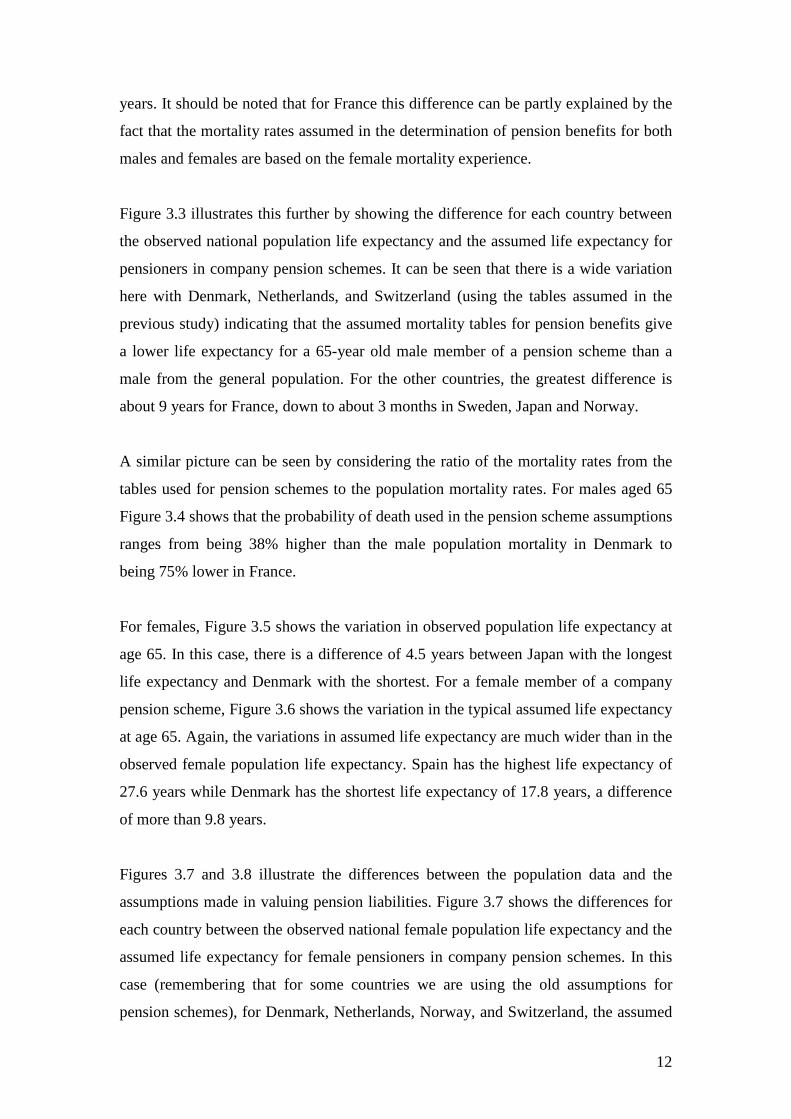
Figures 3.7 and 3.8 illustrate the differences between the population data and the
assumptions made in valuing pension liabilities. Figure 3.7 shows the differences for
each country between the observed national female population life expectancy and the
assumed life expectancy for female pensioners in company pension schemes. In this
case (remembering that for some countries we are using the old assumptions for
pension schemes), for Denmark, Netherlands, Norway, and Switzerland, the assumed

13
mortality tables for pension benefits would indicate a lower life expectancy for a 65-
year old female member of a pension scheme than a female from the general
population. For the other countries, the differences range from about 6 years in Spain
to about 4 months in the USA. A similar picture is given by Figure 3.8, which shows
the ratio of mortality rates for females aged 65. The probability of death on the basis
of the assumed mortality tables for female pension benefits ranges from being nearly
twice that of the female population in Switzerland to being 62% lower in Italy.
Figure 3.1
18.7
18.6
18.5
18.2
18.1
17.8
17.8
17.7
17.5
17.4
17.2
17.0
16.9
16.9
16.9
16.7
16.7
16.5
15.0
16.0
17.0
18.0
19.0
Austr
alia
Japa
n
Switz
erlan
d
Cana
da
Fran
ce
Swed
en Italy
Spain US
A
Norw
ay UK
Austr
ia
Germ
any
Finlan
d
Belgi
um
Nethe
rland
s
Irelan
d
Denm
ark
expe
cted
futu
re lif
etim
e in
year
s
Expected future lifetime for a male aged 65 from the general population: current study

14
Figure 3.2
Figure 3.3

15
Figure 3.4
Figure 3.5
1.38
1.19
1.13
1.08
1.01
0.97
0.93
0.91
0.78
0.74
0.68
0.62
0.62
0.61
0.56
0.54
0.53
0.40
0.25
0.0
0.5
1.0
1.5
Denm
ark
Switz
erlan
d
Neth
erlan
ds
Norw
ay
Japa
n
Swed
en
Belgi
um
Germ
any
Cana
da
Finla
nd
USA
Aust
ria
Spain
Aust
ralia
Italy
UK 1%
UK 1.
25%
Irelan
d
Fran
ce
ratio
of m
orta
lity r
ate
Ratio of assumed probability of death for a male member of a pension scheme to the observed male population probability of death at age 65
23.6
22.5
21.9
21.7
21.6
21.6
21.2
21.0
20.6
20.6
20.5
20.3
20.3
20.2
20.1
20.0
20.0
19.1
17
18
19
20
21
22
23
24
Japa
n
Fran
ce
Switz
erlan
d
Aust
ralia
Spain Ita
ly
Cana
da
Finla
nd
Norw
ay
Swed
en
Belgi
um
Aust
ria
Germ
any
USA
Neth
erlan
ds UK
Irelan
d
Denm
ark
expe
cted
futu
re li
fetim
e in
year
s
Expected future lifetime for a female aged 65 from the general population: current study

16
Figure 3.6
Figure 3.7
17
Figure 3.8
It is clear from Figures 3.1 to 3.8 that there is a wide variation in the strength of the
mortality assumptions made in valuing pension liabilities in the countries in our
sample. This has been shown by first removing the effects of the differences in the
underlying population mortality experiences in order to isolate the differences
between the mortality assumptions used in each country to value the pension
liabilities. This section has shown that there are currently some significant differences
between the countries included in this study. A similar conclusion was reached by
Verrall et al. (2006a,b), and the following section considers whether there has been a
change since that study was carried out.
3.2 A comparison with Verrall et al. (2006a,b)
A similar analysis to that in Section 3.1 was performed in the previous study, and this
section compares the results of these two studies in Figures 3.9 to 3.14. In this section,
we only consider the countries covered in the previous study so that the results for
1.87
1.48
1.44
1.10
1.03
0.94
0.89
0.89
0.85
0.84
0.82
0.73
0.63
0.63
0.62
0.59
0.56
0.50
0.38
0.0
0.5
1.0
1.5
2.0
Switz
erlan
d
Norw
ay
Denm
ark
Nethe
rland
s
Cana
da
Japa
n
USA
Belgi
um
Germ
any
Swed
en
Finlan
d
Austr
alia
UK 1%
Irelan
d
UK 1.
25%
Fran
ce
Austr
ia
Spain Ita
ly
ratio
of m
orta
lity r
ate
Ratio of assumed probability of death for a female member of a pension scheme to the observed female population probability of death at age 65

18
Australia and Japan are not included. Note that the increase in life expectancy is
measured using the period life expectancy. The current population life expectancy is
based on either 2006 or 2007 experience as available from the Human Mortality
Database. In the previous study, there was a much wider variation in the dates across
countries: for example, for Canada the relevant dates were 1995-1997 whereas for the
Netherlands it was 2003. Hence, as explained below, the annualised percentage
increases provide a better guide to the changes. The dates at which the population life
expectancies and the pensioner life expectancies calculated are generally different for
a given country: while the population life expectancy is the “observed” value, the
pensioner life expectancy is the value most likely to be assumed for pension benefits.
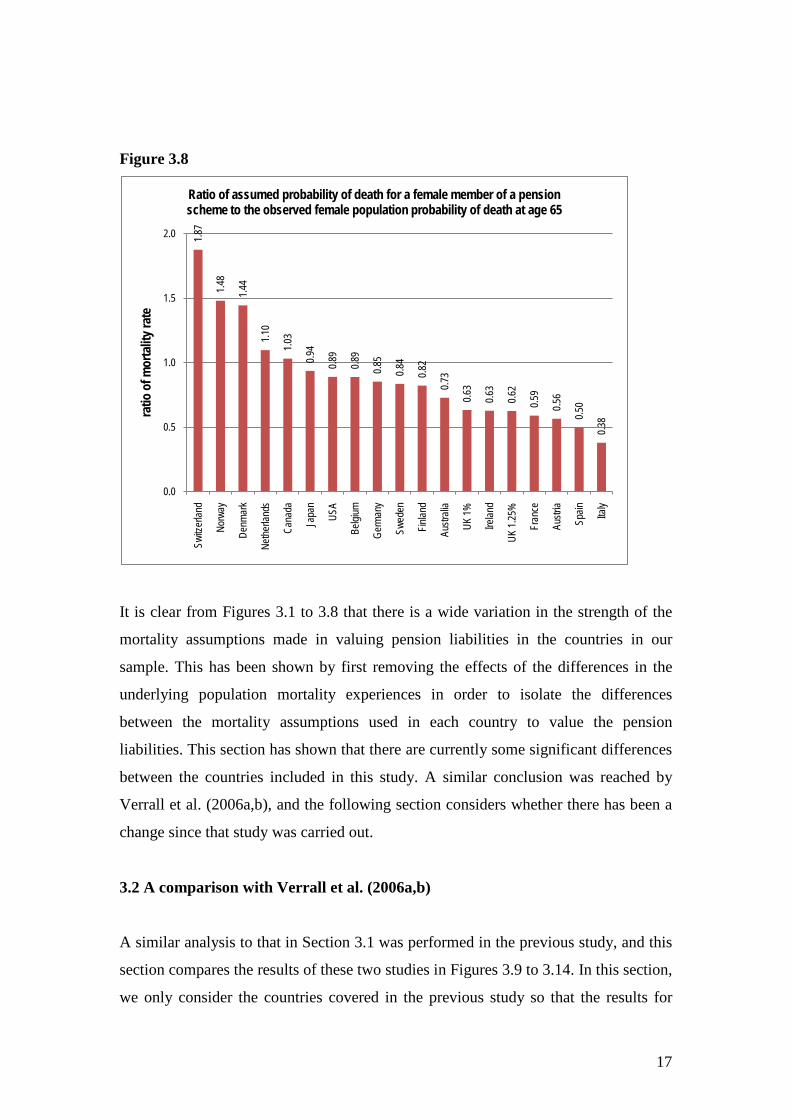
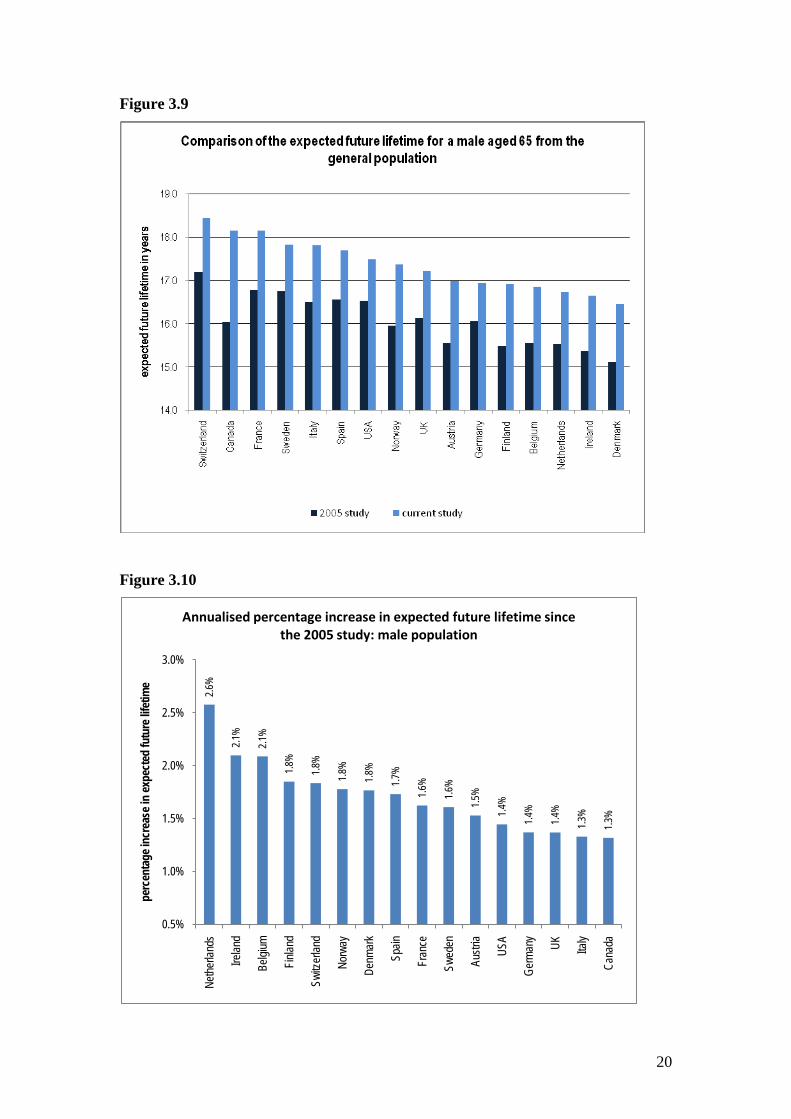
We begin with the general population data, and again consider males and females
aged 65. Figure 3.9 shows the variation in observed population life expectancy for a
male aged 65. It can be seen that, in terms of the male life expectancy at age 65,
Switzerland has the highest value and Denmark has the lowest value, in both studies.
However, as the population mortality experiences for individual countries relate to
differing years, these differences do not give a true reflection of improvements in
mortality. For this reason, we show the annualised percentage increases in male life
expectancy in Figure 3.10. These are more representative since they are based on the
actual dates of the relevant population mortality experiences in the 2005 study and the
current study. It can be seen that there are significant differences between countries,
with the annualised percentage increases ranging from 1.3% in Canada to 2.6% in the
Netherlands. This is something that we might expect to see reflected in the strength of
the assumptions used in valuing pension liabilities: if mortality rates have improved
faster, then we would expect the pension liability assumptions also to have been
further strengthened (assuming that the groups of lives in the pension schemes have
experienced a similar rate of improvement to the overall population).
Figure 3.11 shows a comparison of the difference for each country between the
observed national male population life expectancy and the assumed life expectancy
for male pensioners, both at age 65. The only country for which the assumed mortality
tables for pension benefits indicated a lower life expectancy for a 65-year old male
member of a pension scheme in the previous study was Denmark. In the current study,
the results for Denmark, Netherlands, and Switzerland would indicate a lower life

19
expectancy for a 65-year old male member of a pension scheme than a male from the
general population. This is most likely to be due to the fact that whilst there has been
an obvious improvement in population mortality, the tables assumed for pension
benefits in this study are the same as those assumed in the previous study for these
countries. For the other countries, the differences range from over 9 years in France to
about 3 months in Sweden, Japan and Norway.
Similarly for females, Figure 3.12 shows the variation in observed population life
expectancy for a female aged 65. As in the previous study, France has the highest
female life expectancy at age 65 and Denmark has the lowest. Again, the
interpretation of this figure may be somewhat unclear because of the differences in the
dates used for the population mortality data. Hence, Figure 3.13 shows the annualised
percentage increases in female life expectancy based on the actual dates of the
relevant population mortality experiences in Verrall et al. (2006a,b) and the current
study. The annualised percentage increases range from 0.7% in Canada and Sweden
to 1.7% in The Netherlands. For each of the countries shown, the average rates of
mortality improvement in the female population are lower than the average rates of
mortality improvement in the male population, suggesting that long term convergence
is being assumed between the mortality rates for males and females.
Having first considered changes in the life expectancy in the population, Figure 3.14
shows a comparison of the difference for each country between the observed national
female population life expectancy and the assumed life expectancy for female
pensioners. Comparing with Verrall et al. (2006a,b), it can be seen that the assumed
mortality tables for pension benefits indicate a lower life expectancy for a 65-year-old
female member of a pension scheme for Denmark and Switzerland only.
20
Figure 3.9
Figure 3.10
2.6%
2.1%
2.1%
1.8%
1.8%
1.8%
1.8%
1.7%
1.6%
1.6%
1.5%
1.4%
1.4%
1.4%
1.3%
1.3%
0.5%
1.0%
1.5%
2.0%
2.5%
3.0%
Nethe
rland
s
Irelan
d
Belgi
um
Finlan
d
Switz
erlan
d
Norw
ay
Denm
ark
Spain
Fran
ce
Swed
en
Austr
ia
USA
Germ
any
UK Italy
Cana
da
perc
enta
ge in
crea
se in
expe
cted
futu
re lif
etim
e
Annualised percentage increase in expected future lifetime since the 2005 study: male population

21
Figure 3.11
Figure 3.12
16.0
17.0
18.0
19.0
20.0
21.0
22.0
23.0
Fran
ce
Switz
erlan
d
Spain Ita
ly
Cana
da
Finlan
d
Norw
ay
Swed
en
Belgi
um
Austr
ia
Germ
any
USA
Nethe
rland
s
UK
Irelan
d
Denm
ark
expe
cted
futu
re lif
etim
e in
year
s
Comparison of the expected future lifetime for a female aged 65 from the general population
current study 2005 study

22
Figure 3.13
Figure 3.14
1.7%
1.6%
1.6%
1.4%
1.3%
1.3%
1.3%
1.2%
1.2%
1.1%
1.0%
0.9%
0.9%
0.9%
0.7%
0.7%
0.4%
0.6%
0.8%
1.0%
1.2%
1.4%
1.6%
1.8%
2.0%Ne
therla
nds
Irelan
d
Finlan
d
Switz
erlan
d
Fran
ce
Spain
Belgi
um
Denm
ark
Norw
ay
Austr
ia
USA UK Italy
Germ
any
Swed
en
Cana
da
perc
enta
ge in
crea
se in
expe
cted
futu
re lif
etim
e
Annualised percentage increase in expected future lifetime since the 2005 study: female population

23
In Sections 3.1 and 3.2 we have concentrated on life expectancy as a measure of the
strength of the mortality assumptions used in valuing pension liabilities. Life
expectancy is easy to communicate and understand, but it may not be the best measure
when used in this context. For this reason, we consider a different statistic in Section
3.3.
3.3 A comparison using annuity values
Having considered life expectancy at age 65 in sections 3.1 and 3.2, this section
makes a comparison based on discounted annuity values. When considering pension
liabilities, it may be more appropriate to base the comparison on discounted annuity
values since these are likely to show how the estimated values of the liabilities are
likely to differ. In relation to the public disclosure of mortality assumptions, the
relative advantages of different summary measures were also discussed in Verrall et
al. (2006a,b). As before, we believe that life expectancy is probably more intuitive
and understandable, but the discounted annuity value is probably better for a
discussion of the valuation of the liability. In Figures 3.15 to 3.17, comparisons are
shown based on an annuity value for a male aged 65 with a 60% reversionary
widow’s pension for a female aged 62. Figure 3.17 reflects the differences between
countries that have also been shown in Figures 3.3 and 3.11.

24
Figure 3.15
Figure 3.16
16.3
15.9
15.9
15.9
15.7
15.6
15.6
15.4
15.3
15.3
15.2
15.1
15.1
15.1
15.1
14.9
14.8
14.7
13.5
14.0
14.5
15.0
15.5
16.0
16.5Ja
pan
Austr
alia
Fran
ce
Switz
erlan
d
Cana
da Italy
Spain
Swed
en
Norw
ay US
Finlan
d
UK
Austr
ia
Belgi
um
Germ
any
Irelan
d
Nethe
rland
s
Denm
ark
pres
ent v
alue o
f ann
uity
Present value at 3%, of an annuity of 1 paid annually to a male member of the general population, starting one year after attaining age 65 (includes
reversionary widow's pension)

25
Figure 3.17
Pension liabilities are driven by the discounted value of annuity payments, and the
mortality assumption can have a significant impact on the liabilities in company
balance sheets. This can be illustrated by considering a pension scheme with liabilities
of £1000m if calculated using assumptions generally used in the UK. Figures 3.18 and
3.19 compare a liability of £1000 million based on the assumptions for a UK pension
scheme member (Figure 3.18 involves scaling relative to an assumed long term
improvement rate in mortality rates for the UK of 1%pa and Figure 3.19 involves
scaling relative to an assumed long term improvement rate in mortality rates for the
UK of 1.25%pa) to the equivalent liability if the assumptions were those assumed for
each of the countries in the study. The figures show that, for example, the liabilities
based on the mortality assumptions used in France are higher than in the UK, whilst
the liabilities based on the mortality assumptions used in Germany are lower than if
based on the assumptions used in the UK.
-10.0
-5.0
0.0
5.0
10.0
15.0
20.0
25.0Fr
ance
Spain
Irelan
d
Austr
ia
UK 1.
25%
UK 1%
Germ
any
Finlan
d
Italy
Belgi
um
Austr
alia
Cana
da
Swed
en US
Japa
n
Norw
ay
Nethe
rland
s
Switz
erlan
d
Denm
ark
Perc
enta
ge di
ffere
nce
Percentage difference between assumed male mortality table annuity present value at 3%, and observed male population annuity present value,
(includes reversionary widow's pension)

26
Figure 3.18
Figure 3.19
1149
1078
1005
1004
1003
1000
977
970
968
958
958
953
935
925
918
899
895
872
814
800
850
900
950
1000
1050
1100
1150
1200Fr
ance
Spain
Aust
ria
UK 1.
25%
Irelan
d
UK 1% Ita
ly
Aust
ralia
Japa
n
Germ
any
Finla
nd
Cana
da
Swed
en
Belgi
um US
Switz
erlan
d
Norw
ay
Neth
erlan
ds
Denm
ark
Liabil
ity in
£milli
ons
Comparison of male pension liability (age 65) taking UK as a base (assuming a long-term mortality improvement rate of 1% for the UK):
equivalent liability of £1000 million for the UK 11
45
1074
1001
1000
999
996
973
966
965
954
954
949
932
921
915
896
892
868
811
800
850
900
950
1000
1050
1100
1150
1200
Fran
ce
Spain
Austr
ia
UK 1.
25%
Irelan
d
UK 1% Ita
ly
Austr
alia
Japa
n
Germ
any
Finlan
d
Cana
da
Swed
en
Belgi
um US
Switz
erlan
d
Norw
ay
Nethe
rland
s
Denm
ark
Liabil
ity in
£milli
ons
Comparison of male pension liability (age 65) taking UK as a base (assuming a long-term mortality improvement rate of 1.25% for the UK):
equivalent liability of £1000 million for the UK

27
4. Conclusions The conclusions of this study are similar to the previous study, in that the results
indicate that current practice varies considerably across the EU. It is to be expected
that the mortality assumptions used in company pension schemes should vary from
country to country, due to variations in underlying population mortality as well as in
variations of the profile of typical membership of a company pension scheme.
However, it appears that, as with the previous study, the variations in mortality
assumptions are much greater than would be justified by these factors alone. We are
not aware whether there has been any further work done in this context since our first
study, but we would suggest that this is now overdue. In particular, we believe that it
would be worthwhile investigating whether the observed variation is due to the fact
that some countries incorporate an allowance for expected future improvements in
mortality, while others use tables that relate to mortality observed over a period in the
past, without allowing for the fact that life expectancy continues to increase.
We acknowledge that our study is affected by some limitations regarding the basis of
the comparisons presented. Thus, the pension liabilities to be found in the company
accounts of different countries may be different in character – for example, the
pension system in France is dominated by pay-as-you-go provision delivered by
national arrangements and it is likely that only the liabilities for senior managers
would appear in company accounts. Similarly, the maturity of pension liabilities is
likely to vary between and within countries: our use of mortality indices for
comparison purposes based on age 65 needs to be seen in the light of this caveat.
Verrall et al. (2006a,b) suggested that the effect of the difference in mortality
assumptions could be viewed in terms of an “equivalent” difference in the discount
rate. This is illustrated in Figures 4.1 and 4.2, which show the discount rates that must
be used when the mortality assumptions from other countries are applied, in order to
get the same liabilities as for the UK assumptions. Again, this is done using the two
assumptions for mortality improvement in the UK. It can be seen that there is a
significant difference between countries, and that the effect of this is emphasised by
viewing it in terms of the discount rate; for example, we note a wide range of discount

28
rates in Figure 4.1 corresponding to differences (compared to the UK assumption) of
between +181 basis points and -114 basis points.
Figure 4.1
4.81
4.23
3.99
3.93
3.75
3.70
3.59
3.42
3.37
3.37
3.27
3.27
3.21
3.00
2.96
2.96
2.96
2.36
1.86
0.5
1.0
1.5
2.0
2.5
3.0
3.5
4.0
4.5
5.0
5.5
Denm
ark
Neth
erlan
ds
Norw
ay
Switz
erlan
d
US
Belgi
um
Swed
en
Cana
da
Finla
nd
Germ
any
Aust
ralia
Japa
n
Italy
UK 1%
Aust
ria
Irelan
d
UK 1.
25%
Spain
Fran
ce
Disc
ount
rate
(%)
Discount rate compared to 3% for the UK (1% mortality improvement rate), equivalent to change in mortality table (male age 65, includes reversionary
widow's pension)

29
Figure 4.2
Figures 4.1 and 4.2 reinforce the conclusion from this paper, and also from the
previous study, which is that greater consistency and clarity should be sought in the
assumptions underlying the calculation of pension liabilities.
4.84
4.26
4.01
3.96
3.78
3.73
3.62
3.45
3.40
3.40
3.30
3.30
3.25
3.04
3.00
2.99
2.99
2.39
1.89
0.5
1.0
1.5
2.0
2.5
3.0
3.5
4.0
4.5
5.0
5.5De
nmar
k
Neth
erlan
ds
Norw
ay
Switz
erlan
d US
Belgi
um
Swed
en
Cana
da
Finlan
d
Germ
any
Austr
alia
Japa
n
Italy
UK 1%
UK 1.
25%
Austr
ia
Irelan
d
Spain
Fran
ce
Disc
ount
rate
(%)
Discount rate compared to 3% for the UK (1.25% mortality improvement rate), equivalent to change in mortality table (male age 65, includes reversionary
widow's pension)
30
References Booth, H. and Tickle, L. (2008). Mortality modelling and forecasting: a review of methods. Annals of Actuarial Science, 3, pp 3-43. Continuous Mortality Investigation Working Papers 38, 39 and 41 are available from www.actuaries.org.uk Dushi I., Friedberg, L. and Webb, T. (2010). The impact of aggregate mortality risk on defined benefit pension plans. Journal of Pension Economics and Finance 9 (4), pp 481-503. Pitacco, E. (2004). Survival models in a dynamic context: a survey. Insurance: Mathematics and Economics, 35 (2), pp 279-298. Pitacco, E., Denuit, M., Haberman, S. and Olivieri, A (2009). Modelling Longevity Dynamics for Pensions and Annuity Business. Oxford University Press. Sithole, T., Haberman, S. And Verrall, R. (2011) Second international comparative study of mortality tables for pension fund retirees – full report. United Nations Statistics Division (May 2011). Population and Vital Statistics Report: Population, latest available census and estimates (2008-2009). Available at http://unstats.un.org/unsd/demographic/products/vitstats/serATab2.pdf Verrall R., Haberman,S., Sithole, T. and Collinson, D. (2006a), The price of mortality, Life and Pensions (September), pp 35-40. Verrall, R., Haberman, S., Reay, T. And Collinson, D. (2006b), EU Pensions Mortality Assumptions, The Actuary, May 2006.