World Cleanup 2012 Conference - insight to cleanup preparations in Albania!

2004 The Ocean Conservancy. All rights reserved. www.coastalcleanup.org
International Coastal Cleanup
- 2003 -
Ohio Summary Report
2003 State Coordinator: Jill Woodyard / Linda Zmudzinski, Ohio Lake Erie Commission
The Ocean Conservancy Office of Pollution Prevention and Monitoring
1432 N Great Neck Rd, # 103 Virginia Beach, VA 28409 USA

Laws and Treaties Regulating Trash in the Sea International Convention for the Prevention of Pollution from Ships (MARPOL 73/78): This law provides a comprehensive approach when dealing with ocean dumping by creating international guidelines to prevent ship pollution. MARPOL (enforced by the International Maritime Organization www.imo.org) has six annexes covering oil discharge, hazardous liquid control, hazardous material transport, sewage discharge, plastic and garbage disposal, and air pollution. As of March 2004, 117 countries have ratified Annex V, which controls the disposal of plastics and garbage into the oceans. Marine Plastic Pollution Research and Control Act (MPPRCA): To implement Annex V of MARPOL, each individual country must develop its own national implementation legislation. The U.S. Congress created the MPPRCA to implement Annex V in the United States. Under MPPRCA, it is illegal to throw plastic trash off any vessel within the U.S. Exclusive Economic Zone (within 200 miles of the U.S. shoreline). It is also illegal to throw any other garbage overboard while navigating U.S. waters (including inland waters) or within three miles of shore. Clean Water Act: This act established pollution discharge regulations for U.S. waters, set water quality standards, and gave the country’s Environmental Protection Agency (EPA) authority over pollution control programs. (www.epa.gov/region5/water/cwa.htm) Beaches Environmental Assessment and Coastal Health Act of 2000 (B.E.A.C.H. Act): This act amended the Clean Water Act, requiring adoption of minimum health-based water quality criteria, comprehensive water testing, and notification of the public when water contamination levels are unsafe. (www.epa.gov/waterscience/beaches/act.html) Coastal Zone Management Act (CZMA) This act works to preserve, protect, develop, restore, and enhance the United States’ coastal zone resources. (www.ocrms.nos.noaa.gov)
The International Coastal Cleanup The International Coastal Cleanup (ICC)
engages people to remove trash and debris from the world’s beaches and waterways, to identify the sources of debris, and to change the behaviors that cause pollution.
Marine Debris: A Global Problem Marine debris is a pervasive plague reaching
across the globe. Food wrappers and containers, fishing line, plastic bags, and cigarette butts are just some of the debris items found scattered along our beaches, drastically affecting our oceans and inland waterways. Unfortunately, marine debris can be traced back to one single source—people.
According to scientists, marine debris is
defined as any manufactured or processed solid waste material that enters the marine environment from any source. While our habits have not necessarily changed, the nature of marine debris has—dramatically. Based on past research and data, organic materials have yielded to synthetic materials, like plastics, as the primary substance in trash. Items like plastic beverage bottles, packing straps, tarps, and fishing line are slow to degrade and are highly buoyant, allowing them to travel in currents for thousands of miles, endangering marine wildlife and ecosystems along the way.
History of the International Coastal Cleanup
The International Coastal Cleanup is the world’s largest one-day volunteer effort to clean up the marine environment. Since the first Texas beach cleanup in 1986, The Ocean Conservancy and it’s international partners have turned the event into a global effort. By 1988, the Cleanup had expanded to include 25 coastal U.S. states and territories.
The average American disposes of 4.6 pounds of trash each day
– the highest average in the world.
The Ocean Conservancy 2
2003 International Coastal Cleanup Ohio Summary Report

Activities That Produce Debris
Recreational and Shoreline Activities Picnics, festivals, and days at the beach can produce a variety of debris. Litter washed from streets, parking
lots, and storm drains also contributes to this category of debris.
Ocean and Waterway Activities A variety of ocean and waterway activities, such as cruise ship operations, fishing, boating, military
vessels, and even offshore oil drilling, can result in marine debris.
Smoking-Related Activities Littering from smoking produces cigarette filters, cigar tips, and tobacco packaging debris.
Dumping-Related Activities Dumping items like building materials, cars and car parts, and large household items—either legally or illegally—
contributes to marine debris.
Medical and Personal Hygiene Medical and personal hygiene waste can enter the environment through improper disposal. Since it
often arrives on beaches through sewer systems, its presence on shore can indicate other, unseen pollutants.
In 1989, Canada and Mexico participated, making the event the International Coastal Cleanup. Just three years later, 33 countries participated; in 2003, 91 nations took part. In total, 127 countries have participated in the ICC during its 18-year history. Today, the ICC is held around every major body of water in the world.
Sources of Marine Debris Determining where debris originates is no easy
task, since trash and litter can travel long distances before washing up on our shorelines or sinking to the ocean bottom. One of the ICC’s goals is to trace pollution to its source and work to prevent it from occurring. To this end, ICC volunteers record debris information on standardized data cards developed and provided by The Ocean Conservancy. Data compiled from beach cleanups are used to identify the activities that produce the debris.
The official data card used in the Cleanup
allows users to record specific debris items that are indicative of the activities and sources producing the debris. Information is grouped by the behavior associated with its presence: recreational and shoreline activities, ocean and waterway activities, smoking-related activities, dumping activities, and activities resulting from improper disposal or handling of medical or personal hygiene materials. Much of the debris is deposited on land and reaches the ocean by beach-going activities, being blown into the water, or carried by creeks, rivers and storm drains to the shore. Other debris comes from water activities, including vessels (from small sailboats to large container ships), offshore drilling rigs and platforms, and fishing piers. The result is a unique global database of information collected at every cleanup around the world. Data from the cleanup provide the framework for action at all levels of government to limit marine debris and to educate the public about litter and pollution prevention.
In the early 1990s, land-based activities were responsible for 60 to 80 percent of the
world’s marine debris.
2003 International Coastal Cleanup Ohio Summary Report
The Ocean Conservancy 3

2003 ICC: A Global Event The International Coastal Cleanup was held on
Saturday, September 20, 2003. More than 450,000 volunteers participated in this year’s Cleanup, removing over 7.5 million pounds of debris from more than 16,000 miles of oceans and waterways. Hurricanes and typhoons could not even deter volunteers from the Cleanup. In fact, volunteers from Okinawa rescheduled their cleanups after a typhoon hit the Pacific. Volunteers in Bermuda were faced with Hurricane Fabian and still managed to have record turnouts at the Cleanup. In Maryland, North Carolina and Virginia, volunteers were able to participate in the ICC, despite Hurricane Isabel making its debut several days before the big event.
In 2003, the ICC expanded its geographic
presence by including five new countries—Guadeloupe, India, Luxembourg, Marshall Islands, and Vanuatu— bringing the total number of participating countries to 91.
Underwater cleanup participation also
increased, as 9,629 divers from 70 countries removed over 185,000 pounds of debris from 325 miles of oceans and waterways.
In the United States, more than 170,000
volunteers turned out from 48 U.S. states and territories. ICC volunteers removed more than 3.7 million pounds of debris, combing over 9,000 miles of oceans and waterways. Underwater, divers in the United States removed over 19,500 debris items from weighing an excess of 32,000 pounds.
2003 International Coastal Cleanup Participating Countries
2003 International Coastal Cleanup Ohio Summary Report
The Ocean Conservancy 4

“Top Ten” Debris Items
Debris Items Amount Percent of Total
1. Food Wrappers and Containers
4,896 15.6%
2. Beverage Cans 4,124 13.2% 3. Cigarettes/Cigarette
Filters 3,496 11.2%
4. Caps/Lids 3,181 10.2% 5. Beverage Bottles (Glass) 2,530 8.1% 6. Beverage Bottles
(Plastic) 2 liters or less 2,309 7.4%
7. Cups/Plates/Forks/ Knives/Spoons
2,101 6.7%
8. Straws/Stirrers 1,754 5.6% 9. Bags 1,289 4.1% 10. Cigar Tips 1,045 3.3% Totals: 26,725 85.4%
2003 ICC Results - Ohio
Sources of Debris
2003 ICC: Ohio In 2003, 900 volunteers participated in the
2003 ICC in Ohio. Volunteers cleaned 61 miles of oceans and waterways, picking up 31,329 debris items, weighing in at 21,108 pounds. In addition to land based cleanups in Ohio, 222 divers removed 1,987 debris items from below the waters' surface.
Marine Debris Overall, shoreline and recreational activities
such as picnics, festivals, and days at the beach accounted for 76 percent of the debris found in Ohio. Litter washed from streets, parking lots, and storm drains also contributed to this category of debris. Worldwide, shoreline and recreational activities accounted for 56 percent of all the debris collected.
Smoking-related activities, in the form of cigarette filters, cigar tips, and tobacco packaging, accounted for 17 percent of the debris found in Ohio. Globally, debris from smoking-related activities made up 34 percent of the debris collected.
Debris items from ocean and waterway
activities related to cruise ships, commercial and recreational fishing, shipping and recreational
boating accounted for four percent of the debris found in Ohio. Worldwide ocean and waterway activities represented only six percent of the debris collected during the Cleanup.
The “Top Ten” list represents the 10 most
abundant items found during the Cleanup and provides a quick guide to the most common forms of marine debris. In 2003, the “Top Ten” list made up 85 percent of all the debris found in Ohio. Of those 10, the top three items – food wrappers, cigarettes, and beverage cans – account for over one quarter of all debris. Food wrappers, the number one item in Ohio, comprised nearly one quarter of the 31,329 debris items. Please refer to Appendix A for a complete listing of debris items found in Ohio and Appendix B for separate listing of results from Land or Underwater Cleanups.
As the data shows, the highest number of
items found during the 2003 ICC consisted of packaging waste from consumable goods such as, cigarettes, fast food, and beverage products. The packaging waste was improperly discarded after the products were used or consumed. Promoting
In Ohio, food wrappers, cigarettes, and beverage cans accounted for over one quarter
of all the debris items collected.
Ocean Waterway Activities
3.6%
Smoking-Related
Activities16.9%
Dumping Activities
1.6%
Medical/ Personal Hygiene
1.5%
Shoreline and Recreational
Activities76.4%
2003 International Coastal Cleanup Ohio Summary Report
The Ocean Conservancy 5

public awareness of waste handling problems is vital to educate the public. We must also provide them with the knowledge and tools to encourage behavioral changes designed to reduce debris. Dangers of Marine Debris
Each year, volunteers find animals entangled in a variety of marine debris. The consequences are often deadly for the animals. Debris entanglement can cause lethal cuts, hampered mobility, suffocation, and drowning. Debris ingestion—usually caused when animals mistake trash for food or are indiscriminant eaters—can lead to strangulation and starvation.
In the 2003 ICC, volunteers discovered 237 entangled items worldwide. Unfortunately, monofilament fishing line was the primary culprit for the third year, representing more than 41 percent of total entanglements. Fishing nets were the next “most dangerous” items, causing over 18 percent of animal entanglements. Other entangling debris included six-pack holders and balloon ribbon. While compromising seven percent of all debris found in Ohio, these debris items are substantially more dangerous to ocean creatures.
Of the animal entanglements reported during the 2003 ICC, marine mammal entanglements made up less than seven percent of the total entanglements, while fish and invertebrates accounted for more than half of all recorded entangled animals. While one could reasonably expect that animals that spend most of their lives underwater would be at the greatest risk for entanglement, seabirds are also victims of debris. ICC volunteers found 77 entangled birds, almost 33 percent of the total entangled wildlife.
Amphibians1.7%
Fishes38.4%
Reptiles2.5%
Birds32.5%
Mammals6.8% Invertebrates
18.1%
Entangled Animals
Fishing line41.8%
Six-pack holders16.0%
Other15.6%
Balloon ribbon
8%
Fishing nets18.6%
Debris Items Found Entangling Animals
Worldwide, 237 animals were found entangled in debris during the 2003 International Coastal Cleanup.
2003 ICC - Ohio Dangerous Debris Items
Bags 1,289 Balloons 213 Crab/Lobster/Fish Traps 0 Fishing Line 82 Fishing Nets 4 Plastic Sheeting/Tarps 263 Rope 104 Six-Pack Holders 70 Strapping Bands 104 Syringes 17
Total 2,146
2003 International Coastal Cleanup Ohio Summary Report
The Ocean Conservancy 6

What You Can Do to Reduce Debris The U.S. Environmental Protect ion Agency (EPA) is chal lenging al l c i t izens to conserve our natural resources and save energy. I t of fers the fol lowing t ips to get you started.3 Reduce Your Packaging
Buy bulk or concentrated products when you can.
Reduce Toxicity or Learn How
Recycle your bat ter ies or use batter ies wi th reduced mercury .
Select Reusable Products
Sturdy, washable utensi ls , tableware, c loth napkins, and dishcloths can be used many t imes.
Use Durable Products
Choose furn i ture , sports equipment , toys , and tools that wi l l s tand the test of t ime.
Reuse Products
Reuse newspaper , boxes, sh ipping “peanuts ,” and bubble wrap to sh ip packages.
Recycle Automotive Products
Take car bat ter ies , ant i f reeze, and motor o i l to part ic ipat ing recycl ing centers .
Buy Products Made from Recycled Material
Many bott les , cans, cereal boxes, conta iners , and cartons are made f rom recycled mater ia l .
Compost or Learn How
Food scraps and yard waste can become natura l so i l condi t ioners .
Unfortunately, the annual number of animals entangled, injured, and killed by marine debris is unknown. The animal entanglements recorded during the ICC suggest that the numbers are extremely high. According to the UK-based research group Sea Life Surveys, scientists estimate that globally, more than one million birds and 100,000 marine mammals and sea turtles die each year from entanglement in, or ingestion of, plastics.1 We will never know exactly how many animals are affected by marine debris each year but we do know that through ICC cleanup efforts wildlife entanglement risks are reduced.
Marine debris is harmful to humans, too. In addition to the obvious dangers caused by syringes, broken glass, and similar debris, there are other, unseen threats as well. Medical and personal hygiene debris often enters the waste stream through sewer systems, which can indicate the presence of invisible pollution and pathogens. Bacteria can sicken people exposed to the contaminated water. In fact, there were at least 12,184 beach closings and advisories due to unsafe water issued across the United States in 2002.2 3 1 Sea Life Surveys, “Minke Whale-Photo Identification,”
www.sealifesurveys.co.uk/research.cfm 2 Testing the Waters 2003: A Guide to Water Quality
at Vacation Beaches. By Mark Dorfman. National Resource Defense Council. August 2003.
3 www.epa.gov/epaoswer/osw/specials/funfacts
2003 International Coastal Cleanup Ohio Summary Report
The Ocean Conservancy 7
2003 ICC — Ohio Summary Report APPENDIX-A
2004 The Ocean Conservancy. All rights reserved.
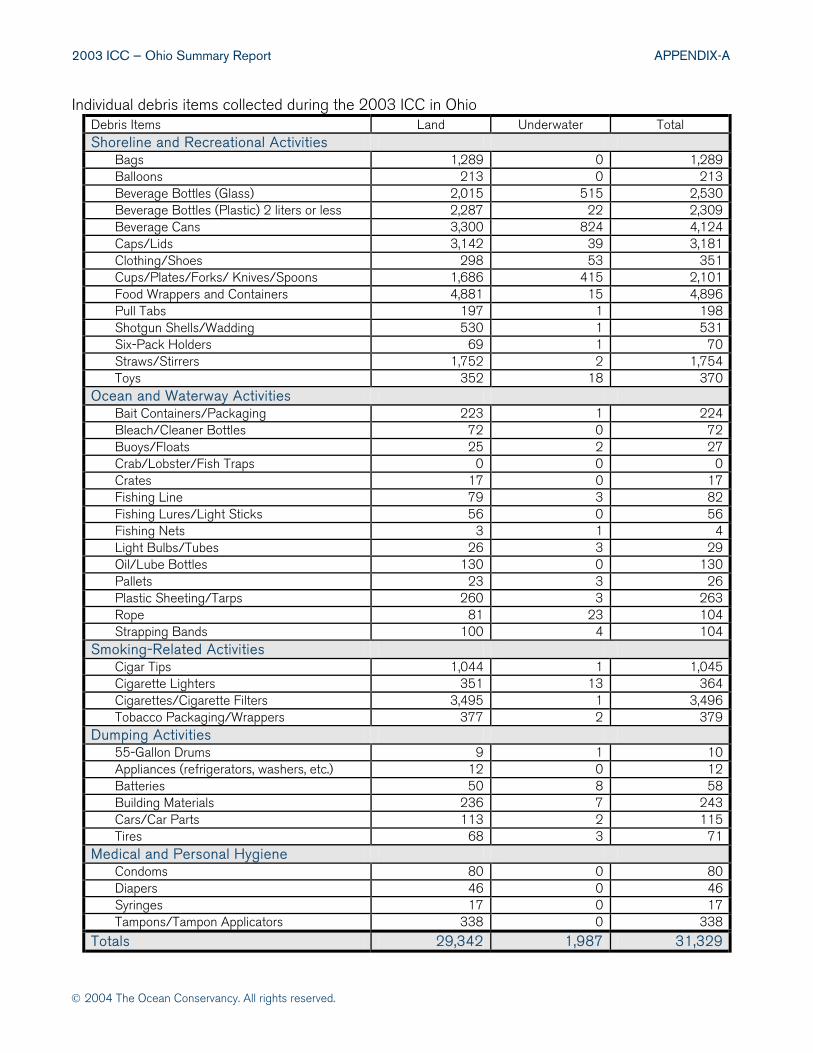
Individual debris items collected during the 2003 ICC in Ohio Debris Items Land Underwater Total Shoreline and Recreational Activities
Bags 1,289 0 1,289 Balloons 213 0 213 Beverage Bottles (Glass) 2,015 515 2,530 Beverage Bottles (Plastic) 2 liters or less 2,287 22 2,309 Beverage Cans 3,300 824 4,124 Caps/Lids 3,142 39 3,181 Clothing/Shoes 298 53 351 Cups/Plates/Forks/ Knives/Spoons 1,686 415 2,101 Food Wrappers and Containers 4,881 15 4,896 Pull Tabs 197 1 198 Shotgun Shells/Wadding 530 1 531 Six-Pack Holders 69 1 70 Straws/Stirrers 1,752 2 1,754 Toys 352 18 370
Ocean and Waterway Activities Bait Containers/Packaging 223 1 224 Bleach/Cleaner Bottles 72 0 72 Buoys/Floats 25 2 27 Crab/Lobster/Fish Traps 0 0 0 Crates 17 0 17 Fishing Line 79 3 82 Fishing Lures/Light Sticks 56 0 56 Fishing Nets 3 1 4 Light Bulbs/Tubes 26 3 29 Oil/Lube Bottles 130 0 130 Pallets 23 3 26 Plastic Sheeting/Tarps 260 3 263 Rope 81 23 104 Strapping Bands 100 4 104
Smoking-Related Activities Cigar Tips 1,044 1 1,045 Cigarette Lighters 351 13 364 Cigarettes/Cigarette Filters 3,495 1 3,496 Tobacco Packaging/Wrappers 377 2 379
Dumping Activities 55-Gallon Drums 9 1 10 Appliances (refrigerators, washers, etc.) 12 0 12 Batteries 50 8 58 Building Materials 236 7 243 Cars/Car Parts 113 2 115 Tires 68 3 71
Medical and Personal Hygiene Condoms 80 0 80 Diapers 46 0 46 Syringes 17 0 17 Tampons/Tampon Applicators 338 0 338
Totals 29,342 1,987 31,329

2003 ICC — Ohio Summary Report APPENDIX-B
2004 The Ocean Conservancy. All rights reserved.
Land Cleanups Underwater Cleanups
Ohio 2003 ICC - Sources of Marine Debris - Land and Underwater Cleanups
Ohio 2003 ICC “Top Ten” Debris Items – Land and Underwater Cleanups
Land Cleanups Only
Debris Items Amount Percent of Total
1. Food Wrappers and Containers
4,881 16.6%
2. Cigarettes/Cigarette Filters
3,495 11.9%
3. Beverage Cans 3,300 11.3% 4. Caps/Lids 3,142 10.7% 5. Beverage Bottles
(Plastic) 2 liters or less 2,287 7.8%
6. Beverage Bottles (Glass) 2,015 6.9% 7. Straws/Stirrers 1,752 6.0% 8. Cups/Plates/Forks/
Knives/Spoons 1,686 5.8%
9. Bags 1,289 4.4% 10. Cigar Tips 1,044 3.6% Totals: 24,891 85.0%
Underwater Cleanups Only
Debris Items Amount Percent of Total
1. Beverage Cans 824 41.5% 2. Beverage Bottles (Glass) 515 25.9% 3. Cups/Plates/Forks/
Knives/Spoons 415 20.9%
4. Clothing/Shoes 53 2.7% 5. Caps/Lids 39 2.0% 6. Rope 23 1.2% 7. Beverage Bottles
(Plastic) 2 liters or less 22 1.1%
8. Toys
18 0.9%
9. Food Wrappers and Containers
15 0.8%
10. Cigarette Lighters 13 0.7% Totals: 1,937 97.7%
Dumping Activities
1.7%Smoking-Related
Activities18.0%
Ocean Waterway Activities
3.7%
Medical and Personal Hygiene
1.6%
Shoreline and Recreational
Activities75.0%
Smoking-Related
Activities0.9%
Ocean Waterway Activities
2.2%
Dumping Activities
1.1%
Shoreline and Recreational
Activities95.8%