1 Third Biennial International Accounting Research Conference.

INTERNATIONAL ACCOUNTING AND BUSINESS CONFERENCE
2011
PROCEEDINGS IABC2011 Page 1
The Effects of Manager’s Opportunistic Behaviors on Earnings Management
Ehsan Kamali1
Seyyed Abbas Hashemi 2
Abstract
Purpose– The purpose of this study is to investigate the effect of opportunistic behaviors of
managers on earnings management.
Design/methodology/approach – We use gradual increasing of financial leverage, measure
of free cash flow, and company‟s growth as the proxies of manager‟s opportunistic behaviors.
In this research, three hypotheses were developed and for their validation, sample companies
are selected from the listed companies on Tehran Stock Exchange. Research period consists
of years 2001 to 2009, which are divided in to five four-year periods. Then, the sample
companies are classified into two control and test groups according to their level of financial
leverage changes. The test and control groups include the companies with an increasing
financial leverage and those with a high and constant financial leverage during the research
period, respectively.
Findings – The research results show that there is no significant difference for the rate of
earning management between companies with a constant financial leverage and those with a
gradual increasing financial leverage. Further findings show the effects of free cash flows and
company growth on managers‟ opportunistic behaviors which can be impressive on rate of
earnings management.
Originality/value – This paper has new looks at earnings management in Tehran Stock
Exchange from the perspective of management opportunistic behaviors and factors affecting
it.
Keywords – Earning Management, Managers‟ Opportunistic Behaviors, Financial Leverage,
Free Cash Flow, Growth
Paper type – Research paper
1 Phd student of Accounting, Islamic Azad University, Isfahan Sciences and Researches branch.
Email:[email protected]. Tel:00989131054518 2
Assistant professor, faculty member of Isfahan University. Email:[email protected].
Tel:00989131104158

INTERNATIONAL ACCOUNTING AND BUSINESS CONFERENCE
2011
PROCEEDINGS IABC2011 Page 2
INTRODUCTION
Net income is one of the most important items provided by accounting system that is
used by internal and external users for making economical decisions. The importance of
accounting income for users of financial information has caused the firm‟s management to
pay special attention to the amount and way of its producing and presenting. One of the
important aspects of accounting income is its role in debt contracts. The existence of debts
not only is one of the factors of making motivation for earnings management but also can
lead to decrease changes of firm‟s income and then to decrease earnings management via
decreasing opportunistic behaviors of managers. Among factors which can affect the
manager's opportunistic behaviors is the amount of free cash flow and growth opportunities
of a firm. Therefore, in this study, it is intended that beside studying the effect of gradual
increasing of financial leverage on earnings management, the effect of existing numerous
free cash flow and also company growth on earnings management would be tested. In this
study, size of firm, return on assets and firms return are used as control variables.
LITERATURE AND HYPOTHESIS DEVELOPMENT
Earnings management in accounting literature is among subjects, which are under
consideration in accounting earnings area. This subject in accounting was developed by
different knowledgeable researches since 20th
century. Every one of these researches has
engaged in the subject from special aspects and with different phrases like income
manipulation, income smoothing, and finally earnings management. In accounting literature,
different explanations have been presented, that one of them will be presented later:
“Earnings management means doing intentional steps process in frame of GAAP that
makes of managers able to optimize the reported income” (Davidson, Stickney and Weil,
1987).
One factor that can lead to make vacillation in firm‟s income is the effects of
manager's opportunistic behaviors. Manager's opportunistic behaviors mean decisions of
investment which managers make in dangerous and uncertain conditions and usually have
different result of ordinary process of firm's operations. The effects of such decisions
usually cause the business unit income to have vacillation (Jelinek, 2007). Different factors

INTERNATIONAL ACCOUNTING AND BUSINESS CONFERENCE
2011
PROCEEDINGS IABC2011 Page 3
are preparations for manager's opportunistic behaviors, or this field limits them that we will
explain the relation of some of them with earnings management later.
One of the aspects of opportunistic earnings management is to consider the effects of
financial leverage. The results of former studies like Beatty and weber (2003), Dichev and
Skinner (2002), and Sweeney (1994) show that high financial leverage potentially causes
increasing earnings management by using accruals and other income increasing accounting
choices. The reason of this work is trying to prevent offending the contents of debt
contracts. On the other hand, according to the results of the following studies, we can
conclude that considering the role of the rate of manager's opportunistic behavior gradually
increasing by financial leverage causes decreasing in earnings management.
1. The results of Jensen study (1986) show that increasing financial leverage, (because
of the pressure by debt contracts), causes decreasing the opportunity of opportunistic
earnings management. In other words, makes them more vigilant.
2. The results of Christie and Zimmerman (1994) and Easterwood (1997) studies also
show a positive relation between the amount of manager's opportunistic behavior and
earnings management because considering the high risk of such decisions, company‟s
income encounters vacillations.
In such conditions, managers, for preventing market's reactions, start earnings
management so that they could be sate from its consequences. Considering the results of
above studies, we can result that whatever the limiting factors in doing manager's
opportunistic behaviors, including the existence pressure by debt contracts and also the need
of refunding debts in expiration, are more, possibly the rate of earnings management for
decreasing the effects of income vacillations that have been caused by such risky behaviors,
would be decreased.
The high rate of free cash flow, against financial leverage, is an incentive factor in
doing manager's opportunistic behaviors. Jensen (1986) explains that the existence of free
cash flow have a high effect on the amount of manager's opportunistic behaviors. In
conditions that a firm has a high rate of free cash flow, the manager can invest rest of the
funds in different opportunities.
INTERNATIONAL ACCOUNTING AND BUSINESS CONFERENCE
2011
PROCEEDINGS IABC2011 Page 4
Considering limited investment opportunities availability, managers may get involved
in investments with returns less than the company‟s cost of capital or very risky ones.
In the presence of free cash flow, the costs imposed on stockholders in these
conditions are called "agency costs of free cash flow"(Jensen, 1986). When the firm faces
with a high amount of free cash flow, managers would show more opportunistic behaviors.
By increasing financial leverage, gradually the amount of free cash flows and consequently
the amount of manager's powers in the way of using the firm's cash funds would decreased
and it can lead to the decrease of earnings management because of decreasing the measure
of manager‟s opportunistic behaviors.
Another effective factor on the amount of manager's opportunistic behaviors is the
existence of growth opportunity for the firm. When managers handle quite a high amount of
free cash flows and there are numerous investment and growth opportunities available for
the firm, they use these cash funds in activities for expansion.
In such conditions, considering that these investments are for company growth and the
continuous of its current process, they have less risk and a return nearly like the current
return of the firm, and therefore, the income would not face with many vacillations. In the
opposite, when the investment and growth opportunities are limit, managers start
investments which are more risky and have a different result from current firm‟s return and
so income would be put up on vacillation and the managers start income smoothing to
control such vacillations which caused by risky investments (Jelinek, 2007).
HYPOTHESIS
Hypothesis 1. Earnings management in firms having gradual increasing financial leverage
is less than in firm having always high financial leverage rate.
Hypothesis 2. Earnings management in firms having gradual increasing financial leverage
and predicting high free cash flow is less than in firm having gradual increasing financial
leverage and predicting low free cash flow.
Hypothesis 3. Earnings management among firms having gradual increasing financial
leverage and predicting high free cash flow and low growth is less than in firm having
gradual increasing financial leverage and predicting high free cash flow and high growth.

INTERNATIONAL ACCOUNTING AND BUSINESS CONFERENCE
2011
PROCEEDINGS IABC2011 Page 5
METHODOLOGY
SAMPLE
The type of research in this study is descriptive- correlated and its statistical model is
multi- variant regression. To test the hypotheses, we divide the whole period of the study
into five 4-year periods and the firms are divided into test and control groups according to
the rate of financial leverage changes process in the beginning and end of every above-
mentioned periods. The sample of this study was from companies listed in Tehran stock
Exchange.
The research period of study is from 2001 to 2009 which is divided into five 4-year
periods:
First period: 2001 to 2005
Second period: 2002 to 2006
Third period: 2003 to 2007
Fourth period: 2004 to 2008
Fifth period: 2005 to 2009
In the present study, systematic elimination methodology is used to determine the
research sample. Firms having the following conditions are chosen as final sample and
others are eliminated.
1. Manufacturing firms
2. For comparability reason, the firms having fiscal year ends 29th
of Esfand.(End of
Persian year)
3. During research period, their stocks should be traded at least every 3 months in
Tehran stock Exchange.
4. By the end of each 4-year research periods, sampled firms should be active trading
in Tehran stock Exchange and its symbol shouldn't be closed.
After sample selection, test and control groups are chosen according to the following
steps:

INTERNATIONAL ACCOUNTING AND BUSINESS CONFERENCE
2011
PROCEEDINGS IABC2011 Page 6
Test group: the firms that in a 4-year research period are engaged in gradual
increasing of financial leverage.
Control group: the firms that have high rate of financial leverage both in the beginning
and end of 4-year research period, and their financial leverage rate doesn't have a
considerable growth during this 4-year period. For this, the firm's amount of financial
leverage need to be determined in the beginning and end of every period and then be
arranged in downward to upward, according to the rate of leverage. A firm would be
considered in test group only when it has one of the following conditions:
1. The firm, in the beginning of the 4-year research period, settles in the first quarter
and at the end, it settles in the third or fourth quarter.
2. The firm, in the beginning of the 3- year research period, settles in the second
quarter and at the end, it settles in the fourth quarter.
Also firms would be settled in control group if they have one of the following
conditions:
1. The firm, both in the beginning and end of 4-year research period, settles in the
fourth quarter.
2. The firm, both in the beginning and end of 4-year research period, settles in the third
quarter.
3. The firm, in the beginning of the 4-year research period settles in the third quarter,
and at the end, it settles in the fourth quarter.
For analyzing the data of the present study, descriptive and inference, statistics are
used. For explaining and summarizing the collected data, descriptive statistic (Mean,
Median, variance, etc.) and for analyzing and testing hypothesis, inference statistic
(regression analysis, test T, test F) are used.

INTERNATIONAL ACCOUNTING AND BUSINESS CONFERENCE
2011
PROCEEDINGS IABC2011 Page 7
MODELS AND VARIABLES
VARIABLES
Earnings management
The dependent variable in the present study is earning management. In this study,
modified-Jones abnormal accruals model, which has been presented by Dechow, Sloan and
Sweeney (1995), is used to measure earning management:
ititititititititit ASSETESPPEASSETESARSALESASSETESASSETESTAC ///1/ 21
(1)
where:
itTAC =difference between earnings and cash flows from operations;
itSALES = change in sales from year t-1 to year t for firm i;
itAR = change in accounts receivable from operations from year t-1 to year t for firm i;
itPPE = gross property, plant and equipment for firm i in year t;
it = residual error.
Like the original Jones model, the modified-Jones model works from the notion that
the “normal” (i.e., nondiscretionary) component of total accruals is impacted by the
economic circumstances facing the firm. As stated, the original Jones model uses two
explanatory variables, a change in sales and the level of property, plant, and equipment, to
control for these economic circumstances. A change in sales predictably impacts working
capital accounts such as accounts receivable, inventory, and accounts payable; gross
property, plant, and equipment determines depreciation expense. The modified-Jones model
differs from the original model because it assumes that management is able to exercise
discretion over the recognition of revenue on credit sales (Dechow, Sloan and Sweeney.
1995). Therefore, in the modified-Jones model, the change in accounts receivable is
subtracted from the change in sales. The residual from the model represents the abnormal, or
discretionary, accrual component. In the modified-Jones model, all variables are scaled by
beginning-of-year total assets.(Jelinek, 2007)

INTERNATIONAL ACCOUNTING AND BUSINESS CONFERENCE
2011
PROCEEDINGS IABC2011 Page 8
Leverage
As stated, we strive to examine changes in earnings management across leverage-
increasing firms, relative to consistently highly leveraged firms. As described previously,
we classify a firm as a leverage-increasing firm if the firm is in one of the two lower
quartiles of the sample leverage distribution at the beginning of a sample period and moves
up at least two quartiles by the sample-period end. We classify a firm as a control firm if it
is in either the third or fourth quartile of the sample leverage distribution at both the
beginning and end of a sample period. To differentiate between leverage-increasing firms
and control firms, we use an indicator variable, LEVING, which is coded as 1 if a firm is a
leverage-increasing firm and 0 if a firm is a consistently highly leveraged, control firm. We
measure leverage following Givoly et al. (1992) as the ratio of long-term debt to the book
value of equity. We use this book-value leverage measure because it should better reflect a
firm‟s actual level of debt than a market-value debt measure, which is influenced by stock
price changes.
Free cash flow
As part of our examination of the impact of increased leverage on earnings
management, we test whether a firm‟s level of FCF is a factor that influences the
leverage/earnings management relation. We measure FCF at the beginning of a sample
period because, according to Jensen (1986), leverage increases discipline management in ex-
ante high FCF firms. We define FCF according to Lehn and Poulsen (1989) as follows:
MKTEQCOMDIVPFDDIVINTEXPTAXINCFCF /
where:
INC = operating income before depreciation;
TAX = total income taxes;
INTEXP = gross interest expense on short- and long-term debt;
PFDDIV = total amount of preferred dividend requirement on cumulative preferred
stock and dividends paid on noncumulative preferred stock;
COMDIV = total dollar amount of dividends declared on common stock;

INTERNATIONAL ACCOUNTING AND BUSINESS CONFERENCE
2011
PROCEEDINGS IABC2011 Page 9
MKTEQ = number of common shares outstanding multiplied by the share closing
price.
To differentiate between firms with ex-ante high FCF and firms with ex-ante low
FCF, we use an indicator variable, HIGHFCF, which is coded as 1 if a firm‟s beginning
FCF is above the median FCF for its respective sample period and 0 otherwise. (Jelinek,
2007)
Growth
As noted, for high FCF, leverage-increasing firms, we are interested in the impact of
growth on the leverage/earnings management relation. Consistent with FCF, we measure
growth at the beginning of each sample period because for high FCF, leverage-increasing
firms, the decline in earnings management is greater for firms with low growth opportunities
ex-ante.
Based on the Myers (1977) definition of growth opportunities as the difference
between firm value and existing assets, we measure growth as the market-to-book assets
ratio (MTB).
The MTB ratio utilizes the market value of assets as a proxy for firm value and the
book value of assets as a proxy for existing assets. A higher MTB ratio represents greater
growth opportunities. We define MTB according to Gaver and Gaver (1993) as follows:
BVAMVAMTB /
where:
MVA = market value of assets, calculated as assets - total common equity + market
value of equity;
BVA = book value of assets.
To differentiate between initially low-growth firms and initially high-growth firms, we
use an indicator variable, LOWGROWTH, which is coded as 1 if a firm‟s beginning MTB
ratio is below the median MTB ratio for its respective sample period and 0 otherwise.
Control variables
In this study it was tried that beside independent variables, some other variables that
can affect the rate of contractual items or with affecting other independent variables can

INTERNATIONAL ACCOUNTING AND BUSINESS CONFERENCE
2011
PROCEEDINGS IABC2011 Page 10
affect the results of the study, enter the models as control variable. Because we are
interested in ending-sample period accrual measures, we measure all control variables as of
the end of a sample period. The mentioned variables including the following items:
Size
One of the subjects that can affect contractual items is the size of firm. The results of
Lee and Mande (2003) study show the positive relation between the size of firm and
income-increasing discretionary accruals. Therefore, the size of firm entered the models of
the study as a control variable. In this study, SIZE is measured as the logarithm of total
assets.
ROA and ROI
We include two other measures of firm performance because abnormal accruals may
result from unusual past or current performance (Dechow et al. 2003). Based on Kothari,
Leone, and Wasley (2005), we control for lagged return on assets ( 1tROA ). Following
Butler et al. (2004), we measure 1tROA as the ratio of prior year income before
extraordinary items to total assets. Also, we control for a firm‟s stock return, measured as
the cumulative annual return over the previous year ( 1tRETURN ).
Models
For testing the first hypothesis of the study, model (2) has been used as follow:
)1(4)1(3210 tt
RETURNROASIZELEVINGACC (2)
where:
ACC = modified-Jones abnormal accruals (MJAC) at the end of a sample period;
LEVING = 1 if a firm undergoes a leverage increase during a sample period and 0 if a
firm is consistently highly leveraged;
SIZE = logarithm of assets at the end of a sample period;
1tROA = prior-year income before extraordinary items scaled by total assets, as of the
end of a sample period;
1tRETURN = prior-year cumulative stock return, as of the end of a sample period;

INTERNATIONAL ACCOUNTING AND BUSINESS CONFERENCE
2011
PROCEEDINGS IABC2011 Page 11
Considering the first hypothesis, increasing financial leverage leads to decrease
earnings management only when 1 is negative.
For testing the second hypothesis, model (3) is used as follow:
)1(5)1(43)3(210 *
tttt RETURNROASIZEHIGHFCFLEVINGLEVINGACC
(3)
where:
HIGHFCF = 1 if the beginning of sample period FCF measure is above the sample
median and 0 otherwise;
All other variables are as previously defined.
The test of hypothesis 2 is based on 2 , the coefficient on the interaction term
LEVING*HIGHFCF, in equation (3). This coefficient captures the incremental impact of
increased leverage on end-of-sample period earnings management at ex-ante high FCF firms
relative to ex-ante low FCF firms. Consistent with hypothesis 2, 2 should be negative.
Finally, we test hypothesis 3. Recall that this hypothesis states that the decline in
earnings management at high FCF, leverage-increasing firms is greater for ex-ante low-
growth firms than for ex-ante high-growth firms. To test this hypothesis, we estimate the
following model:
)1(6)1(54
)3()3(3)3(210 ***
tt
ttt
RETURNROASIZE
LOWGROWTHHIGHFCFLEVINGHIGHFCFLEVINGLEVINGACC
(4)
where:
LOWGROWTH = 1 if the beginning of sample period market-to-book assets ratio is
below the sample median and 0 otherwise;
All other variables are as previously defined.
The test of hypothesis 3 is based on LEVING*HIGHFCF*LOWGROWTH, 3 , in
equation (4). This coefficient captures the incremental impact of increased leverage on end-

INTERNATIONAL ACCOUNTING AND BUSINESS CONFERENCE
2011
PROCEEDINGS IABC2011 Page 12
of-sample period earnings management at ex-ante high FCF, low-growth firms relative to
ex-ante high FCF, high-growth firms. Consistent with hypothesis 3, 3 should be negative.
RESULTS
Descriptive Statistics
Table 1 presents descriptive statistics for sample firms:
ACC LEVING LEVING*
HIGHFCF
LEVING*
HIHFCF*
LOWGROTH
RETURN ROA SIZE
Mean 0.09 0.26 0.15 0.05 0.21 0.1 5.5
Median 0.04 0 0 0 0.06 0.08 5.46
MAX 0.66 1 1 1 4.8 0.52 7.75
MIN -0.21 0 0 0 -0.57 -0.31 4.18
Std.Dev 0.1 0.48 0.36 0.22 0.63 0.12 0.66
Testing the first hypothesis
For testing the first hypothesis of the study, determining the sign of 1 is used in
model (2) that the obtained results of its testing are presented in Table (2):
Table 2: Regression Model examining the hypothesis 1.
)1(4)1(3210 tt
RETURNROASIZELEVINGACC
0
1 2 3 4
Coefficient 0.248* -0.019 -0/027* -0.091 0.014
t-statistics 5.8 -1.6 -3.7 -1.9 1.5
P-value 0.000 0.090 0.000 0.05 0.12
2R Adjusted 2R F
0.59 0.58 5.44
*significant at p < .05
As the estimated regression shows, the mentioned index ( 1 ) is negative but in the
certainty level 95% is not significant ( 1 = -0.019 and t = -1/6). So, the hypothesis H0 isn't

INTERNATIONAL ACCOUNTING AND BUSINESS CONFERENCE
2011
PROCEEDINGS IABC2011 Page 13
rejected. Non-rejecting of H0 hypothesis means that there isn't a significant difference
between the rate of earnings management in firms with increasing the rate of financial
leverage and firms with consistently high rate of financial leverage. In the first hypothesis, it
is predicted that despite the fact that being the financial leverage high lead to increase
earnings management, the firms that gradually engage in increasing financial leverage
because of the role of manager's opportunistic behaviors in earnings management, would
have less earnings management with decreasing the rate of such management behaviors.
Considering the obtained results of testing the first hypothesis, we can conclude that only
gradual increasing of financial leverage, the effect of decreasing manager's opportunistic
behaviors on need to managing earnings for keeping the conditions of debt contract doesn't
dominate and earnings management doesn't decrease.
Testing the second hypothesis
For testing the second hypothesis of the study, determining the sign of 2 is used in
model (3). The obtained results of testing the mentioned model are summarized in Table (3):
Table 3: Regression Model examining the hypothesis 2.
)1(5)1(43)3(210 *
ttt RETURNROASIZEHIGHFCFLEVINGLEVINGACC
0 1 2 3 4 5
Coefficient 0.258*
0.003 0.056* -0.029* -0.064 0.014
t-statistic 6.08 0.27 -4.15 -4.12 -1.31 1.65
P-value 0.000 0.786 0.000 0.000 0.188 0.098
2R Adjusted
2R F
0.54 0.52 43.7
*significant at p < .05
The results of estimating regression show that the sign of LEVING*HIGHFCF is
negative significantly ( 2 =0.056 and t=-4/15). So there aren't enough evidences for
accepting H0 hypothesis and it would be rejected. Rejecting H0 hypothesis shows that
earning management in the firm having increasing rate of leverage and predicting high free
cash flow, is less than firms with increasing leverage and predicting low free cash flow. The
comparison of the obtained results from the first and second hypotheses shows that the
INTERNATIONAL ACCOUNTING AND BUSINESS CONFERENCE
2011
PROCEEDINGS IABC2011 Page 14
effect of the rate of free cash flow in manager's opportunistic behaviors is considerable.
According to what was mentioned, it becomes clear that if mangers face with a considerable
amount of free cash flow, possibly they start investments which change the firm's income
and for preventing the bad effects of these changes, they start earnings management in
market. If in this condition, the firm engages in increasing debts, the rate of free cash flow
that is under the control of the manager, will be decreased and so the range of opportunistic
behaviors and risky investments will be decreased too; that in turn, causes decreasing of
earnings management.
Testing the third hypothesis
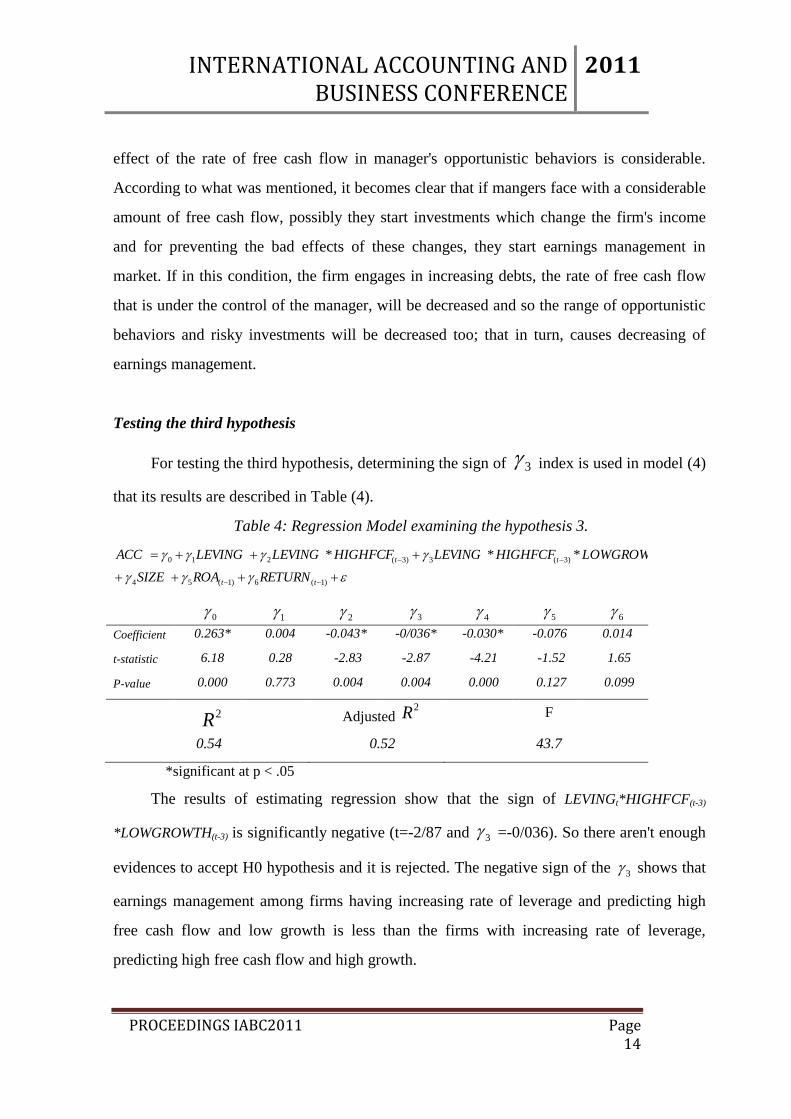
For testing the third hypothesis, determining the sign of 3 index is used in model (4)
that its results are described in Table (4).
Table 4: Regression Model examining the hypothesis 3.
)1(6)1(54
)3()3(3)3(210 ***
tt
ttt
RETURNROASIZE
LOWGROWTHHIGHFCFLEVINGHIGHFCFLEVINGLEVINGACC
0 1 2 3
4 5 6 Coefficient 0.263* 0.004 -0.043* -0/036* -0.030* -0.076 0.014
t-statistic 6.18 0.28 -2.83 -2.87 -4.21 -1.52 1.65
P-value 0.000 0.773 0.004 0.004 0.000 0.127 0.099
2R Adjusted
2R F
0.54 0.52 43.7
*significant at p < .05
The results of estimating regression show that the sign of LEVINGt*HIGHFCF(t-3)
*LOWGROWTH(t-3) is significantly negative (t=-2/87 and 3 =-0/036). So there aren't enough
evidences to accept H0 hypothesis and it is rejected. The negative sign of the 3 shows that
earnings management among firms having increasing rate of leverage and predicting high
free cash flow and low growth is less than the firms with increasing rate of leverage,
predicting high free cash flow and high growth.
INTERNATIONAL ACCOUNTING AND BUSINESS CONFERENCE
2011
PROCEEDINGS IABC2011 Page 15
Confirming the third hypothesis emphasizes on the role the amount of investment and
growth opportunities in the rate of manager's opportunistic behaviors and consequently on
earnings management. When a firm encounters with suitable investment and growth
opportunities which are in the range of the firm's current operation process and on the other
hand, it has enough free cash flow under his control, it can start investments that have a
proportional result with the current result and then it doesn't make income change. Under
such conditions, earnings management is not affected by rate of manager's opportunistic
behaviors.
But when a firm's manager isn't faced with considerable rate of free cash flow with
enough and suitable growth opportunities, he or she starts investments that cause the income
change and then he or she would have to manage earnings. Now if such firm engages in
increasing financial leverage, considering the need to repayment of debts, the rate of free
cash flow and then risky investments will be decreased that, in turn, causes the decrease of
needing to earnings management.
CONCLUSION
Results of testing the first hypothesis show that only gradual increase in financial
leverage is not sufficient to decrease in manager's opportunistic behaviors and need to
manage earnings. This result is corresponding to that of Jelinek's study (2007).
Considering the results of testing the second and third hypotheses, we can conclude
that free cash flow and company growth are impressive factors in the rate of manager's
opportunistic behaviors and considering to the role of such behaviors in earning
management can affect the rate of earning management. The high rate of free cash flow and
also the existence of low investment and growth opportunities lead managers toward risky
investments that change the earning and therefore make it smooth by using earning
management technics. But when these companies gradually engage in increasing financial
leverage, debts act as a limiting factor in manager's opportunistic behaviors, and decrease
the rate that cause decreasing earning changes because of these behaviors and decreasing
earning management. Results of testing the above mentioned hypotheses correspond to the
results of Jelinek research (2007) and also Jensen (1986).

INTERNATIONAL ACCOUNTING AND BUSINESS CONFERENCE
2011
PROCEEDINGS IABC2011 Page 16
RESOURCES:
Beatty, A. and Weber, J. (2003) „The effects of debt contracting on voluntary accounting method
changes‟, Accounting Review, vol. 78, no. 1, pp. 119-142.
Butler, M., Leone, A.J. and Willenborg, M. (2004) „An empirical analysis of auditor reporting
and its association with abnormal accruals‟, Journal of Accounting and Economics,vol.37
no.2, pp. 139- 166.
Christie, A. and Zimmerman, J. (1994) „Efficient and opportunistic choices of accounting procedures:
corporate control contests‟, Accounting Review, vol. 69, no.4, pp. 539-566.
Davidson, S., Stickney, C. and Weil, R. L. (1987), Accounting: The language of business, T.
Horton, Sun Lakes, Ariz.
Dechow, P., Richardson, S. and Tuna, A.I. (2003) „Why are earnings kinky? An examination
of the earnings management explanation‟, Review of Accounting Studies. vol.8, no.2-3, pp.
355-384.
Dechow, P., Sloan, R. and Sweeney, A. (1995) „Detecting earnings management‟, The
Accounting Review, vol.70, no.2, pp. 193-225.
Dichev, I. and Skinner, D. (2002) „Large-sample Evidence on the Debt Covenant Hypothesis‟, Journal
of Accounting Research, vol. 40, no. 4, pp. 1091-1123.
Easterwood, C. (1997) „Takeovers and Incentives for Earnings Management: An Empirical Analysis‟,
Journal of Applied Business Research, vol. 14, no. 1, pp. 29-47.
Ewert, R. and Wagenhofer, A. (2005) „Economic Effects of Tightening Accounting Standards to
Restrict Earnings Management‟, Accounting Review, vol. 80. no. 3, pp. 181-195.
Gaver, J.J. and Gaver, K.M. (1993) „Additional evidence on the association between
investment opportunity set and corporate financing, dividend, and compensation policies‟,
Journal of Accounting and Economics, vol.16, no.1-3, pp. 126-160.

INTERNATIONAL ACCOUNTING AND BUSINESS CONFERENCE
2011
PROCEEDINGS IABC2011 Page 17
Givoly, D., Hayn, C., Ofer, A.R. and Sarig, O. (1992) „Taxes and capital structure: Evidence
from firms‟ response to the Tax Reform Act of 1986‟, Review of Financial Studies. vol.5,
no.2, pp.331-355.
Jelinek, K. (2007) „The Effect of Leverage Increases on Earnings Management‟, Journal of Business &
Economic Studies, vol. 13, no. 2, pp. 24-46.
Jensen, M. C. (1986) „Agency Costs of Free cash Flow, Corporate Finance and Takeovers‟, American
Economic Review, vol. 76, no. 2, pp. 323-329.
Kothari, S.P., Leone, A.J. and Wasley, C.E. (2005) „Performance matched discretionary
accrual measures‟, Journal of Accounting and Economics, vol. 39, no.1, pp.163-197.
Lee, H.Y. and Mande, V. (2003) „The effect of the Private Securities Litigation Reform Act of 1995 on
accounting discretion of client managers of Big 6 and Non-Big 6 Auditors‟, Auditing: A Journal of
Practice and Theory, vol. 22, no. 1, pp. 93-108.
Lehn, K. and Poulsen, A. (1989) „Free cash flow and stockholder gains in going private
transactions‟, Journal of Finance, vol.44, no.3, pp. 771-787.
Myers, S. (1977) „Determinants of corporate borrowing‟, Journal of Financial Economics,
vol.5, pp. 147-175.
Sweeney, A. (1994) „Debt Covenant Violations and Manager‟s Accounting Responses‟, Journal of
Accounting and Economics, Vol. 17, Vol. 3, pp. 281-308.