INTERNATIO NAL AIRWAYS VOLCANO WATCH … · 2011-12-29 · docx NAL AIRW Dak ration of the rovement...
19
(19 pages) IAVWOPSG INTE Agenda I 1. IN 1.1 air traffic The Toul based on t 1.2 increasing Atlantic o 1.3 within its exist betw satellite d G.6.IP.012.5.en. ERNATIO Item 5: Ope 5.2: Imp THA CONCEN Taking and V to user more c benefi NTRODUCT After t management ouse and Lo two, then thre The e g since then, ocean. Toulou area of respo ween the two data, somethin docx NAL AIRW Dak eration of the provement of INTERCOM AT INCLUD NTRATION g examples fr AA (volcanic rs, this paper conservative ting from the TION the eruption o t (ATM) in ca ndon VAAC ee thresholds xperience in with the rec use VAAC p onsibility and o products. T ng that direct m WAYS VO (IAV SIXT kar, Senegal, e IAVW f the format MPARISON DE OBSERV CHARTS FR (Presented by SU rom the erupt c ash advisory shows that th (i.e. produces e expertise of of Eyjafjallaj ase of volcani s made deve correspondin n providing u cent volcanic roduced both noticed that d This is becau modelling ou OLCANO W VWOPSG) TH MEETING 19 to 23 Sep and content N OF DANGE VATIONAL D ROM DIREC y France and UMMARY ions for whic y) have been he direct conc s large areas) forecasters an ökull in Apri ic ash led to a elopments to ng to HIGH, M users with p c activity in h VAA and c differences an use the VAA utputs (i.e. con WATCH O ) G tember 2011 of all volcan ER AREA IN DATA COM CT MODEL Canada) ch both concen produced an centration cha than the one nd satellite ob il 2010, chan a new requirem produce volc MEDIUM and ure model c Europe, the oncentrations nd sometimes s from Toulo ncentration ch OPERATIO 1 nic ash relate N VAAs MPARED TO LLING OUTP ntrations char nd disseminat arts approach based on VA bservations. ges in the co ment for the E canic ash con d LOW conta concentrations Middle East s charts for v s apparent inc ouse VAAC harts) do not. IA12/ONS GROU d messages O PUTS rts ed is AA ntingency pla European VA ncentrations c amination. s charts has t and in the olcanic ash c consistencies take into ac VWOPSG/6- 9/11 UP an for AACs. charts been south clouds could ccount -IP/12
-
Upload
duongthien -
Category
Documents
-
view
212 -
download
0
Transcript of INTERNATIO NAL AIRWAYS VOLCANO WATCH … · 2011-12-29 · docx NAL AIRW Dak ration of the rovement...

(19 pages) IAVWOPSG
INTE
Agenda I
1. IN
1.1 air traffic The Toulbased on t
1.2 increasingAtlantic o
1.3 within its exist betwsatellite d
G.6.IP.012.5.en.
ERNATIO
Item 5: Ope5.2: Imp
THACONCEN
Takingand Vto usermore cbenefi
NTRODUCT
After tmanagementouse and Lotwo, then thre
The eg since then, ocean.
Toulouarea of respo
ween the twodata, somethin
docx
NAL AIRW
Dak
eration of theprovement of
INTERCOMAT INCLUDNTRATION
g examples frAA (volcanicrs, this paper conservative ting from the
TION
the eruption ot (ATM) in candon VAACee thresholds
xperience inwith the rec
use VAAC ponsibility and o products. Tng that direct m
WAYS VO(IAV
SIXT
kar, Senegal,
e IAVW f the format
MPARISONDE OBSERV
CHARTS FR
(Presented by
SU
rom the eruptc ash advisoryshows that th(i.e. produces
e expertise of
of Eyjafjallajase of volcanis made devecorrespondin
n providing ucent volcanic
roduced bothnoticed that d
This is becaumodelling ou
OLCANO WVWOPSG)
TH MEETING
19 to 23 Sep
and content
N OF DANGEVATIONAL D
ROM DIREC
y France and
UMMARY
ions for whicy) have beenhe direct concs large areas) forecasters an
ökull in Apriic ash led to aelopments to ng to HIGH, M
users with pc activity in
h VAA and cdifferences an
use the VAAutputs (i.e. con
WATCH O)
G
tember 2011
of all volcan
ER AREA INDATA COMCT MODEL
Canada)
ch both concen produced ancentration chathan the one
nd satellite ob
il 2010, chana new requiremproduce volc
MEDIUM and
ure model cEurope, the
oncentrationsnd sometimess from Touloncentration ch
OPERATIO
1
nic ash relate
N VAAs MPARED TOLLING OUTP
ntrations charnd disseminatarts approach based on VA
bservations.
ges in the coment for the Ecanic ash cond LOW conta
concentrationsMiddle East
s charts for vs apparent incouse VAAC harts) do not.
IAV12/9
ONS GROU
d messages
O PUTS
rts ed is
AA
ntingency plaEuropean VAncentrations camination.
s charts has t and in the
olcanic ash cconsistencies
take into ac
VWOPSG/6-9/11
UP
an for AACs. charts
been south
clouds could
ccount
-IP/12

IAVWOPSG/6-IP/12
- 2 -
2. DISCUSSION
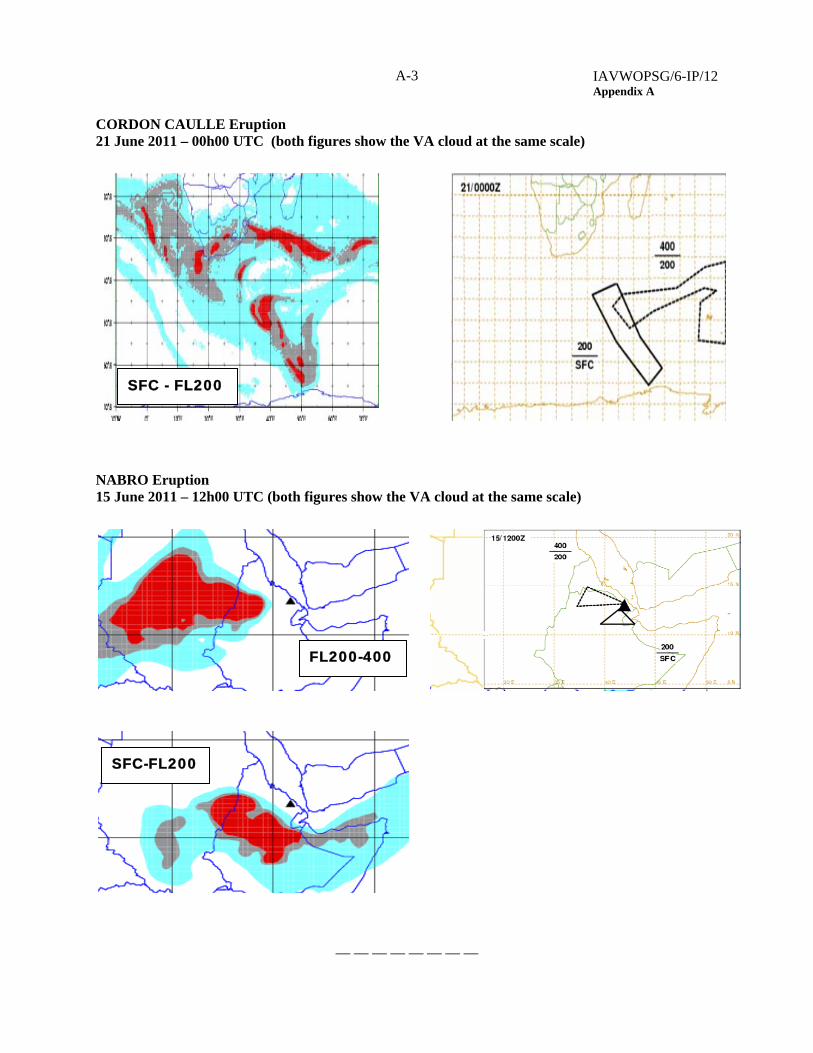
2.1 During the Cordon Caulle eruption in 2011, and the Nabro eruption in Eritrea, both concentrations charts and VAA/VAG were issued by the Toulouse VAAC.
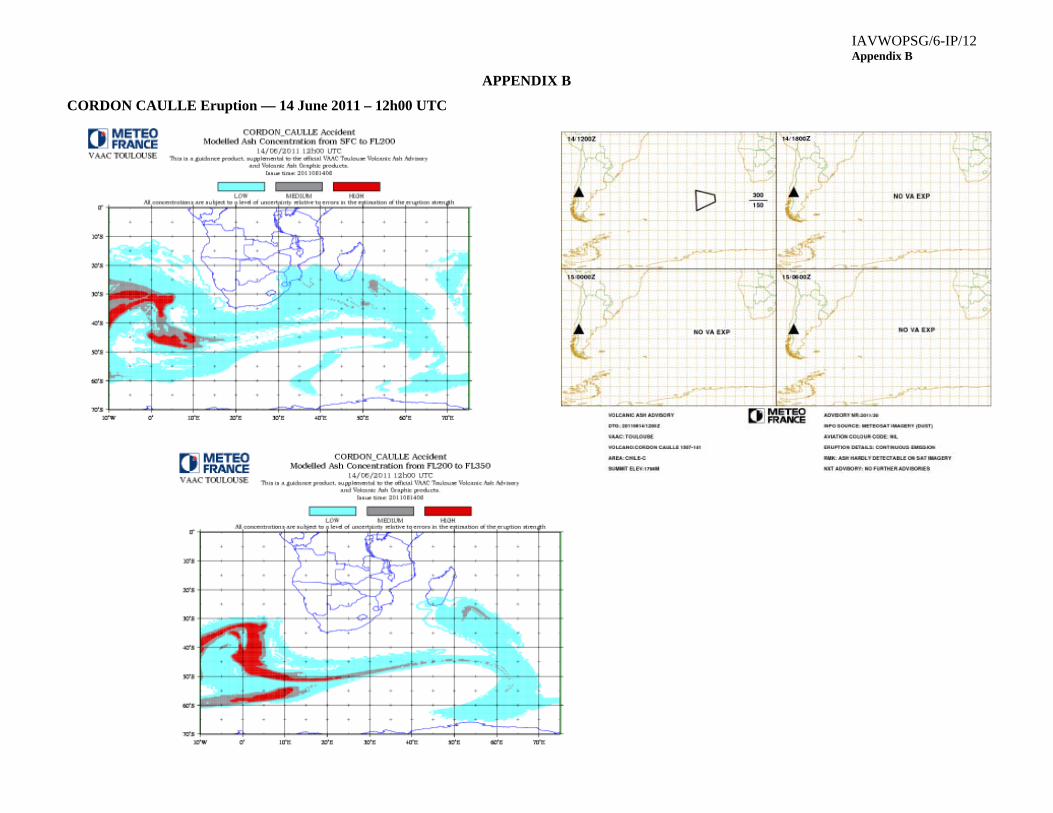
2.2 The concentrations charts were directly drawn from the METOFRANCE dispersion model MOCAGE, initialised with all information available at that time (volcanologists, discussion groups, etc).
2.3 VAA and VAG were based predominantly on satellite imagery for the observation part and integrated the motion indicated by the dispersion model for the forecast part (+6, +12, +18) as well as the synoptic meteorological features observed on METEOSAT imagery.
2.4 Appendix A shows both the first panel (observed or estimated volcanic ash cloud) of the VAG for a given date positioned in front of the corresponding(s) concentrations charts, reduced to the same scale for a more intuitive comparison.
2.5 Appendix B shows the original files (VAG and concentrations charts as produced and disseminated) that were used for this comparison.
2.6 Appendix C shows another example produced by VAAC Montréal for the Grimsvötn eruption in May 2011. It clearly shows that adjusting direct modelling outputs (specific concentration charts) with observational data (satellite data, AIREP, etc.) produces a better VAA/VAG than using only pre-determined concentration values.
2.7 It is clear from all the examples given in Appendices A, B and C that the “danger area” (described as the MEDIUM/HIGH contamination of the concentration charts, not to mention the LOW) is often larger than the area described as contaminated (without reference to a numerical value) in the VAAs that integrate observations. This makes the pure model predictions more conservative (i.e. larger areas) which is not good for aviation.
2.8 The group may wish to note that no reports of VA encounter were received by the Toulouse VAAC during the duration of issuance of VAA and concentrations charts. Many AIREP of sulphur smell and yellowish clouds (sulphate aerosols) were received by VAAC Montreal over Canadian airspace during the Grimsvötn event which helped define the location of the volcanic cloud.
2.9 The examples are given in Appendices A, B and C of this paper.
3. ACTION BY THE IAVWOPSG
3.1 The IAVWOPSG is invited to note the information in this paper.
— — — — — — — —

IAVWOPSG/6-IP/12 Appendix A
APPENDIX A
CORDON CAULLE Eruption 14 June 2011 – 12h00 UTC (both figures show the VA cloud at the same scale)
CORDON CAULLE Eruption 16 June 2011 – 06h00 UTC (both figures show the VA cloud at the same scale)
FL200-350
FL200-350

IAVWOPSG/6-IP/12 Appendix A
A-2
CORDON CAULLE Eruption 16 June 2011 – 18h00 UTC (both figures show the VA cloud at the same scale)
CORDON CAULLE Eruption 20 June 2011 – 12h00 UTC (both figures show the VA cloud at the same scale)
SFC - FL200
FL200-350
IAVWOPSG/6-IP/12 Appendix A
A-3
FL200-400
CORDON CAULLE Eruption 21 June 2011 – 00h00 UTC (both figures show the VA cloud at the same scale)
NABRO Eruption 15 June 2011 – 12h00 UTC (both figures show the VA cloud at the same scale)
— — — — — — — —
SFC-FL200
SFC - FL200
IAVWOPSG/6-IP/12 Appendix B
APPENDIX B
CORDON CAULLE Eruption — 14 June 2011 – 12h00 UTC

IAVWOPSG/6-IP/12 Appendix B
B-2
CORDON CAULLE Eruption — 16 June 2011 – 06h00 UTC

IAVWOPSG/6-IP/12 Appendix B
B-3
CORDON CAULLE Eruption — 16 June 2011 – 18h00 UTC

IAVWOPSG/6-IP/12 Appendix B
B-4
CORDON CAULLE Eruption — 20 June 2011 – 12h00 UTC

IAVWOPSG/6-IP/12 Appendix B
B-5
CORDON CAULLE Eruption — 21 June 2011 – 00h00 UTC

IAVWOPSG/6-IP/12 Appendix B
B-6
NABRO Eruption — 15 June 2011 – 12h00 UTC
— — — — — — — —
IAVWOPSG/6-IP/12 Appendix C
APPENDIX C
GRIMSVÖTN ERUPTION: A PERSPECTIVE FROM VAAC MONTREAL ON 24-26 MAY 2011 REGARDING THE IMPORTANCE OF
ADJUSTING DIRECT MODELLING OUTPUTS WITH SATELLITE DATA AND AIREP TO PRODUCE THE VAA/VAG
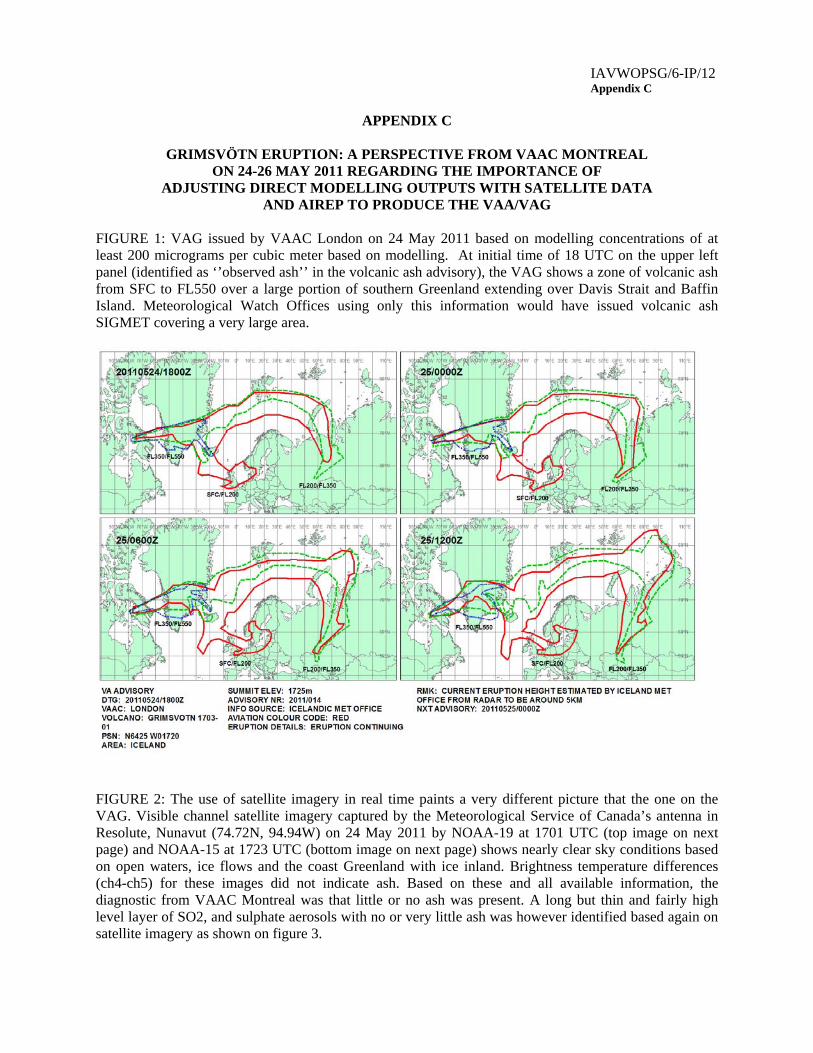
FIGURE 1: VAG issued by VAAC London on 24 May 2011 based on modelling concentrations of at least 200 micrograms per cubic meter based on modelling. At initial time of 18 UTC on the upper left panel (identified as ‘’observed ash’’ in the volcanic ash advisory), the VAG shows a zone of volcanic ash from SFC to FL550 over a large portion of southern Greenland extending over Davis Strait and Baffin Island. Meteorological Watch Offices using only this information would have issued volcanic ash SIGMET covering a very large area.
FIGURE 2: The use of satellite imagery in real time paints a very different picture that the one on the VAG. Visible channel satellite imagery captured by the Meteorological Service of Canada’s antenna in Resolute, Nunavut (74.72N, 94.94W) on 24 May 2011 by NOAA-19 at 1701 UTC (top image on next page) and NOAA-15 at 1723 UTC (bottom image on next page) shows nearly clear sky conditions based on open waters, ice flows and the coast Greenland with ice inland. Brightness temperature differences (ch4-ch5) for these images did not indicate ash. Based on these and all available information, the diagnostic from VAAC Montreal was that little or no ash was present. A long but thin and fairly high level layer of SO2, and sulphate aerosols with no or very little ash was however identified based again on satellite imagery as shown on figure 3.

IAVWOPSG/6-IP/12 Appendix C
C-2
NOAA-19 imagery in the visible band valid 24 May at 1701 UTC
NOAA-15 imagery in the visible band valid 24 May at 1723 UTC

IAVWOPSG/6-IP/12 Appendix C
C-3
FIGURE 3: NOAA-15 imagery in the visible band valid 25 May at 1009Z (top) and 1346 UTC (bottom) showing a high level cloud of sulphate aerosols / SO2 that contained very little or no ash based on ch4-ch5 differences.
IAVWOPSG/6-IP/12 Appendix C
C-4
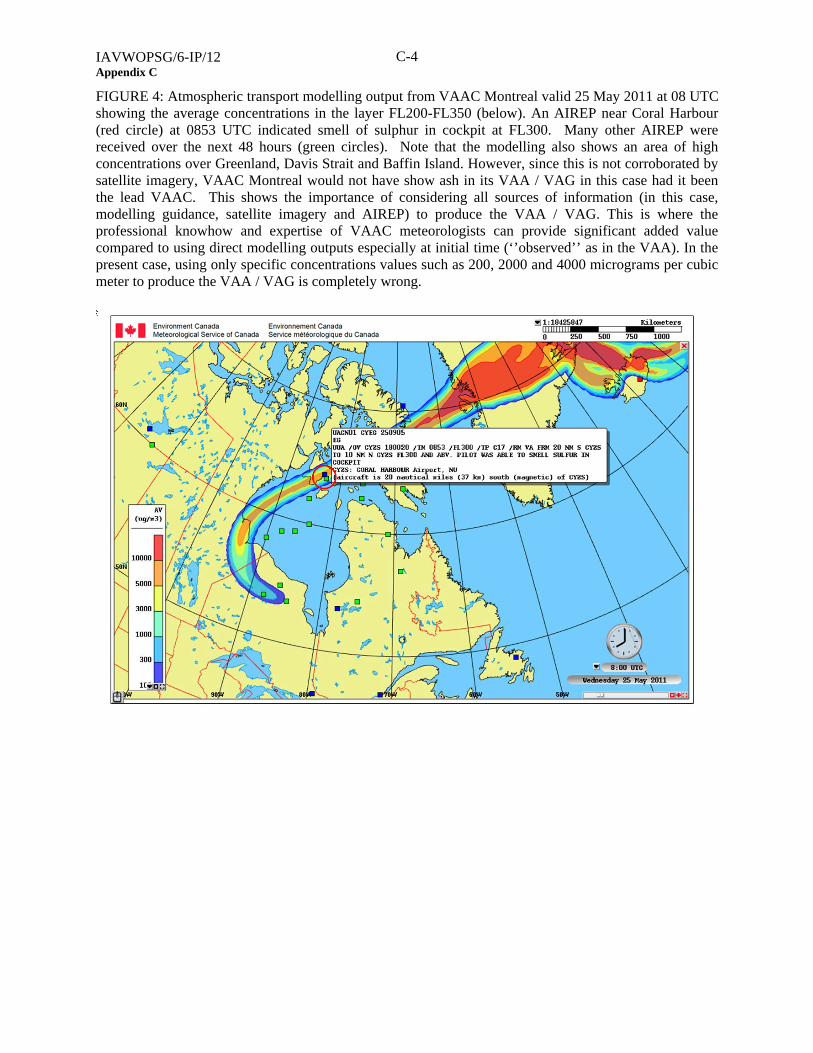
FIGURE 4: Atmospheric transport modelling output from VAAC Montreal valid 25 May 2011 at 08 UTC showing the average concentrations in the layer FL200-FL350 (below). An AIREP near Coral Harbour (red circle) at 0853 UTC indicated smell of sulphur in cockpit at FL300. Many other AIREP were received over the next 48 hours (green circles). Note that the modelling also shows an area of high concentrations over Greenland, Davis Strait and Baffin Island. However, since this is not corroborated by satellite imagery, VAAC Montreal would not have show ash in its VAA / VAG in this case had it been the lead VAAC. This shows the importance of considering all sources of information (in this case, modelling guidance, satellite imagery and AIREP) to produce the VAA / VAG. This is where the professional knowhow and expertise of VAAC meteorologists can provide significant added value compared to using direct modelling outputs especially at initial time (‘’observed’’ as in the VAA). In the present case, using only specific concentrations values such as 200, 2000 and 4000 micrograms per cubic meter to produce the VAA / VAG is completely wrong.

IAVWOPSG/6-IP/12 Appendix C
C-5
FIGURE 5: A few AIREP over Canada up to 16 UTC on 25 May 2011

IAVWOPSG/6-IP/12 Appendix C
C-6
FIGURE 6: VAAC London VAG valid starting 25 May at 06 UTC (upper left panel of top image) and based directly on modelled ash concentrations (bottom image) from FL000 to FL200

IAVWOPSG/6-IP/12 Appendix C
C-7
FIGURE 7: VAAC London VAG valid starting 25 May at 06 UTC (upper left panel of top image) and based directly on modelled ash concentrations (bottom image) from FL200 to FL350

IAVWOPSG/6-IP/12 Appendix C
C-8
FIGURE 8: VAAC London VAG valid starting 25 May at 06 UTC (upper left panel of top image) and based directly on modelled ash concentrations (bottom image) from FL350 to FL550
— END —