Internal hive temperature as a means of monitoring honey ... · Internal hive temperature as a...
15
Internal hive temperature as a means of monitoring honey bee colony health in a migratory beekeeping operation before and during winter William G. MEIKLE , Milagra WEISS , Patrick W. MAES , William FITZ , Lucy A. SNYDER, Tim SHEEHAN, Brendon M. MOTT, Kirk E. ANDERSON Carl Hayden Bee Research Center, 2000 E. Allen Rd, Tucson, AZ 85719, USA Received 4 November 2016 – Revised 27 March 2017 – Accepted 20 April 2017 Abstract – Internal temperatures of honey bee hives kept at different sites in North Dakota were monitored before and during winter to evaluate the effects of treatment, in the form of exposure to commercial pollination, and location on colony health. In October, hives exposed to commercial pollination during the summer had fewer adult bees and less brood than hives kept near natural forage, as well as lower average temperatures throughout winter. Within-day temperature variability was higher among hives exposed to commercial agriculture than for those kept near natural forage, indicating reduced temperature control. Fungicides, insecticides, varroacides, and an herbicide were detected in bee bread and wax samples; no major differences were observed either in the diversity or in the concentrations of agrochemicals with the exception of chlorpyrifos at one site. Varroa and Nosema densities were low overall. Data from the same site used in successive years showed significantly more brood the first year, as well as lower temperature variability; high levels of chlorpyrifos were detected in bee bread of colonies in the second year. Colony average temperature and temperature variability were informative with respect to colony phenology and post-winter status. Hive temperature / adult bee weight / brood production / pesticide residues / Nosema / temperature amplitudes / bee colony phenology 1. INTRODUCTION Variation in landscape exposure in summer and fall can influence the health of honey bee colonies via many mechanisms including effects from pesti- cide contamination, disease, or malnutrition (Simone-Finstrom et al. 2016). Of particular con- cern has been overwintering loss across space and time (Chauzat et al. 2010; Genersch et al. 2010; Lee et al. 2015; Runckel et al. 2011). Overwintering loss rate is an important measure because a healthy colony is worth a premium in commercial pollina- tion; it may be split into two or more colonies to increase holdings; and it is more likely to produce large amounts of honey the following year (Harris 2009). Conversely, many diseases and deficiencies can manifest or amplify during the overwintering period including Varroa , various viruses, trypano- somes, Nosema disease, and non-Nosema dysen- tery (Runckel et al. 2011; Dainat et al. 2012; Pickard and El-Shemy, 1989; Schwarz et al. 2015; Van Dooremalen et al. 2012). Pesticide exposure in the fall can compromise immune defenses, increase Nosema and Varroa levels, and decrease colony growth during and after overwintering (Pettis et al. 2013; Dively et al. 2015; Meikle et al. 2016a). Honey bee colony survival during winter de- pends on worker bee health and on the quantity Electronic supplementary material The online version of this article (doi:10.1007/s13592-017-0512-8) contains supplementary material, which is available to authorized users. Corresponding author: W. Meikle, [email protected] Manuscript Editor: Stan Schneider Apidologie (2017) 48:666–680 Original article This article is an open access publication DOI: 10.1007/s13592-017-0512-8 * The Author(s), 2017.
Transcript of Internal hive temperature as a means of monitoring honey ... · Internal hive temperature as a...
Internal hive temperature as a means of monitoringhoney bee colony health in a migratory beekeeping
operation before and during winter
William G. MEIKLE, Milagra WEISS, Patrick W. MAES, William FITZ, Lucy A. SNYDER,Tim SHEEHAN, Brendon M. MOTT, Kirk E. ANDERSON
Carl Hayden Bee Research Center, 2000 E. Allen Rd, Tucson, AZ 85719, USA
Received 4 November 2016 – Revised 27 March 2017 – Accepted 20 April 2017
Abstract – Internal temperatures of honey bee hives kept at different sites in North Dakota were monitored beforeand during winter to evaluate the effects of treatment, in the form of exposure to commercial pollination, and locationon colony health. In October, hives exposed to commercial pollination during the summer had fewer adult bees andless brood than hives kept near natural forage, as well as lower average temperatures throughout winter. Within-daytemperature variability was higher among hives exposed to commercial agriculture than for those kept near naturalforage, indicating reduced temperature control. Fungicides, insecticides, varroacides, and an herbicide were detectedin bee bread and wax samples; no major differences were observed either in the diversity or in the concentrations ofagrochemicals with the exception of chlorpyrifos at one site. Varroa and Nosema densities were low overall. Datafrom the same site used in successive years showed significantly more brood the first year, as well as lowertemperature variability; high levels of chlorpyrifos were detected in bee bread of colonies in the second year. Colonyaverage temperature and temperature variability were informative with respect to colony phenology and post-winterstatus.
Hive temperature / adultbeeweight /broodproduction /pesticide residues /Nosema / temperatureamplitudes /bee colony phenology
1. INTRODUCTION
Variation in landscape exposure in summer andfall can influence the health of honey bee coloniesvia many mechanisms including effects from pesti-cide contamination, disease, or malnutrition(Simone-Finstrom et al. 2016). Of particular con-cern has been overwintering loss across space andtime (Chauzat et al. 2010; Genersch et al. 2010; Leeet al. 2015; Runckel et al. 2011). Overwintering loss
rate is an important measure because a healthycolony is worth a premium in commercial pollina-tion; it may be split into two or more colonies toincrease holdings; and it is more likely to producelarge amounts of honey the following year (Harris2009). Conversely, many diseases and deficienciescan manifest or amplify during the overwinteringperiod including Varroa , various viruses, trypano-somes, Nosema disease, and non-Nosema dysen-tery (Runckel et al. 2011; Dainat et al. 2012; Pickardand El-Shemy, 1989; Schwarz et al. 2015; VanDooremalen et al. 2012). Pesticide exposure in thefall can compromise immune defenses, increaseNosema and Varroa levels, and decrease colonygrowth during and after overwintering (Pettis et al.2013; Dively et al. 2015; Meikle et al. 2016a).
Honey bee colony survival during winter de-pends on worker bee health and on the quantity
Electronic supplementary material The online version ofthis article (doi:10.1007/s13592-017-0512-8) containssupplementary material, which is available to authorizedusers.
Corresponding author: W. Meikle,[email protected] Editor: Stan Schneider
Apidologie (2017) 48:666–680 Original article
This article is an open access publicationDOI: 10.1007/s13592-017-0512-8
* The Author(s), 2017.
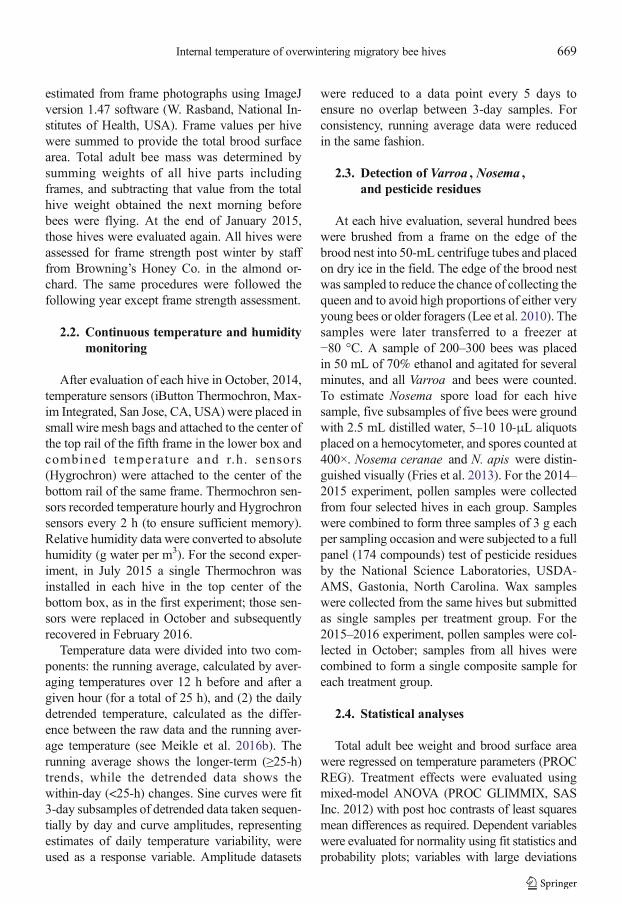
and quality of stored food, while the principle inter-action with the environment is in temperaturemanagement. Homeostasis and colony changes dur-ing winter have been studied using calorimeters andin-hive temperature arrays (Kronenberg and Heller1982; Meikle and Holst 2015; Schmolz et al. 1995).Survivorship and development of brood, particularlypre-pupae and pupae, depends on a continuoustemperature of about 34–36 °C (Jones et al. 2004;Stabentheiner et al. 2010; Wang et al. 2016). Beecolonies also influence temperature in the absence ofbrood (Gates 1914). The ability of a bee colony tomaintain temperature homeostasis in at least part ofthe hive is the result of coordinated behavior andthus may be indicative of colony function andhealth. Thus, monitoring that temperature mayreveal aspects of colony health, even if the underly-ing reasons or mechanisms for differences intemperature control among colonies are not fullyunderstood. Here, we used continuous temperaturedata as a response variable to distinguish group-leveleffects of different migratory routes on honey beecolony health and survivorship.
2. MATERIALS AND METHODS
2014–2015 trial In mid-March 2014, 160 migra-tory bee colonies were built from large, healthyparent colonies sourced from Browning’s HoneyCo., Inc. (Idaho Falls, ID) which, under agree-ment, also transported and managed all coloniesin this study. These studies were conducted onprivate land, with permission obtained byBrowning’s Honey Co., Inc. Each new colonyreceived a queen cell reared from the same Car-niolan bee breeder. Langstroth hives, consisting oftwo deep boxes (43.7 l capacity) with nine framesin the lower box, were fitted with migratory-style(flat) lids, 3–10-year-old wax comb, and in-hivesyrup feeders and installed on four-way pallets.On April 20, all colonies were moved from theorchards to non-agricultural sites in California andfed 12 L of syrup each. On May 5, the hives weremoved to North Dakota and divided equally intotwo sites surrounded by primarily non-agriculturalforage: the Legge site (46° 59′ 44″ N, 98° 10′ 18″W), and the Frolich site (47° 00′ 44″ N, 98° 05′16″W). Areas surrounding those sites were <50%under agriculture (www.nass.usda.gov) (see
Online Resource 1). Legge was within foragingdistance (<2 km) of the designated ConservationReserve Program (CRP) land in 2014. OnMay 19, hives were visually assessed and frame strength(number of frame sides covered by adultbees—see Smart et al. [2016]) was uniformlybetween five and seven frames. Hives were thendivided into two main groups: those exposed toagricultural pollination and those not (or muchless) exposed. Eighty hives at Legge and Frolich,designated the Legge and Frolich1 apiaries, re-spectively, remained there until October. On July 2, 40 hives from Legge and 40 hives from Frolichwere moved for canola seed pollination, as a paidservice, to yard N5924 ( 47° 52′ 03″N, 97° 31′ 58″ W). During canola bloom, a foliar fungicide,Proline® (prothioconazole), was applied (Z.Browning, pers. comm.). On July 25, 40 hivesfrom the canola yard were moved to the BMoch^(46° 39′ 47″N, −100° 09′ 26″W) yard, designatedthe AG1 apiary, and 40 to the BScheer^ (46° 34′34″ N, −100° 18′ 01″ W) yard, designated theAG2 apiary. The Moch and Scheer apiaries weredesignated the BAgriculture^ group, and theFrolich and Legge apiaries were designated theBCRP^ group. Moch and Scheer yards were about1 km from blooming alfalfa and clover, as well assunflowers subjected to aerial application of bio-cides, including evening treatments of chlorpyri-fos (Z. Browning, pers. comm.). Honey was har-vested in late summer, and all 160 hives shippedto Idaho on October 8 (hives were never placed inproximity to hives from outside the study). OnNovember 22, hives were installed in atemperature-controlled warehouse near Firth, Ida-ho, with constant conditions of about 25% r.h. and7 °C. On January 20, hives were shipped by truckto almond orchards near Snelling, California, andevaluated a week later (Table I).
2015–2016 trial In April 2015, 80 hives wereconstructed and managed in a similar fashion asfor the 2014–2015 trial. All hives were sent to theFrolich site until mid-July, after which one groupwas sent to Thilmony Farm (46° 52′ 36″ N, 97°54′ 08″ W) and another group to Thilmony West(46° 52′ 38.02″ N, 97° 57′ 33.38″ W), about4.5 km due west. The remaining hives were keptat the Frolich site. All hives remained at those sites
Internal temperature of overwintering migratory bee hives 667
until they were moved on November 15 to thesame warehouse in Idaho as the previous year(Table II). While no hives at any of the sites wereused commercially for canola or sunflower polli-nation, fields of both crops were within foragingdistance of all hives. Colonies were not differen-tially exposed to agriculture as in the previousyear; instead, location effects were explored with-in the year, and colony data from the Frolichapiary were compared across years.Hives in both trials received 11–15 L of a solutionof 78% simple sugars (50/50 w /w mixture ofsucrose and high-fructose corn syrup), hereafterBsyrup,^ and approximately 1 kg of a commercialprotein supplement three times: (1) before moveto North Dakota; (2) before spring bloom (May 1to June 10); and (3) after fall bloom (early Sep-tember). In the spring and fall, all hives weretreated with patties composed of granulated sugar,shortening, thymol, menthol, lemongrass oil, eu-calyptus oil, sweet orange oil, and camphor oil.
Apivar® was applied on May 10, and supers andqueen excluders were installed for honey produc-tion on June 15. Hives were treated withFumagilin-B, tylosin, and Terramycin mixed inpowdered sugar, and Apivar® after honey harvestin September.
2.1. Discrete colony measures
From October 11 to 15, 2014, 11–12 hives perapiary were randomly selected (total of 47 hives)to determine total adult bee mass, average frameweight, and capped brood surface area (seeMeikle et al. 2016b). For each hive, all hive parts(lid, boxes, bottom board, feeder, etc.) wereweighed on a portable electronic scale. Individualframes were gently shaken to dislodge adult bees,weighed, photographed on both sides using a 16.3megapixel digital camera (Pentax K-01, RicohImaging Co., Ltd.), and replaced in the hive. Thesquare centimeter of the sealed brood was
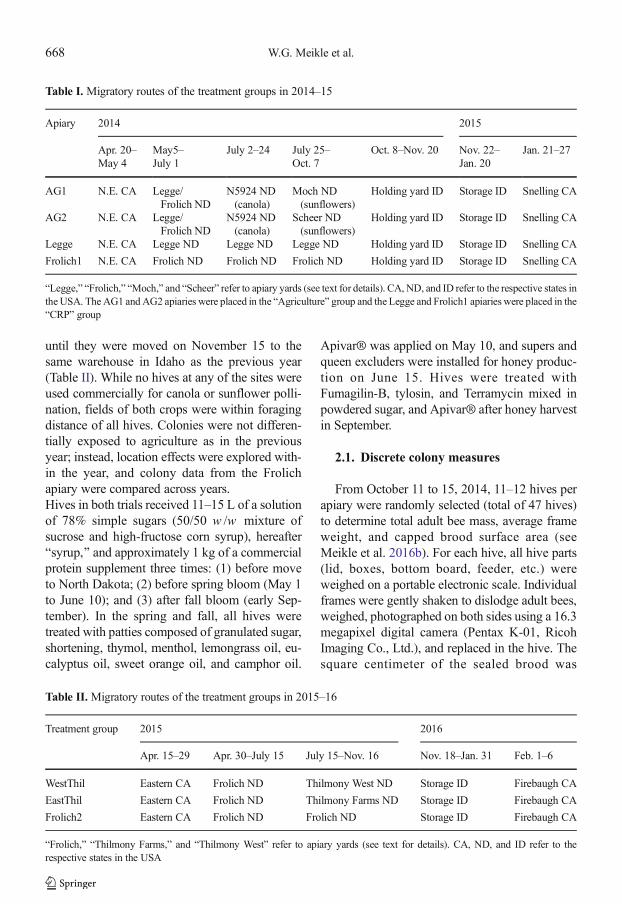
Table I. Migratory routes of the treatment groups in 2014–15
Apiary 2014 2015
Apr. 20–May 4
May5–July 1
July 2–24 July 25–Oct. 7
Oct. 8–Nov. 20 Nov. 22–Jan. 20
Jan. 21–27
AG1 N.E. CA Legge/Frolich ND
N5924 ND(canola)
Moch ND(sunflowers)
Holding yard ID Storage ID Snelling CA
AG2 N.E. CA Legge/Frolich ND
N5924 ND(canola)
Scheer ND(sunflowers)
Holding yard ID Storage ID Snelling CA
Legge N.E. CA Legge ND Legge ND Legge ND Holding yard ID Storage ID Snelling CA
Frolich1 N.E. CA Frolich ND Frolich ND Frolich ND Holding yard ID Storage ID Snelling CA
“Legge,” “Frolich,” “Moch,” and “Scheer” refer to apiary yards (see text for details). CA, ND, and ID refer to the respective states inthe USA. The AG1 andAG2 apiaries were placed in the “Agriculture” group and the Legge and Frolich1 apiaries were placed in the“CRP” group
Table II.Migratory routes of the treatment groups in 2015–16
Treatment group 2015 2016
Apr. 15–29 Apr. 30–July 15 July 15–Nov. 16 Nov. 18–Jan. 31 Feb. 1–6
WestThil Eastern CA Frolich ND Thilmony West ND Storage ID Firebaugh CA
EastThil Eastern CA Frolich ND Thilmony Farms ND Storage ID Firebaugh CA
Frolich2 Eastern CA Frolich ND Frolich ND Storage ID Firebaugh CA
“Frolich,” “Thilmony Farms,” and “Thilmony West” refer to apiary yards (see text for details). CA, ND, and ID refer to therespective states in the USA
668 W.G. Meikle et al.
estimated from frame photographs using ImageJversion 1.47 software (W. Rasband, National In-stitutes of Health, USA). Frame values per hivewere summed to provide the total brood surfacearea. Total adult bee mass was determined bysumming weights of all hive parts includingframes, and subtracting that value from the totalhive weight obtained the next morning beforebees were flying. At the end of January 2015,those hives were evaluated again. All hives wereassessed for frame strength post winter by stafffrom Browning’s Honey Co. in the almond or-chard. The same procedures were followed thefollowing year except frame strength assessment.
2.2. Continuous temperature and humiditymonitoring
After evaluation of each hive in October, 2014,temperature sensors (iButton Thermochron, Max-im Integrated, San Jose, CA, USA) were placed insmall wire mesh bags and attached to the center ofthe top rail of the fifth frame in the lower box andcombined temperature and r.h. sensors(Hygrochron) were attached to the center of thebottom rail of the same frame. Thermochron sen-sors recorded temperature hourly and Hygrochronsensors every 2 h (to ensure sufficient memory).Relative humidity data were converted to absolutehumidity (g water per m3). For the second exper-iment, in July 2015 a single Thermochron wasinstalled in each hive in the top center of thebottom box, as in the first experiment; those sen-sors were replaced in October and subsequentlyrecovered in February 2016.
Temperature data were divided into two com-ponents: the running average, calculated by aver-aging temperatures over 12 h before and after agiven hour (for a total of 25 h), and (2) the dailydetrended temperature, calculated as the differ-ence between the raw data and the running aver-age temperature (see Meikle et al. 2016b). Therunning average shows the longer-term (≥25-h)trends, while the detrended data shows thewithin-day (<25-h) changes. Sine curves were fit3-day subsamples of detrended data taken sequen-tially by day and curve amplitudes, representingestimates of daily temperature variability, wereused as a response variable. Amplitude datasets
were reduced to a data point every 5 days toensure no overlap between 3-day samples. Forconsistency, running average data were reducedin the same fashion.
2.3. Detection of Varroa , Nosema ,and pesticide residues
At each hive evaluation, several hundred beeswere brushed from a frame on the edge of thebrood nest into 50-mL centrifuge tubes and placedon dry ice in the field. The edge of the brood nestwas sampled to reduce the chance of collecting thequeen and to avoid high proportions of either veryyoung bees or older foragers (Lee et al. 2010). Thesamples were later transferred to a freezer at−80 °C. A sample of 200–300 bees was placedin 50 mL of 70% ethanol and agitated for severalminutes, and all Varroa and bees were counted.To estimate Nosema spore load for each hivesample, five subsamples of five bees were groundwith 2.5 mL distilled water, 5–10 10-μL aliquotsplaced on a hemocytometer, and spores counted at400×. Nosema ceranae and N. apis were distin-guished visually (Fries et al. 2013). For the 2014–2015 experiment, pollen samples were collectedfrom four selected hives in each group. Sampleswere combined to form three samples of 3 g eachper sampling occasion and were subjected to a fullpanel (174 compounds) test of pesticide residuesby the National Science Laboratories, USDA-AMS, Gastonia, North Carolina. Wax sampleswere collected from the same hives but submittedas single samples per treatment group. For the2015–2016 experiment, pollen samples were col-lected in October; samples from all hives werecombined to form a single composite sample foreach treatment group.
2.4. Statistical analyses
Total adult bee weight and brood surface areawere regressed on temperature parameters (PROCREG). Treatment effects were evaluated usingmixed-model ANOVA (PROC GLIMMIX, SASInc. 2012) with post hoc contrasts of least squaresmean differences as required. Dependent variableswere evaluated for normality using fit statistics andprobability plots; variables with large deviations
Internal temperature of overwintering migratory bee hives 669
from normality were re-evaluated after log orsquare root transformation. Degrees of freedomwere calculated using the Satterthwaite method,and residual plots assessed for variance homoge-neity. Temperature amplitudes were reduced to adata point every 5 days for repeated measuresMANOVA to ensure no overlap of subsamples,and post hoc contrasts were conducted using theBonferroni adjustment. For consistency, runningaverage data were similarly reduced. The covari-ance structure with the lowest Akaike informationcriterion was chosen among unstructured, com-pound symmetric, autoregressive, autoregressivemoving average, and ante-dependence models. Re-siduals were included in the RANDOM statementand denominator d.f. calculated using theKenward-Roger method. All temperature data areprovided (see Online Resource 2).
3. RESULTS
3.1. Discrete colony measures
In 2014–2015, honey bee colonies in the CRPgroup were significantly higher prior tooverwintering with respect to total adult bee mass(F 1,43 = 14.01, P = 0.0005) and amount of cappedbrood (F 1,38 = 4.16, P = 0.0483) but not averageframe weight (P = 0.08) (Table III). Changes intotal adult bee mass during winter were not differ-ent between groups (P = 0.70), indicating thatwhile some colonies may have suffered higherlosses than others, this could be explained by theirpopulation size prior to winter and not to a differ-ential treatment effect during winter (Table IV).
Average frame weight losses during winter weresignificantly greater for the CRP colonies aftercontrolling for total adult bee mass the previousfall (F 1,40 = 10.04, P = 0.0029). By late January,brood production was significantly higher in theCRP colonies than in the Agricultural colonies( n o n - p a r am e t r i c o n e - w a y ANOVA ,F 1,38 = 10.51, P = 0.0025): nine out of 12 hivesin the group had brood, but only four of 11 in theFrolich1 group, one of 11 in the AG2 group, andnone of 10 in the AG1 group did. From a commer-cial point of view, far more hives reached six ormore frames of adult bees in the Legge andFrolich1 groups than in the other groups (Table V).
In 2015–2016, treatment groups were signifi-cantly different prior to overwintering with re-spect to total adult bee mass (F 2,56 = 6.43,P = 0.0031) and capped brood surface area(F 2,57 = 4.07, P = 0.0223) but not with respectto average frame weight (P = 0.24). Treatmentgroups were significantly different with respect toboth change in total adult bee weight during win-ter (F 2,48 = 12.17, P < 0.0001) and frame weightloss (F 2,52 = 14.61, P < 0.0001) after controllingfor adult bee mass in the fall. WestThil andEastThil groups had the largest adult bee massesduring the fall, but they also experienced thelargest decreases in mass, and decreases in frameweights, during winter storage.
3.2. Temperature and colony phenology
Temperature data for the 2014–2015 experi-ment were divided into three parts: (1) prior tostorage in the warehouse (Oct. 16–Nov. 20), or
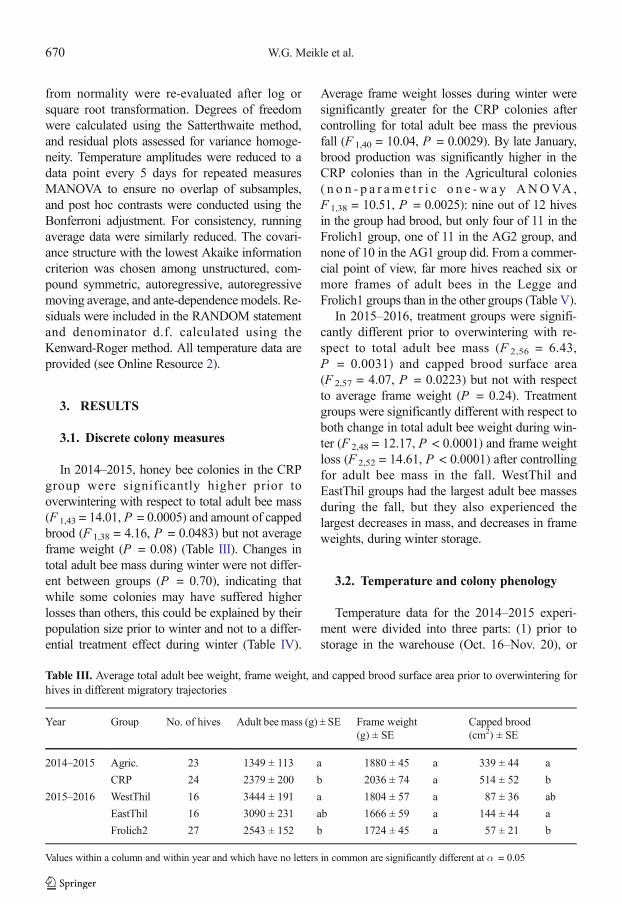
Table III. Average total adult bee weight, frame weight, and capped brood surface area prior to overwintering forhives in different migratory trajectories
Year Group No. of hives Adult bee mass (g) ± SE Frame weight(g) ± SE
Capped brood(cm2) ± SE
2014–2015 Agric. 23 1349 ± 113 a 1880 ± 45 a 339 ± 44 a
CRP 24 2379 ± 200 b 2036 ± 74 a 514 ± 52 b
2015–2016 WestThil 16 3444 ± 191 a 1804 ± 57 a 87 ± 36 ab
EastThil 16 3090 ± 231 ab 1666 ± 59 a 144 ± 44 a
Frolich2 27 2543 ± 152 b 1724 ± 45 a 57 ± 21 b
Values within a column and within year and which have no letters in common are significantly different at α = 0.05
670 W.G. Meikle et al.
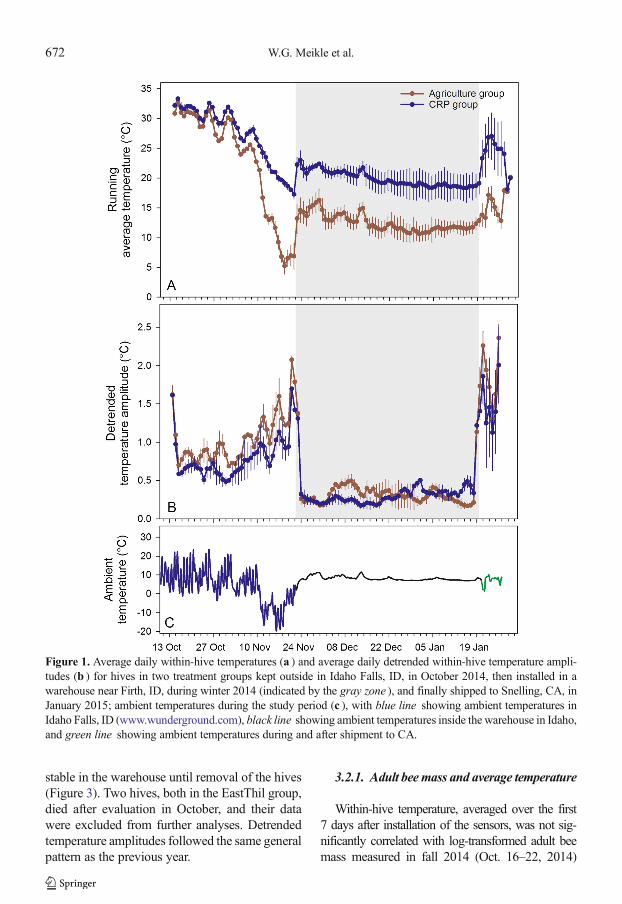
Bfall^; (2) the time in the warehouse (Nov. 21–Jan. 19) or Bwinter^; and (3) after removal fromthe warehouse (Jan. 20–27), or Bpost-winter.^Ambient and within-hive temperatures decreasedin general during the fall, and they were stable inthe warehouse until removal of the hives in Janu-ary (Figure 1). Two colonies in the Frolich1 groupand one each in the AG1 and AG2 groups diedafter inspection in October; their temperature pro-files were easy to distinguish from those of sur-viving colonies (see Online Resource 3 Figure S1)and excluded from analyses. Initially, averagewithin-hive temperatures were similar amonghives, but as ambient temperatures dropped, dif-ferences between the groups appeared. Detrendedtemperature amplitudes were comparatively highin the fall, when hives were exposed to dailyambient temperature fluctuations, then decreasedto low levels during winter in the controlled-temperature warehouse, and finally increased totheir highest levels post winter.
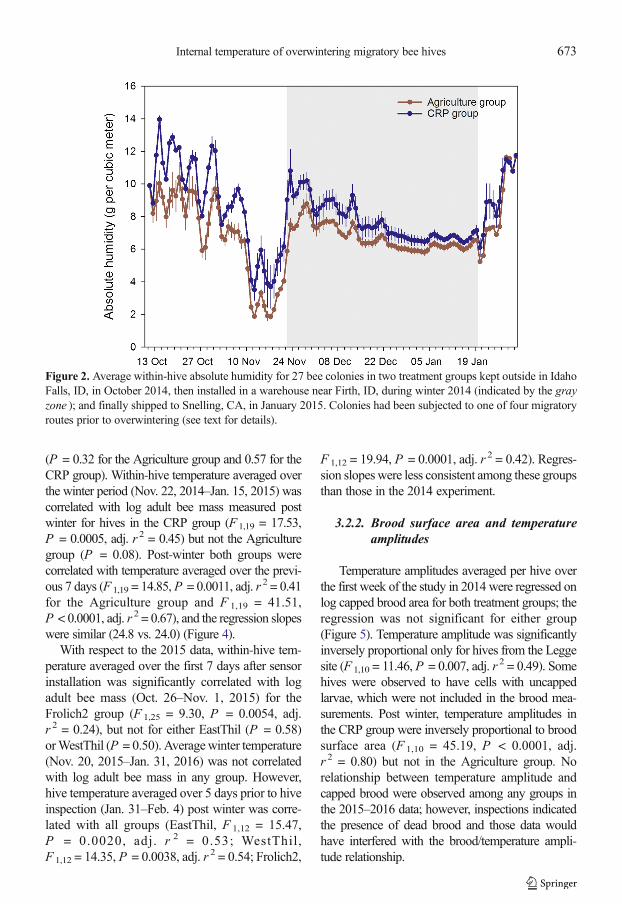
Absolute humidity in the 2014–2015 experi-ment was positively correlated with (1) tempera-ture a t the same posi t ion post winter(F 1,25 = 267.63; P < 0.0001; r 2 = 0.9112); (2)temperature at the upper position in the lower boxat that time (F 1,25 = 46.49; P < 0.0001;r 2 = 0.6363); and (3) log adult brood weight atfinal evaluation (F 1,25 = 62.14; P < 0.0001;r 2 = 0.7016). Like temperature, treatment had asignificant effect on absolute humidity when totaladult bee weight was held as a covariate(F 3,21 = 6.15, P = 0.0036) (Figure 2). Honey beeshave been found to regulate humidity in the nest(Human et al. 2006), but in this study humiditydid not provide additional information.
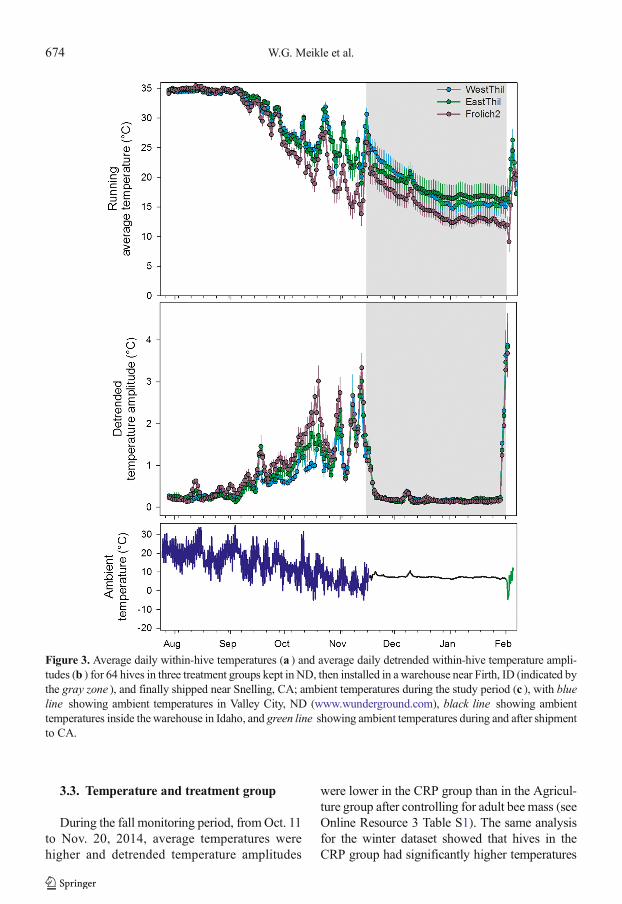
Temperature data in the 2015–2016 study weredivided into four parts: (1) summer (July 29–Aug. 31); (2) fall (Sept. 1–Nov. 15); (3) winter(Nov. 20–Jan. 24); and (4) post winter (Jan. 31–Feb. 4). Both ambient and within-hive tempera-tures decreased in general in the fall, and were
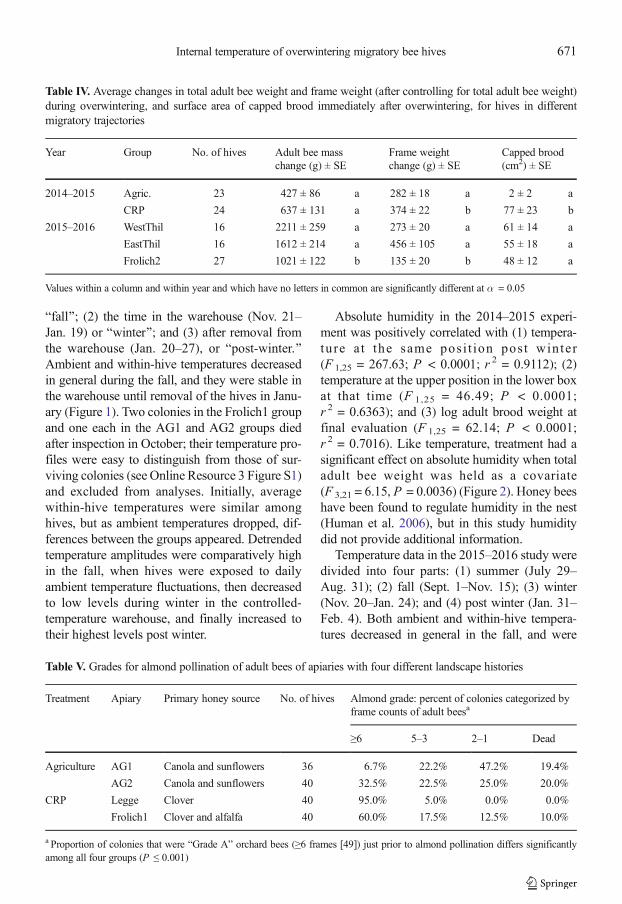
Table IV. Average changes in total adult bee weight and frame weight (after controlling for total adult bee weight)during overwintering, and surface area of capped brood immediately after overwintering, for hives in differentmigratory trajectories
Year Group No. of hives Adult bee masschange (g) ± SE
Frame weightchange (g) ± SE
Capped brood(cm2) ± SE
2014–2015 Agric. 23 427 ± 86 a 282 ± 18 a 2 ± 2 a
CRP 24 637 ± 131 a 374 ± 22 b 77 ± 23 b
2015–2016 WestThil 16 2211 ± 259 a 273 ± 20 a 61 ± 14 a
EastThil 16 1612 ± 214 a 456 ± 105 a 55 ± 18 a
Frolich2 27 1021 ± 122 b 135 ± 20 b 48 ± 12 a
Values within a column and within year and which have no letters in common are significantly different at α = 0.05
Table V. Grades for almond pollination of adult bees of apiaries with four different landscape histories
Treatment Apiary Primary honey source No. of hives Almond grade: percent of colonies categorized byframe counts of adult beesa
≥6 5–3 2–1 Dead
Agriculture AG1 Canola and sunflowers 36 6.7% 22.2% 47.2% 19.4%
AG2 Canola and sunflowers 40 32.5% 22.5% 25.0% 20.0%
CRP Legge Clover 40 95.0% 5.0% 0.0% 0.0%
Frolich1 Clover and alfalfa 40 60.0% 17.5% 12.5% 10.0%
a Proportion of colonies that were “Grade A” orchard bees (≥6 frames [49]) just prior to almond pollination differs significantlyamong all four groups (P ≤ 0.001)
Internal temperature of overwintering migratory bee hives 671
stable in the warehouse until removal of the hives(Figure 3). Two hives, both in the EastThil group,died after evaluation in October, and their datawere excluded from further analyses. Detrendedtemperature amplitudes followed the same generalpattern as the previous year.
3.2.1. Adult bee mass and average temperature
Within-hive temperature, averaged over the first7 days after installation of the sensors, was not sig-nificantly correlated with log-transformed adult beemass measured in fall 2014 (Oct. 16–22, 2014)
Figure 1. Average daily within-hive temperatures (a ) and average daily detrended within-hive temperature ampli-tudes (b ) for hives in two treatment groups kept outside in Idaho Falls, ID, in October 2014, then installed in awarehouse near Firth, ID, during winter 2014 (indicated by the gray zone ), and finally shipped to Snelling, CA, inJanuary 2015; ambient temperatures during the study period (c ), with blue line showing ambient temperatures inIdaho Falls, ID (www.wunderground.com), black line showing ambient temperatures inside the warehouse in Idaho,and green line showing ambient temperatures during and after shipment to CA.
672 W.G. Meikle et al.
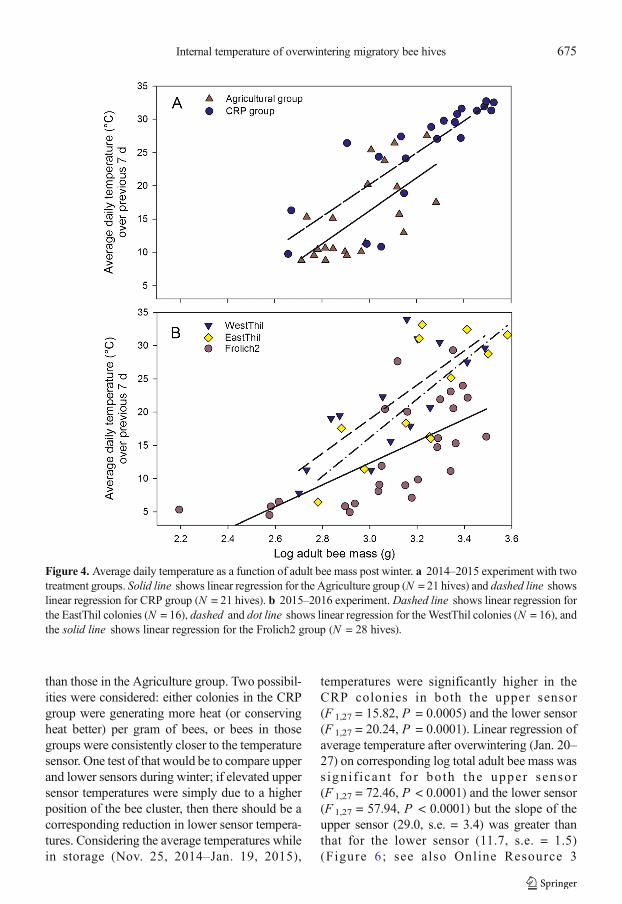
(P = 0.32 for the Agriculture group and 0.57 for theCRP group). Within-hive temperature averaged overthe winter period (Nov. 22, 2014–Jan. 15, 2015) wascorrelated with log adult bee mass measured postwinter for hives in the CRP group (F 1,19 = 17.53,P = 0.0005, adj. r 2 = 0.45) but not the Agriculturegroup (P = 0.08). Post-winter both groups werecorrelated with temperature averaged over the previ-ous 7 days (F 1,19 = 14.85,P = 0.0011, adj. r 2 = 0.41for the Agriculture group and F 1,19 = 41.51,P < 0.0001, adj. r 2 = 0.67), and the regression slopeswere similar (24.8 vs. 24.0) (Figure 4).
With respect to the 2015 data, within-hive tem-perature averaged over the first 7 days after sensorinstallation was significantly correlated with logadult bee mass (Oct. 26–Nov. 1, 2015) for theFrolich2 group (F 1,25 = 9.30, P = 0.0054, adj.r 2 = 0.24), but not for either EastThil (P = 0.58)orWestThil (P = 0.50). Averagewinter temperature(Nov. 20, 2015–Jan. 31, 2016) was not correlatedwith log adult bee mass in any group. However,hive temperature averaged over 5 days prior to hiveinspection (Jan. 31–Feb. 4) post winter was corre-lated with all groups (EastThil, F 1,12 = 15.47,P = 0.0020, adj. r 2 = 0.53; WestThil,F 1,12 = 14.35, P = 0.0038, adj. r 2 = 0.54; Frolich2,
F 1,12 = 19.94, P = 0.0001, adj. r 2 = 0.42). Regres-sion slopes were less consistent among these groupsthan those in the 2014 experiment.
3.2.2. Brood surface area and temperatureamplitudes
Temperature amplitudes averaged per hive overthe first week of the study in 2014 were regressed onlog capped brood area for both treatment groups; theregression was not significant for either group(Figure 5). Temperature amplitude was significantlyinversely proportional only for hives from the Leggesite (F 1,10 = 11.46, P = 0.007, adj. r 2 = 0.49). Somehives were observed to have cells with uncappedlarvae, which were not included in the brood mea-surements. Post winter, temperature amplitudes inthe CRP group were inversely proportional to broodsurface area (F 1,10 = 45.19, P < 0.0001, adj.r 2 = 0.80) but not in the Agriculture group. Norelationship between temperature amplitude andcapped brood were observed among any groups inthe 2015–2016 data; however, inspections indicatedthe presence of dead brood and those data wouldhave interfered with the brood/temperature ampli-tude relationship.
Figure 2. Average within-hive absolute humidity for 27 bee colonies in two treatment groups kept outside in IdahoFalls, ID, in October 2014, then installed in a warehouse near Firth, ID, during winter 2014 (indicated by the grayzone ); and finally shipped to Snelling, CA, in January 2015. Colonies had been subjected to one of four migratoryroutes prior to overwintering (see text for details).
Internal temperature of overwintering migratory bee hives 673
3.3. Temperature and treatment group
During the fall monitoring period, fromOct. 11to Nov. 20, 2014, average temperatures werehigher and detrended temperature amplitudes
were lower in the CRP group than in the Agricul-ture group after controlling for adult bee mass (seeOnline Resource 3 Table S1). The same analysisfor the winter dataset showed that hives in theCRP group had significantly higher temperatures
Figure 3. Average daily within-hive temperatures (a ) and average daily detrended within-hive temperature ampli-tudes (b ) for 64 hives in three treatment groups kept in ND, then installed in a warehouse near Firth, ID (indicated bythe gray zone ), and finally shipped near Snelling, CA; ambient temperatures during the study period (c ), with blueline showing ambient temperatures in Valley City, ND (www.wunderground.com), black line showing ambienttemperatures inside the warehouse in Idaho, and green line showing ambient temperatures during and after shipmentto CA.
674 W.G. Meikle et al.
than those in the Agriculture group. Two possibil-ities were considered: either colonies in the CRPgroup were generating more heat (or conservingheat better) per gram of bees, or bees in thosegroups were consistently closer to the temperaturesensor. One test of that would be to compare upperand lower sensors during winter; if elevated uppersensor temperatures were simply due to a higherposition of the bee cluster, then there should be acorresponding reduction in lower sensor tempera-tures. Considering the average temperatures whilein storage (Nov. 25, 2014–Jan. 19, 2015),
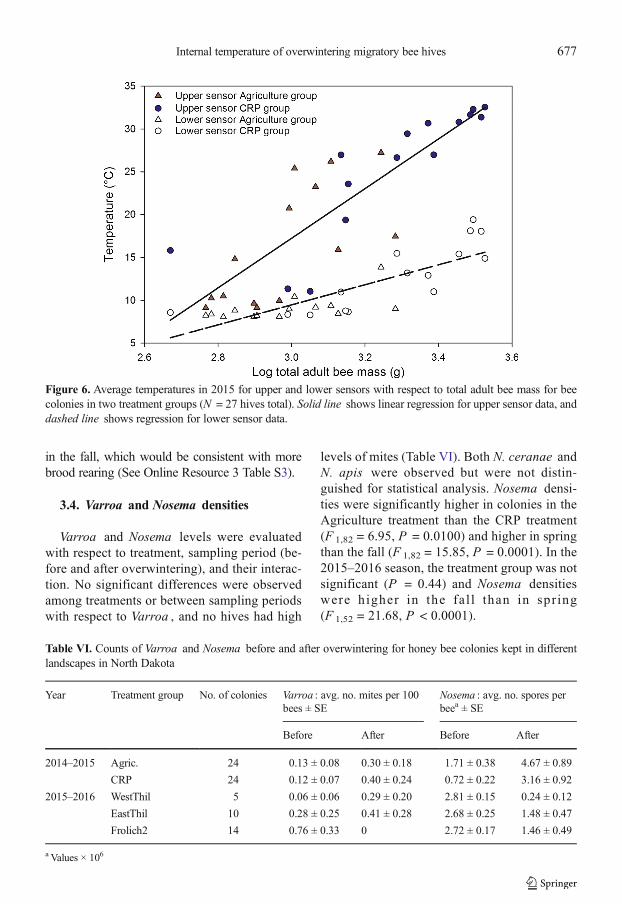
temperatures were significantly higher in theCRP colonies in both the upper sensor(F 1,27 = 15.82, P = 0.0005) and the lower sensor(F 1,27 = 20.24, P = 0.0001). Linear regression ofaverage temperature after overwintering (Jan. 20–27) on corresponding log total adult bee mass wass ign i f i can t fo r bo th the upper sensor(F 1,27 = 72.46, P < 0.0001) and the lower sensor(F 1,27 = 57.94, P < 0.0001) but the slope of theupper sensor (29.0, s.e. = 3.4) was greater thanthat for the lower sensor (11.7, s.e. = 1.5)(Figure 6; see also Online Resource 3
Figure 4. Average daily temperature as a function of adult bee mass post winter. a 2014–2015 experiment with twotreatment groups. Solid line shows linear regression for the Agriculture group (N = 21 hives) and dashed line showslinear regression for CRP group (N = 21 hives). b 2015–2016 experiment.Dashed line shows linear regression forthe EastThil colonies (N = 16), dashed and dot line shows linear regression for theWestThil colonies (N = 16), andthe solid line shows linear regression for the Frolich2 group (N = 28 hives).
Internal temperature of overwintering migratory bee hives 675
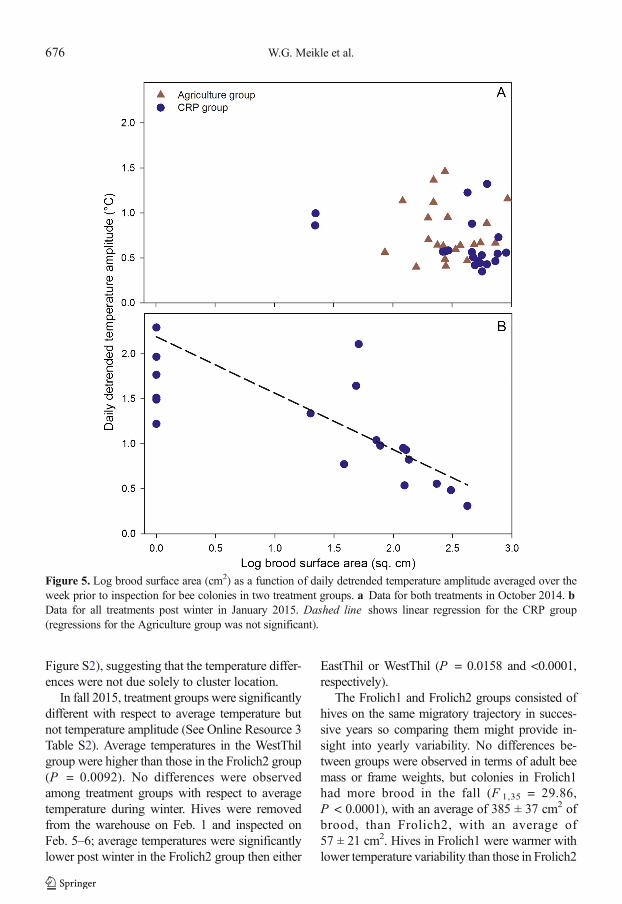
Figure S2), suggesting that the temperature differ-ences were not due solely to cluster location.
In fall 2015, treatment groups were significantlydifferent with respect to average temperature butnot temperature amplitude (See Online Resource 3Table S2). Average temperatures in the WestThilgroup were higher than those in the Frolich2 group(P = 0.0092). No differences were observedamong treatment groups with respect to averagetemperature during winter. Hives were removedfrom the warehouse on Feb. 1 and inspected onFeb. 5–6; average temperatures were significantlylower post winter in the Frolich2 group then either
EastThil or WestThil (P = 0.0158 and <0.0001,respectively).
The Frolich1 and Frolich2 groups consisted ofhives on the same migratory trajectory in succes-sive years so comparing them might provide in-sight into yearly variability. No differences be-tween groups were observed in terms of adult beemass or frame weights, but colonies in Frolich1had more brood in the fall (F 1,35 = 29.86,P < 0.0001), with an average of 385 ± 37 cm2 ofbrood, than Frolich2, with an average of57 ± 21 cm2. Hives in Frolich1 were warmer withlower temperature variability than those in Frolich2
Figure 5. Log brood surface area (cm2) as a function of daily detrended temperature amplitude averaged over theweek prior to inspection for bee colonies in two treatment groups. a Data for both treatments in October 2014. bData for all treatments post winter in January 2015. Dashed line shows linear regression for the CRP group(regressions for the Agriculture group was not significant).
676 W.G. Meikle et al.
in the fall, which would be consistent with morebrood rearing (See Online Resource 3 Table S3).
3.4. Varroa and Nosema densities
Varroa and Nosema levels were evaluatedwith respect to treatment, sampling period (be-fore and after overwintering), and their interac-tion. No significant differences were observedamong treatments or between sampling periodswith respect to Varroa , and no hives had high
levels of mites (Table VI). Both N. ceranae andN. apis were observed but were not distin-guished for statistical analysis. Nosema densi-ties were significantly higher in colonies in theAgriculture treatment than the CRP treatment(F 1,82 = 6.95, P = 0.0100) and higher in springthan the fall (F 1,82 = 15.85, P = 0.0001). In the2015–2016 season, the treatment group was notsignificant (P = 0.44) and Nosema densitieswere higher in the fal l than in spr ing(F 1,52 = 21.68, P < 0.0001).
Figure 6. Average temperatures in 2015 for upper and lower sensors with respect to total adult bee mass for beecolonies in two treatment groups (N = 27 hives total). Solid line shows linear regression for upper sensor data, anddashed line shows regression for lower sensor data.
Table VI. Counts of Varroa and Nosema before and after overwintering for honey bee colonies kept in differentlandscapes in North Dakota
Year Treatment group No. of colonies Varroa : avg. no. mites per 100bees ± SE
Nosema : avg. no. spores perbeea ± SE
Before After Before After
2014–2015 Agric. 24 0.13 ± 0.08 0.30 ± 0.18 1.71 ± 0.38 4.67 ± 0.89
CRP 24 0.12 ± 0.07 0.40 ± 0.24 0.72 ± 0.22 3.16 ± 0.92
2015–2016 WestThil 5 0.06 ± 0.06 0.29 ± 0.20 2.81 ± 0.15 0.24 ± 0.12
EastThil 10 0.28 ± 0.25 0.41 ± 0.28 2.68 ± 0.25 1.48 ± 0.47
Frolich2 14 0.76 ± 0.33 0 2.72 ± 0.17 1.46 ± 0.49
a Values × 106
Internal temperature of overwintering migratory bee hives 677
3.5. Pesticide residues
Agrochemical residue analyses of the bee breadcollected in 2014 showed pesticides associated withVarroa control, including 2,4-dimethylphenyl-N ′-methylformamidine (2,4-DMPF), a breakdownproduct of amitraz, coumaphos, fluvalinate, andthymol (See Online Resource 3 Table S4). Chlor-pyrifos was found at all sites at concentrations from4 to 35 ppb in 2014 and from 18 to 144 ppb (at theFrolich2 site) in 2015. The higher chlorpyrifos con-centration may have played a role in the compara-tively lower health indicators (brood production,temperature management) for the Frolich2 coloniescompared to the Frolich1 colonies. The number ofcompounds detected was not higher in the Agricul-ture group in 2014 (8 in AG1 and 5 in AG2) than inthe CRP group (7 in Legge and 11 in Frolich1). Beebread samples collected in 2015 had fewer com-pounds, but this may be at least partly due to thedifferent sampling methods, which were likely lesssensitive than those used the previous year. Thymolconcentrations were higher in 2015 than those ob-served in the previous year.
Analyses of the wax collected in 2014 showedresidues of all the compounds found in bee bread,except for fluvalinate, in addition to six additionalfungicides and an herbicide (see Online Resource3 Table S5). Not all compounds were found at allsites, but the number of compounds per site variedlittle, from 11 (Legge) to 14 (AG2).
4. DISCUSSION
This study had two main goals: (1) evaluate hivetemperature during overwintering to detect differ-ences among bee hive groups subjected to differentenvironments and (2) investigate group differenceswith respect to Nosema and Varroa densities andagrochemical residues. Temperature is controlled ina colony by the adult bee population (Kronenbergand Heller 1982; Stabentheiner et al. 2010) so thelarger the bee mass, the greater the hive volumepotentially under some degree of temperature con-trol and thus the higher the expected average tem-perature, assuming that other factors, such as theability and desire of the colony to maintain a hightemperature, are equal. Internal hive temperaturewas found to be an effective response variable in
detecting differences among colonies during winterand post winter, even before those effects manifest-ed themselves on the colony level. In the first year,average temperatures differed among groupsthrough winter storage until the end of January, aftercontrolling for adult beemass, indicating a treatmenteffect independent of colony size. Colonies in allgroups lost adult beemass during thewinter storage;while hives in the CRP group in 2014–2015 lostabout the same amount as those in the Agriculturegroup, they had started with a significantly largerbee mass and so were in better condition postoverwintering. Hourly temperature was effective atdistinguishing treatment groups before, during, andpost winter in the 2014 experiment, but it was onlystrongly associated with adult bee mass post winter.In the 2015 experiment, hourly hive temperaturedistinguished groups outside of winter storage, butnot during winter storage.
The relationship of temperature variability withthe amount of capped brood was inconsistent in thisstudy. Meikle et al. (2016b) found that stringenttemperature control (= low amplitudes) in colonieswith brood, but relaxed control (= high amplitudes)with little or no capped brood, was present. How-ever, in the fall, 2014, experiment presented here,both capped brood levels and temperature ampli-tudes were significantly different between groupsalthough they were not correlated with each other;only colonies from the Legge site had a significantrelationship between capped brood and temperatureamplitude at that time. Some uncapped brood wasobserved; uncapped brood levels were not mea-sured and do not elicit as strong a temperaturecontrol response among bees as does capped brood(Stabentheiner et al. 2010), but it may have affectedthe temperature and capped brood analysis. Ifuncapped brood is not included in the brood mea-sure, yet it affects temperature control by bees, thentemperature variability may be lower than we ex-pect for the observed levels of capped brood. Deadbrood would have the opposite effect. Post winter,only one colony of 21 surviving colonies in theAgriculture group had capped brood while 13 of22 colonies in the CRP group did, and amplitudeswere correlated with the amount of brood in thatgroup. That a positive relationship between broodlevels and temperature amplitudes was observed incolonies from the strongest treatment group, and
678 W.G. Meikle et al.
particularly among the strongest colonies withinthat group (from the Legge site), suggests that thelack of a relationship may indicate colony healthissues, but further work is needed. In 2015–2016,relationships between capped brood and tempera-ture amplitudes were either weak or not significantamong all groups either before or after winter; thepresence of dead brood noted in some hives wouldhave interfered with that analysis.
What caused these differences between treat-ments in 2014 and among sites in 2015 was moredifficult to determine. Varroa had been treated ag-gressively in the fall, and the low densities reflectedthat. Nosema densities were not different amonggroups but did change over winter, increasing thefirst year but decreasing the second. The impact ofNosema in this system needs further examination;fumagillin was applied, but it has been found inef-fective in controlling N. ceranae (Huang et al.2013). The incidence of viral diseases was not in-vestigated, so that it possibility cannot be eliminated.
At least some evidence indicates that agrochem-ical exposure may have affected colonies. Chlor-pyrifos was detected in many samples of storedpollen in this study and has been found to havestrong synergistic effects with certain Bbee safe^fungicides and beekeeper-applied miticides (Zhuet al. 2014). Data from the Frolich site in succes-sive years showed that comparatively high levelsof chlorpyrifos were detected in bee bread of col-onies in the second year, as well as significantlyless brood, lower average temperatures, and highertemperature variability compared to colonies in thefirst year. While that may be partly explained bythe timing of the inspections, since hives in 2015were inspected approximately 2 weeks later in theyear than those in 2014, temperature data suggestthat the brood production continued longer in 2014than in 2015. No differences were observed duringwinter, or with respect to inspection data postwinter, so the effect was short-lived. Smart et al.(2016) conducted a 3-year study with commercialhives in the same region and observed differentialexpression of nutritional and immune-relatedgenes in worker bees from different locations(hives were not moved in that study) and a land-scape effect on Nosema densities but no relation-ship between agrochemical residues and colonyhealth. However, even slight differences in
exposure may have comparatively large effects(Johnson et al. 2013; Johnson 2015).
ACKNOWLEDGEMENTS
Z. Browning, S. Cook, N. Holst, R. Oliver, and twoanonymous reviewers greatly improved a previous ver-sion of this manuscript.
CONTRIBUTIONS
WGM and KEA conceived this research and de-signed experiments; all authors participated inexperimental execution, WGM and KEA con-ducted data analysis and interpretation, andWGM, KEA, and MW wrote the paper.
OPEN ACCESS
This article is distributed under the terms of theCreativeCommons Attribution 4.0 International License (http://creativecommons.org/licenses/by/4.0/), which permits un-restricted use, distribution, and reproduction in any medi-um, provided you give appropriate credit to the originalauthor(s) and the source, provide a link to the CreativeCommons license, and indicate if changes were made.
La température interne de la ruche : moyen de vérifierla santé des colonies d’abeilles, avant et durant l’hiver,lors d’une opération de transhumance apicole
température de la ruche /poids des abeilles adultes /production de couvain / résidu de pesticides /Nosema /amplitude des températures / phénologie de la colonie
Die interne Stocktemperatur als ein Parameter zurÜberprüfung der Gesundheit von Bienenvölkern ineiner Wanderimkerei vor und nach demWinter
Stocktemperatur / Adultes Bienengewicht /Brutproduktion / Pestizidrückstände / Nosema /Temperaturamplituden / Bienenvolk-Phänologie
REFERENCES
Chauzat M-P, Martel A.-C., Zeggane S., Drajnudel P.,Schurr F., Clément M.-C., Ribière-Chabert M., AubertM., Faucon J.-P. (2010) A case control study and asurvey on mortalities of honey bee colonies (Apismellifera ) in France during the winter of 2005-6. J.Apic. Res. 49,40–51.
Internal temperature of overwintering migratory bee hives 679
Dainat B., Evans J.D., Chen Y.P., Gauthier L., Neumann P.(2012) Dead or alive: Deformed wing virus and Varroadestructor reduce the life span of winter honeybees.Appl. Environ. Microbiol. 78,981–987.
Dively G.P., EmbreyM.S., Kamel A., Hawthorne D.J., PettisJ.S. (2015) Assessment of chronic sublethal effects ofimidacloprid on honey bee colony health. PLoS ONE10:e0118748. doi: 10.1371/journal.pone.0118748.
Fries I., Chauzat, M.-P., Chen Y.-P., Doublet V., GenerschE., et al. (2013) Standard methods for Nosema re-search. J. Apic. Res. 52, 1–28.
Gates B.N. (1914) The temperature of the bee colony, UnitedStates Department of Agriculture, Dept. Bull. No. 96.
Genersch E., von der OheW., Kaatz H., Schroeder A., OttenC., et al. (2010) The German bee monitoring project: along term study to understand periodically high winterlosses of honey bee colonies. Apidologie 41, 332–352.
Harris J.L. (2009) Development of honey bee colonies onthe Northern Great Plains of North America duringconfinement to winter quarters. J Apic. Res. 48,85–90.
Huang W.-F., Solter L.F., Yau P.M., Imai B.S. (2013)Nosema ceranae escapes fumagillin control in honeybees. PLoS Pathogens 9, e1003185.
Human H., Nicolson S.W., Dietemann V. (2006) Do hon-eybees, Apis mellifera scutellata , regulate humidity intheir nest? Naturwissenschaften 93, 397–401.
Johnson R.M. (2015) Honey bee toxicology. Annu. Rev.Entomol. 60,415–434.
Johnson R.M., Dahlgren L., Siegfried B.D., Ellis M.D.(2013) Acaricide, fungicide and drug interactions inhoney bees (Apis mellifera ). PLoS ONE. doi: 10.1371/journal.pone.0054092
Jones J.C., Myerscough M.R., Graham S., Oldroyd B.P.(2004) Honey bee nest thermoregulation: Diversitypromotes stability. Science 305, 402–404.
Kronenberg F., Heller H.C. (1982) Colonial thermoregula-tion in honey bees (Apis mellifera ). J. Comp. Physiol.B 148,65–76.
Lee K.V., Moon R.D., Burkness E.C., Hutchison W.D.,Spivak M. (2010) Practical sampling plans for Varroadestructor (Acari: Varroidae) in Apis mellifera (Hy-menoptera: Apidae) colonies and apiaries. J. Econ.Entomol. 103, 1039–1050.
Lee K.V., Steinhauer N., Rennich K., Wilson M.E., TarpyD.R., et al. (2015) A national survey of managedhoney bee 2013–2014 annual colony losses in theUSA. Apidologie, 1–14.
Meikle W.G., Holst N. (2015) Application of continuousmonitoring of honey bee colonies. Apidologie 46,10–22.
Meikle W.G., Adamczyk J.J., Weiss M., Gregorc A., John-son D.R., et al. (2016a) Sublethal effects ofimidacloprid on honey bee colony growth and activityat three sites in the U.S. PLoS ONE 11(12): e0168603.doi:10.1371/journal.pone.0168603
Meikle W.G., Weiss M., Stillwell A.R. (2016b) Monitoringcolony phenology using within-day variability in
continuous weight and temperature of honey bee hives.Apidologie, doi:10.1007/s13592-015-0370-1.
Pettis J.S., Lichtenberg E.M., Andree M., Stitzinger J.,Rose R., VanEngelsdorp D. (2013) Crop pollinationexposes honey bees to pesticides which alters theirsusceptibility to the gut pathogen Nosema ceranae ,PLoS ONE 8, e70182. doi: 10.1371/journal.pone.0070182.
Pickard R.S., El-Shemy A.A.M. (1989) Seasonal variationin the infection of honeybee colonies with Nosemaapis Zander. J. Apic. Res. 28,93–100.
Runckel C., FlennikenM.L., Engel J.C., Ruby J.G., GanemD., Andino R., DeRisi J.L. (2011) Temporal analysis ofthe honey bee microbiome reveals four novel virusesand seasonal prevalence of known viruses, Nosema ,and Crithidia . PLoS One 6, e20656. doi: 10.1371/journal.pone.0020656.
Schmolz E., Lamprecht I., Schricker B. (1995) A methodfor continuous direct calorimetric measurements ofenergy metabolism in intact hornet (Vespa crabro )and honeybee (Apis mel l i f e ra ) co lon ies .Thermochimica Acta 251, 293–301.
Schwarz R.S., Bauchan G.R., Murphy C.A., Ravoet J., deGraaf D.C., Evans J.D. (2015) Characterization of twospecies of Trypanosomatidae from the honey bee Apismellifera : Crithidia mellificae Langridge andMcGhee, and Lotmaria passim n. gen., n. sp.. J.Eukaryot. Microbiol. 62(5),567–83 .
Simone-Finstrom, M., Li-Byarlay H., Huang M.H., StrandM.K., Rueppell O., Tarpy D.R. (2016) Migratory man-agement and environmental conditions affect lifespanand oxidative stress in honey bees. Sci. Rep. 6, 32023;doi: 10.1038/srep32023 (2016).
Smart M.D., Pettis J., Rice N., Browning Z., Spivak M.(2016) Linking measures of colony and individual beehealth to survival among apiaries exposed to varyingagricultural land use. PLoS ONE 11(3), e0152685.doi:10.1371/journal.pone.0152685.
Stabentheiner A., Kovac H., Brodschneider R. (2010) Hon-eybee colony thermoregulation—regulatory mecha-nisms and contribution of individuals in dependenceon age, location and thermal stress. PLoS ONE 5(1):e8967. doi:10.1371/journal.pone.0008967
Van Dooremalen C., Gerritsen L., Cornelissen B., van derSteen J.J.M., van Langevelde F., Blacquière T. (2012)Winter survival of individual honey bees and honey beecolonies depends on level of Varroa destructor infesta-tion. PLoS ONE. doi: 10.1371/journal.pone.0036285
Wang Q., Xu X., Zhu X., Chen L., Zhou S., Huang Z.Y.,Zhou B.F. (2016) Low-temperature stress duringcapped brood stage increases pupal mortality, misori-entation and adult mortality in honey bees. PLoS ONE11(5): e0154547. doi:10.1371/journal.pone.0154547
Zhu W., Schmehl D.R., Mullin C., Frazier J.L. (2014) Fourcommon pesticides, their mixtures and a formulationsolvent in the hive environment have high oral toxicityto honey bee larvae. PLoS ONE doi:10.1371/journal.pone.0077547.
680 W.G. Meikle et al.