
Internal Customer Satisfaction Assessment in the Public sector: A case study of Fleet management...
17
ISSN: 2349-7807 International Journal of Recent Research in Commerce Economics and Management (IJRRCEM) Vol. 1, Issue 2, pp: (12-28), Month: July 2014 - September 2014, Available at: www.paperpublications.org Page | 12 Paper Publications Internal Customer Satisfaction Assessment in the Public Sector: A Case Study of Fleet Management Services Delivery Oteki Evans Biraori 1 , Dr.Bichanga Walter Okibo(PhD) 2 , Wandera R. Wamalwa 3 1 Masters,Jomo Kenyatta University of Agriculture and Technology, P. O. Box 6200, Nairobi. Kenya. 2 Senior lecturer, Jomo Kenyatta University of Agriculture and Technology, Nairobi. Kenya. 3 Lecturer, Jomo Kenyatta University of Agriculture and Technology, Nairobi. Kenya. Abstract: Internal customer satisfaction is a major component of quality improvement that most companies should embrace together with developing strategies to improve quality of external customer service. When the internal customer isn't satisfied, relationships with the external customer suffer. The researcher set out to examine the quality of fleet management services to internal customers by use of SERVQUAL scale to measure the gap between quality expectations and perceptions of the services so as to establish action plans. The objectives of the survey were, to examine the various dimensions of service quality on internal customer satisfaction, to establish the level of internal customer satisfaction and to establish the expectations of internal customers and areas for improvement with the dependent variable being internal customer satisfaction. The study adopted a descriptive case research design and the study population comprised of 118 management staff of Nzoia Suagr Company. A purposive sampling technique was employed to select a sample size of 34 respondents. Questionnaires, interviews, secondary data and observation were used for data collection. Descriptive statistics data analysis method was applied to analyze numerical data gathered aided by Statistical Package for Social Sciences (SPSS). Results show that 48% are highly satisfied, 40% moderately satisfied and 12% had low satisfaction with fleet management services, SERVQUAL five scale had relationships to satisfaction and internal customers expect quick responses to requests. It is recommended that transport department that manages fleet should always try to enhance customer satisfaction via presenting high quality fleet management services, as a key element, in order to, first, not weaken those dimensions which the internal customers are satisfied with and secondly, improve those services that aren’t quality from internal customers perspective. Keywords: External customer, Fleet Management, Internal customer, Service level agreements, Service Quality, Supply Chain Management, Total Quality Management. 1. INTRODUCTION Every business firm, regardless of what it produces or distributes, requires the movement of goods from one point to another and, therefore, is involved in transportation. Transportation essentially concerns the spatial dimension of the business firm. "The spatial dimension refers to geographical relationships and reflects the juxtaposition of firms with respect to their materials sources, markets, and competitors, plus the spatial relations of the latter to their sources and markets". The purpose or function of transportation is to serve as a connecting link between the spatially separated units within a firm's own organization (such as between plant and warehouses) and between units of the firm and units of other firms and individuals (such as suppliers and customers). Good transportation has the effect of holding to a minimum the time and cost involved in the spatial relationships of the firm. In economic theory terms, transportation's function is to create place utility for the goods produced or distributed by the firm. The word "utility" means usefulness or ability to give satisfaction. Place utility exists when goods are in the place where they can be consumed. Goods that are not in the place where they are needed have less than full value and so transportation creates value by creating place utility. Along
-
Upload
paperpublications3 -
Category
Education
-
view
325 -
download
7
Transcript of Internal Customer Satisfaction Assessment in the Public sector: A case study of Fleet management...

ISSN: 2349-7807
International Journal of Recent Research in Commerce Economics and Management (IJRRCEM) Vol. 1, Issue 2, pp: (12-28), Month: July 2014 - September 2014, Available at: www.paperpublications.org
Page | 12 Paper Publications
Internal Customer Satisfaction Assessment
in the Public Sector: A Case Study of Fleet
Management Services Delivery
Oteki Evans Biraori1, Dr.Bichanga Walter Okibo(PhD)
2, Wandera R. Wamalwa
3
1Masters,Jomo Kenyatta University of Agriculture and Technology, P. O. Box 6200, Nairobi. Kenya.
2 Senior lecturer, Jomo Kenyatta University of Agriculture and Technology, Nairobi. Kenya.
3Lecturer, Jomo Kenyatta University of Agriculture and Technology, Nairobi. Kenya.
Abstract: Internal customer satisfaction is a major component of quality improvement that most companies should
embrace together with developing strategies to improve quality of external customer service. When the internal
customer isn't satisfied, relationships with the external customer suffer. The researcher set out to examine the
quality of fleet management services to internal customers by use of SERVQUAL scale to measure the gap between
quality expectations and perceptions of the services so as to establish action plans. The objectives of the survey
were, to examine the various dimensions of service quality on internal customer satisfaction, to establish the level
of internal customer satisfaction and to establish the expectations of internal customers and areas for improvement
with the dependent variable being internal customer satisfaction. The study adopted a descriptive case research
design and the study population comprised of 118 management staff of Nzoia Suagr Company. A purposive
sampling technique was employed to select a sample size of 34 respondents. Questionnaires, interviews, secondary
data and observation were used for data collection. Descriptive statistics data analysis method was applied to
analyze numerical data gathered aided by Statistical Package for Social Sciences (SPSS). Results show that 48%
are highly satisfied, 40% moderately satisfied and 12% had low satisfaction with fleet management services,
SERVQUAL five scale had relationships to satisfaction and internal customers expect quick responses to requests.
It is recommended that transport department that manages fleet should always try to enhance customer
satisfaction via presenting high quality fleet management services, as a key element, in order to, first, not weaken
those dimensions which the internal customers are satisfied with and secondly, improve those services that aren’t
quality from internal customers perspective.
Keywords: External customer, Fleet Management, Internal customer, Service level agreements, Service Quality,
Supply Chain Management, Total Quality Management.
1. INTRODUCTION
Every business firm, regardless of what it produces or distributes, requires the movement of goods from one point to
another and, therefore, is involved in transportation. Transportation essentially concerns the spatial dimension of the
business firm. "The spatial dimension refers to geographical relationships and reflects the juxtaposition of firms with
respect to their materials sources, markets, and competitors, plus the spatial relations of the latter to their sources and
markets". The purpose or function of transportation is to serve as a connecting link between the spatially separated units
within a firm's own organization (such as between plant and warehouses) and between units of the firm and units of other
firms and individuals (such as suppliers and customers). Good transportation has the effect of holding to a minimum the
time and cost involved in the spatial relationships of the firm. In economic theory terms, transportation's function is to
create place utility for the goods produced or distributed by the firm. The word "utility" means usefulness or ability to
give satisfaction. Place utility exists when goods are in the place where they can be consumed. Goods that are not in the
place where they are needed have less than full value and so transportation creates value by creating place utility. Along
ISSN: 2349-7807
International Journal of Recent Research in Commerce Economics and Management (IJRRCEM) Vol. 1, Issue 2, pp: (12-28), Month: July 2014 - September 2014, Available at: www.paperpublications.org
Page | 13 Paper Publications
with the necessity to have goods in the right place, the goods must be there at the right time (time utility) and in the right
form (form utility) and in the possession or ownership of the person(s) who wants to consume them (possession utility).
Whether it is delivering goods to a warehouse to serve markets, moving goods into storage for future use, or forming an
integral part of a Just-In-Time system and delivering goods at the exact point in time they are needed, transportation adds
value to the goods by providing time utility.
Hence, Transport department offers fleet management services to other departments as follows; sales department by
delivering goods to customers, production by delivery of materials to factory, to marketing by delivery of promotional
materials to point of promotion, to HR by transporting workers to and from work and other social responsibility. The most
fundamental impacts of transportation relate to the physical capacity to convey passengers, goods and the associated costs
to support this mobility. This involves the setting of routes enabling new or existing interactions between economic
entities, improvement in the time performance, notably in terms of reliability, as well as reduced loss or damage. This
implies a better utilization level of existing transportation assets benefiting its users as passengers and freight are
conveyed more rapidly and with fewer delays, access to a wider market base where economies of scale in production,
distribution and consumption can be improved, increases in productivity from the access to a larger and more diverse base
of inputs (raw materials, parts, energy or labor) and broader markets for diverse outputs (intermediate and finished goods).
Another important geographical impact concerns the influence of transport on the location of activities.
In most of the organizations, various departments are inter-related. When performing their role in the organization, it
becomes a sheer necessity to approach the other department and a survey help bring out the shortcomings in any particular
department thereby facilitating early corrective measures. The internal customer concept is not new, nor is it a purely
public sector concept as the idea was first used over forty years ago to describe different forms of administrative
relationships within the private sector (Sayles, 1964). It stemmed from an understanding that in any organization all staffs
are both the providers and receivers of services and, critically, if poor internal service exists, then the final service to the
external customer will be diminished.
The concept of the internal customer is however particularly helpful in a public sector environment where the connection
between those for example in policy making or corporate service divisions, and external customers may not be readily
apparent. Developing an internal customer ethos serves to emphasize the idea that government departments cannot expect
to meet targets in respect of delivering a quality service to the public if the needs of staff are not met with similar
standards of timeliness, courtesy and consultation. However, the internal customer is not just about ensuring an
organization meets the needs of its external customers more effectively. The concept also highlights the fact that a duty of
care is owed to staff as colleagues. The definition of the internal customer used in this report is consistent with that found
in the international literature. Internal customer services are understood as covering those services provided by distinctive
organizational units/sections, or the people working therein, to other units/sections or individuals within the same
organization (Strauss, 1995). In relation to the Kenya civil service, this means that all civil servants working within the
same department, or in offices or other bodies coming under the aegis of the department, are internal customers.
An internal customer or internal service provider can be anyone in the organization. An internal customer can be a co-
worker, another department, or a distributor who depends upon a firm to provide products or services which in turn are
utilized to create a deliverable for the external customer. In general, internal customers don't have a choice. For example,
if the sales department doesn't like accounting's credit policies, they can't fire that department and hire another. However,
great (external) customer service creates customer satisfaction, customer loyalty, and customer retention thus means
positive gain to a firm.
Outstanding internal customer service is simply good business. Internal customer service can flourish only in high
communication environment. To create positive internal customer service, all departments work together cooperatively,
agree on processes and procedures, and negotiate expectations. Like gears meshing in synchronization, interdependent
business units meet each others' needs; work productively together to meet common goals, and deliver high quality
products and service to the external customer of a company thus gains in terms of profit and staff job satisfaction.
The focus on developing effective internal customer service helps organizations cut costs, increase productivity, improve
interdepartmental communication and cooperation, boost employee morale, align goals, harmonize processes and
procedures, replace interdepartmental competition with interdepartmental cooperation and deliver better service to the
external customer. Excellent service to the external customer is dependent upon healthy internal customer service
practices, (Strauss, 1995).

ISSN: 2349-7807
International Journal of Recent Research in Commerce Economics and Management (IJRRCEM) Vol. 1, Issue 2, pp: (12-28), Month: July 2014 - September 2014, Available at: www.paperpublications.org
Page | 14 Paper Publications
The need of internal customer satisfaction survey arises due to following reasons.
1). Rapidly growing organization
2). High or growing turnover rate
3). Excessive rumor's
4). Highly competitive industry
5). Planned and recent organizational changes
Internal customer satisfaction survey benefits have advantages such as 1).It creates better teamwork and much improved
work process, 2).It leads to higher output and superior quality product, 3). It decreases the turnover, 4).Reduced
overheads, and increase customer satisfaction level's inter departmental, 5). It enhances communication and hence help in
team building, hence there is less wasted effort caused by lack of common purpose and poor communication, 6). A good
employee feedback survey improves employee attitude and boosts morals.
Most of the sugar manufacturers are based in remote areas that are characterized by poor communication in terms of
roads. Their location is influenced by factors such as, expansive land to built structures for production plants, open and
closed warehouses, packing space for tractors and trailers and office space. Such firms also require sizeable land for
research on new varieties of cane, demonstration to farmers and nucleus farms to ensure against any non delivery by
contracted suppliers. Because of the location factors as identified, the companies have put in place transport departments
that help coordinate such logistics of movement of finished products to the market, transporting workers to and from
work, assist movement of inputs to farmers, movement of staff to access airports when travelling for workshops in major
cities and movement of staff to health services. The department hence offers transport services to all other departments as
its internal customers to enable the other departments also offer services to the external customers of the firms. The
quality of services offered to internal departments such as transport of raw materials, inputs and delivery of finished goods
impacts on the services offered to external customer and thus a study to find out the quality of transport services offered to
internal customer is necessary to map out gaps and to strategize on how to fill the gaps for the better of company
operations. With the near end of COMESA safe guards, public sugar companies are under pressure to practice cost cutting
and increase efficiency. One and the most immediate that requires no expenditure is service delivery to avoid losses from
none performance of simple tasks. Service delivery covers internal service services offered to each department such as
purchasing, transport, information technology, security, accounts and stores. The organization for this research has
commissioned a survey to establish the current level of internal customer satisfaction for the services above and the
researcher has directed efforts to transport services delivery.
Current situation in the Sugar sector is undergoing changes to fit in the competitive business world by reducing its
operating costs. One area identified for cost reduction is transport services both to internal and external services. Cost
control savings can result from reduced or elimination of overtime payments, not using company cars for private gains,
good vehicle maintenance and cost analysis to dispose uneconomically performing fleet, elimination of idle fleet and
under utilization of fleet. In Nzoia sugar, services offered by transport department to other departments include, fueling
and consumption monitoring, driver allocation, movement of materials to farmers, movement of finished product to
market, insurance cover coordination, accident reporting and follow up with the police and insurer, statutory inspections,
assessing viability of fleet, specification for new vehicle replacement and reports to management for decision making.
Figure 1.1 below shows the fleet of the study Company.
Table 1.1. Nzoia fleet
Type Number
Motor cycles 63
Cars 20
Pickups 13
Buses 2
Fire Tender 1
Lorry 1
Total 100
In the company of the study, previously departments were permanently allocated the vehicles and head of departments
were fully in charge of routing. Vehicles were being used without any checks which lead to misuse. This made controlling
ISSN: 2349-7807
International Journal of Recent Research in Commerce Economics and Management (IJRRCEM) Vol. 1, Issue 2, pp: (12-28), Month: July 2014 - September 2014, Available at: www.paperpublications.org
Page | 15 Paper Publications
and monitoring of fuel difficult and as a result costs were high. In the recent past, all vehicles have been pooled and
managed by one department so as to reduce costs by eliminating unnecessary journeys, by combing requests for those
going to the same destination, by giving consolidated reports to management for decision making. The pooling of vehicles
generated resistance from users because their use were curtailed and checked, but for efficiency, the transport department
has stood. From records obtained, the company is ISO certified and the document “Pool Transport Procedures & Work
Instruction Manual”, sets out the department objective and operational procedures on provision of transport services such
as requesting & allocation of vehicles, service & maintenance, accident management, work tickets & logbooks,
management buses, insurance covers & inspection stickers, employees vehicles on company loan schemes and finally
operation & driving of company vehicles. The major area of meeting between transport department and other departments
is the requesting for vehicle form as set out in the manual. The management commissioned this survey so as to know the
satisfaction level and enlist internal customer expectations and areas for future improvement to enable internal customers
get world class services from transport department.
Statement of the Problem
The changing nature of commerce is pushing managers to focus on developing their people and recognizing co-workers as
customers. Successful companies have an obsession with quality and quality customer service entails among others
prompt and reliable attention to customers. Extensive research has been conducted on the characteristics and quality of
organizational effectiveness from the perspective of those who are the organization‟s external customers. Much less has
been reported about organizational effectiveness from the perspective of internal customer satisfaction. Yet, effective
internal customer relations are essential prerequisites to the level of quality service that yields sustained external customer
satisfaction, loyalty, retention and long-term financial success. Most companies tend to place more emphasis on satisfying
external customers (those who contribute directly to the company‟s revenue stream) than internal customers (employees
of the company). Perhaps the emphasis is correct, but what is not clearly understood is the relationship between internal
customer satisfaction and external customer satisfaction. Officers in direct contact with external customers have often
been heard complaining that they are not receiving the right inputs and feed to enable them respond to external customer
concerns. The results have been occasional frustration and subsequent lack of motivation on the part of customer service
points or personnel in delivering the right service to the external customers. Overcoming these frustration and lack of
motivation will entail a reconception of the term customer to include both internal and external customers and a conscious
effort made to address the needs of the internal customer as a way of improving external customer satisfaction.
General Objective
The purpose of the research was to establish the relationship between service quality and internal customer satisfaction.
Specific Objectives
1. To examine the various dimensions of service quality on internal customer satisfaction.
2. To establish the level of internal customer satisfaction.
3. To establish the ideas/views and expectations of internal customers and areas for improvement.
Significance of the Study
The study will help the organization to realize the benefits that can result from service quality and understand what
dangers that can arise if they do not provide quality services to its internal customers. It will also help the organization to
continue exploring ways to serve its internal customers in a better and more efficient manner and will also continue to
strive to reinforce its position in employee commitment and job satisfaction. The study can benefit other similar firms in
the sector. Lastly, it will add to the body of literature on the subject for future researchers.
2. LITERATURE REVIEW
Literature on customer satisfaction, internal customer satisfaction and the expectations of internal customers were
reviewed as below.
2.1 Customer Satisfaction
The customer is an integral part of a company‟s workings. The legendary Indian prime minister, Mahatma Gandhi
expressed the importance of the customer by stating: “Customer is the most important visitor to our premises. He is not
ISSN: 2349-7807
International Journal of Recent Research in Commerce Economics and Management (IJRRCEM) Vol. 1, Issue 2, pp: (12-28), Month: July 2014 - September 2014, Available at: www.paperpublications.org
Page | 16 Paper Publications
dependent on us. We are dependent on him. He is not an interruption on our work. He is the purpose of it. He is not an
outsider on our business. He is part of it. We are not doing him a favor by serving him. He is doing us a favor by giving us
an opportunity to do so.” as quoted by Holdway (2001).
The definition of customer satisfaction has been widely debated as organizations increasingly attempt to measure it.
Customer satisfaction can be experienced in a variety of situations and connected to both goods and services. It is a highly
personal assessment that is greatly affected by customer expectations. Satisfaction is also based on the customer‟s
experience of both contacts with the organization and personal outcomes. Mack and Karp (1989), define a satisfied
customer within the private sector as “one who receives significant added value” to his/her bottom line. A customer may
be satisfied with a product or service, an experience, a purchase decision, a salesperson, store, service provider, or an
attribute or any of these (Padilla, 1996). Erson (1998) defines “world class customer service” as including the following:
courtesy, competency, responsiveness, professionalism, attractiveness, reliability, completeness of product, and good
communication. This definition encompasses these facets of creating a positive experience for the customer. Appraising
the current level of these characteristics and broadening the scope on them can achieve customer satisfaction.
There are many techniques that are used to identify, assess and create a positive experience for the customer. Graham
(1994) explicates five ideas for a “knowledge is service” approach, two of which are relevant here. The first is
“information sustains relationships”; by collecting information you can better understand wants and needs of the
customer. Secondly, “doing it right”; this is explained by pleasing the customer; by helping them achieve their goals as
well as achieving the organization‟s goals in the process. This point may be better explained by placing high value on a
continuing contribution to customers‟ success (Graham, 1994).
2.2 Internal Customer Satisfaction
In many organizations, customer satisfaction ultimately boils down to the customer‟s contact with frontline staff. Capable,
empowered frontline staff put customer-focused mission statements, standards and culture into practice. Customer
satisfaction has dominated much of the recent service literature. Some of this literature suggests that to deliver high levels
of customer satisfaction, organizations must identify, measure, and manage the internal elements that produce it (Zemke,
1989; Heskett, 1990; Zeithaml, 1990, Berry; 1991). According to Schoorman, et al (1988), internal customer satisfaction
is defined as employee satisfaction with the service received from internal service providers, while Ersen, (1997) defines
internal customer as a person that works in an organization.
Although internal customer satisfaction has been approached from different perspectives, the fundamental belief is that
organizations attempting to deliver service quality to their external customers must begin by serving the needs of their
internal customers (Schoorman, F. David, and Schneider, Benjamin, 1988). The concept of internal customer has an
important place in improving the activities in the process of production and service giving. Each unit and section is the
customer of the stages prior to itself (Ersen, 1997).
The quality of service delivered to external customer is often determined by the quality of service that internal customers
(employees) provide each other, (Cook, S., 2000). It is important to remember that, everyone within an organization
provides a service. There are „internal‟ as well as „external‟ customers. Internal customer is the worker in an organization
responsible to produce products. Every worker receives materials or services from another worker in the process of
making their own products. It is imperative that, in order to satisfy external customers, internal customers be delighted
first. Just as customer service leads to customer satisfaction, internal customer service leads to employee satisfaction.
The internal customer concept is not new; the idea was first used almost forty years ago to describe different forms of
administrative relationships within the private sector (Sayles, 1964). It stemmed from an understanding that in any
organization all staff are both the providers and receivers of services and, critically, if poor internal service exists, then the
final service to the external customer will be diminished. According to Strauss, (1995), internal customer services are
understood as covering those services provided by distinctive organizational units/sections, or the people working therein,
to other units/sections or individuals within the same organization. Sasser and Arbeit (1976) suggested that the concept of
the internal customer evolved originally with the intention of making jobs in the services sector more attractive, thereby
promoting the recruitment and retention of staff. Berry (1981) argued that organizations should view employees as
internal customers, jobs as internal products and thereby seek to provide internal products that satisfy the needs of internal
customers at the same time as promoting the aims of the organization itself. As Bowen and Johnston (1998) have put it,
“The idea is that if management wants employees to deliver an outstanding level of service to customers, then it must be
prepared to do a great job with its employees”.
ISSN: 2349-7807
International Journal of Recent Research in Commerce Economics and Management (IJRRCEM) Vol. 1, Issue 2, pp: (12-28), Month: July 2014 - September 2014, Available at: www.paperpublications.org
Page | 17 Paper Publications
In TQM systems, all staffs are encouraged to see each other as important customers throughout the production and/or
service delivery processes (Marshall and Miller, 1991 a and b). Put simply, in any organization, all staff are both the
providers and receivers of services. George (1990), points out that while many employees do not directly come in contact
with external customers themselves, what they do or do not do indirectly influences the quality of service delivered. To
address this issue, such personnel need to recognize value and treat other employees as internal customers.
It is however important to acknowledge that internal customers are as varied and diverse in their individual characteristics
as external customers. Just as the “general public” can be a misleading generalization, likewise it is important to recognize
and respond positively to diversity in the internal customer base (Joanna O‟Riordan and Peter C. Humphreys, 2003). They
also stated that, it is important to acknowledge different types of internal customer service relationships, some of which
may be more urgent and mission critical in their character than others. For example, a system-wide ICT failure has
different implications for service delivery than poor relations between policy and operational units. Additionally, it is
important not to assume that external and internal customer service relationships are directly equivalent in character. For
example, internal customers are paid consumers of the services they use. As such they are, in general, more familiar with,
and knowledgeable about, the services that are provided than external customers. As a result they may be more
demanding customers than ordinary citizens, (Joanna O‟Riordan and Peter C. Humphreys, 2003). The need to promote
good internal communications in respect of building bridges with other departments and services is important. Nicholls et
al. (1998) noted that public sector organizations spend a lot of money on training, but fail to focus their training programs
on customer service and service performance. Teas (1993), suggest that it is managerial attitudes that set the tone for staff,
thus, if the boss doesn‟t care too much about satisfying the customer, then staff will adopt the same attitude.
2.3. Internal customer expectations
The foundation for outstanding internal customer service is excellent interdepartmental communication and cooperation.
Dialogue between internal customers and internal providers (or vendors) must include agreements about the following
topics;
Clear Expectations: An internal provider of service is responsible for setting clear guidelines about what internal
customers can reasonably expect. Some organizations implement Service Level Agreements (SLAs) defining what
internal customers can expect from internal service providers. Even without formal SLAs, internal customer service can
be exceptional if the internal service provider has clarified to internal customers what expectations are reasonable. Internal
customers also must communicate expectations regarding timeline and quality in advance of request. Last minute requests
are typically due to poor planning on the part of the internal customer. Expecting the internal provider to 'hijack' priorities
to meet unreasonable needs is inappropriate, and should be dealt with on a case-by-case basis, with involvement by upper
management. At no time should this become the norm, or the internal customer will become 'trained' always to expect the
unrealistic from the service provider.
Customer Responsibilities: To meet expectations, internal provider of service is responsible for clarifying what is needed
from the internal customer, and also clarifying service provider processes and timelines necessary to meet quality
requirements of customers. The phrase "Help me help you" from the movie "Jerry Maguire" applies here.
In order to provide the best customer service, internal providers need the cooperation of its customers in allowing enough
lead time and providing information and materials necessary to fulfill customer request. This is a communication
responsibility of the internal service provider to let the customer know 'what I need from you in order to meet your
request is ....' It's essential to have an understanding with customers about realistic timelines and quality expectations.
Internal providers who find they're constantly working on customer 'emergencies' must clarify to customers the strain this
causes to provider. Constant emergencies diminish provider's ability to give good service to all internal customers, and
create a stressful working environment, not to mention interdepartmental animosity generated by that omission by internal
customer.
Service Provider Responsibilities: Most internal customer service problems are a result of the 'silo' mentality where
people and departments work in isolation, consider only their own priorities, and think others are sitting around twiddling
their thumbs with nothing to do until an internal customer screams "Jump!" in a last minute panic. This is sure to
guarantee lower levels of quality, resentment from provider, and a reputation for lack of professionalism on part of
customer. Customers must take responsibility for understanding how their request fits into overall workflow of
ISSN: 2349-7807
International Journal of Recent Research in Commerce Economics and Management (IJRRCEM) Vol. 1, Issue 2, pp: (12-28), Month: July 2014 - September 2014, Available at: www.paperpublications.org
Page | 18 Paper Publications
organization and internal service provider's workflow. Internal service providers are responsible for explaining their
workflow, so the customer will understand he or she isn't the only priority.
Negotiated Priorities: While most customer priorities are 'urgent - must have right away' this is counterproductive to any
process. A clear communication between internal customers and service providers is essential. With internal customer
service, most customers believe the provider should intuitively understand priorities because they all work for the same
organization. This is false! A discussion about priorities must be part of the expectation-setting talk.
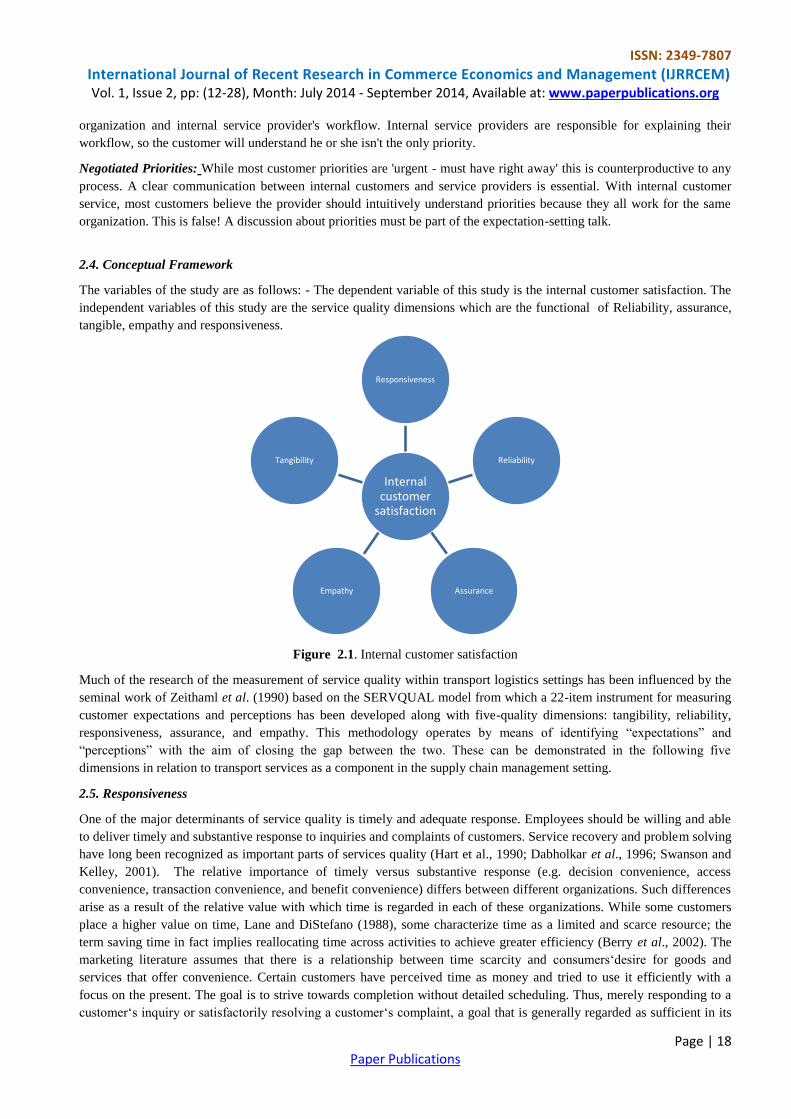
2.4. Conceptual Framework
The variables of the study are as follows: - The dependent variable of this study is the internal customer satisfaction. The
independent variables of this study are the service quality dimensions which are the functional of Reliability, assurance,
tangible, empathy and responsiveness.
Figure 2.1. Internal customer satisfaction
Much of the research of the measurement of service quality within transport logistics settings has been influenced by the
seminal work of Zeithaml et al. (1990) based on the SERVQUAL model from which a 22-item instrument for measuring
customer expectations and perceptions has been developed along with five-quality dimensions: tangibility, reliability,
responsiveness, assurance, and empathy. This methodology operates by means of identifying “expectations” and
“perceptions” with the aim of closing the gap between the two. These can be demonstrated in the following five
dimensions in relation to transport services as a component in the supply chain management setting.
2.5. Responsiveness
One of the major determinants of service quality is timely and adequate response. Employees should be willing and able
to deliver timely and substantive response to inquiries and complaints of customers. Service recovery and problem solving
have long been recognized as important parts of services quality (Hart et al., 1990; Dabholkar et al., 1996; Swanson and
Kelley, 2001). The relative importance of timely versus substantive response (e.g. decision convenience, access
convenience, transaction convenience, and benefit convenience) differs between different organizations. Such differences
arise as a result of the relative value with which time is regarded in each of these organizations. While some customers
place a higher value on time, Lane and DiStefano (1988), some characterize time as a limited and scarce resource; the
term saving time in fact implies reallocating time across activities to achieve greater efficiency (Berry et al., 2002). The
marketing literature assumes that there is a relationship between time scarcity and consumers„desire for goods and
services that offer convenience. Certain customers have perceived time as money and tried to use it efficiently with a
focus on the present. The goal is to strive towards completion without detailed scheduling. Thus, merely responding to a
customer„s inquiry or satisfactorily resolving a customer„s complaint, a goal that is generally regarded as sufficient in its
Internal customer
satisfaction
Responsiveness
Reliability
Assurance Empathy
Tangibility
ISSN: 2349-7807
International Journal of Recent Research in Commerce Economics and Management (IJRRCEM) Vol. 1, Issue 2, pp: (12-28), Month: July 2014 - September 2014, Available at: www.paperpublications.org
Page | 19 Paper Publications
own end tends to fall short of meeting a customer„s expectations of quality of service. In service organizations, these tasks
should be addressed and resolved swiftly. Transport department should be responsive to the shifting needs of their
customers (other departments) in providing transport services.
2.6. Empathy
Empathy is the capacity a person has to experience another‟s feelings. Does the service department provide careful and
personalized attention? These elements clearly have a highly subjective factor linked to the person who perceives the
service. In reality, according to Kilbourne et al. (2004), every type of service can have determining factors that are
considered more important than others, which will depend on environment characteristics or type of activity. It is
sometimes a challenge for institutions to exceed customer expectations and demands. For instance, a shortage of vehicles
and the need for world class services to departments have seen an increase in transport services, stretching the vehicle-
staff ratio. This has implication on the level of individual attention and empathy given to each staff in the company.
Further, transport department staff is expected to assume multiple roles policy writing, fuel allocation, vehicle movement
mentoring, drivers supervising and administrative responsibilities, the level of service quality may become less
standardized and desirable over tie.
2.7. Tangibility
Tangibility refers to the physical evidence of the service, consisting of physical facilities, appearance of personnel, tools
or equipments, physical presentation of the service, and other customers in the service facility (Parasuraman et al., 1985).
Customers are generally satisfied with acceptable performance of the service in terms of the core benefits it promises to
offer. In general, these consumers are highly functional in their choice criteria partly due to personality factors that are in
turn shaped by higher-level influences such as values, meanings, culture, and philosophy of life (Triandis, 1995). The core
benefits of a service refer to the essence of the service that can never be substituted by fancy facilities and tangibles
(Schneider & Bowen, 1999). On the other hand, the high level customers are generally satisfied only when the service
offers extended benefits beyond the functional ones. These extended benefits tend to be more intangible than the core
service. Bitner (1992) explains the impact of services capes in influencing customers at the physiological, sociological,
cognitive and emotional levels. In terms of Maslow„s hierarchy, product needs are of a lower Order compared to those of
undeveloped societies that are of a higher order. Thus, while a Service supplier in a less developed country could be
preoccupied with communicating the quality and value of the service per second, a supplier in a developed society can
take extra effort to present added benefits such as lifestyles and sensory experiences. The challenge for institutions is to
ensure that service specifications such as delivery and application meet the expectations of their customers consistently.
This is a precarious concern as performance associated with these “specifications” is highly context-driven based on a
variety of factors, sometimes beyond the control of the actors involved.
2.8. Reliability
Is the department reliable in providing the service? Does it provide as promised? Reliability reflects a service
department‟s consistency and certainty in terms of performance. Reliability is the most important dimension for the
consumer of services; Discrepancy between promise and delivery is largely the result of inaccurate communication from
memos and internal requests for transport needs. Some service departments tend to oversell their services, leading to
grand promises that misrepresent their actual potential and delivery readiness. Reliability can be affected by the request or
order procedure of the service users. Service providers need to plan for the fleet available which works well when service
users request for the service in advance before the actual need of a service.
2.9. Assurance
Judgment of high- service or low-service quality largely depends on how the customers perceive the actual performance
based on their expectation. The level of tolerance in service standards differs across all areas; for instance, the more
important the area, the smaller the boundary of tolerance (for example request of transport services for a CEO is urgent as
compared to HOD, HOS and respectively up to the lowest cadre in an organization). Customers‟ willingness to modify
expectation of service standards can be appropriately managed through the availability of choices. These should diversify
the expectation levels of customers in a way that the shortcomings of one service can be offset by the strengths of another.
Each department builds its own quality assurance system, sets objectives and selects the methods of quality assurance.
ISSN: 2349-7807
International Journal of Recent Research in Commerce Economics and Management (IJRRCEM) Vol. 1, Issue 2, pp: (12-28), Month: July 2014 - September 2014, Available at: www.paperpublications.org
Page | 20 Paper Publications
Quality assurance must be taken into account in the general conceptual framework to evaluate the department
performance, because quality assurance is compulsory as set out by ISO.
2.10. Empirical review
Quality management is a broad theme that encompasses every sort of organization, multinational or national, eastern or
western, large or small, services or manufacturing and public or private (Delazaro, 1998). According to Oliveira (2004),
its concept depends on the context in which it is applied, in face of the subjectivity and complexity of its meaning.
Bateson (2001, p.363) says “quality is generally considered an attribute in consumer choices”. Quality in services can be
defined as a customer satisfaction index for any service, and this satisfaction can be measured by any criteria (Satollo et
al., 2005). Quality in services provides a competitive factor for continued consumption, especially when intangibility
relations are tightened between quality and the services. Responsibility and trust, two of the dimensions of service quality
grouped by Parasuraman, Zeithaml and Berry (1985), generated by prior experience, are important factors for determining
perceived quality by clients (Zanella, Lima and Lopes, 2006). Quality is judged according to perceived satisfaction.
According to Grönroos (2005, p.54), perceived quality is determined "by the gap between expected quality and
experienced quality", that is, it is the difference between client perceptions and expectations. Satisfying the clients‟
immediate and explicit expectations should be sought in the short term. However, in the mid and long term, it is important
to develop competences to achieve their real needs, even those that are not explicit or are unconscious (Coelho, 2004,
p.37). According to the same author, quality is only measured at the end of the process, that is, when the service has been
concluded, and there is no way to change client perception regarding the service received.
According to Parasuraman, Zeithaml and Berry (1985), regardless of the type of service, consumers basically use the
same criteria to assess quality. Service quality is a general opinion the client forms regarding its delivery, which is
constituted by a series of successful or unsuccessful experiences. Managing gaps in service will help the company
improve its quality. But gaps are not the only means clients use to judge a service. They can also use five broad-based
dimensions as judgment criteria: reliability, tangibility, responsibility, security and empathy (Lovelock, 2001). Therefore,
we can conclude that as for any business or industry, customer satisfaction is one of the major key performance indicators
in the success of such organization same applied for transport departments, where other departments are its customers.
3. METHODOLOGY
The study adopted a descriptive research design. According to Sekeran (2003), descriptive research design is type of
design used to obtain information concerning the current status of the phenomena to describe "what exists" with respect to
variables or conditions in a situation. Mugenda and Mugenda (1999) describes descriptive research as including surveys
and fact- finding enquiries adding that the major purpose of descriptive research is to describe the state of phenomena as
it exists at present. The study focuses on the variables that affect the internal customer's satisfaction directly through
monitoring their expectations & perceptions of service quality overtime and the specific issues raised by the findings. The
study adopted purposive sampling. In purposive sampling - Subjects are selected because of some characteristic (Patton,
1990). Purposive sampling illustrates characteristics of particular subgroups of interest, facilitates comparisons. This
method exposes the researcher to various stakeholders who have different experiences with the issues under study. The
selection criterion was based on the number of management staff per function. A sample of 34 respondents was identified
according to their seniority. The sample of respondents for this survey was considered suitable due to its relevance in the
focus and purpose of the study (Creswell, 2003; Neumann, 2003). It is management staff who requests and receives
services on behalf of their departments. Primary data was gathered through the use of questionnaire in form of a semi
structured questionnaire (open and close ended questions). The five SERVQUAL dimensions were modified and used to
measure functional quality. Modification of the instrument for different service settings is supported by the developers of
the instrument (Parasuraman et al., 1994).
Questionnaires were used as the main data collection instrument, and then interviews for clarification and observations of
internal customer approach on service request. The study adopted Likert Five Point rating scale of 5, 4, 3, 2, and 1, which
was used to capture responses in the questionnaire. The format of a typical five-level Likert item, were: 1) Always 2.)
Most of the times 3.) Neutral 4.) Sometimes 5.) Never. Open ended questions were also set out in the questionnaire to
gather internal customer expectations and areas for improvement.
ISSN: 2349-7807
International Journal of Recent Research in Commerce Economics and Management (IJRRCEM) Vol. 1, Issue 2, pp: (12-28), Month: July 2014 - September 2014, Available at: www.paperpublications.org
Page | 21 Paper Publications
To produce meaningful information, analysis of the data was done using the statistical package for social sciences (SPSS)
this helped in summarizing the data in tables and charts which made the findings easy to understand in chapter four and
made clear conclusions to stakeholders. Data was presented according to research findings after processing, mainly in
form of tables and discussions. In addition, descriptive and inferential were used in determining the existence of the
relationship between the variables so as to draw conclusions.
4. RESEARCH FINDINGS AND DISCUSSION
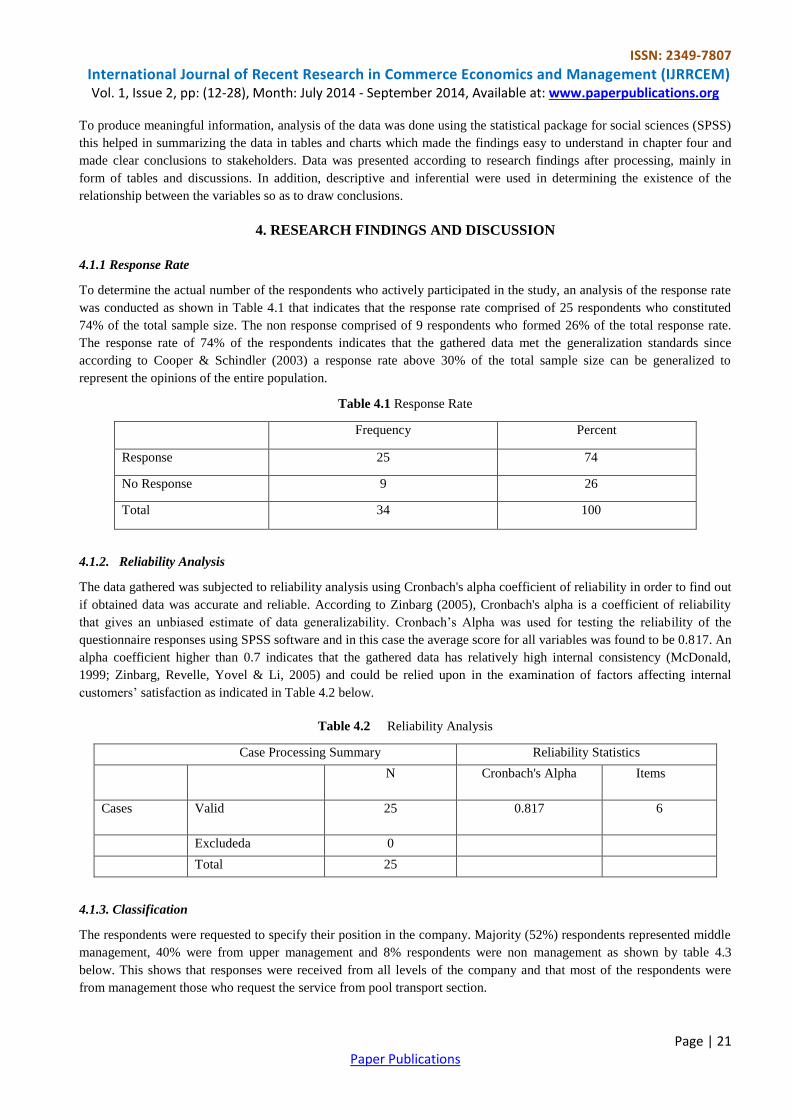
4.1.1 Response Rate
To determine the actual number of the respondents who actively participated in the study, an analysis of the response rate
was conducted as shown in Table 4.1 that indicates that the response rate comprised of 25 respondents who constituted
74% of the total sample size. The non response comprised of 9 respondents who formed 26% of the total response rate.
The response rate of 74% of the respondents indicates that the gathered data met the generalization standards since
according to Cooper & Schindler (2003) a response rate above 30% of the total sample size can be generalized to
represent the opinions of the entire population.
Table 4.1 Response Rate
Frequency Percent
Response 25 74
No Response 9 26
Total 34 100
4.1.2. Reliability Analysis
The data gathered was subjected to reliability analysis using Cronbach's alpha coefficient of reliability in order to find out
if obtained data was accurate and reliable. According to Zinbarg (2005), Cronbach's alpha is a coefficient of reliability
that gives an unbiased estimate of data generalizability. Cronbach‟s Alpha was used for testing the reliability of the
questionnaire responses using SPSS software and in this case the average score for all variables was found to be 0.817. An
alpha coefficient higher than 0.7 indicates that the gathered data has relatively high internal consistency (McDonald,
1999; Zinbarg, Revelle, Yovel & Li, 2005) and could be relied upon in the examination of factors affecting internal
customers‟ satisfaction as indicated in Table 4.2 below.
Table 4.2 Reliability Analysis
Case Processing Summary Reliability Statistics
N Cronbach's Alpha Items
Cases Valid 25 0.817 6
Excludeda 0
Total 25
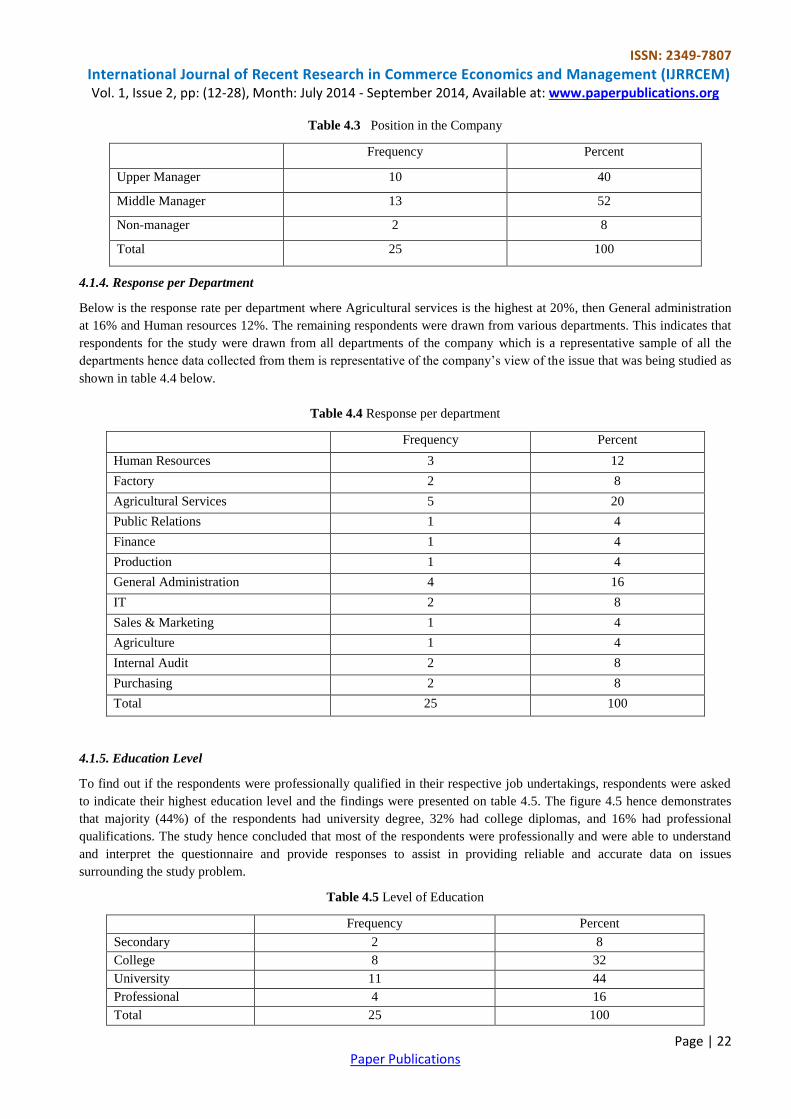
4.1.3. Classification
The respondents were requested to specify their position in the company. Majority (52%) respondents represented middle
management, 40% were from upper management and 8% respondents were non management as shown by table 4.3
below. This shows that responses were received from all levels of the company and that most of the respondents were
from management those who request the service from pool transport section.
ISSN: 2349-7807
International Journal of Recent Research in Commerce Economics and Management (IJRRCEM) Vol. 1, Issue 2, pp: (12-28), Month: July 2014 - September 2014, Available at: www.paperpublications.org
Page | 22 Paper Publications
Table 4.3 Position in the Company
Frequency Percent
Upper Manager 10 40
Middle Manager 13 52
Non-manager 2 8
Total 25 100
4.1.4. Response per Department
Below is the response rate per department where Agricultural services is the highest at 20%, then General administration
at 16% and Human resources 12%. The remaining respondents were drawn from various departments. This indicates that
respondents for the study were drawn from all departments of the company which is a representative sample of all the
departments hence data collected from them is representative of the company‟s view of the issue that was being studied as
shown in table 4.4 below.
Table 4.4 Response per department
Frequency Percent
Human Resources 3 12
Factory 2 8
Agricultural Services 5 20
Public Relations 1 4
Finance 1 4
Production 1 4
General Administration 4 16
IT 2 8
Sales & Marketing 1 4
Agriculture 1 4
Internal Audit 2 8
Purchasing 2 8
Total 25 100
4.1.5. Education Level
To find out if the respondents were professionally qualified in their respective job undertakings, respondents were asked
to indicate their highest education level and the findings were presented on table 4.5. The figure 4.5 hence demonstrates
that majority (44%) of the respondents had university degree, 32% had college diplomas, and 16% had professional
qualifications. The study hence concluded that most of the respondents were professionally and were able to understand
and interpret the questionnaire and provide responses to assist in providing reliable and accurate data on issues
surrounding the study problem.
Table 4.5 Level of Education
Frequency Percent
Secondary 2 8
College 8 32
University 11 44
Professional 4 16
Total 25 100
ISSN: 2349-7807
International Journal of Recent Research in Commerce Economics and Management (IJRRCEM) Vol. 1, Issue 2, pp: (12-28), Month: July 2014 - September 2014, Available at: www.paperpublications.org
Page | 23 Paper Publications
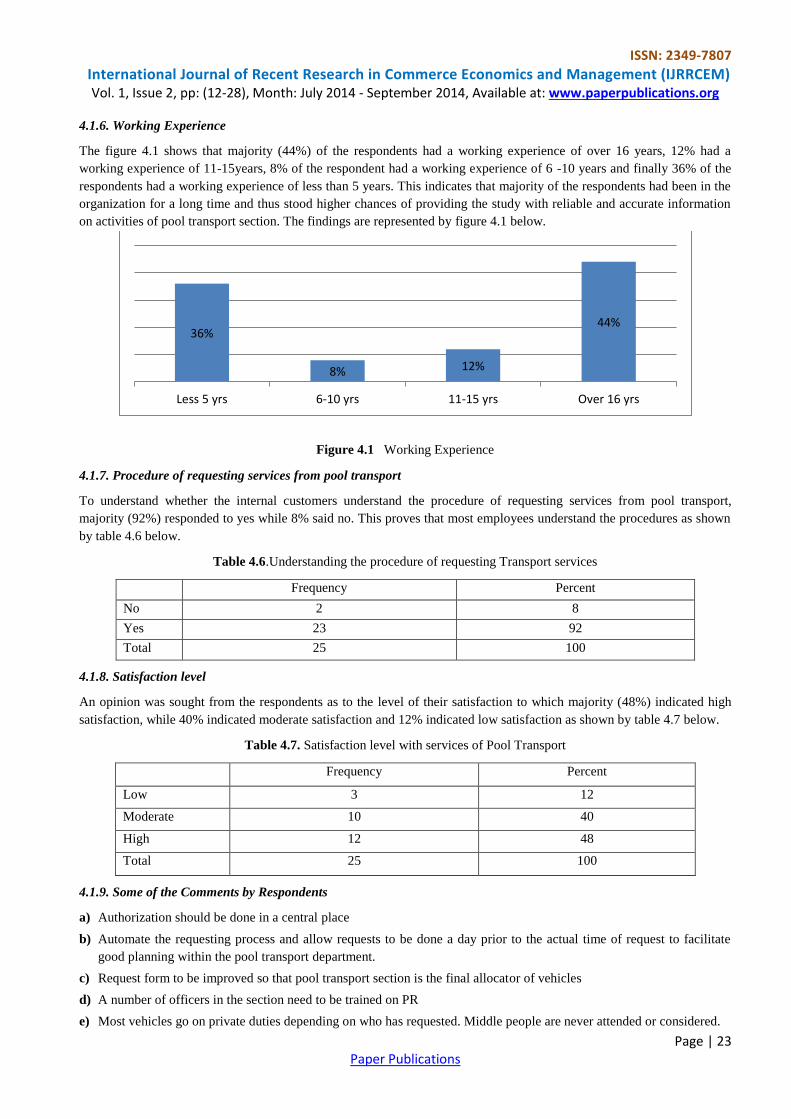
4.1.6. Working Experience
The figure 4.1 shows that majority (44%) of the respondents had a working experience of over 16 years, 12% had a
working experience of 11-15years, 8% of the respondent had a working experience of 6 -10 years and finally 36% of the
respondents had a working experience of less than 5 years. This indicates that majority of the respondents had been in the
organization for a long time and thus stood higher chances of providing the study with reliable and accurate information
on activities of pool transport section. The findings are represented by figure 4.1 below.
Figure 4.1 Working Experience
4.1.7. Procedure of requesting services from pool transport
To understand whether the internal customers understand the procedure of requesting services from pool transport,
majority (92%) responded to yes while 8% said no. This proves that most employees understand the procedures as shown
by table 4.6 below.
Table 4.6.Understanding the procedure of requesting Transport services
Frequency Percent
No 2 8
Yes 23 92
Total 25 100
4.1.8. Satisfaction level
An opinion was sought from the respondents as to the level of their satisfaction to which majority (48%) indicated high
satisfaction, while 40% indicated moderate satisfaction and 12% indicated low satisfaction as shown by table 4.7 below.
Table 4.7. Satisfaction level with services of Pool Transport
Frequency Percent
Low 3 12
Moderate 10 40
High 12 48
Total 25 100
4.1.9. Some of the Comments by Respondents
a) Authorization should be done in a central place
b) Automate the requesting process and allow requests to be done a day prior to the actual time of request to facilitate
good planning within the pool transport department.
c) Request form to be improved so that pool transport section is the final allocator of vehicles
d) A number of officers in the section need to be trained on PR
e) Most vehicles go on private duties depending on who has requested. Middle people are never attended or considered.
36%
8% 12%
44%
Less 5 yrs 6-10 yrs 11-15 yrs Over 16 yrs
ISSN: 2349-7807
International Journal of Recent Research in Commerce Economics and Management (IJRRCEM) Vol. 1, Issue 2, pp: (12-28), Month: July 2014 - September 2014, Available at: www.paperpublications.org
Page | 24 Paper Publications
f) Inspection unit to be in place for proper supervision
g) Enforce refresher courses for drivers.
h) Assist procurement to engage a competent Transport firm for BODs
i) All vehicles
j) should be pooled. Pool transport section to be given full mandate on operation of all company vehicles.
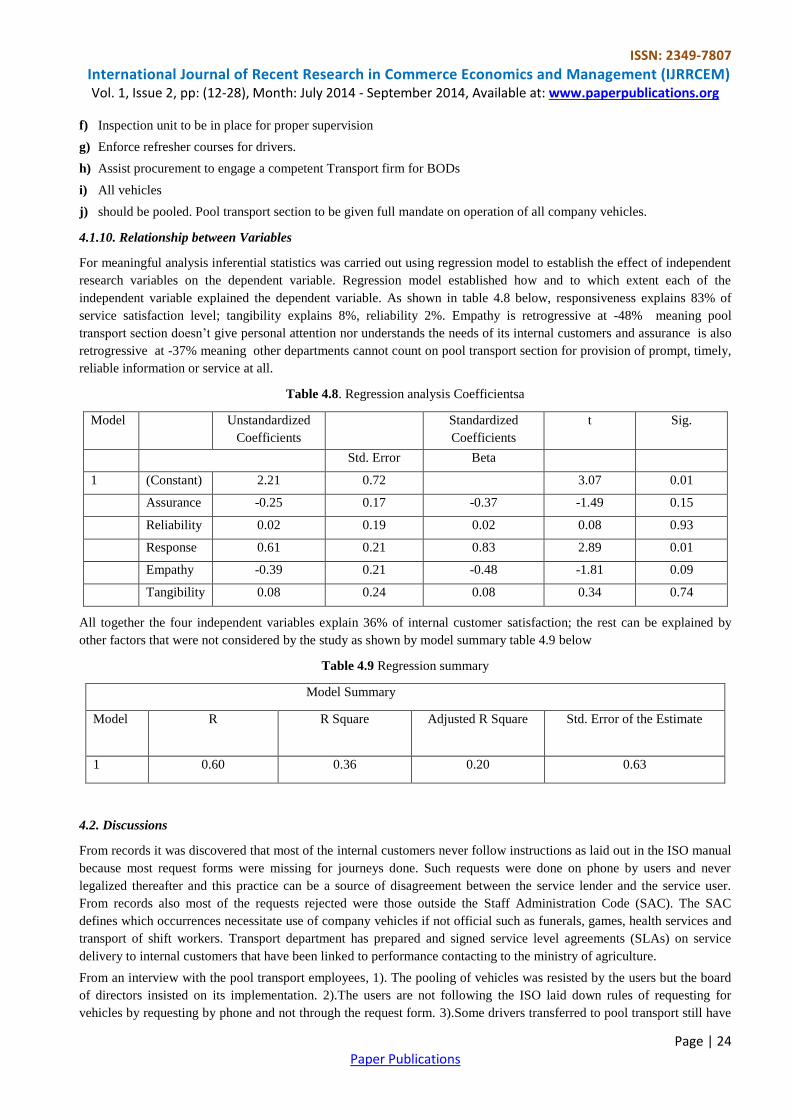
4.1.10. Relationship between Variables
For meaningful analysis inferential statistics was carried out using regression model to establish the effect of independent
research variables on the dependent variable. Regression model established how and to which extent each of the
independent variable explained the dependent variable. As shown in table 4.8 below, responsiveness explains 83% of
service satisfaction level; tangibility explains 8%, reliability 2%. Empathy is retrogressive at -48% meaning pool
transport section doesn‟t give personal attention nor understands the needs of its internal customers and assurance is also
retrogressive at -37% meaning other departments cannot count on pool transport section for provision of prompt, timely,
reliable information or service at all.
Table 4.8. Regression analysis Coefficientsa
Model Unstandardized
Coefficients
Standardized
Coefficients
t Sig.
Std. Error Beta
1 (Constant) 2.21 0.72 3.07 0.01
Assurance -0.25 0.17 -0.37 -1.49 0.15
Reliability 0.02 0.19 0.02 0.08 0.93
Response 0.61 0.21 0.83 2.89 0.01
Empathy -0.39 0.21 -0.48 -1.81 0.09
Tangibility 0.08 0.24 0.08 0.34 0.74
All together the four independent variables explain 36% of internal customer satisfaction; the rest can be explained by
other factors that were not considered by the study as shown by model summary table 4.9 below
Table 4.9 Regression summary
Model Summary
Model R R Square Adjusted R Square Std. Error of the Estimate
1 0.60 0.36 0.20 0.63
4.2. Discussions
From records it was discovered that most of the internal customers never follow instructions as laid out in the ISO manual
because most request forms were missing for journeys done. Such requests were done on phone by users and never
legalized thereafter and this practice can be a source of disagreement between the service lender and the service user.
From records also most of the requests rejected were those outside the Staff Administration Code (SAC). The SAC
defines which occurrences necessitate use of company vehicles if not official such as funerals, games, health services and
transport of shift workers. Transport department has prepared and signed service level agreements (SLAs) on service
delivery to internal customers that have been linked to performance contacting to the ministry of agriculture.
From an interview with the pool transport employees, 1). The pooling of vehicles was resisted by the users but the board
of directors insisted on its implementation. 2).The users are not following the ISO laid down rules of requesting for
vehicles by requesting by phone and not through the request form. 3).Some drivers transferred to pool transport still have
ISSN: 2349-7807
International Journal of Recent Research in Commerce Economics and Management (IJRRCEM) Vol. 1, Issue 2, pp: (12-28), Month: July 2014 - September 2014, Available at: www.paperpublications.org
Page | 25 Paper Publications
some attachment to their departmental bosses in that their previous bosses call them directly for services bypassing pool
transport department. 4). Employees request for vehicles to funerals for cases not covered in the SAC. 5). Vehicles are
few than requests and pool transport prioritizes requests to Agriculture and Agricultural services departments. 6).The
union officials are very strong in requesting for transport services and always they get it whenever they require one of
course with blessings from “above”.
5. SUMMARY, CONCLUSIONS AND RECOMMENDATIONS
5.1.0 Summary of Findings
The study aimed at examining the various dimensions of service quality on internal customer satisfaction, establishing the
level of internal customer satisfaction and establishing ideas/views and expectations of internal customers and areas for
improvement.
5.2.1. Dimensions of Service Quality
Based on the SERVQUAL model, the highest is response that explains 83% of service satisfaction level; tangibility
explains 8%, reliability 2%. Assurance is retrogressive at -37% meaning other departments cannot count on pool transport
section for provision of prompt, timely, reliable information or service at all. Empathy is the lowest at -48% meaning pool
transport section doesn‟t gives personal attention nor understands the needs of its internal customers.
5.2.2. Internal Customer Satisfaction Level
Results indicate that 48% of respondents have high satisfaction, while 40% indicated moderate satisfaction and 12%
indicated low satisfaction. This is not a good level for performance of an organization.
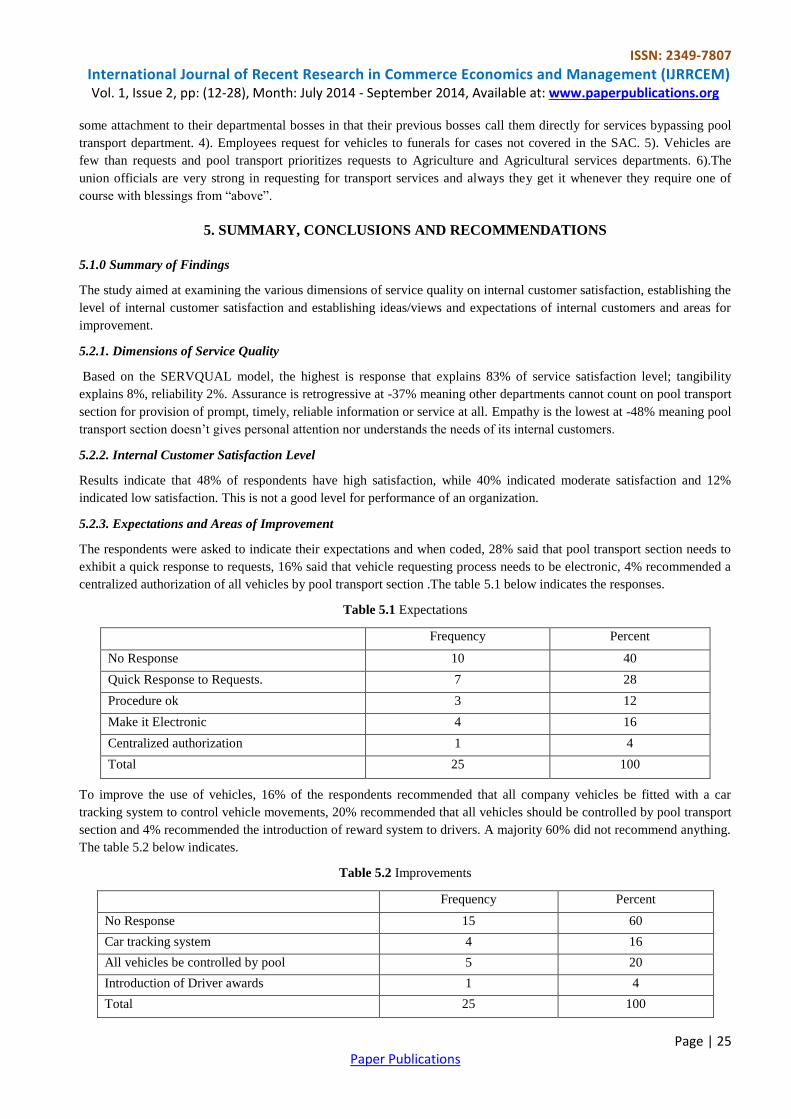
5.2.3. Expectations and Areas of Improvement
The respondents were asked to indicate their expectations and when coded, 28% said that pool transport section needs to
exhibit a quick response to requests, 16% said that vehicle requesting process needs to be electronic, 4% recommended a
centralized authorization of all vehicles by pool transport section .The table 5.1 below indicates the responses.
Table 5.1 Expectations
Frequency Percent
No Response 10 40
Quick Response to Requests. 7 28
Procedure ok 3 12
Make it Electronic 4 16
Centralized authorization 1 4
Total 25 100
To improve the use of vehicles, 16% of the respondents recommended that all company vehicles be fitted with a car
tracking system to control vehicle movements, 20% recommended that all vehicles should be controlled by pool transport
section and 4% recommended the introduction of reward system to drivers. A majority 60% did not recommend anything.
The table 5.2 below indicates.
Table 5.2 Improvements
Frequency Percent
No Response 15 60
Car tracking system 4 16
All vehicles be controlled by pool 5 20
Introduction of Driver awards 1 4
Total 25 100
ISSN: 2349-7807
International Journal of Recent Research in Commerce Economics and Management (IJRRCEM) Vol. 1, Issue 2, pp: (12-28), Month: July 2014 - September 2014, Available at: www.paperpublications.org
Page | 26 Paper Publications
5.3. Conclusion
This service department should always try to enhance client satisfaction via presenting high quality services, as a key
element, in order to, first, not weaken those dimensions which internal customers are satisfied with and second, improve
those that aren‟t desirable from internal customers perspective. In order to increase empathy, this organization should
improve this dimension through emphasizing clients and their requirements, training employees correctly to improve
interaction with customers, respect and behavior friendly with them and also this organization should enhance assurance
dimension via increasing employee knowledge in responding to clients and their complaints resolution; and to establish
trusty space, should increase employees‟ expertise and train them in different areas such as client problems resolution,
services provision in promised time and accuracy and rapidity increase in doing works. From the findings, the level of
internal customer satisfaction is low at 48%, while the SERVQUAL model, response is the highest at 83% of service
satisfaction level; tangibility second at 8%, reliability third at 2%. Assurance is retrogressive at -37% meaning other
departments cannot count on pool transport section for provision of prompt, timely, reliable information or service at all.
Empathy is the lowest at -48% meaning pool transport section doesn‟t gives personal attention nor understands the needs
of its internal customers. To improve the rating before the next assessment, pool transport should implement the
suggestions given by the other departments. The rating must have been low because of the departments‟ resentment to
pooling of vehicles may be as a result of poor sensitization before pooling. As it is now, other departments are not
cooperating in following rules of requesting for vehicle and it is not that they are not aware as 92% had indicated they are
aware of procedures, but might that they have not accepted fully the pooling. This is an example of Collective action
challenges, which result in groups failing to act in their collective self interest, even where individual members stand to
benefit if the group achieves its objectives. This is particularly relevant for the effective delivery of public services, which
often requires contributions from multiple actors, including frontline providers, service users, local and central
government authorities, non-state actors and others.
5.4 Recommendations
General suggestions for improving internal customer satisfaction to be followed by the organization to be really successful
in exploiting the fullest potential of their employees are as follows:
Top management should address forms of policy incoherence, through initiatives that better define mandates horizontally
and vertically for service delivery and clarify respective roles and responsibilities. This may also involve strategies to
support greater individual leadership, building capacity and capability to drive delivery over time, including through
tailored external support. This can be achieved by enforcing the signed service level agreements between service
providers and service users that is not in existence as of current.
Culture change should be enhanced so that employees change from previous practices of misusing company resources on
non official activities. This will reduce demand on transport services that waste and only concentrate on productive
ventures only and discourage seeing things from department point of view and not from organization‟s point of view.
Service providing department needs to be trained on customer service skills to enable them handle their customers (fellow
workers) with respect and to know that the services offered to fellow employees impacts on the services offered to
external customers of the company. Training should also seek to improve communication between departments by use of
internet services instead of memos. Requisition system should be automated to reduce time wastage and records
misplacing. Electronic survey can be used to capture data for future surveys; Human Resource department will play a big
role in this.
The same survey should be repeated annually so that the department knows their standing and thus initiate strategies for
improvement. The same set of questionnaire should be used for better assessment. In fact, literature suggests that
customer satisfaction research should be standard practice for all organizations that provide goods or services.
5.5 Areas for Further Research
The survey applied SERVQUAL five factors that affect quality service delivery thus excluding other factors such as
environmental factors, company culture, and level of training of service providers, availability and state of vehicles that
also needs to be surveyed. A study of other similar factories can be done to allow for comparison and benchmarking.

ISSN: 2349-7807
International Journal of Recent Research in Commerce Economics and Management (IJRRCEM) Vol. 1, Issue 2, pp: (12-28), Month: July 2014 - September 2014, Available at: www.paperpublications.org
Page | 27 Paper Publications
REFERENCES
[1]. A., Zeithaml, V.A. and Berry, L.L. (1988). SERVQUAL: A Multiple-Item Scale For Measuring Consumer
Perceptions Of Service Quality, Journal Of Retailing, Spring, Volume 64, Number 1, pp. 1240.
[2]. Abdullah, M., Husain, N.and El-Nassin, A. (2001), “Theory, Development of National Customer Satisfaction
Index: The Malaysian Index of Customer Satisfaction”, The 6 th World Congress for Total Quality Management.
[3]. Anderson E.W and Sullivan mw (1993) ―The Antecedents and Consequences of Customer satisfaction for firm‖
Marketing Science, Vol 12 no 2 pp 125-43.
[4]. Anderson, E.W., Fornell, C. (2000), “Foundation of the American Customer Satisfaction Index”, Total Quality
Management, Vol.11, No.7, pp. 869-882.
[5]. Atkins mark (2000) Data quality has a significant effect on retaining customer loyalty, retrieved from
http/www2.c10.com/ask/expert.
[6]. Aydin, S. and Ozer, G. (2005), “National customer satisfaction indices: An implementation in the Turkish mobile
telephone market”, Marketing Intelligence & Planning, Vol.23, No.5, pp. 486-504.
[7]. Badri, M.A. , Abdulla, M. and Al-Madani, A. (2005), "Information technology center service quality: Assessment
and application of SERVQUAL", The International Journal of Quality & Reliability Management Vol 22 No 8/9;
banking market”, European Journal of Marketing, Vol. 38, No. 1/2, pp. 253-275;
[8]. Brady M.K and Robertson C.J (2001) ―searching for a consensus on the antecedent role of service quality and
satisfaction; an exploratory cross –national study‖ journal of business
[9]. Brown SW and Swartz TA (1989) ―A gap analysis of professional service quality‖ journal of marketing Vol, 53
April pp 92-98.
[10]. Bruhn, M., Grund, M.A. (2000), “Theory, Development and Implementation of National Customer Satisfaction
Indices; The Swiss Index of Customer Satisfaction (SWICS)”, Total Quality Management , Vol.11, No.7, pp. 869-
882.
[11]. Cosby L, Evans, K and cowls D (1990) ―Relationship quality in services selling. An interpersonal influence
perspective‖ journal in marketing.vol 54 July pp 68-81.
[12]. Cronin and Taylor S.A (1992) ―Measuring service quality: a re-examination and extension Journal of marketing
vol. 56 Journal pp 55-68.
[13]. Cronin J Brady M.K and Huh, GTM (2000) ―Assessing the effects of quality, value and customer satisfaction on
consumer behavioral intentions in service environments‖ journal of retailing vol. 76.2, pp 193-218.
[14]. Donnelly, M. , Kerr, N.J. , Rimmer, R. and Shiu, E.M. (2006),” Assessing the quality of police services using
SERVQUAL”, policing; An International Journal of Police Strategies & Management, Vol 29 No 1,pp92-105;
[15]. Dotchin J.A and Oakland ―total quality management in services: Service quality‖ International journal of quality
and reliability management‖, vol 1 No3 1994 pp. 27 -24.
[16]. Dwayne, B., Pedro, S.C. and Alexandra, M. (2004), “The role of communication and trust in explaining customer
loyalty”, European Journal of Marketing, Vol.38, No.9/10, pp1272-1293.
[17]. Hallowell, R. (1996), ”The relationship of customer satisfaction, customer loyalty and profitability: an empirical
study”, International Journal of Service Industry Management, Vol. 7, No. 4, pp. 27-42;
[18]. Kim, Y. K., Lee, H. R. (2011), " Customer satisfaction using low cost carriers", Tourism Management 32 235–243;
Anderson, E, W Fornell, C and Lehman, DR (1994) ―Customer Satisfaction Market Share and Profitability:
Finding for Sweden‖ Journal of marketing vol. 58 July PP 53-66.
[19]. Kristensen, K., Juhl, H.J. and Stergaard, P. (2001), “Customer Satisfaction and Customer Loyalty in European
Retailing”, The6th World Congress for Total Quality Management
[20]. Lam Simon, S.K. (1997), "SERVQUAL: A tool for measuring patients' opinions of Hospital servicee quality in
Hong Kong", Total Quality Management; Vol 8 No 4, pp 145-152
[21]. Lommeruda, K. E. and Sørgard, L. (2003),Information Economics and Policy, Volume. 15 “Entry in
telecommunication: Customer Loyalty, Price Sensitivity and Access Prices”, pages 5-7.
ISSN: 2349-7807
International Journal of Recent Research in Commerce Economics and Management (IJRRCEM) Vol. 1, Issue 2, pp: (12-28), Month: July 2014 - September 2014, Available at: www.paperpublications.org
Page | 28 Paper Publications
[22]. Manuel, J.V. and Pedro,S.C. (2003), “The employee-Customer satisfaction Chain in the ECSI model”, European
Journal of Marketing, Vol.37,No.11/12, pp.1703-1722.
[23]. Nzoia Sugar Company Ltd, General Administration department, pool transport section procedures & work
instruction manual; Doc. No. NSC/GA/TR/OPWIM-5, 2011.
[24]. Office of the Comptroller General Evalution &Branch ),2002( Draft Measuting Clinet Satisfaction, Canada. [ on
line], 6 Jan 2004; research vol. 51 no 1 pp 53-60
[26]. Parasuraman, A., Zeithaml, V. and Berry, L. (1988.), “SEVQUAL: a multiple-item scale for measuring consumer
perceptions of service quality” Journal of Retailing 64 (1)
[27]. Ronald, G. (2000), “Measuring internal customer satisfaction”, Managing Service Quality, Vol.10, No.3. Pp.178-
186. satisfaction and service quality‖ in Kardes, F and Sujan, M (Eds), advances in consumer research, vol. 22
Association for consumer research, Proro, UT pp, 101 -108. 43. Satisfaction Exit Interviews, International Family
Planning Perspectiver ,Volum 26, Number 2.[on line], 15 july 2004;
[28]. Seth , N., Deshmukh, S.G. and Vrat, P. (2006),”A framework for measurement of quality of service in supply
chains”, Supply Chain Management Vol 11 No 1, pp82-90
[29]. Todorov , Branimiy (1999), Building Customer Focus Organization (with Iso 9000:2000 Family), BTA, Inc;
[30]. Turkyilmaz, A. and Ozkan, C. (2007), “Development of a customer satisfaction index model: An application to the
Turkish mobile phone Sector”, Industrial Management & Data Systems, Vol.107, No.5, pp.672-687. comparison
standard in measuring service quality: Implications for further research”; Journal of Marketing 58 (1);