Intermodal Industry Overview - TRAC Intermodal - Chassis Leasing
Intermodal Freight Connectors: Pavement Condition Overview as of 2006
November 2009 CMAP Congestion Management Process Author: Dan Rice
TABLE OF CONTENTS
1 Executive Summary .................................................................................................... 1
2 Introduction ................................................................................................................. 1
3 Background on the NHS and Intermodal Freight Connectors .................................... 2
4 Intermodal Connectors Roadway Characteristics ....................................................... 3
4.1 Jurisdiction Trends .............................................................................................. 4
4.2 Functional Classification Trends ........................................................................ 5
5 Overview of Conditions as of 2006 .......................................................................... 6
5.1 Regional Conditions ........................................................................................... 6
5.2 Facility Level Overview ................................................................................... 10
Appendix A: Intermodal Freight Facility Pavement Condition Tables
Appendix B: Intermodal Connector Review Map Series
CRS Ratings from IRIS 2006
Appendix C: Intermodal Connector Review Map Series
IRIS 2006 IRI & CRS Rating Comparison
LIST OF EXHIBITS
Exhibit 1: Connector Status in the Chicago Region .................................................................. 3
Exhibit 2: Jurisdiction Responsibility of Connectors in the Chicago Region ........................... 4
Exhibit 3: Maintenance Responsibility of Connectors in the Chicago Region ......................... 4
Exhibit 4: Functional Classification Codes for HPMS and IRIS .............................................. 5
Exhibit 5: Functional Classifications for Connectors in the Chicago Region .......................... 5
Exhibit 6: CRS Condition Ratings and IRI Criteria for Acceptable Ride Quality .................... 6
Exhibit 7: Intermodal Freight Connectors - Regional CRS Conditions .................................... 7
Exhibit 8: Intermodal Freight Connectors - Regional IRI Ride Quality ................................... 8
Exhibit 9: Regional Connectors CRS Condition by Status ...................................................... 9
Exhibit 10: Regional Connectors CRS Condition by Jurisdiction .............................................. 9
Exhibit 11: Regional Connectors CRS Condition by Functional Class ................................... 10
Exhibit 12: Facility Connector Conditions by % Route-miles CRS Rating Good + ................ 10
Exhibit 13: Facility Connector Conditions by % Route-miles IRI Acceptable Ride Quality .. 11

Intermodal Freight Connectors: Pavement Condition Overview as of 2006 Page 1
Intermodal Connectors Pavement Condition Overview
1 Executive Summary
CMAP has compiled an overview of pavement conditions for intermodal freight
connectors in the Chicago region, using Condition Rating Survey (CRS) data from the
year 2006. The freight connectors were added to the National Highway System (NHS)
between 1996 and 1999, based on FHWA guidelines to identify roadways that provide
access between major intermodal freight facilities, and the principal arterials and
expressways of the NHS. The importance of the freight connectors from the perspective
of the FHWA has been summarized on the Office of Operations - Freight Management
and Operations webpage as follows: Intermodal connectors are short but important highways that connect America’s most important
seaports, airports, rail yards, and pipeline facilities to the NHS, a 161,000-mile network that includes
the interstate system and other key roads. … Although they account for less than 1 percent of NHS
mileage, NHS Connectors are key conduits for the timely and reliable delivery of goods. Hence it is
important to evaluate the condition and performance of connectors and related investment needs. CMAP staff conducted a review of Condition Rating Survey (CRS) data contained within
IDOT’s Illinois Roadway Information System (IRIS) 2006 end of year GIS database for
all roadways identified as intermodal freight connectors in the Chicago region. This data
will support CMAP’s congestion management process performance measurement system.
Initially this paper intended to focus on IRI ride quality data, since that measure is used
by FHWA to describe ride quality/pavement conditions on a national level. However,
based on the limited data availability of IRI data for roadways at these lower functional
classes, this review relied on the more current and more complete CRS data. Since there
is no available comparison data for freight connector pavement condition on the national
level, observations from this analysis can only serve as benchmarks for future review.
As of 1999, there were 26 major intermodal freight facilities in the Chicago region, with
one additional proposed major intermodal facility that opened in 2002. From a regional
perspective, as of 2006, approximately 47% of intermodal freight connectors route-miles
in the Chicago region showed CRS values greater than or equal to 7.0, which translates to
Good or better (Good +) pavement conditions. At the facility level, eight (8) facilities
showed less than 30% of connector route-mile pavement conditions of Good +; eleven
(11) facilities showed between 30% and 70% of Good + route-miles; and eight (8)
facilities showed more than 70% of route-miles in Good + condition. A review of 2008 data is currently underway, but is not yet complete. Preliminary
analyses indicate similar to slightly deteriorating conditions; however, additional site
specific review of eligible facilities and associated connectors will be needed.
2 Introduction
The purpose of this report is to describe overall roadway system characteristics, and to
provide an overview of pavement conditions for intermodal freight connectors
(connectors) to the National Highway System (NHS) in the Chicago region. In order to
Intermodal Freight Connectors: Pavement Condition Overview as of 2006 Page 2
compile this overview, CMAP staff conducted a review of Condition Rating Survey
(CRS) data contained within IDOT’s Illinois Roadway Information System (IRIS) 2006
end of year GIS database. Staff extracted data for the Chicago region in order to develop
a Microsoft Access database for analysis purposes, and to generate preliminary GIS
applications. In CMAP’s Highway Ride Quality in the Chicago Region report, November
2009, analysis focused on International Roughness Index (IRI) data from IRIS 2006 and
Highway Performance Monitoring System (HPMS) 2003. Due to the limited data
availability of IRI data for roadways at the lower functional classes, this report only
focused on CRS data, with brief references to IRI data.
This report is intended to provide a preliminary snapshot of pavement conditions as of
2006, and to offer background for the development of performance measures related to
pavement conditions for the intermodal freight connectors to the NHS in the Chicago
region. Please note that analysis in this report relied on data quality in the IRIS 2006 end
of year GIS database, and did not involve field observation.
3 Background on NHS and Intermodal Freight Connectors
The Intermodal Surface Transportation Efficiency Act of 1991 (ISTEA) established the
National Highway System (NHS) to be the focus for federal aid highway programs into
the 21st century. The issue of providing effective access to major intermodal facilities
from the NHS was recognized by the Federal Highway Administration (FHWA),
specifically because it opened additional options for identifying and funding roadway
improvements which would enhance access to these facilities. In the case of freight, this
meant providing for improved roadway access to major intermodal freight facilities for
trucking operations. The NHS was initially defined as a national network of 155,000 miles consisting of
principal urban and rural arterials, the Strategic Highway network, and the 44,000 miles
from the former Interstate System. In December 1993, CATS submitted Proposed NHS
for Northeastern Illinois, to the Illinois Department of Transportation (IDOT) with the
recommendation that the 1,300 mile Strategic Regional Arterials (SRA) system serve as
the arterial component of the NHS in northeastern Illinois. Ultimately, most but not all of
the SRA system was selected for the NHS. By 1994, the NHS mileage allocation was
expanded to 159,000 miles nationally, with 3.5% or 5,553 miles within the state of
Illinois, and 1,700 miles in N.E. Illinois. By 1996, more than 1,000 miles of intermodal
freight connectors were added to the NHS nationally, including 60 miles in the state of
Illinois, with almost 50 of those connector miles in the Chicago region. For a complete
listing of intermodal connectors in Illinois refer to the FHWA web page listing at
http://www.fhwa.dot.gov/planning/nhs/intermodalconnectors/illinois.html .
FHWA Memorandum Guidelines for Identifying NHS Connections to Major Intermodal
Terminals (April 14, 1995) established the criteria and guidelines that were used by state
DOTs, in cooperation with MPOs, to identify intermodal connectors. These FHWA
guidelines were utilized by the Chicago Area Transportation Study’s (CATS) Intermodal
Advisory Task Force (IATF) to develop a regional review process to identify eligible
major intermodal freight facilities, and the roadway links which provide primary
connection to the NHS.
Intermodal Freight Connectors: Pavement Condition Overview as of 2006 Page 3
The goal for establishing intermodal connectors was to facilitate improved access
between major intermodal facilities and the principal arterials of the NHS. The physical
characteristics of the roadway design and its operational features are especially important
in terms of maintaining and enhancing current levels of intermodal service, as well as
improving the environment for more efficient intermodal transfer in the future. Roadway
design can have a significant impact on vehicular access to intermodal facilities, and on
roadway congestion in general. Once a roadway link was approved as a connector, then
related improvement projects would become eligible to compete for NHS funding. It
should be noted that the potential for NHS funding applies only to public roadways, and
does not apply to the associated private freight facility.
The FHWA Office of Operations - Freight Management and Operations described the
importance of the intermodal freight connectors as follows:
Intermodal connectors are short but important highways that connect Americas most important
seaports, airports, rail yards, and pipeline facilities to the NHS, a 161,000-mile network that includes
the interstate system and other key roads. Congress designated the NHS network in the National
Highway System Designation Act of 1995, which President Clinton signed into law on Nov. 28, 1995. Although they account for less than 1 percent of NHS mileage, NHS Connectors are key conduits for
the timely and reliable delivery of goods. Hence it is important to evaluate the condition and
performance of connectors and related investment needs. For more information or links from the Freight Management and Operations website please refer to
http://ops.fhwa.dot.gov/freight/infrastructure/nhs_connect/index.htm
According to the FY2006 C&P Report, while the NHS makes up only 4% of total U.S.
mileage, the NHS carried more than 44% of total U.S. travel in 2004. As a result, FHWA
has emphasized NHS roadways with regards to national performance measures. As part
of the NHS, and as vital links in the freight network, pavement condition of the
intermodal freight connectors is an important consideration in the region.
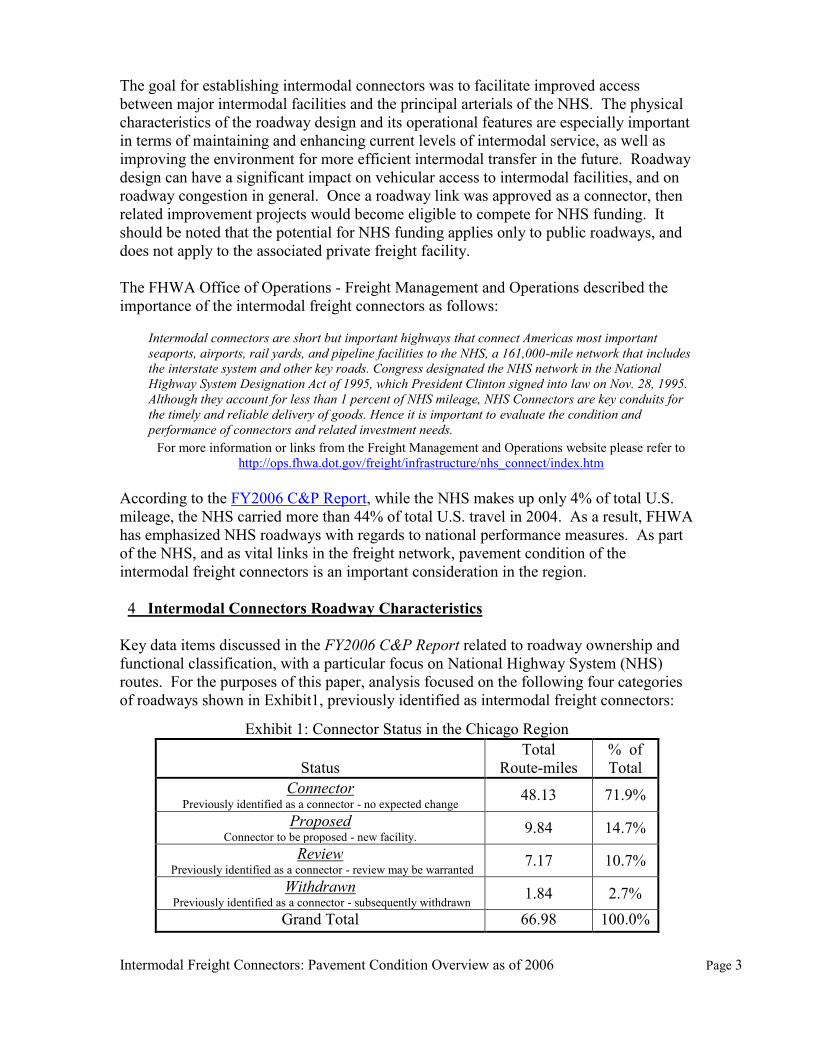
4 Intermodal Connectors Roadway Characteristics
Key data items discussed in the FY2006 C&P Report related to roadway ownership and
functional classification, with a particular focus on National Highway System (NHS)
routes. For the purposes of this paper, analysis focused on the following four categories
of roadways shown in Exhibit1, previously identified as intermodal freight connectors:
Exhibit 1: Connector Status in the Chicago Region
Status
Total
Route-miles
% of
Total
Connector Previously identified as a connector - no expected change
48.13 71.9%
Proposed Connector to be proposed - new facility.
9.84 14.7%
Review Previously identified as a connector - review may be warranted
7.17 10.7%
Withdrawn Previously identified as a connector - subsequently withdrawn
1.84 2.7%
Grand Total 66.98 100.0%
Intermodal Freight Connectors: Pavement Condition Overview as of 2006 Page 4
Currently, the official FHWA inventory of Intermodal Freight Connectors for the
Chicago region essentially includes the connector and review categories. This represents
approximately 55 miles of previously identified connectors that serve rail/truck and port
facilities in the Chicago region. A preliminary CMAP review has indicated that
qualification reviews may be warranted for approximately 7 miles of the regional
connectors, while there is no expected change for the remaining 48 miles. Approximately
2 miles of withdrawn connectors, which were previously identified and subsequently
withdrawn, were included as another category since there may be a possibility for
reinstatement. Finally, there is a category for proposed connectors due to the on-going
work related to the formal proposal process for documenting connector roadways for the
BNSF rail/truck facility in Elwood, Illinois that opened for business in 2002. Although
approximately 15 miles have been proposed, only about 10 miles were included in the
IRIS database. Appendix A includes detailed breakdowns for individual facilities and
connector categories.
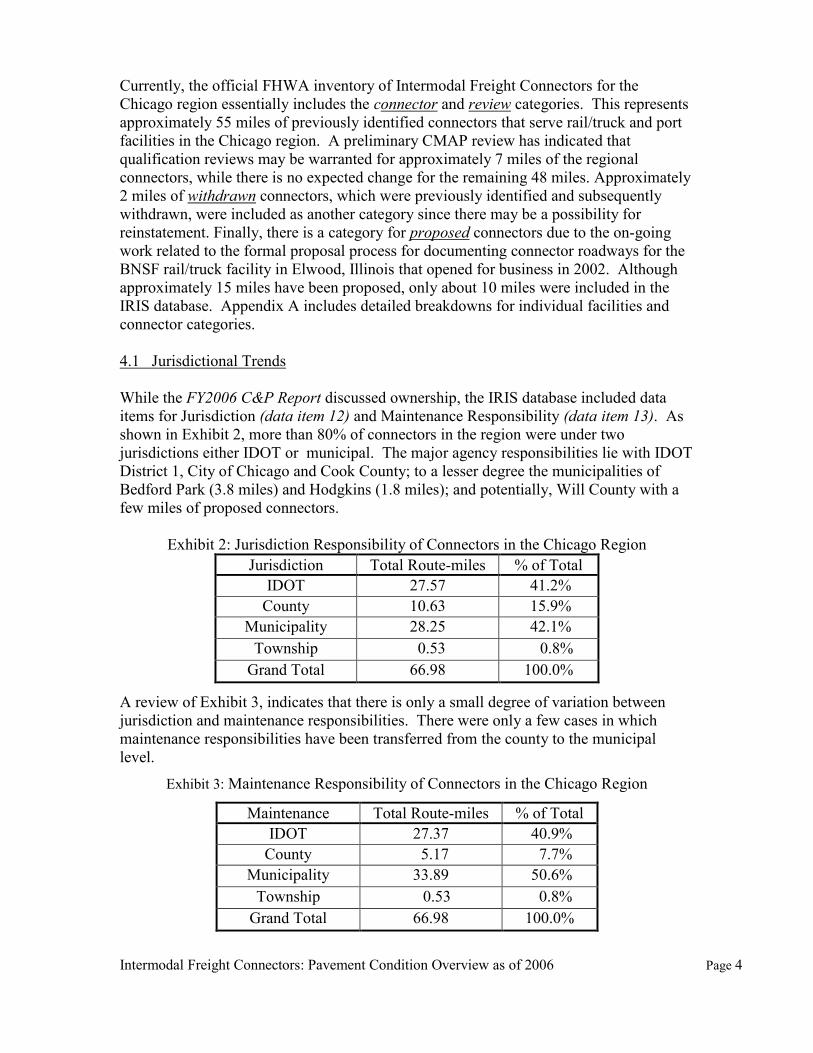
4.1 Jurisdictional Trends
While the FY2006 C&P Report discussed ownership, the IRIS database included data
items for Jurisdiction (data item 12) and Maintenance Responsibility (data item 13). As
shown in Exhibit 2, more than 80% of connectors in the region were under two
jurisdictions either IDOT or municipal. The major agency responsibilities lie with IDOT
District 1, City of Chicago and Cook County; to a lesser degree the municipalities of
Bedford Park (3.8 miles) and Hodgkins (1.8 miles); and potentially, Will County with a
few miles of proposed connectors.
Exhibit 2: Jurisdiction Responsibility of Connectors in the Chicago Region
Jurisdiction Total Route-miles % of Total
IDOT 27.57 41.2%
County 10.63 15.9%
Municipality 28.25 42.1%
Township 0.53 0.8%
Grand Total 66.98 100.0% A review of Exhibit 3, indicates that there is only a small degree of variation between
jurisdiction and maintenance responsibilities. There were only a few cases in which
maintenance responsibilities have been transferred from the county to the municipal
level.
Exhibit 3: Maintenance Responsibility of Connectors in the Chicago Region
Maintenance Total Route-miles % of Total
IDOT 27.37 40.9%
County 5.17 7.7%
Municipality 33.89 50.6%
Township 0.53 0.8%
Grand Total 66.98 100.0%
Intermodal Freight Connectors: Pavement Condition Overview as of 2006 Page 5
Even in cases where maintenance may have been contractually shifted to another agency,
primary responsibility remains with the jurisdictional agency.
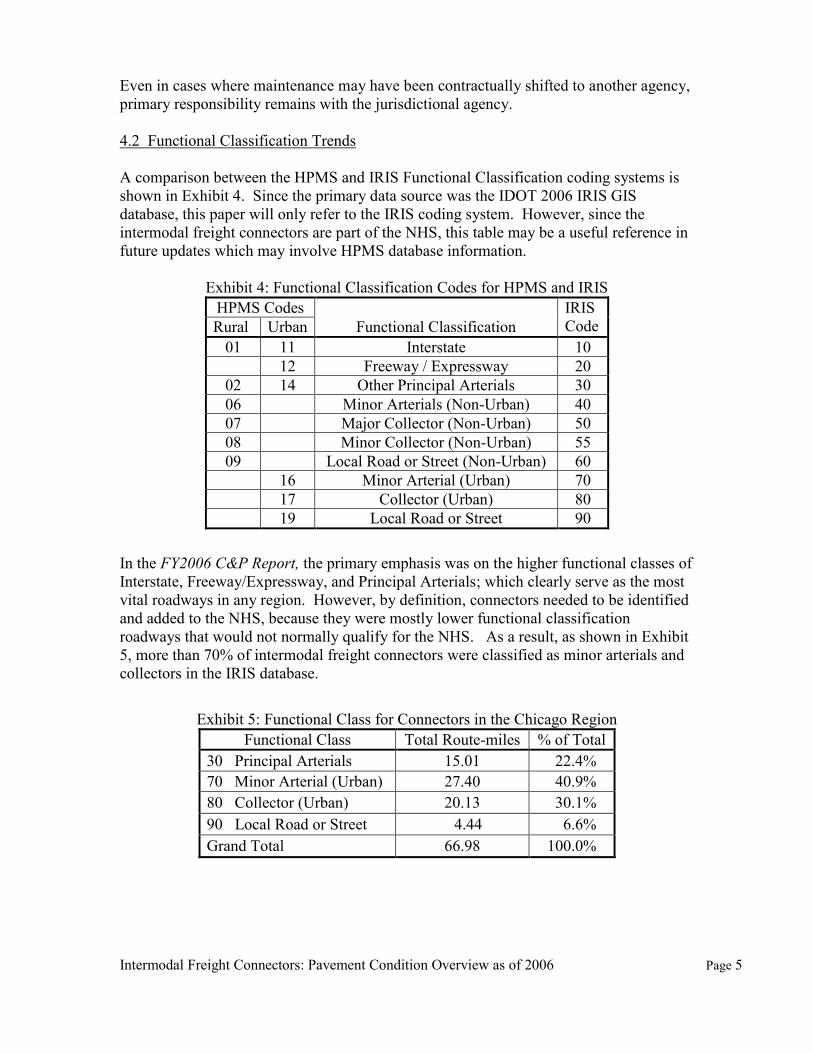
4.2 Functional Classification Trends
A comparison between the HPMS and IRIS Functional Classification coding systems is
shown in Exhibit 4. Since the primary data source was the IDOT 2006 IRIS GIS
database, this paper will only refer to the IRIS coding system. However, since the
intermodal freight connectors are part of the NHS, this table may be a useful reference in
future updates which may involve HPMS database information.
Exhibit 4: Functional Classification Codes for HPMS and IRIS
HPMS Codes
Functional Classification
IRIS
Code Rural Urban
01 11 Interstate 10
12 Freeway / Expressway 20
02 14 Other Principal Arterials 30
06
Minor Arterials (Non-Urban) 40
07
Major Collector (Non-Urban) 50
08
Minor Collector (Non-Urban) 55
09
Local Road or Street (Non-Urban) 60
16 Minor Arterial (Urban) 70
17 Collector (Urban) 80
19 Local Road or Street 90
In the FY2006 C&P Report, the primary emphasis was on the higher functional classes of
Interstate, Freeway/Expressway, and Principal Arterials; which clearly serve as the most
vital roadways in any region. However, by definition, connectors needed to be identified
and added to the NHS, because they were mostly lower functional classification
roadways that would not normally qualify for the NHS. As a result, as shown in Exhibit
5, more than 70% of intermodal freight connectors were classified as minor arterials and
collectors in the IRIS database.
Exhibit 5: Functional Class for Connectors in the Chicago Region
Functional Class Total Route-miles % of Total
30 Principal Arterials 15.01 22.4%
70 Minor Arterial (Urban) 27.40 40.9%
80 Collector (Urban) 20.13 30.1%
90 Local Road or Street 4.44 6.6%
Grand Total 66.98 100.0%
Intermodal Freight Connectors: Pavement Condition Overview as of 2006 Page 6
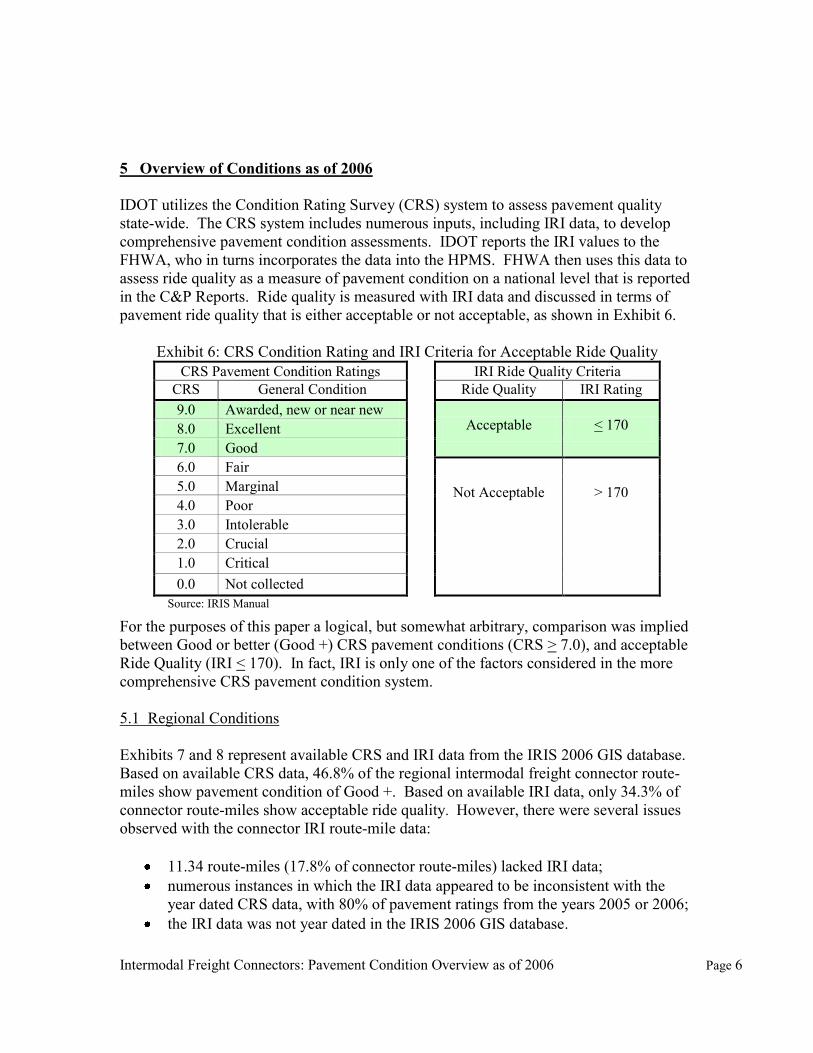
5 Overview of Conditions as of 2006
IDOT utilizes the Condition Rating Survey (CRS) system to assess pavement quality
state-wide. The CRS system includes numerous inputs, including IRI data, to develop
comprehensive pavement condition assessments. IDOT reports the IRI values to the
FHWA, who in turns incorporates the data into the HPMS. FHWA then uses this data to
assess ride quality as a measure of pavement condition on a national level that is reported
in the C&P Reports. Ride quality is measured with IRI data and discussed in terms of
pavement ride quality that is either acceptable or not acceptable, as shown in Exhibit 6.
Exhibit 6: CRS Condition Rating and IRI Criteria for Acceptable Ride Quality
CRS Pavement Condition Ratings IRI Ride Quality Criteria
CRS General Condition Ride Quality
Terms
IRI Rating
9.0 Awarded, new or near new Acceptable < 170 8.0 Excellent
7.0 Good
6.0 Fair
Not Acceptable
> 170 5.0 Marginal
4.0 Poor
3.0 Intolerable
2.0 Crucial
1.0 Critical
0.0 Not collected
Source: IRIS Manual
For the purposes of this paper a logical, but somewhat arbitrary, comparison was implied
between Good or better (Good +) CRS pavement conditions (CRS > 7.0), and acceptable
Ride Quality (IRI < 170). In fact, IRI is only one of the factors considered in the more
comprehensive CRS pavement condition system.
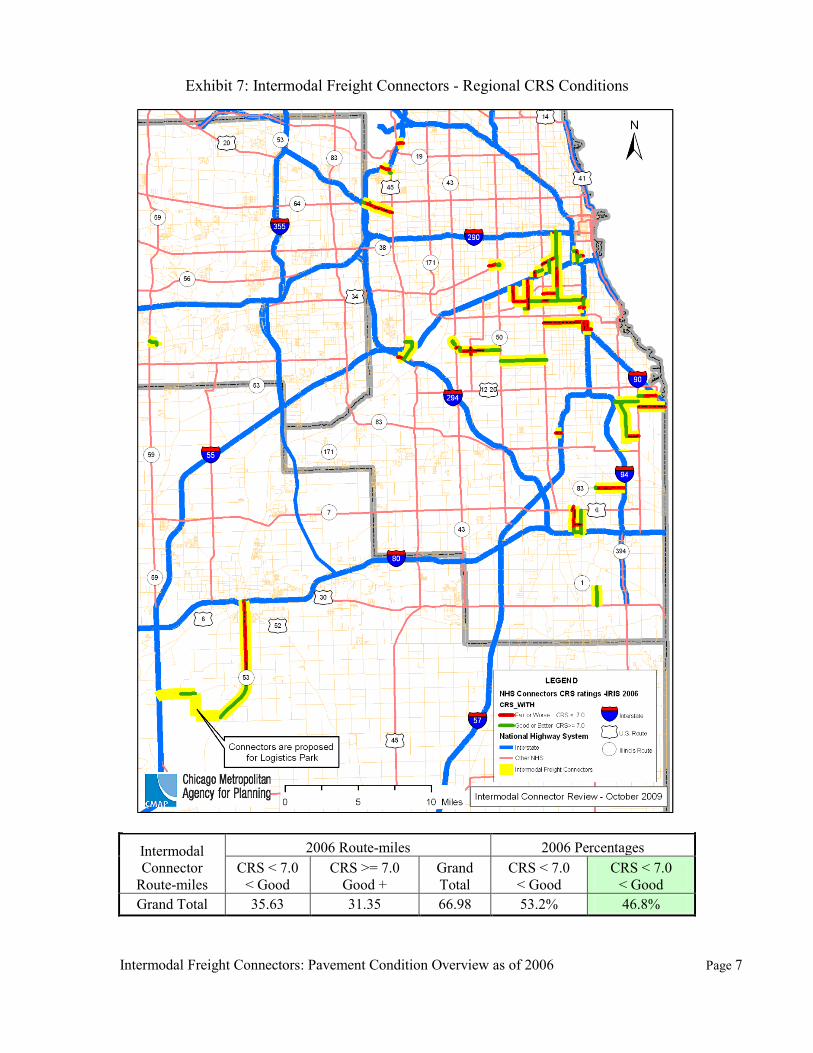
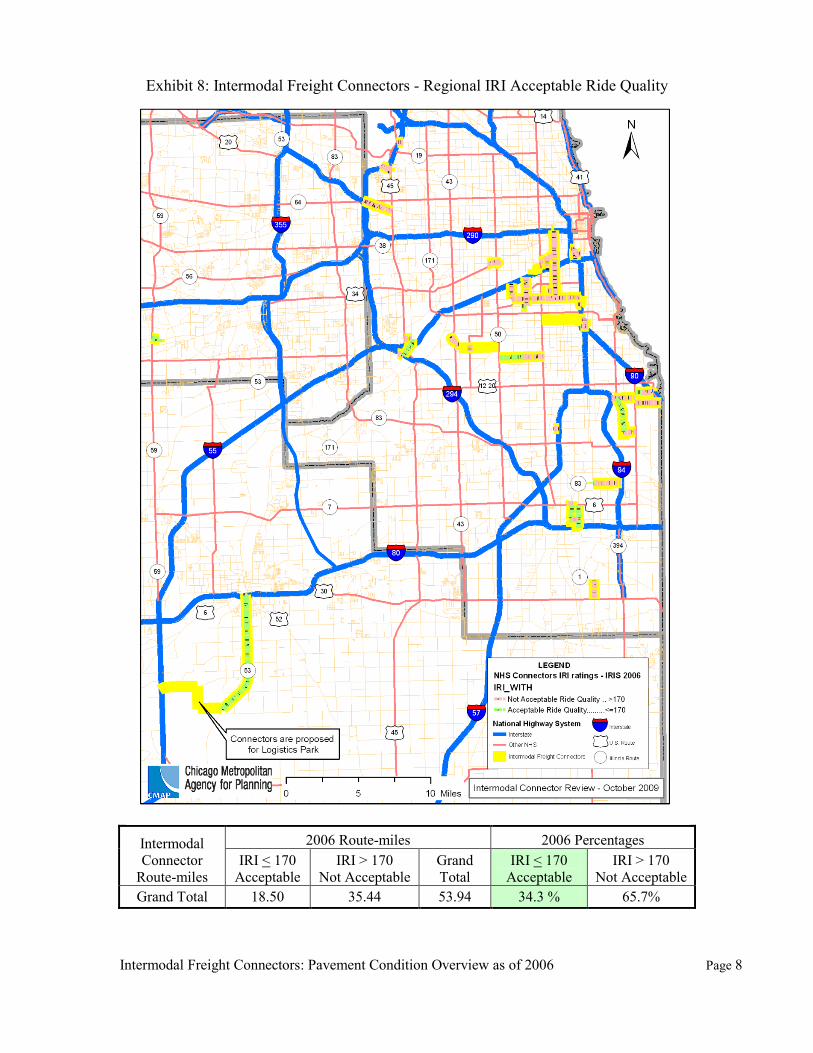
5.1 Regional Conditions
Exhibits 7 and 8 represent available CRS and IRI data from the IRIS 2006 GIS database.
Based on available CRS data, 46.8% of the regional intermodal freight connector route-
miles show pavement condition of Good +. Based on available IRI data, only 34.3% of
connector route-miles show acceptable ride quality. However, there were several issues
observed with the connector IRI route-mile data:
11.34 route-miles (17.8% of connector route-miles) lacked IRI data;
numerous instances in which the IRI data appeared to be inconsistent with the
year dated CRS data, with 80% of pavement ratings from the years 2005 or 2006;
the IRI data was not year dated in the IRIS 2006 GIS database.
Intermodal Freight Connectors: Pavement Condition Overview as of 2006 Page 7
Exhibit 7: Intermodal Freight Connectors - Regional CRS Conditions
Intermodal
Connector
Route-miles
2006 Route-miles 2006 Percentages
CRS < 7.0
< Good
CRS >= 7.0
Good +
Grand
Total
CRS < 7.0
< Good
CRS < 7.0
< Good
Grand Total 35.63 31.35 66.98 53.2% 46.8%
Intermodal Freight Connectors: Pavement Condition Overview as of 2006 Page 8
Exhibit 8: Intermodal Freight Connectors - Regional IRI Acceptable Ride Quality
Intermodal
Connector
Route-miles
2006 Route-miles 2006 Percentages
IRI < 170
Acceptable
IRI > 170
Not Acceptable
Grand
Total
IRI < 170
Acceptable
IRI > 170
Not Acceptable
Grand Total 18.50 35.44 53.94 34.3 % 65.7%
Intermodal Freight Connectors: Pavement Condition Overview as of 2006 Page 9
Initially this paper was intended to focus on IRI ride quality data, since that measure is
used by FHWA to describe pavement conditions on a national level. However, based on
these issues, the focus of this paper shifted to rely on the more current and more complete
CRS data. Since there is no available comparison data for CRS pavement condition
ratings on the national level, observations from this analysis can only serve as
benchmarks for future regional reviews. Appendix C includes a map series with facility
level maps to compare both IRI and CRS data.
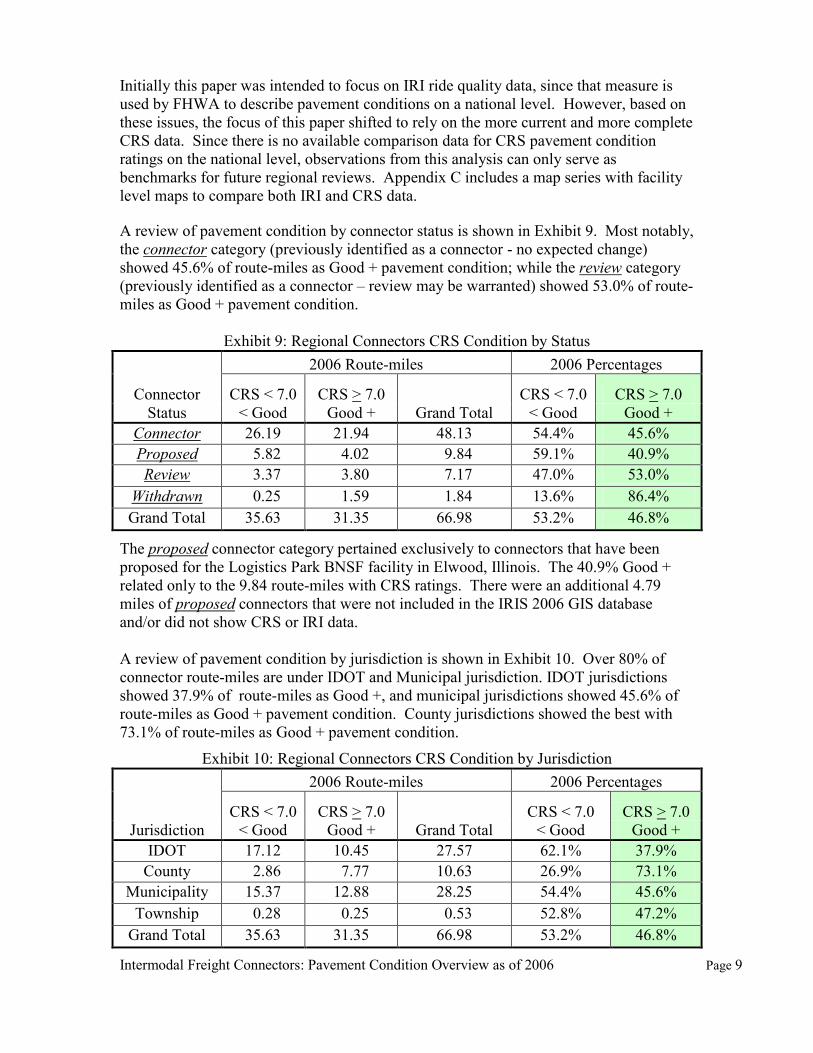
A review of pavement condition by connector status is shown in Exhibit 9. Most notably,
the connector category (previously identified as a connector - no expected change)
showed 45.6% of route-miles as Good + pavement condition; while the review category
(previously identified as a connector – review may be warranted) showed 53.0% of route-
miles as Good + pavement condition.
Exhibit 9: Regional Connectors CRS Condition by Status
2006 Route-miles 2006 Percentages
Connector CRS < 7.0 CRS > 7.0
CRS < 7.0 CRS > 7.0
Status < Good Good + Grand Total < Good Good +
Connector 26.19 21.94 48.13 54.4% 45.6%
Proposed 5.82 4.02 9.84 59.1% 40.9%
Review 3.37 3.80 7.17 47.0% 53.0%
Withdrawn 0.25 1.59 1.84 13.6% 86.4%
Grand Total 35.63 31.35 66.98 53.2% 46.8% The proposed connector category pertained exclusively to connectors that have been
proposed for the Logistics Park BNSF facility in Elwood, Illinois. The 40.9% Good +
related only to the 9.84 route-miles with CRS ratings. There were an additional 4.79
miles of proposed connectors that were not included in the IRIS 2006 GIS database
and/or did not show CRS or IRI data.
A review of pavement condition by jurisdiction is shown in Exhibit 10. Over 80% of
connector route-miles are under IDOT and Municipal jurisdiction. IDOT jurisdictions
showed 37.9% of route-miles as Good +, and municipal jurisdictions showed 45.6% of
route-miles as Good + pavement condition. County jurisdictions showed the best with
73.1% of route-miles as Good + pavement condition.
Exhibit 10: Regional Connectors CRS Condition by Jurisdiction
2006 Route-miles 2006 Percentages
CRS < 7.0 CRS > 7.0
CRS < 7.0 CRS > 7.0
Jurisdiction < Good Good + Grand Total < Good Good +
IDOT 17.12 10.45 27.57 62.1% 37.9%
County 2.86 7.77 10.63 26.9% 73.1%
Municipality 15.37 12.88 28.25 54.4% 45.6%
Township 0.28 0.25 0.53 52.8% 47.2%
Grand Total 35.63 31.35 66.98 53.2% 46.8%
Intermodal Freight Connectors: Pavement Condition Overview as of 2006 Page 10
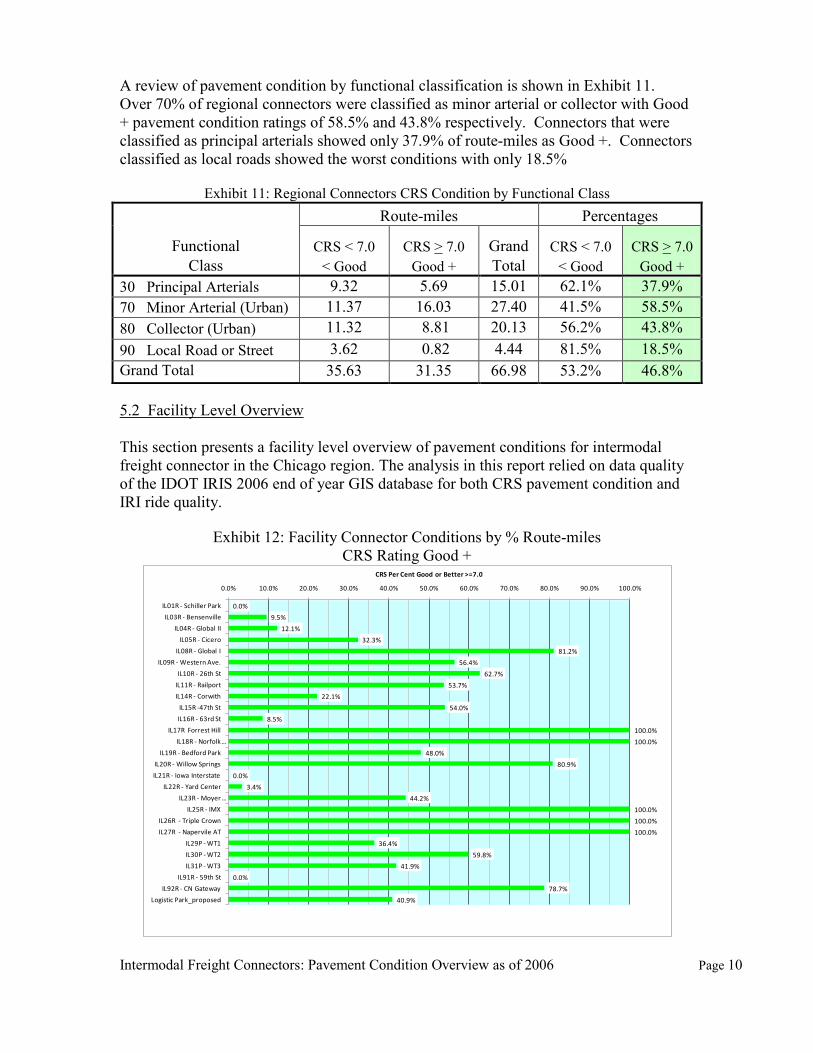
A review of pavement condition by functional classification is shown in Exhibit 11.
Over 70% of regional connectors were classified as minor arterial or collector with Good
+ pavement condition ratings of 58.5% and 43.8% respectively. Connectors that were
classified as principal arterials showed only 37.9% of route-miles as Good +. Connectors
classified as local roads showed the worst conditions with only 18.5%
Exhibit 11: Regional Connectors CRS Condition by Functional Class
Route-miles Percentages
Functional CRS < 7.0 CRS > 7.0 Grand CRS < 7.0 CRS > 7.0
Class < Good Good + Total < Good Good +
30 Principal Arterials 9.32 5.69 15.01 62.1% 37.9%
70 Minor Arterial (Urban) 11.37 16.03 27.40 41.5% 58.5%
80 Collector (Urban) 11.32 8.81 20.13 56.2% 43.8%
90 Local Road or Street 3.62 0.82 4.44 81.5% 18.5%
Grand Total 35.63 31.35 66.98 53.2% 46.8%
5.2 Facility Level Overview
This section presents a facility level overview of pavement conditions for intermodal
freight connector in the Chicago region. The analysis in this report relied on data quality
of the IDOT IRIS 2006 end of year GIS database for both CRS pavement condition and
IRI ride quality.
Exhibit 12: Facility Connector Conditions by % Route-miles
CRS Rating Good +
0.0%
9.5%
12.1%
32.3%
81.2%
56.4%
62.7%
53.7%
22.1%
54.0%
8.5%
100.0%
100.0%
48.0%
80.9%
0.0%
3.4%
44.2%
100.0%
100.0%
100.0%
36.4%
59.8%
41.9%
0.0%
78.7%
40.9%
0.0% 10.0% 20.0% 30.0% 40.0% 50.0% 60.0% 70.0% 80.0% 90.0% 100.0%
IL01R - Schiller Park
IL03R - Bensenville
IL04R - Global II
IL05R - Cicero
IL08R - Global I
IL09R - Western Ave.
IL10R - 26th St
IL11R - Railport
IL14R - Corwith
IL15R -47th St
IL16R - 63rd St
IL17R Forrest Hill
IL18R - Norfolk …
IL19R - Bedford Park
IL20R - Willow Springs
IL21R - Iowa Interstate
IL22R - Yard Center
IL23R - Moyer …
IL25R - IMX
IL26R - Triple Crown
IL27R - Napervile AT
IL29P - WT1
IL30P - WT2
IL31P - WT3
IL91R - 59th St
IL92R - CN Gateway
Logistic Park_proposed
CRS Per Cent Good or Better >=7.0
Intermodal Freight Connectors: Pavement Condition Overview as of 2006 Page 11
Exhibit 12, shows all 27 qualified major intermodal freight facilities in the Chicago
region (including one currently proposed); and the % of route-miles rated as Good +
(CRS > 7.0) for all associated connectors. Three facilities (IL01R, IL21R and IL91R)
show 0.0% of Good + route-miles, and five (IL17R, IL18R, IL25R, IL26R,IL27R) in
which 100.0 % of connector route-miles were reported as Good + in the IRIS 2006 GIS
database. Of the 27 intermodal facilities shown on this exhibit, most are active
operational facilities, some warrant review (inactive/closed or may no longer qualify as
major intermodal facilities), and one facility is proposed. For additional detailed
information on the individual facilities and the formal FHWA process, please refer to
CATS report: Proposed Intermodal Connectors to the NHS for Northeastern Illinois,
Version 3, June 1999.
Appendix A includes detailed breakout tables for each intermodal freight facility and
each associated connector roadway based on CRS pavement condition ratings. Appendix
B consists of a map series showing all facilities with CRS pavement condition coded as
Good + (CRS>7.0) or Fair or Worse (CRS<7.0) for all connector status levels.
Appendix C consists of a map series for easy comparison of IRI and CRS data on a
facility by facility basis.
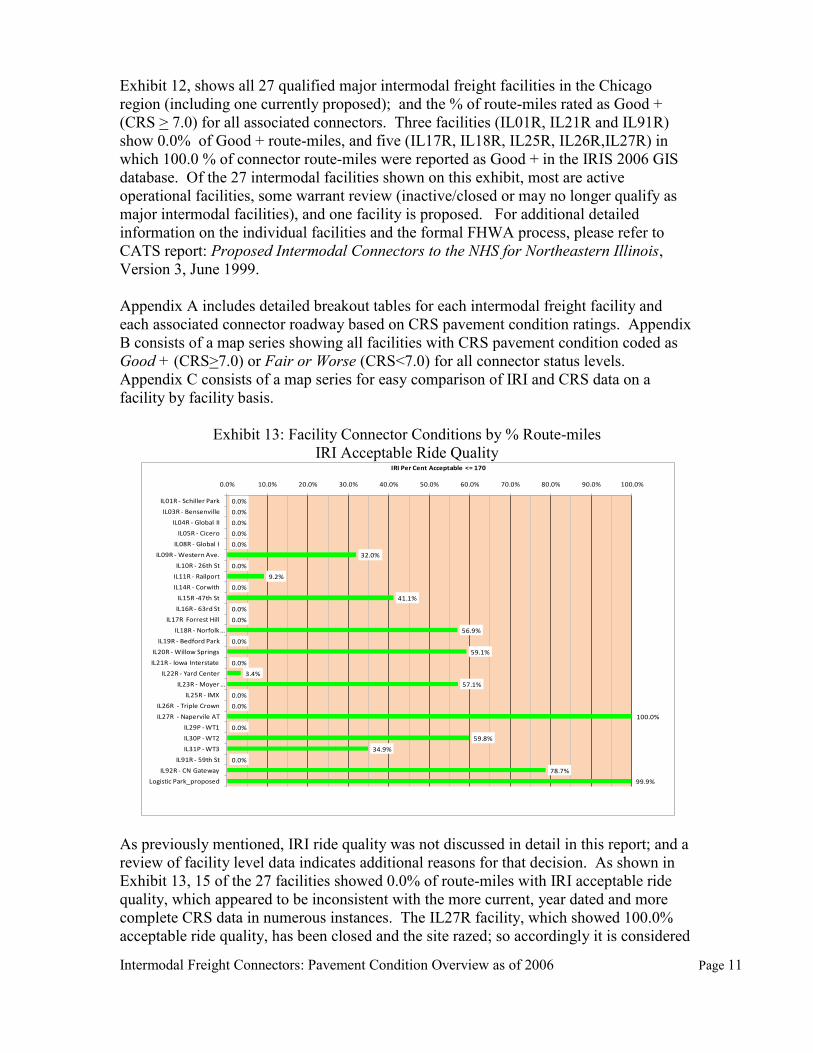
Exhibit 13: Facility Connector Conditions by % Route-miles
IRI Acceptable Ride Quality
As previously mentioned, IRI ride quality was not discussed in detail in this report; and a
review of facility level data indicates additional reasons for that decision. As shown in
Exhibit 13, 15 of the 27 facilities showed 0.0% of route-miles with IRI acceptable ride
quality, which appeared to be inconsistent with the more current, year dated and more
complete CRS data in numerous instances. The IL27R facility, which showed 100.0%
acceptable ride quality, has been closed and the site razed; so accordingly it is considered
0.0%
0.0%
0.0%
0.0%
0.0%
32.0%
0.0%
9.2%
0.0%
41.1%
0.0%
0.0%
56.9%
0.0%
59.1%
0.0%
3.4%
57.1%
0.0%
0.0%
100.0%
0.0%
59.8%
34.9%
0.0%
78.7%
99.9%
0.0% 10.0% 20.0% 30.0% 40.0% 50.0% 60.0% 70.0% 80.0% 90.0% 100.0%
IL01R - Schiller Park
IL03R - Bensenville
IL04R - Global II
IL05R - Cicero
IL08R - Global I
IL09R - Western Ave.
IL10R - 26th St
IL11R - Railport
IL14R - Corwith
IL15R -47th St
IL16R - 63rd St
IL17R Forrest Hill
IL18R - Norfolk …
IL19R - Bedford Park
IL20R - Willow Springs
IL21R - Iowa Interstate
IL22R - Yard Center
IL23R - Moyer …
IL25R - IMX
IL26R - Triple Crown
IL27R - Napervile AT
IL29P - WT1
IL30P - WT2
IL31P - WT3
IL91R - 59th St
IL92R - CN Gateway
Logistic Park_proposed
IRI Per Cent Acceptable <= 170

Intermodal Freight Connectors: Pavement Condition Overview as of 2006 Page 12
in the review status category. The 99.9% of acceptable ride quality route-miles for the
Logistics Park essentially pertains to sections of IL 53, and is not consistent with the
2006 CRS data. Furthermore, another 4.79 miles of proposed connectors Logistics Park
have no IRI or CRS data.
In summary, the facility level CRS pavement conditions represented in this report relied
on data quality in the IRIS 2006 end of year GIS database, are no more current than 2006,
and did not involve field observation. Conditions reported in this paper should be
considered as a preliminary benchmark for future reference and comparison once updated
information is reviewed. Future facility level analysis should include some basic level of
field review, and consideration should be given to the following issues:
obtain an updated IRIS GIS database with complete CRS and IRI data,
conduct a formal regional qualification review process to verify major intermodal
freight facilities (and associated connectors) that currently meet FHWA criteria as
major intermodal facilities, and
identify additional parameters using data such as twenty-foot equivalent units
(TEUs) for calculation of TEU/route-mile or other performance measures that
incorporate freight traffic volumes.