Intermediate Algebra Name Chapter 3 Exam Review 1. …mbuchanan/Math 152A Webfolder/Math 152A Exam...
10
Intermediate Algebra Chapter 3 Exam Review Name 1. Determine which equation represents the graph. ' 3-- (bi + 6 (l>) v^v- (d) y=^.v-2 Y I I I I I 0. (a) yX2 / V 5- ''III 1 1 1 1 1 1 1 1 i l(j 1— ' ' 5 , -V (a)jy = - 4 (nl V b) .v = 2 (b) .V (b)!y = - - (0 )X2jt (C) V=W»-V (C) V (d) (d) Y=v-.v 4 (d» v=;-.v'
Transcript of Intermediate Algebra Name Chapter 3 Exam Review 1. …mbuchanan/Math 152A Webfolder/Math 152A Exam...

Intermediate Algebra Chapter 3 Exam Review
Name
1. Determine which equation represents the graph.
' 3--
(bi + 6
(l>) v ^ v -
(d) y = ^ . v - 2
Y
I I I I I 0 .
(a) y X 2 /
V
5-
' ' I I I 1 1 1 1 1 1 1 1 i l(j 1— ' ' 5 , -V
(a)jy = - 4
(nl V
b) .v = 2
(b) .V
( b ) ! y = - -
(0 )X2jt
(C) V=W»-V
(C) V
(d)
(d) Y = v - . v 4
(d» v=;-.v'

2. Determine whether the following relations represent a function,
a. b.
c >8
l(l.(D41.'0).(4.2),(-4.-2)l
3. Determine if the following graphs represent a function. It does represent a function, then state the domain a range.
a. b c. d.
III - ^ < X < Q O
y I- -
I I I I i I I ^ 4
b. Find g(h} .^^^ 4. Let g(t) = 2t' -3t^ + 6
a. Find g( - l )
5. If a ball is dropped from the top of a 196-foot building, its height above the ground, h, at any time, can be found by the flmction h(t) = -16?^ +196, 0 < r < 3.5. Find the height of the ball at
a. 1 second
\
b. 3 seconds
6. Match each scenario to the corresponding graph.
a. A dude walked for 5 b. A dude went for a minutes to warm up, jogged for 20 minutes, and then walked for 5 minutes to cool down.
leisurely bike ride at a constant speed for 30 minutes.
11.
C. A dude took a 30-minute walk through his neighborhood. He stopped very briefly on 7 occasions to pick up trash.
iii .
d. A dude walked through his neighborhood and stopped 3 times to chat with his neighbors. He was gone from his house a total of 30 minutes.
IT Tiiiw (mm.) T i m e ( i n i n . ) Timi.- ( n i i n , )
Time (niin.)
D

7. The following graph describes the number ofy minutes you get from x dollars.
i 6 a. Does 30 minutes cost $6?
b. Does $10 give you 40 minutes? ^^^O
Complete the following x-y table.
8. 4x + 3y^6
0
A
y
f ./ 1 d ( 0
2)
9. Determine i f ,3) is a solution to the
equation 3 x - y = 4.
-2^= -1 Ho \
10. Find the x- and y-intercepts of y = -x-4.
x-intercept = ((o , 0 ) y-intercept = ( 0 ,~H )
U = 0 - H
y-intercept = ( 0 , 0 )
y-intercept = ( 0 ,^ )
11. Find the x- and y-intercepts of y = -x.
x-intercept = ( 0 , D )
12. Find the JC- and y-intercepts of 4x + 6y = 24. x-intercept = (Q
13. Say the weekly profit, P, of a widget store can be approximated by the formula P(ri) = 9/7 + 25, where n is the number of widgets sold. a. If the store sold 50 widgets would it make a weekly profit of $475?
b. If the store sold 35 widgets, how much weekly profit would the store make?
c. If the store made a weekly profit of $250, how many widgets didjhe store sale?
, „ ! | l ^ ^ \ ^

14. Graph and label 2 points
m = - - , passing through (-6,9)
15. Graph and label 2 points
m = undefined , passing through (5,4)
16. Graph and label 2 points.
3 3^
17. Graph and label 2 points.
y = — J C - 1 6
3 E
1 4
> ?x
3
V \
" t l J i
\.. i \
- \
^ •
V V V
- ^ - — \
) i
s ^
•V s
*> { \ \
K s
S j \ \ Of
\ \
V

18. Graph
X = -4
/K y
19. Graph
a - 5
20. Write the equation of the line.
'y
. . /> \ ,i
/ : r ; i ,
o r
22. Write the equation of the line.
•y
. . . . 1 . . . . 1 > 1 1 1 • 1 1 • 1 1 •
1 = 5
Of
21. Write the equation of the line.
c T
23. Write the equation of the line.
X

Formulas: Slope-intercept
y = mx + b
Point-slope
y - yi = m{x - j t | )
Slope
24. Find the slope of the line through the points (2, 3) and (-4, 6).
/
26. Find the slope of the line y=5.
25. Find the slope of the line 2x - 3y = 15.
3 - 3
^ 1 "5 27. Find the slope of the line x=5.
V
For 16-19, write an equation for each line using the given information. Give your final answer in function notation, f{x) = mx + b .
28. Write an equation of the line with slope, m = — , and goes through the point (-1, 4).
L_2>
tion of the line mat 29. Write an equation of the line that goes through the points (-2, 4) and (5, -10).
30. Write an equation of the line that goes through the point (45, -10) and parallel to the line 2^ + 5y = 10.
5- 5 A2J
31. Write an equation of the line that goes through the point (6, 8) and perpendicular to the line that goesthroughthepoints(2,4)and(6,10). /
3 3
-2- "2-
32. Determine wliether the two lines are parallel, perpendicular, or neither. a. b. = -2xt^ c.
33. Two points on /, and I2 two points on are given. Deteraiine whether is/, parallel to/j, /, is perpendicular to/j, or neither.
a. b. c. / , : (2,3) and (3,2) / , : (-3,5) and (2,3) / , : (7,3) and (4,6)
I,; (4,1) and (1,4) I,: (-4, - 2) and (-1,2) / , : (5,2) and (6,3)
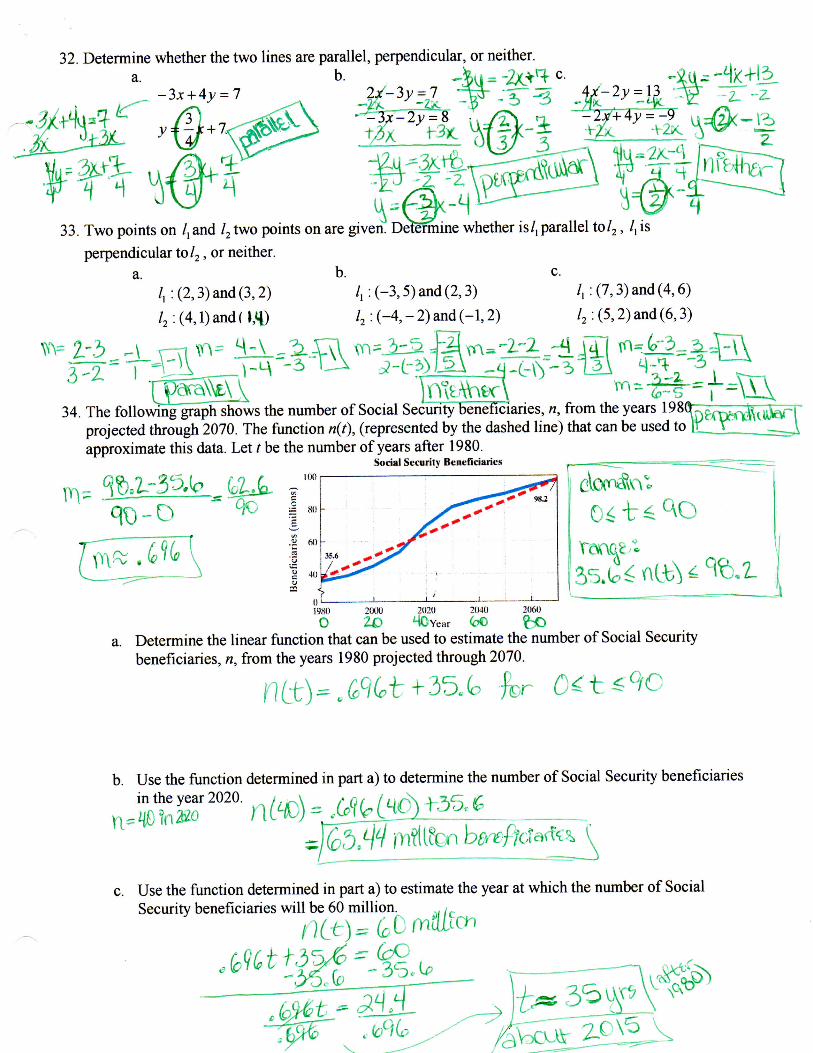
\ 34. The following graph shows the number of Social SecurTty IBeneficiaries, n, from the years 198'
projected through 2070. The function n(t), (represented by the dashed line) that can be used to approximate this data. Let t be the number of years after 1980.
Social Sccurilv Beneficiaries .
I) 1980
o 2(K)0 2020 2040 2060
a. Determine the linear function that can be used to estimate the number of Social Security beneficiaries, n, from the years 1980 projected through 2070.
b. Use the function determined in part a) to determine the number of Social Security beneficiaries
c. Use the function determined in part a) to estimate the year at which the number of Social Security beneficiaries will be 60 million. ,

35. The number of calories burned in 1 hour of swimming, when swimming between 20 and 50 yards per minute, is a linear function of the speed of the swimmer. A person swimming at 30 yards per minute will bum about 489 calories in 1 hour. While swimming at 50 yards per minute a person will burn about 525 calories in 1 hour. This information is shown in the following graph.
Calorics Burned while Swimming
•o c 3 4(K)
I 200
489 525
0 10 20 .10
Y a r d s p e r m i n u l e
S<nttcc: Ufitllli Ma^etz'titi: Wch .Site, www.hoatth.cnm
40
a. Determine a linear function that can be used to estimate the number of calories, C, burned in 1 hour when a person swims at r yards per minute. Y" ~f Q'
b. Use the function determmed in part a) to determine the number of calories burned in 1 hour when a person swims at 40 yards per minute.
c. Use the function determined in part a) to estimate the speed at which a person needs to swim to bum 600 calories in 1 hour. ^ = (:GOCd^Al'i S>
36. Let fix) = x'-3x + 4and g{x) = 2x-5 f ^ " ^ ^
a. b. c.
Find (f + g)(x)
Find (f + S)(a)
i
Find ( / + g)(4)
e.
Find Find ( / -g ) ( - i )
IV
Find h. -
Find
gCb)2C5) - 5 ' ^^''^=^ cj.^ = .CvN- 6 - - 3
f.
1. = - 2 - - 5 - ^
Fmd _ B2i -(//gX2)"6'-^-j '

37. The double line graph below compare high temperatures in Honolulu and Miami in August. From the days listed, use the graph to answer the following questions.
I I I I I I I I 11 12 13 14 15 16 17 18 19 20
August
38. Graph
5x-'+ 3y>9
39. Graph
/ - 2y>0
40. Graph
4 x > 3 y - l /
^ "5 3
3
a. Use the graph to fmd the combined temperature on August 15" . , .
b. Use the graph to find the difference in temperatures on August 16'' .
I
2Z V. 7^
•A
1"

41. Graph
- 6 / - 4 y >-8
42. Graph
43. Graph
\ 1
1 /
- f 1 \ 1
* > \ t ('
y A • f -i 7, I
1 i 1 m '-f :'1 I
'-f 1
44. Find the inequality that describes the shaded region.
45. Find the inequality that describes the shaded region.