
Interim results to 30 June 2004. 2 Lars Nørby Johansen Chief Executive Officer.
38
Interim results to 30 June 2004
-
Upload
matthew-ross -
Category
Documents
-
view
215 -
download
0
Transcript of Interim results to 30 June 2004. 2 Lars Nørby Johansen Chief Executive Officer.
Interim results to 30 June 2004

2
Lars Nørby JohansenChief Executive Officer

3
Agenda
Introduction Lars Nørby Johansen
Results Summary Lars Nørby Johansen
Strategy & Performance Update Integration Divestments Strategy Results Overview
Lars Nørby Johansen
Detailed Financials Trevor Dighton
Operational Review Manned Security Security Systems Cash Services
Nick Buckles
Summary & Close Lars Nørby Johansen
Q & A All
4
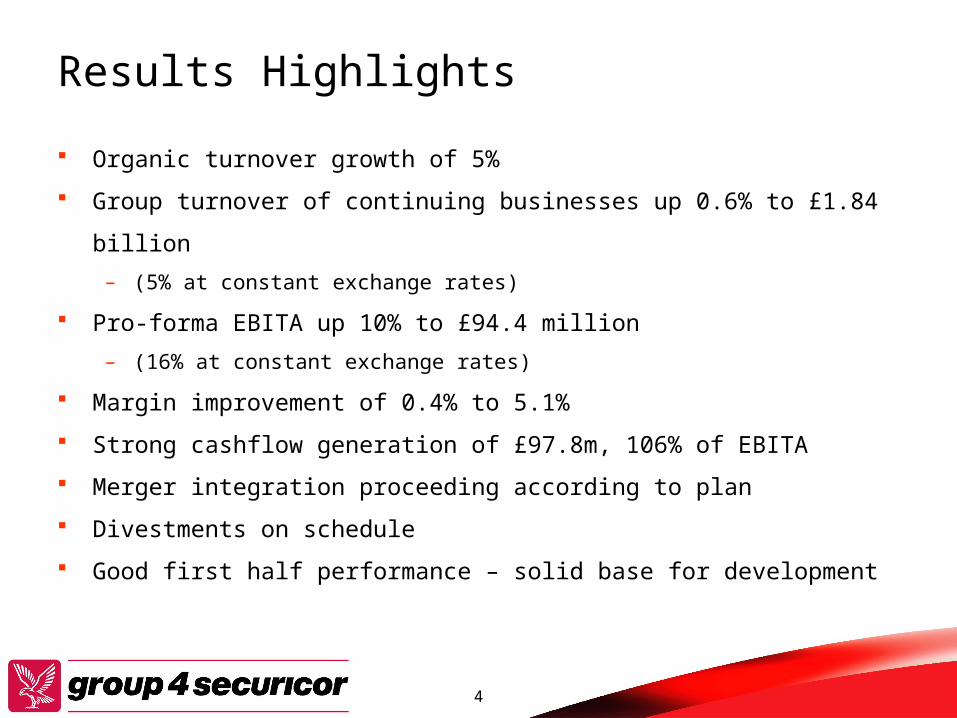
Results Highlights
Organic turnover growth of 5%
Group turnover of continuing businesses up 0.6% to £1.84 billion
– (5% at constant exchange rates)
Pro-forma EBITA up 10% to £94.4 million
– (16% at constant exchange rates)
Margin improvement of 0.4% to 5.1%
Strong cashflow generation of £97.8m, 106% of EBITA
Merger integration proceeding according to plan
Divestments on schedule
Good first half performance – solid base for development

5
Group Turnover6 months ended 30 June 2004
1,838
7999 61
1,749
2003 2004
Disp/Discont
FX effect
At current FX
£m 1,8991,927

6
Group Profit6 months ended 30 June 2004
81.3
9
85.9
4.1
£m
2003 profit at 2004 exchange rates
From organic growth
From margin improvement
2003 2004
Total 94.4

7
Group 4 Securicor – Key areas of focus
Deliver cost synergies and business performance Deliver organic growth and margin targets Further development of integrated security proposition Leverage best practice to improve overall cash services
business performance Expand further in higher growth countries Strategic, value-enhancing acquisitions
– France, Australia, Iberia, Latin America and Security Systems

8
Integration - Building the new organisation Executive Committee established February 2004 Monthly meetings of Integration Steering Committee from March to July
04- Business preservation- Integration progress- Joint decisions on corporate and regional structures
Alignment seminar with Executive Committee members in May 04- Values and perceptions- Roles and responsibilities
Strategy seminar with Executive Committee and Regional Presidents in June 04- Who are we, where are we going, how do we get there?
Management conference with country directors in Autumn 04- Vision and strategies- Motivate management
Extensive employee & customer survey initiated
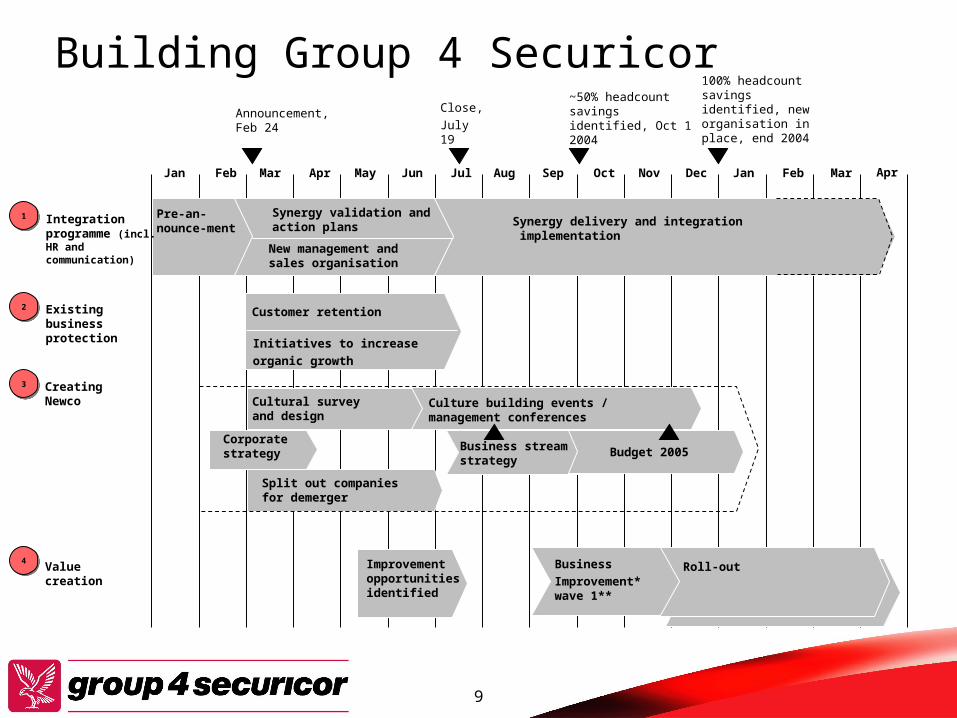
9
Building Group 4 SecuricorClose, July 19
Announcement, Feb 24
100% headcount savings identified, new organisation in place, end 2004
~50% headcount savings identified, Oct 1 2004
Synergy delivery and integration implementation
Pre-an-nounce-ment
Value creation
Integration programme (incl. HR and communication)
Synergy validation and action plans
Creating Newco
Jan Feb Mar Apr May Jun Jul Aug Sep Oct Nov Dec
Improvement opportunities identified
Existing business protection
Customer retention
Initiatives to increase organic growth
Jan Feb Mar Apr
New management and sales organisation
Roll-outBusinessImprovement* wave 1**
Corporate strategy
Business stream strategy
Cultural survey and design
Culture building events / management conferences
Budget 2005
Split out companies for demerger
22
11
33
44

10
Integration Office established in February 2004
Integration communication web-platform established in March 2004
Integration policies agreed in April 2004
– “Best of both” maintained as principle for integration decisions
– Two Groups kept separate during pre-closing period
– Pre-closing planning detailed without being value-destroying
– Post-closing emphasis to be on speed and business focus
Business maintenance programme established in April 2004
– Focus on customers during pre and post-closing integration
Quantification, planning and tracking tools developed, finalised and in
place in July/August 2004
Key Integration Initiatives

11
Teams have completed their key milestones
IS EuropeDivisionUK GuardingNL GuardingGE GuardingIE GuardingHungaryFrance
IS Americas & New MarketsDivisionSouth Africa GuardingOther overlapping countries
CashDivisionGE Cash
Head OfficeCorporateFinanceHRLegalCIT insuranceCommunicationITProcurement (team)FacilitiesProcurement savings
Joint team kicked off
Top manage-ment structure communi-cated
80% of synergies verified
Selection of levels 2 + 3 complete
Detailed synergy analysis complete
Day one plan complete
Imple-menta-tion plan complete
Baseline complete
N/a
()
Restruc-turing costs and phasing
()
()()()
N/a N/a
N/a
N/a
N/aN/a
()
()
()
()
N/a
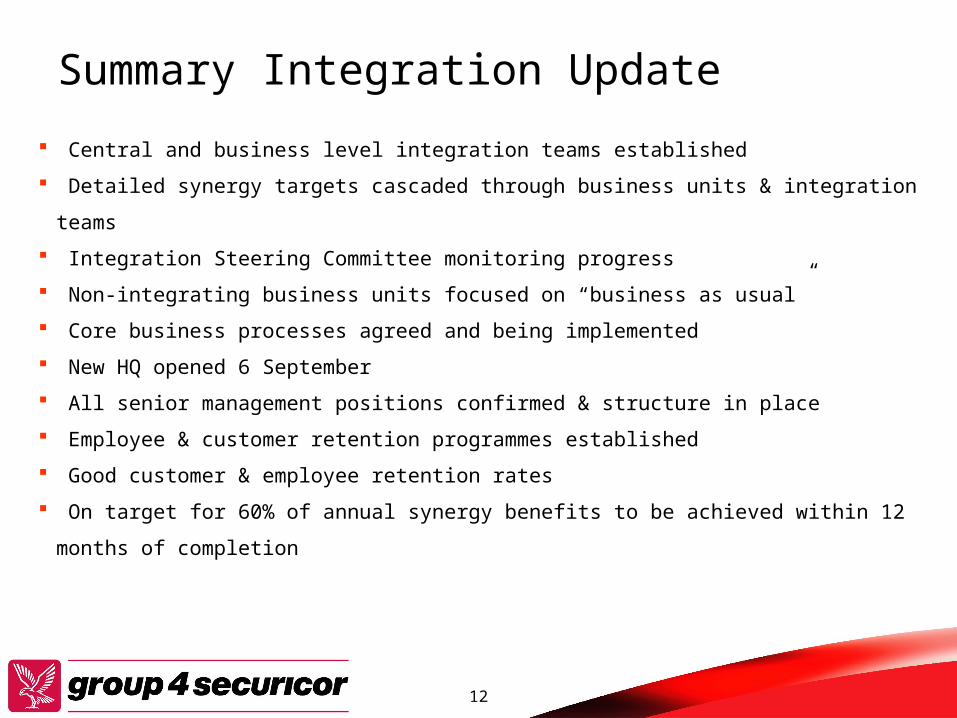
12
Summary Integration Update
Central and business level integration teams established
Detailed synergy targets cascaded through business units & integration teams
Integration Steering Committee monitoring progress
Non-integrating business units focused on “business as usual”
Core business processes agreed and being implemented
New HQ opened 6 September
All senior management positions confirmed & structure in place
Employee & customer retention programmes established
Good customer & employee retention rates
On target for 60% of annual synergy benefits to be achieved within 12 months
of completion
13
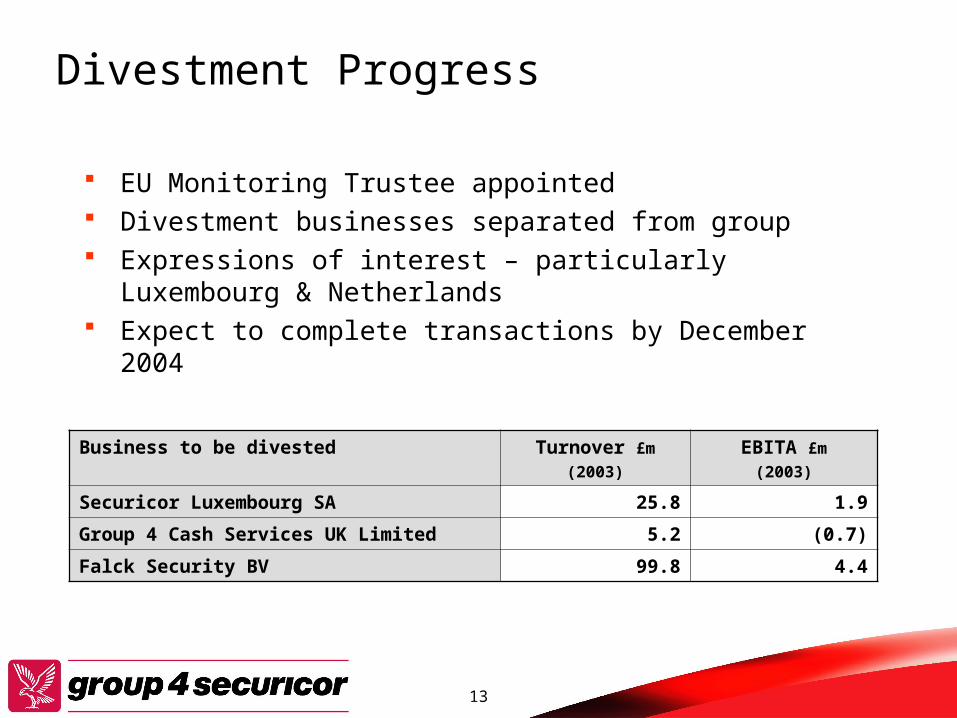
Divestment Progress
EU Monitoring Trustee appointed Divestment businesses separated from group Expressions of interest – particularly Luxembourg &
Netherlands Expect to complete transactions by December 2004
Business to be divested Turnover £m
(2003)
EBITA £m
(2003)
Securicor Luxembourg SA 25.8 1.9
Group 4 Cash Services UK Limited 5.2 (0.7)
Falck Security BV 99.8 4.4

14
Trevor DightonChief Financial Officer

15
Continuing Turnover by Business Line at current exchange rates 6 months ended 30 June 2004
1,309
342366
1,251
163156
2003 2004
Cash Services
Security Systems
Manned Security
£m 1,8381,749

16
Continuing Turnover by Geography at current exchange rates6 months ended 30 June 2004
1,106
188223
1,069
509492
2003 2004
New Markets
North America
Europe
£m 1,8381,749

17
Organic Turnover Growth6 months ended 30 June 2004
Europe North America
New Markets
Total
Manned Security
2.7% 3.9%* 15.1% 4.7%
Security Systems
1.9% 17.9% 58.5% 4.3%
Cash Services6.0% -2.4% 35.0% 7.0%
Total3.5% 3.5% 18.8% 5.1%
* Includes Wackenhut organic growth of 6%

18
Continuing EBITA by Business Line6 months ended 30 June 2004
72.2
8.111.3
22.5 24.3
-14.3 -13.4
85.9
94.4
69.6
Manned SecuritySecurity SystemsCash ServicesHead office costsGroup Total
£m 2003 2004
19
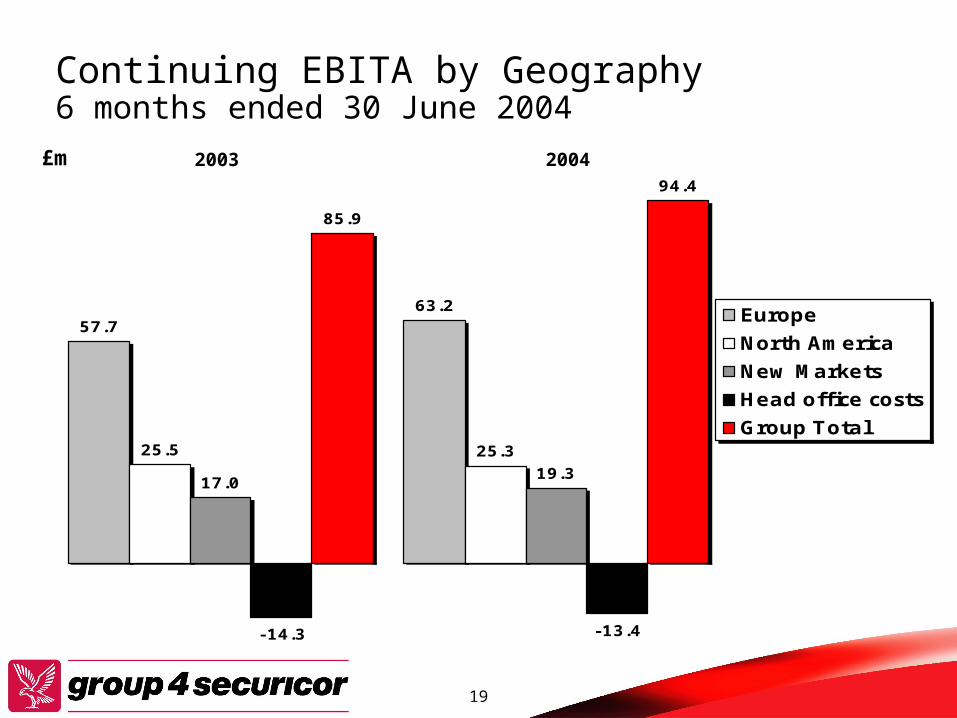
Continuing EBITA by Geography6 months ended 30 June 2004
63.2
25.5 25.3
17.019.3
-14.3 -13.4
85.9
94.4
57.7 Europe
North America
New Markets
Head office costs
Group Total
£m 2003 2004

20
EBITA Margin by Business Line6 months ended 30 June 2004
5.5
5.1
6.9
6.5 6.6
4.7
5.15.3
Manned Security
Security Systems
Cash Services
Group Total
% 2003 2004

21
EBITA Margin by Geography6 months ended 30 June 2004
5.7
4.75.0
8.48.7
4.7
5.15.3 Europe
North AmericaNew MarketsGroup Total
% 2003 2004

22
Operating Cash Flow6 months ended 30 June 2004
Group EBITA 92.2 82.0
Depreciation37.0 37.5
Working capital movement8.6 (6.9)
Cash generated from operations137.8 112.6
Capital expenditure(40.0) (48.4)
Operating cash flow97.8 64.2
Operating cash flow as % of EBITA106% 78%
£m 20032004
Net Debt at 30 June 2004 = £598.1 m
Net Debt at 31 December 2003 = £623.1m

23
Nick BucklesDeputy Chief Executive &
Chief Operating Officer
24
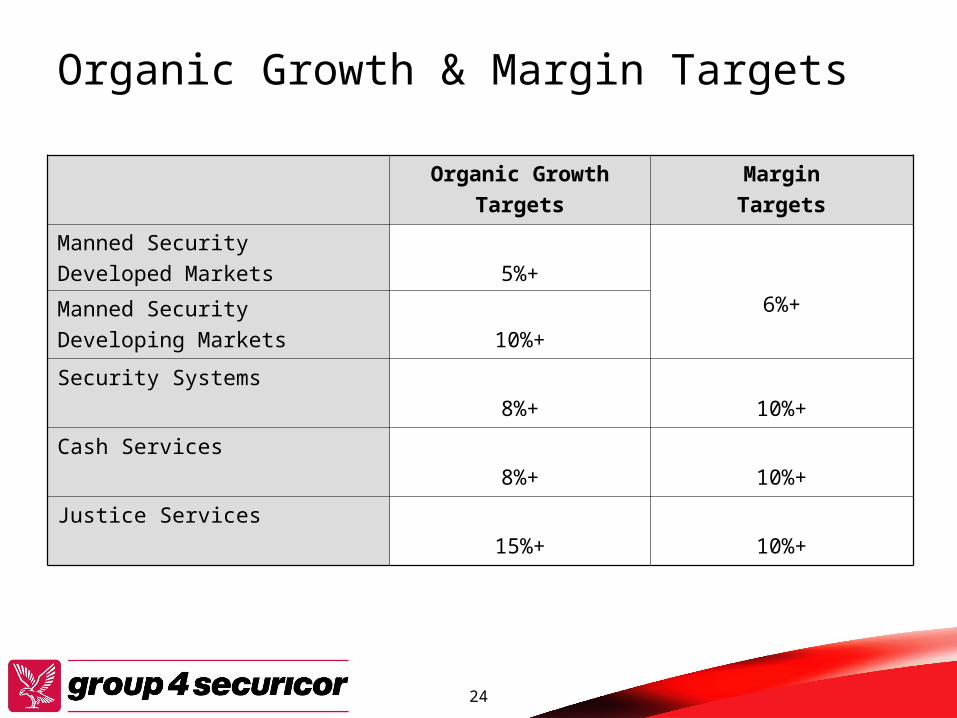
Organic Growth & Margin Targets
Organic GrowthTargets
MarginTargets
Manned SecurityDeveloped Markets 5%+
6%+Manned SecurityDeveloping Markets 10%+
Security Systems8%+ 10%+
Cash Services8%+ 10%+
Justice Services15%+ 10%+

25
Manned Security
Turnover£m
EBITA *£m
Margins
H104 H103 H104 H103 H104 H103
At constant exchange rates (30 June 2004) 1,312.8 1,254.1 72.2 65.5
Exchange differences 68.7 4.1
At actual exchange rates 1,312.8 1,322.8 72.2 69.6 5.5% 5.3%
* Includes share of associates
Organic turnover growth of 4.7% (at constant exchange rates) Margins increased by 0.2% to 5.5%

26
Manned Security - Europe UK
– Organic growth of 4%– Good customer retention rates in excess of 90%– New contract wins and good growth in aviation sector– Price competition continues in traditional guarding
Netherlands– Market continues to tighten– Turnover slightly down on 2003 but margin maintained
Germany– Slight turnover growth on H1 2003– Profit performance ahead of prior year
Justice– Secure Training Centre opened in August 2004– Continued growth in Electronic Monitoring
Other– Operational improvements increased margin performance in
Belgium– Disappointing results in Sweden with loss of Stockholm Metro
contract

27
Manned Security - North America Wackenhut
– Good organic growth of 6%– Margins slightly below H1 2003 due to cessation of Rocky Flats
contract and increased employment costs in 2004– New contract wins with General Electric, Daimler Chrysler, Wal-
Mart and others in commercial guarding– Further growth in nuclear business– Strong growth in H2
Canada– Loss of Toronto airport contract– Some regional aviation contract wins– Some price pressure from local competitors
Other– Cognisa operating at a slight loss

28
Manned Security - New Markets
Good performance overall with 15% organic growth and 8% margin
Good results from Africa and South Africa Continuing strong performance in India New US Embassy contracts in Philippines and
Brazil Far East continuing to perform well with strong
new business opportunities despite slow economies
29
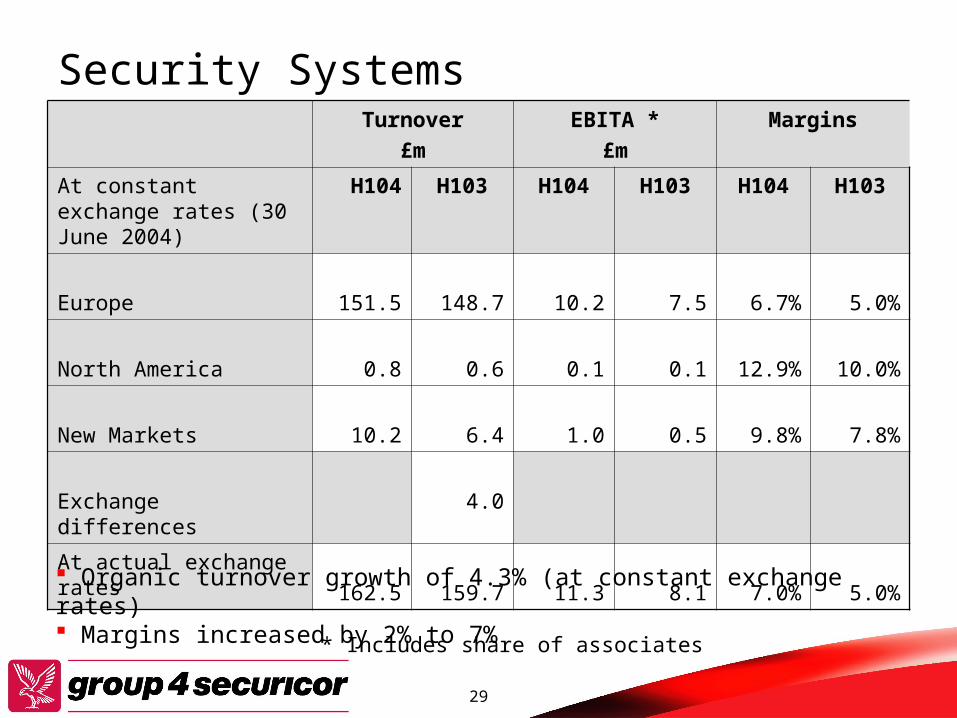
Security SystemsTurnover
£mEBITA *
£mMargins
At constant exchange rates (30 June 2004)
H104 H103 H104 H103 H104 H103
Europe 151.5 148.7 10.2 7.5 6.7% 5.0%
North America 0.8 0.6 0.1 0.1 12.9% 10.0%
New Markets 10.2 6.4 1.0 0.5 9.8% 7.8%
Exchange differences 4.0
At actual exchange rates 162.5 159.7 11.3 8.1 7.0% 5.0%
* Includes share of associates
Organic turnover growth of 4.3% (at constant exchange rates) Margins increased by 2% to 7%

30
Security Systems
Strong organic growth in Germany, the Baltic States, Netherlands, Greece and Norway
Good cost control and contract wins in Denmark improved performance
Norway remains competitive Turnover growth in Sweden despite flat market Forecast improvements in European construction
industry in H2 2004

31
Cash ServicesTurnover
£mEBITA *
£mMargins
At constant exchange rates (30 June 2004)
H104 H103 H104 H103 H104 H103
Europe 306.7 289.3 19.2 18.7 6.3% 6.4%
North America 31.3 32.0 1.5 0.7 4.8% 2.2%
New Markets 28.3 21.0 3.6 2.6 12.7% 12.4%
Exchange differences 6.1 0.6
At actual exchange rates 366.3 348.4 24.3 22.5 6.6% 6.5%
* Includes share of associates
Organic turnover growth of 7% (at constant exchange rates) Margins increased to 6.6%

32
Cash Services - Europe UK
– Improvements overall versus H1 2003– Cash centre model proven and profitable– Excellent customer service levels– Contract wins in banking, rail and retail sectors– Price increase strategy proceeding according to plan
Germany– Market continues to be tough with ongoing price pressure– Combination of merged businesses should provide opportunity
to improve Netherlands
– Continued growth and margin improvements Other
– Volume reductions in cash transport contribute to a slight increase in the loss in Belgium
– Modest contract wins in France contribute to improved profit performance
33
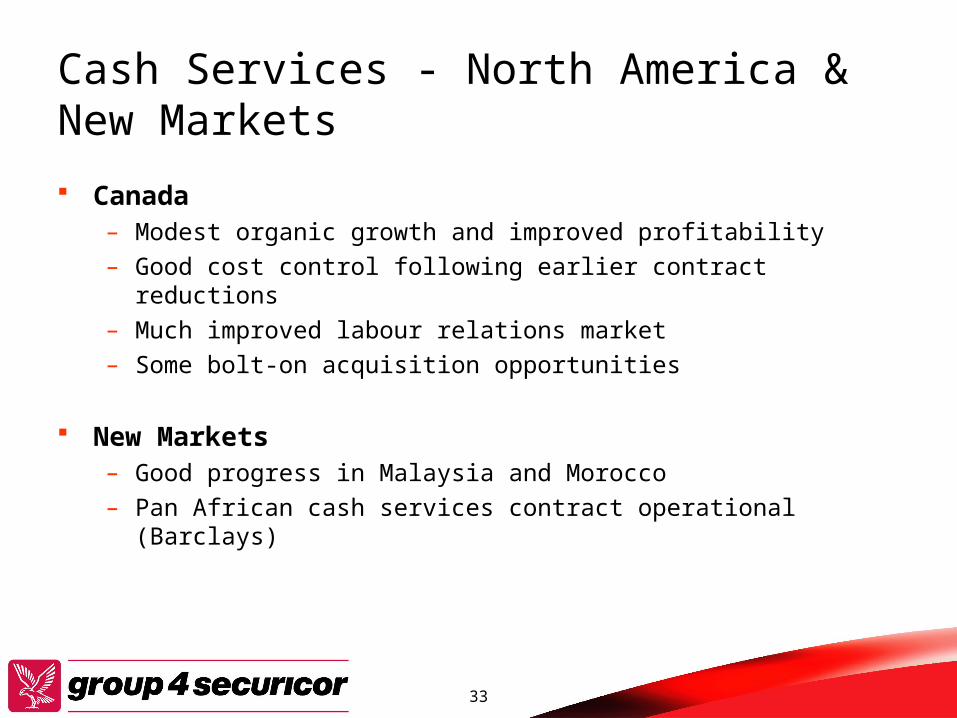
Cash Services - North America & New Markets
Canada– Modest organic growth and improved profitability– Good cost control following earlier contract reductions– Much improved labour relations market– Some bolt-on acquisition opportunities
New Markets– Good progress in Malaysia and Morocco– Pan African cash services contract operational (Barclays)

34
Trading Summary
Good US performance
All UK businesses performing well
Strong growth in developing markets
Good improvements in security systems
Germany Cash Services and Sweden requiring
significant improvement
Overall a good result

35
Lars Nørby JohansenChief Executive Officer

36
Summary & Outlook
Complex merger completed ahead of schedule
Integration progressing very well
– Key structures and processes in place
– Synergy targets rolled out to businesses
Strong H1 trading performance
Good progress expected to continue

37
Q & A


![Palle Emil Flygenring · +Susan Henriette Johansen Flygenring12 Sophia Johansen Flygenring2 Louisa Johansen Flygenring3 Ronni Flygenring13 +Liza Bolette Flygenring [Rønne Frederiksen]14](https://static.fdocuments.net/doc/165x107/5f29d62e5b89c1406f085bec/palle-emil-susan-henriette-johansen-flygenring12-sophia-johansen-flygenring2-louisa.jpg)


