Interim Results from Alternative Fuel Truck Evaluation Project
17
SAE TECHNICAL PAPER SERIES 1999-01-l 505 Q” Interim Results from Alternative Fuel Truck Evaluation Project Kevin L. Chandler Battelle Paul Norton National Renewable Energy Laboratory Nigel Clark W&t Virginia University Reprinted From: State of Alternative Fuels Technologies, 1999 (SP-1458) mfi E The Engineering Society For Advancing Mobility Land Sea Air and Space, I N T E R N A T./-O N A L International Spring Fuels & Lubricants Meeting & Exposition Dearborn, Michigan May 3-6,1999 400 Commonwealth Drive, Warrendale, PA 15096-0001 U.S.A. Tel: (724) 776-4841 Fax: (724) 776-5760
Transcript of Interim Results from Alternative Fuel Truck Evaluation Project
SAE TECHNICAL PAPER SERIES 1999-01-l 505
Q”
Interim Results from Alternative Fuel Truck Evaluation Project
Kevin L. Chandler Battelle
Paul Norton National Renewable Energy Laboratory
Nigel Clark W&t Virginia University
Reprinted From: State of Alternative Fuels Technologies, 1999 (SP-1458)
mfi E The Engineering Society For Advancing Mobility Land Sea Air and Space,
I N T E R N A T./-O N A L
International Spring Fuels & Lubricants Meeting & Exposition
Dearborn, Michigan May 3-6,1999
400 Commonwealth Drive, Warrendale, PA 15096-0001 U.S.A. Tel: (724) 776-4841 Fax: (724) 776-5760

SAE routinely stocks printed papers for a period of three years following date of publication. Direct your orders to SAE Customer Sales and Satisfaction Department.
Quantity reprint rates can be obtained from the Customer Sales and Satisfaction Department.
To request permission to reprint a technical paper or permission to use copyrighted SAE publications in other works, contact the SAE Publications Group.
AU SAEpapers, standa& andwtected books are a&&acied and hdexed in the GiobeiMobib& Da&base.
ISSN 0149-7191
Positions and opinions advanced in thii paper are those of the author(s) and not ecessanly those of SAE.
kr. The author is solely responsible for the content of the
A process is available by which discussions will be printed with the paper if lt is published in SAE Transactions. For permission to publish this paper in full or in part, contact the SAE Publications Group.
Persons wishing to submit papers to be considered for presentation or publication through SAE should send the manuscript or a 300 word abstract of a proposed manuscript to: Secretary, Engineering Meetings Board, SAE.
Printed In USA 954826

1999-01-1505
Interim Results from Alternative Fuel Truck Evaluation Project
Kevin L. Chandler Battelle
Paul Norton National Renewable Energy Laboratory
Nigel Clark West Virginia University
ABSTRACT
The objective of this project, which is supported by the U.S. Department of Energy (DOE) through the National Renewable Energy Laboratory (NREL), is to provide a omprehensive comparison of heavy-duty trucks
erating on alternative fuels and diesel fuel. Data llection from up to eight sites is planned. Currently,
the project has four sites: Raley’s in Sacramento, CA (Kenworth, Cummins LlO-300G, liquefied natural gas - LNG); Pima Gro Systems, Inc. in Fontana, CA (White/GMC, Caterpillar 31768 Dual-Fuel, compressed natural gas - CNG); Waste Management in Washington, PA (Mack, Mack E7G, LNG); and United Parcel Service in Hartford, CT (Freightliner Custom Chassis, Cummins B5.9G, CNG). This paper summarizes current data collection and evaluation results from this project.
INTRODUCTION
The Alternative Fuel Truck Evaluation Project is part of the National Renewable Energy Laboratory’s (NREL) alternative fuel evaluation programs. This project will include up to eight demonstration sites over the next three years, which will represent new engine and fuel system technology for alternative fuels in trucking. The project will evaluate the technologies and provide comparisons of the newest generation of alternative fuel engines and vehicle technologies to comparable diesel technologies.
The objective of this project is to comprehensively c- 3mpare alternative fuel trucks and similarly equipped diesel trucks. This comparison includes economic, technical, emissions, and safety factors. Information for the comparison is obtained by collecting data on the operational, maintenance, performance, and emissions
characteristics of each alternative fuel fleet and comparable diesel fleet operating at the same site. Trucking fleet operators considering the use of alternative fuel trucks are the primary intended audience for this information. This project and the data collection and evaluation protocol are defined in the Project Guidelines [l] and were originally based on the Alternative Fuel Transit Bus Evaluation Program [2-41. Early results from this project have been published [S-6].
DATA COLLECTION
The data collection is intended to cause as little disruption for the host site as possible. In most cases, the data collection is a matter of sending copies (electronic and/or paper) of data already collected by the participating site. All participating host fleets have access to all data being collected from their site and other data available from this project. Summaries of the data collected and evaluations/analyses are distributed for review and input by the host site. Data collected as part of this project are separated into four categories: (1) operating descriptions (vehicle specifications and operating cycle of the vehicles); (2) vehicle operations (fuel usage, engine oil usage, and maintenance); (3) emissions test results (performed by West Virginia University at least once for each site); and (4) facility and capital cost descriptions.
OPERATING DESCRIPTIONS
Vehicle operating descriptions include vehicle system descriptions and the operating cycle (or use) of the vehicles. Vehicle system descriptions are written at the beginning of the data collection and may require changes if major systems are altered. The descriptions document the similarity of the alternative fuel and diesel

control trucks by describing the main systems of the trucks such as the engine, fuel storage, and major accessories. The operating cycle description is intended to provide an understanding of the amount of work the study trucks are expected to accomplish in a given time frame.
VEHICLE OPERATIONS
Data collection for vehicle operations includes each fuel fill (amount of fuel, odometer reading, and date) and fuel prices (each fuel and each time the fuel price changes - price and date). Vehicle operations data collection also includes engine oil consumption and engine oil changes. Each engine oil addition is recorded (amount of oil, odometer reading, and date) and oil changes are recorded (amount of oil, odometer reading, and date as part of a maintenance action, usually preventive maintenance). Maintenance data include each repair action such as preventive maintenance, unscheduled maintenance, and road calls (date of repair, labor hours, number of days out of service, odometer reading, parts replaced, parts cost, and descriptions of problem reported and actual repair performed). Data on warranty repairs are collected in a similar manner as data on other maintenance actions; however, the cost data for warranty repairs are not included in the operating cost calculations because they are considered to be included in the capital cost of the vehicle.
EMISSIONS TEST RESULTS
The West Virginia University’s Department of Mechanical and Aerospace Engineering (WVU) transportable laboratory can measure particulate matter (PM), carbon monoxide (CO), carbon dioxide (CO,), nitrogen oxides (NO,), hydrocarbons (HC), methane (CH,), methanol (CH,OH), and formaldehyde (HCHO). WVU uses a five-peak, five-mile route to test each truck [lo]. The route is defined as a fixed distance route (five miles). The time the truck takes to finish the route may change depending on the truck’s ability to accelerate. The length of the constant speed (cruise) portions of the route is adjusted to add or subtract time at constant speed based on the time taken for the truck to accelerate.
F.AClLlTY AND CAPITAL COST DESCRIPTIONS
This category includes descriptions of the refueling, maintenance, and vehicle storage facilities that may be associated with the vehicles in this study. These descriptions include systems in each facility that may be affected by either the use of alternative fuels or how an alternative fuel is used. Data on capital costs include vehicle capital costs and costs for any facility modifications that are required to conduct the operation. The vehicle capital costs include the cost for new vehicles and engines, the original cost of older vehicles
included in this study, and any costs required to repower or rebuild vehicles and engines.
REPORTS
Two reports are generated for each site:
. The first report is a brief summary of start-up issues, including descriptions of the facilities and operation at the site (two to three months after the initiation of vehicle operations)
l A final report for the site is issued soon after the data collection has been completed (approximately 12 months of data are collected on all vehicles at the site). d
The process for producing each site report includes an opportunity for reviewing and editing by the participating site before any results are published. No information is published that is deemed sensitive by the participating site without permission from the site representatives. All reports from this project are available from the U.S. Department of Energy’s (DOE) Alternative Fuels Data Center (AFDC) on the Internet at www.afdc.doe.aov or from the National Alternative Fuels Hotline at 1-800-423- 1 DOE.
PRELIMINARY RESULTS - RALEY’S
Raley’s is a 120-store grocery chain centered in ’ Sacramento, California with operations in the Sacramento and San Jose, California areas, as well as the Reno, Nevada area. The Raley’s grocery chain includes Bel Air and Nob Hill stores. Raley’s has a 64- truck fleet with eight model year 1997, Class 8 Kenworth T800 tractors using Cummins LlO-300G engines operating on liquefied natural gas (LNG) fuel. The diesel control vehicles used for this study are three model year 1996, Class 8 Kenworth T400 tractors using Cummins Ml l-330 engines and operating on diesel fuel. The LNG vehicles started operation on April 17, 1997 and, the diesel vehicles started operation in late 1995 and early 1996. The data evaluation for the LNG trucks includes data after January 1, 1998 (data L%lean point”) to remove data from early problems with and modifications of the natural gas engines. Raley’s start-up experience is documented in another report 191.
.
I i OPERATING DESCRIPTIONS
Operating descriptions include the vehicle system descriptions and a description of vehicle operating cycle for the Raley’s study trucks.
Vehicle Svstem Descriotions
Table 1 shows vehicle description information for the LNG and diesel trucks studied. Figure 1 shows one of
2

.
d
Table 1. Vehicle System Descriptions - Raley’s
Description Diesel Control Trucks LNG Trucks Chassis Manufacturer/Model Kenworth T400, Class 8 Kenwotth T800, Class 8 Chassis Model Year 1996 1997 Engine Manufacturer/Model Cummins Ml l-330 Cummins LlO-300G Engine Ratings
Max. Horsepower 330 hp Q 1600 rpm 300 hp @ 2100 rpm Max. Torque 1250 lb-ft @ 1200 rpm 900 lb-ft Q 1300 rpm
Fuel System Storage Capacity 114 gallons 174 LNG gallons total (104 diesel energy equivalent gallons) - 2 LNG saddle tanks from MVE, Inc.
Transmission Fuller RTL12610B, 10 speed Fuller RT1171 OB, 10 speed Manufacturer/Model Catalytic Converter Used No No (Y/N\ Vehicle Cost in Comparison to - +$35,000 Diesel
Figure 1. Raley’s LNG Truck
the LNG trucks at Raley’s. There are a few configuration differences between the LNG and diesel trucks such as the tractor model (T800 for LNG and T400 for diesel)
.‘ and the engine model (Ll O-300G for LNG and Ml l-330 for diesel). Based on a discussion with an engineer at Kenworth, the differences between the T800 and T400 models are considered minor. The T400 is 9 inches longer than the T800, and the T800 is more aerodynamic [7]. The comparison of the Cummins LlO- 300G and Ml l-336 was considered acceptable because
tr- )f the similarity of the two engines and because the LlO diesel version has been phased out by Cummins for truck operations [8].
Vehicle Ooeratina Cvcle
Each LNG truck at Raley’s is commonly used up to six days a week and two shifts per day (trucks operate 24 hours a day, the number operating at any given time varies). The trucks depart the Distribution Center loaded and return nearly empty (returning with empty pallets and spoiled/damaged goods) unless the truck stopped to backhaul goods to the Distribution Center. The trucks are used most heavily during the week or two before holidays such as Christmas, Thanksgiving, or Memorial Day. Raley’s data have been analyzed on a per-trip and per-day basis as well as overall vehicle usage (mileage) per month. A trip is defined as the route for each truck
3
leaving the Distribution Center, making deliveries (or picking up), and returning to the Distribution Center.
Table 2 shows that each LNG truck is used for an average of three separate trips per day. The LNG trucks operated 12 hours per day, deliveries were made to (or from) 6 to 7 stores, mileage per day averaged 195 miles per truck, and a backhaul was made on every third truck on any given day of operation. The data shown in the table is for days that the trucks have been used and does not include downtime. The diesel trucks were used mostly on one route in a given day with another very short route. In other words, there is little difference between the per-trip mileage and the per-day mileage. The diesel trucks averaged 10.4 hours, 4 to 5 stores, and one backhaul daily per truck. The average mileage per day for the diesel trucks was 256 miles per truck. Table 3 shows the average monthly mileage per truck for 12 months of data. The LNG study fleet has been consistently about 27 percent lower for average monthly mileage.
Based on average trip mileage and average monthly mileage, there are some significant differences in usage between the LNG and diesel trucks. These differences may significantly impact fuel economy and wear and tear on the vehicles. The maintenance data analysis includes both actual costs as well as cost per mile for both fleets in order to investigate the impact of the vehicle usage difference.
VEHICLE OPERATIONS
Vehicle operations include the analysis results of the fuel consumption, fuel economy, and cost; engine oil consumption and cost; maintenance, maintenance costs, and warranty; and safety incidents.
Fuel Consumotion. Fuel Economy. and Cost
Fuel consumption and economy are shown in Table 4 for both study fleets for the period spanning Jan 98 through Dee 98. A diesel energy equivalent gallon is equal to a standard LNG gallon divided by 1.67 (this conversion factor is for pure methane; LNG at this site is essentially pure methane according to the fuel supplier). The energy equivalent fuel consumption for the LNG trucks is considerably higher than for the diesel control trucks, as the fuel economies indicate. The average LNG truck fuel economy is 38 percent lower than the average diesel truck fuel economy on an energy equivalent basis.
economy averages about 33 percent lower for the LNG trucks. As discussed earlier in regards to duty cycle, the usage of the LNG and diesel trucks has some differences, which may significantly impact the fuel economy. The in-use fuel economy data shows a LNG P- energy equivalent fuel economy that is lower than the emissions testing results. This difference in the energy equivalent fuel economy for in-use data may be an indication of the duty cycle differences and/or the measurement of LNG in the fuel tanks with losses from vent filling (holding the vent on the on-board fuel tank open during filling at the station to speed up filling). Overall, the fuel economies from the emissions testing and in-use data in regards to difference between the LNG and diesel control trucks are generally consistent.
1
I ,
: Fuel costs during the data collection period have been higher for the LNG on an energy equivalent basis. With taxes included, diesel has cost $1.02 per gallon, while LNG has cost $1.23 per diesel energy equivalent gallon. Raley’s has LNG delivered from Wyoming to Sacramento. Transportation costs (based on distance to be trucked) for LNG (or any commodity being trucked) are a significant portion of the overall cost of the fuel delivered. Also, Raley’s has been purchasing partial truckloads of LNG due to the storage constraints of their temporary fuel station (5,000 gallons). Partial truckloads of LNG have the same transportation costs as full truckloads (10,000 gallons). Therefore, the cost per gallon of LNG delivered is much higher than if Raley’s were able to purchase a full truckload of the fuel. The new, permanent LNG station has the capability of receiving a full truckload plus some reserve of LNG (13,000-gallon total capacity). The LNG cost per gallon is $0.575 plus tax for a partial truckload and $0.475 plus tax for a full truckload. Taxes for LNG in California include the federal tax at $0.119 per LNG gallon and the state sales tax at $0.06 per LNG gallon. With the new station and a full truckload of fuel, the LNG fuel cost per diesel energy equivalent gallon has been $1.09.
Table 5 shows the fuel cost per mile for the LNG and diesel trucks. There are several factors contributing to the higher fuel cost per mile for the LNG trucks. First, the fuel economy has been 38 percent lower for the LNG fleet on an energy equivalent basis. Second, the fuel cost per gallon for LNG on an energy equivalent basis has been significantly higher, and diesel fuel prices have been very low during the data collection period. The lower vehicle usage for the LNG fleet has also contributed to the higher fuel cost per mile.
As shown later in the emissions test results subsection, the two sets of emissions testing results (for the LNG and diesel trucks) show that the fuel economies are 30 percent lower for the LNG trucks for the first emissions testing and 37 percent lower for the second emissions testing results (see Table 8). Emissions testing is a controlled test with the same duty cycle, and the fuel
Enaine Oil Consumotion and Cost
Engine oil consumption is the amount of engine oil that has been added between oil changes, thus the amount of engine oil consumed by the engine (or possibly leaked out of the engine). Generally, for most engines a certain level of engine oil consumption is expected. If it is
.,
4

Table 2. Truck Usage Per Trip and Per Day (Jan 98 - Dee 98) - Raiey’s
Vehicle Average Per Trip Average Per Day
Miles Hours Stores Back Haul Miles Hours Stores Back Haul Diesel 211.8 8.6 3.5 0.8 255.8 10.4 4.3 0.9 LNG 70.0 4.3 2.4 0.1 195.0 ‘“-’ 11.9 6.6 0.3
Table 3. Average Monthly Mileage Per Truck (Jan 98 - Dee 98) - Raiey’s
Vehicle No. of Trucks
Diesel 3 LNG 8
Total Mileage
222,563 430,902
Average Monthly Mileage per Truck
6,182 4,489
Table 4. Fuel Consumption and Economy (Jan 98 - Dee 98) - Raiey’s
Vehicle Mileage LNG Miies/LNG Diesel Energy Gal. Gal. Equivalent Gal.* MPEG**
Diesel 200,748 - 28,607 7.02 LNG 400,637 151,164 2.60 92,314 4.34
l Diesel energy equivalent gallons are calculated by LNG Gal. / 1.67 l * MPEG - miles per equivalent gallon Note: the mileage and LNG gallons columns show the amount used in the calculations, not the total amount used in service.
Table 5. Fuel Cost Per Mile (Jan 98 - Dee 98) - Raley’s .
Fuel Usage Cost ‘ - i. /.
Fleet Mileage Diesel (Equiv.) Diesel (Equiv.) used Cost/Gal. ($) per Mile ($)
Diesel 200,748 28,607 1.02 0.145 LNG 400,637 92,314 1.23 0.283
If the LNG cost were at the full tanker load of fuel price ($6.475 per gallon), then the fuel cost per mile would be $0.251. Equation for Fuel Cost per Mile is Diesel (Equiv.) Used * Diesel (Equiv.) Cost/Gal. / Mileage
observed that engine oil consumption exceeds expectations, this is considered a precursor to engine problems. For the data collection at Raley’s, the engine oil consumption for the LNG trucks has been recorded; however, the engine oil consumption for the diesel trucks has not been available. The LNG trucks consumed 0.99 quarts of engine oil per 1,000 miles of operation. Based on discussions with Cummins and Raley’s, an engine oil consumption of one quart per 1,000 miles is good or better than expected for the model studied based on
d past experience with other heavy-duty engines.
Engine oil cost for the LNG engines is more than double the cost for the diesel engines - $1.67 per quart for the LNG engines and $0.81 per quart for the diesel engines. The higher cost for the LNG engine oil is due to the low demand required by a small population of heavy-duty
F- natural gas engines and the special oil specification (low Ash).
Maintenance, Maintenance Costs. and Warrantv
Maintenance data analyses include general maintenance costs by vehicle and total maintenance costs broken down by vehicle system, driver complaints, and warranty data summary. Total maintenance costs by truck group are shown in Table 6. Since the diesel trucks are about one year older than the LNG trucks, back maintenance data on the diesel trucks have been collected to ensure that data from the same engine lifetimes for the trucks are collected.
In order to measure differences in maintenance actions and costs between the diesel and LNG fleets, a similar portion of the vehicle lives has been chosen. As shown in the table, the data analysis only shows maintenance costs from preventive maintenance actions (PMA) 4, 5, and 6 for each fleet. The PMAs have occurred on a quarterly basis and all unscheduled maintenance was collected within the PMA data. PMAs 1, 2, and 3 have been removed because these PMAs occurred before the January 1998 “clean point” of the data for the LNG

Table 6. Maintenance Costs (PMA 4 Through 6) - Raley’s
r)
trucks. The PMA milestones for the two fleets did not occur in the same calendar time frame (diesel - June 96 through February 97; LNG - January 98 through September 98). The labor hour cost for maintenance has been held fixed at $50 per hour and the parts costs have been determined using a current listing of the costs. As a result, the time frame difference should not have a major impact on the cost analysis.
The maintenance cost analysis shows the diesel and LNG vehicles have significantly different costs per mile due to the difference in mileage accumulation. This difference in mileage accumulation does not appear to be related to reliability or lack of confidence in the vehicles. From discussions with Raley’s, the LNG trucks are performing in operation as expected (except for the lower power and torque than the diesel trucks). The routes and usage of the trucks is based on how they intend to use the trucks and for maximizing the mileage of the LNG trucks within the Sacramento Air Basin. The study trucks have been used on similar terrain; however, the diesel control trucks have seen significantly higher mileage because of their longer routes. The use of cost per mile has not been revealing in understanding the overall costs of operation of these two truck fleets; however, cost per mile results are provided for completeness.
As shown in Table 6, for PMA 4 through 6, the LNG trucks have 27 percent lower mileage per truck. The maintenance costs for parts per truck are higher (+51 percent), and the labor hours are also higher for the LNG trucks (+21 percent). The higher labor and parts cost per truck has been caused mostly by the fuel system (leak repair, leak detection system repair, and higher cost of fuel filters), engine repairs for low power complaints, and non-lighting electrical repairs (mostly spark plugs and batteries).
The vehicle system repairs summarized in Table 7 include the engine/fuel-related systems (exhaust, fuel, engine, electrical minus lighting, air intake, and cooling); PMA inspections; cab, body, and accessories systems (cab and sheet metal, accessories such as phones, fifth wheel, and body); frame, steering, and suspension systems; axle, wheel, and drive shaft systems; tires; and the lighting system. For the engine/fuel-related systems, the parts and labor hours per truck are much higher for
the LNG trucks. The low number of labor hours for the diesel trucks shows that labor for these systems for the diesel trucks is covered almost exclusively by the PMA inspection hours. For exhaust repairs, the diesel control -’ truck cost per truck is higher. For the fuel system, the LNG truck cost per truck is much higher than the diesel trucks. These higher costs for the LNG trucks consist of LNG tank problems and leaks, fuel gauge complaints, fuel leak sensors, throttle pedal issues, fuel filter cost ($25 for LNG vs. $7 for diesel), and towing costs. The engine system repairs are nearly double for the LNG trucks. These extra costs are due to the higher cost of the engine oil ($1.67 per quart for LNG vs. $0.81 per quart for diesel) for the LNG trucks and the labor for troubleshooting low power issues for the LNG trucks. The electrical system repair costs also are much higher for the LNG trucks. The higher costs are based on 11 sets of six spark plugs (8 sets for PMA) being replaced . for the LNG trucks at a cost of $164 per set of spark r, plugs. There were no costs for air intake repairs for either study fleet. Cooling system repair costs for the diesel trucks were low and the only costs for the LNG trucks were for additions of coolant.
The inspections category is strictly made up of labor for PMA inspections of the vehicles. On a per truck basis, the costs are essentially the same. This indicates that neither set of trucks is getting more or less PMA inspection time. The cab, body, and accessories systems repairs are essentially the same on a per-truck basis. For the frame, steering, and suspension system repairs, the diesel trucks were slightly higher in per-truck costs. Each fleet had one leveling valve replaced and a few labor hours. The diesel trucks also had a higher per-truck cost for axle, wheel, and drive shaft repairs due to two of the diesel trucks having a front end alignment done at $95 each. The tire costs were a significant contributor to the overall maintenance costs but were close to the same on a per-truck basis for both fleets. The maintenance costs for lighting system repairs were also approximately the same for both fleets on a per- truck basis.
As part of the data collection at Raley’s, driver ,m
complaints were collected for the LNG trucks. Raley’s 1
collects complaints from drivers on a regular basis to track and report maintenance that needs to be performed. For the LNG trucks, the major complaints
6

Table 7. Maintenance Costs by Vehicle System - Raley’s (PMA 4 Through 6)
Mileage Diesel I LNG
170,478 1 330,296
I Total Engine/Fuel-Related Systems (VMRS Codes 30,31,32,33, 41.42.43.44.451 I
Parts Cost ($) 730 6,831 Labor Hours 1.3 51.8 Total Cost ($) 795 9,422 Total Cost ($) per Truck 265 1,178
Parts Cost ($) Labor Hours
I 26 1 0 0.5 I 0.8
Total Cost ($) Total Cost ($) per Truck Total Cost ($) per Mile
Fuel System Repairs (VMRS Code 44) Parts Cost ($) I
51 40 17 5
0.0003 0.0001
80 1 1,453 Labor Hours ! 0.0 1 32.4 Total Cost (!§) Total Cost ($) per Truck Total Cost ($) per Mile I
Engine System Repairs (VMRS CodtY45) Parts Cost ($) I Labor Hours 0.3 Total Cost ($) 612 Total Cost ($) per Truck 204 Total Cost ($) per Mile 0.0036
Electrical System Repairs (VMRS Codes 30-General Electrical, 31-Charging, 3BCranklng, 33-Ignition)
Parts Cost ($) 45 Labor Hours 0.5 Total Cost ($) 70
-I
60 3,073 20 384
0.0004 0.0093
597 1 2,410 8.5
2,835 354
0.0086
2,926 8.8
3,366 Total Cost ($) per Truck I Total Cost ($) per Mile 1
Air Intake System Repairs (VMRS Code 41) Parts Cost ($1 I
23 1 421 0.0004 1 0.0102
Ol 0
I Labor Hours I 0.0 I 0.01
I Total Cost ($) I 01 01 Total Cost ($) per Truck I
Cooling System Repairs (VMRS Code 42) I Parts Cost I$\ I RI A.? 1
Labor Hours 0.0 1.3 Total Cost ($) 3 108 Total Cost ($) per Truck 1 14 Total Cost ($) per Mile o.oooo 0.0003
7

Table 7. Maintenance Costs by Vehicle System - Raley’s (PMA 4 Through 6) (continued)
VMRS - vehicle maintenance reporting system codes from American
included low engine power and rough running; body damage; light replacements or problems; malfunctioning fuel gauges; and CB/Radio/Phone/Antenna problems. Low engine power and rough running had the highest number of complaints, 41 percent. These complaints stem from the difference between the engines which power the LNG trucks and the diesel trucks. The LNG trucks are equipped with an LlO-300G engine, while the diesel trucks use an Ml l-330. The Ml 1 has a higher available torque (1250 lb-ft for the Ml 1 vs. 900 lb-ft for
the natural gas LlO) and, along with the lower horsepower, this performance differential is noticeable to drivers. Also, early in the deployment of the LNG trucks, there were several warranty issues that emerged. Cummins changed wastegate valves, several sensors, spark plugs and wires, and ignition modules on all of the trucks over the period Aof time that these issues were being investigated. Starting in January 1998, Cummins believed that these start up issues were resolved. The
,
8

number of complaints in 1998 for the low engine power issue has decreased dramatically.
nere were no safety incidents reported at Raley’s during the data collection period.
EMISSIONS TEST RESULTS
WVU tested the emissions of the Raley’s LNG and _ diesel control trucks soon after the LNG trucks went into
service (July and August 1997), and then again in early 1998 (February and March 1998). The previously described five-mile route was used for the emissions
Y testing. As shown in Table 8, NO, (LNG 5.16 and 5.23 g/mi; Diesel 31.83 and 19.59 g/mi) and PM (LNG 0.07 and 0.04 g/mi; Diesel 0.84 and 1.22 g/mi) are much lower for the LNG trucks. When comparing non- methane hydrocarbons (NMHC) for the LNG trucks and HC for the diesel control trucks (NMHC for the diesel trucks is essentially the same as HC results, very little methane), the resuits show the LNG trucks have significantly lower results (LNG 0.60 and 0.62 g/mi NMHC; Diesel 1.29 and 1.70 g/mi HC). The LNG trucks have significantly higher CO results and modestly higher CO2 results. The miles per energy equivalent gallon (MPEG) results shown in the table are essentially the
. respect to the difference between the diesel and ergy equivalent results as compared to the in- I economy data (see Table 4). Lower fuel
economy is expected in spark-ignited engines due to throttling losses.
For reference, Table 9 shows the emissions certification standards for the engine model years and actual certification results for the LNG and diesel engines used in this study. The newer Cummins LlO natural gas engine emissions certification testing results also are shown. The numbers in Table 9 do not relate directly to the emissions results from the WVU testing because the test cycles differ. Instead, the results in Table 9 have been compiled from engine certification testing and the results from the WVU testing were performed using a chassis dynamometer.
FACILITY AND CAPITAL COST DESCRIPTIONS
c Refueling for the LNG trucks has been provided by a 5,000 gallon MVE, Inc. Quick Response System (QRS) temporary station located on-site at the Raley’s Distribution Center. A permanent 13,000-gallon LNG refueling station has been completed at the Distribution Center and is estimated to cost about $350,000. With the completion of the permanent refueling station,
‘* Raley’s is now capable of receiving a fully loaded 10,000 gallon tanker truckload of LNG fuel instead of a partial load. The difference in cost for the full load versus the partial load of LNG fuel is $0.10 per gallon (a difference
of $0.575 and $0.475 per gallon). This makes a significant impact on the fuel cost per mile.
For safety reasons, the trucks are stored outside at the Distribution Center. At the maintenance facilities, the LNG trucks have the fuel system shut off prior to maintenance. The LNG trucks are stored outside if the truck is parked at the maintenance facility for more than one work shift. No changes were made to the maintenance facility. The trucks are leased through Ozark Trucking for use by Raley’s. The original purchase price for the diesel trucks was $72,900 and the LNG truck price was $107,000 for a price difference of $35,000 per truck.
PRELIMINARY RESULTS - PIMA GRO
Pima Gro Systems, Inc. is using the Caterpillar/Power Systems Associates (PSA) 31768 electronic Dual-Fuel engine in a line-haul application. This dual-fuel engine uses compressed natural gas (CNG) as its main source of fuel and a small amount of diesel fuel for a pilot charge. The pilot charge is used to ignite the natural gas. The Dual-Fuel natural gas engine technology used in these engines has been developed by Clean Air Partners in San Diego, California [l l-121. The dual-fuel project start-up experience is documented in another report 1131. All eight trucks (5 CNG dual-fuel and 3 diesel control) have been repowered with the new engines and are in operation.
The evaluation of this site has been delayed due to the lack of easy access to fast-fill CNG. The construction of the permanent CNG fast-fill station at the Orange County Sanitation District (OCSD) started operation in February 1999. During the delay in access to CNG, Pima Gro changed the operator of their trucks to Specialty Transportation Services (STS). This change in trucking companies required retraining on operation and maintenance of the Dual-Fuel trucks. During the transition to the new trucking company, some damage occurred to the natural gas fuel systems. In December 1998 and January 1999, repairs to the fuel system and a modification to the restraint system for the CNG fuel tanks were completed for the five Dual-Fuel trucks. The data collection for this site now begins with the usage of CNG in March 1999.
OPERATING DESCRIPTIONS
Vehicle System Descriotions
Table 10 shows a summary of the Dual-Fuel and diesel truck system descriptions with repower and conversion costs. Figure 2 shows the first CNG truck at Pima Gro.
9

Table 8. Summary of Emissions Testing Results - Raley’s
I I
Test Date
I I
Fleet I
Cycle ’ NO, 1
17.51 0.60 0.07 1657 4.39
i 7fd7.
r-rile Route I 7.92 1 5.23 I 21.49 I 0.62 1 0.1
t 7i97 L 5 1 2/98-3/98 1 LNG/Diesel 1 5-Mile Route 1 2 LNG/Diesel data are calculated by the following equation - (LNGIDiesel - 1) * 100 MPEG - miles per energy equivalent diesel gallon
Table 9. Heavy Engine Emissions Certification Standards and Certification Data - Raley’s (grams per brake-horsepower hour)
Standard/ Certification NMHC (HC) CO NOx PM EPA Engine Family Name
1994-l 997 EPA/CARB Truck 1.2 (1.3) 15.5 5.0 0.10 1998 EPAICARB Truck 1.2 (1.3) 15.5 4.0 0.10 Truck Ll O-300G - 1997 With Catalyst 0.5 5.3 2.4 0.03 VCE611 FBCABW Without Catalyst 1.1 11.2 3.5 0.06 VCE611 EBCARW Truck Ll O-300G - 1998 With Catalyst 0.1 4.6 1.6 0.02 WCEXHO611 LAB Without Catalyst 0.8 10.6 2.5 0.07 WCEXHO611 LAC Truck Ml l-330 - 1996 (0.2) 1.4 4.2 0.07 TCE661 EJDASW
Raley’s LNG engines are not equipped with a catalyst, but have the same engine calibration as the 1998 certification without catalyst Raley’s diesel control trucks are model year 1996.
Table 10. Vehicle System Descriptions - Pima Gro
Description Diesel Control Trucks
Chassis Manufacturer/Model White/GMC WG64T, Class 8 Chassis Model Year 1992 Engine Manufacturer/Model Caterpillar 31768 (1996)
CNG Dual-Fuel Trucks White/GMC WG64T, Class 8 1992.1994 Caterpillar 31768 Dual-Fuel (1997)
Engine Ratings Max. Horsepower 350 hp @ 1800 rpm 350 hp @ 1800 rpm Max. Torque 1250 lb-ft @ 1200 rpm 1050 lb-ft Q 1400 rpm
Fuel System Storage Capacity 105 gallons 105 gallons diesel 7813 scf CNG (56 diesel energy
I I equivalent gallons) - 3 Lincoln
Transmission Composites cylinders
Fuller RTXl4708LL, 10 speed Fuller RTX14708LL, 10 speed Manufacturer/Model Catalytic Converter Used (Y/N) No Vehicle Repower and $25,000 ::5,000 Conversion Cost
/ 2
10
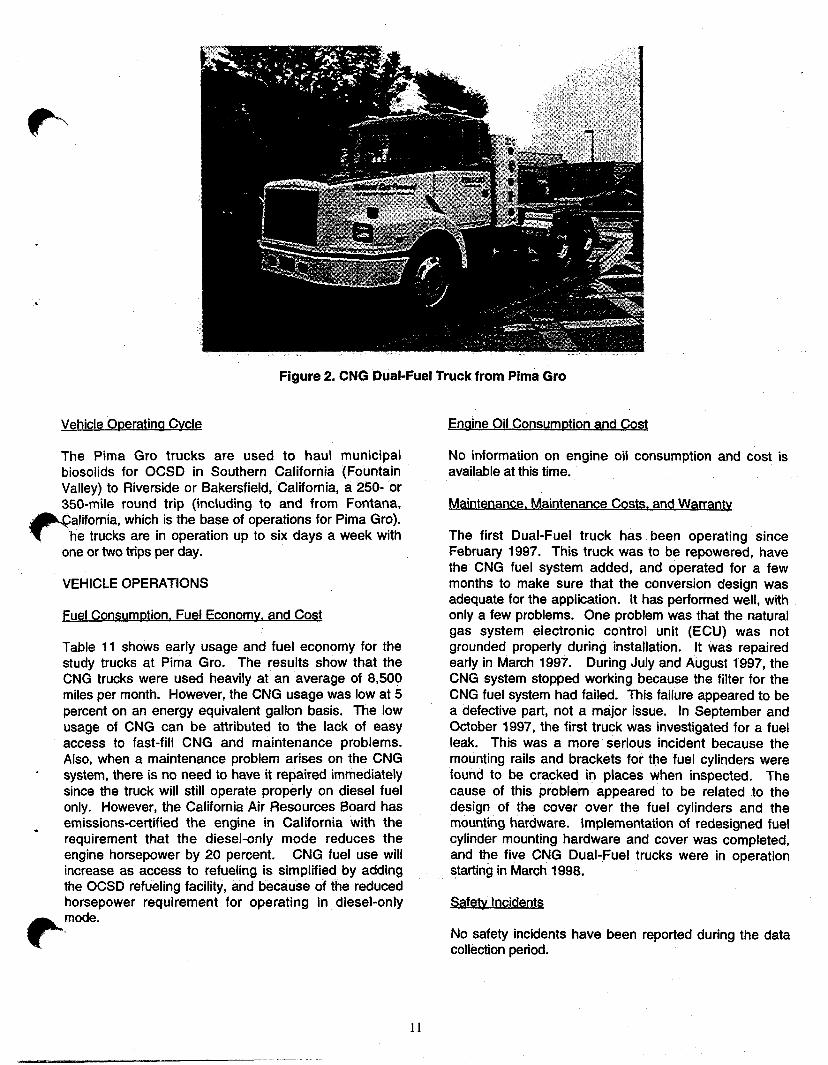
Figure 2. CNG Dual-Fuel Truck from Pima Gro
Vehicle Operating Cvcle
The Pima Gro trucks are used to haul municipal biosolids for OCSD in Southern California (Fountain Valley) to Riverside or Bakersfield, California, a 250- or 350-mile round trip (including to and from Fontana,
omia, which is the base of operations for Pima Gro). trucks are in operation up to six days a week with
one or two trips per day.
VEHICLE OPERATIONS
Fuel Consumotion. Fuel Economv. and Cost
.
Table 11 shows early usage and fuel economy for the study trucks at Pima Gro. The results show that the CNG trucks were used heavily at an average of 8,509 miles per month. However, the CNG usage was low at 5 percent on an energy equivalent gallon basis. The low usage of CNG can be attributed to the lack of easy access to fast-fill CNG and maintenance problems. Also, when a maintenance problem arises on the CNG system, there is no need to have it repaired immediately since the truck will still operate properly on diesel fuel only. However, the California Air Resources Board has emissions-certified the engine in California with the requirement that the diesel-only mode reduces the engine horsepower by 20 percent. CNG fuel use will increase as access to refueling is simplified by adding the OCSD refueling facility, and because of the reduced horsepower requirement for operating in diesel-only mode. I_
Engine Oil Consumotion and Cost
No information on engine oil consumption and cost is available at this time.
Maintenance. Maintenance Costs. and Warranty
The first Dual-Fuel truck has been operating since February 1997. This truck was to be repowered, have the CNG fuel system added, and operated for a few months to make sure that the conversion design was adequate for the application. It has performed well, with only a few problems. One problem was that the natural gas system electronic control unit (ECU) was not grounded properly during installation. It was repaired early in March 1997. During July and August 1997, the CNG system stopped working because the filter for the CNG fuel system had failed. This failure appeared to be a defective part, not a major issue. In September and October 1997, the first truck was investigated for a fuel leak. This was a more serious incident because the mounting rails and brackets for the fuel cylinders were found to be cracked in places when inspected. The cause of this problem appeared to be related to the design of the cover over the fuel cylinders and the mounting hardware. Implementation of redesigned fuel cylinder mounting hardware and cover was completed, and the five CNG Dual-Fuel trucks were in operation starting in March 1998.
Safetv Incidents
No safety incidents have been reported during the data collection period.
11

Table 11. Early Vehicle Usage and Fuel Economy Results - Pima Gro
EMISSIONS TEST RESULTS
Emissions testing was performed by WVU during June, July, and August 1998. Table 12 shows the results of the emissions testing, which was conducted on the five- mile route test. Because the CNG trucks are dual-fuel, the emissions testing was performed in the diesel only (100 percent power) and in the CNG/diesel dual-fuel modes. The Dual-Fuel trucks operating in diesel-only mode show slightly lower emissions (except COP) than the diesel trucks. The dual-fuel trucks operating in Dual- Fuel mode show 15 percent lower NO, and 25 percent lower PM than the diesel control study trucks. The results for CO for the dual-fuel trucks operating in Dual- Fuel mode are 4 times higher and CO, results are 16 percent lower than the diesel control study trucks. In comparing HC for diesel to NMHC for the Dual-Fuel trucks, the Dual-Fuel truck results are nearly 1.5 times higher than results for the diesel trucks. However, the Dual-Fuel trucks are still lower on a combined (NOx + NMHC) factor. The miles per gallon (MPG) results showed a 22 percent lower energy equivalent fuel
economy for the Dual-Fuel trucks when compared with the diesel trucks. For reference, Table 13 shows the emissions certification standards for the model years and actual certification results for the dual-fuel and diesel engines used in this study.
FACILITY AND CAPITAL COST DESCRIPTIONS
Refueling for this project has been provided by a Southern California Gas Company public, fast-fill CNG station in Glendale, California. The permanent station was completed in November 1998 with operation starting at the end of February 1999. The station is located at OCSD so that Pima Gro can have the truck loaded and then tarp the trailer while having the truck fueled. Public access to the fast-fill station at OCSD is planned. Because of a delay in procuring a compressor for the OCSD CNG station, opening of the station was significantly delayed. Estimated cost of the new fast-fill station is $1.4 million.
Table 12. Emissions Testing Results June Through August 1998 - Pima Gro (grams/mile)
Fleet Fuel CO NO, 1 HC NMHC 1 PM CO1 MPG Diesel D2 4.53 13.1 0.79 0.60 1770 5.72 Dual-Fuel D2 1 4.48 12.3 0.65 0.52 1788 5.68 Dual-Fuel CNG/D2 j 19.4 11.2 56.2 1.14 0.45 1483 4.46
Table 13. Heavy Engine Emissions Certification Standards and Certification Data - Pima Gro (grams per brake-horsepower hour) *
Standard/ Non-Methane (Total) Carbon Nitrogen Particulate
Certification Hydrocarbons Monoxide Oxides Matter Engine Family
NMHC (HC) co NOx PM Name
1994-l 997 EPA/CARB 1.2 (1.3) 15.5 5.0 0.10 Truck Truck 3176B Dual-Fuel 1.1 8.2 2.4 0.07 VPS629EZJ6RK - 1997* Truck 3176B - 1996** (0.1) 1.3 4.2 0.06 TCP629EZDARK
l Pima Gro’s CNG Duel-Fuel engines are not equipped with a catalyst tt Pima Gro’s diesel control trucks have model year 1996 engines
12

PRELIMINARY RESULTS - WASTE MANAGEMENT Enaine Oil Consumotion and Coa
This site is located in Washington, Pennsylvania and has hanged names several times (previously named USA Jaste, William H. Martin, and Chambers Development).
Waste Management agreed to purchase seven Mack refuse haulers operating on LNG. The first four trucks have been delivered and are in operation, The next two LNG trucks have just been delivered and started operation in March 1999. The last of the seven LNG trucks is planned to be delivered in late summer 1999. Three comparable Mack refuse trucks have been chosen for diesel control vehicles.
OPERATING DESCRIPTIONS *
Vehicle System Descriptions
Table 14 shows a summary of the LNG and diesel truck system descriptions. Figure 3 shows the first LNG truck at Waste Management.
Vehicle Operatina Cycle
The LNG and diesel trucks are used in residential refuse pickup 5 to 6 days per week, one route per day. Each truck collects refuse on the route and then travels to the dump for unloading. During peak times of the year, a
ck may be required to go to the dump more than once a given day.
VEHICLE OPERATIONS
Fuel Consumotion. Fuel Economy. and Cost
Table 15 shows early results for vehicle usage and fuel economy through mid-October 1998. The LNG .tiucks have 25 percent lower monthly mileage per truck. For refuse trucks, the route and usage is very severe. Operation includes idling, compaction, and dumping, and usage is many times measured in engine hours rather than mileage. Engine hours for the study trucks are not available at this time. The 25 percent lower mileage for the LNG trucks may show that they are used in more
. severe service than the diesel trucks, with higher engine hours and lower mileage. More investigation is planned.
The fuel economy for the LNG trucks is 17 percent lower L on an energy equivalent basis. When considering that this comparison involves vehicles with different ignition systems (spark-ignition versus compression-ignition) and a severe duty cycle, the 17 percent lower fuel economy is better than expected based on the experience of other heavy-duty natural gas engines.
Engine oil consumption for the diesel trucks is about 1 quart per 1,000 miles and the LNG trucks is about 1.2 quarts per 1,000 miles. The LNG trucks have a slightly higher engine oil consumption due to the difference in the engine cycle. For a spark-ignition engine with the engine operating at light loads, the engine is throttled to maintain the proper air/fuel ratio. The throttle causes a vacuum in the intake manifold and the engine cylinders. This vacuum increases the amount of oil to be sucked up past the rings (these are not diesel rings, but they do allow some oil to get past). Since a refuse truck spends a lot of time at idle or light load, slightly more oil consumption should be expected when comparing an LNG truck with a diesel truck.
Maintenance. Maintenance Costs. and Warranty
Data analyses for maintenance costs and warranty are not yet available for this site.
Safetv Incidents
No safety incidents have been reported during the data collection period.
EMISSIONS TEST RESULTS
Emissions testing by WVU is planned during the Summer of 1999.
FACILITY AND CAPITAL COST DESCRIPTIONS
The LNG refueling station has a capacity of 13,000 gallons-of LNG. Thjs refuejing station is unique in that ,. . ,.._/ the storage tank is underground. The LNG station cost was approximately $500,000. No changes have been made to the maintenance facility for the LNG trucks. The LNG trucks are stored outside. When an LNG truck is brought in for service, the LNG tanks are turned off. If service requires more than a work shift, the truck is stored outside until work resumes the next day. The LNG refuse trucks cost approximately $40,000 more than the comparable diesel truck.
PRELIMINARY RESULTS - Ut+JJJEP PARCEL SERVICE’ ..” -.- -
United Parcel Service put 100 CNG vehicles into package delivery service in mid-1997. For this project, ten of the CNG trucks and three diesel trucks will be monitored in Connecticut (Hartford and Waterbury). The CNG and diesel trucks are made by Freightliner Custom Chassis and are powered by Cummins .B5.9 engines. Data collection will include operations from mid-1997 through March-April 1999. Emissions testing is planned for May-June 1999. No data analyses for this site are available.
13

Table 14. Vehicle System Descriptions -Waste Management
Description Diesel Control Trucks LNG Trucks Chassis Manufacturer/Model Mack MR Refuse Mack MR Refuse Chassis Model Year 1997 1997 Engine Manufacturer/Model Mack E7 - 300 Mack E7G - 325 Engine Ratings
Max. Horsepower 300 hp 6% 1950 rpm 325 hp @ 1950 rpm Max. Torque 1080 lb-ft @ 1200 rpm 1180 lb-ft Q 1250 rpm
Fuel System Storage Capacity 72 gallons 130 LNG gallons usable (78 diesel energy equivalent gallons) 0 - 2 LNG tanks from MVE, Inc.
Transmission Allison Hl740RS, 4 speed Allison HT740RS 4 speed Manufacturer/Model automatic automatic 1 Catalytic Converter Used No No (Y/N) Vehicle Cost in Comparison to - +qi40,000 Diesel
Table 15. Vehicle Usage and Fuel Economy Results -Waste Management
Data Period of Operation Months of Operation Total Mileage Average Monthly Mileage Per Truck Average Fuel Economy (miles per energy equivalent gallon)
Diesel LNG 8197-l O/98 8197-l 0198
15 15 94,284 53,382
2,100 1,570
2.9 2.4
Figure 3. LNG Refuse Truck from Waste Management
14

SUMMARY REFERENCES
Results from the Raley’s site are nearly complete. The combination of the fuel economy and the fuel cost for
f” ‘.NG has made the fuel costs high compared to diesel ruel. The maintenance costs for the LNG trucks have been high but are consistent with the diesel trucks except for the fuel system, engine, and non-lighting electrical systems. The emissions testing has shown significant reductions in emissions of NOx and PM.
1.
2.
3.
a The Pima Gro site is just commencing with use of CNG on a regular basis. The United Parcel Service site data collection is also just under way, results will come quickly based on the year and a half of experience in
* operations.
4.
5.
6. Results from the Waste Management LNG trucks are promising in regards to the fuel economy of the spark- ignited engines. The LNG trucks are utilized in severe service (neighborhood refuse collection). The fuel economy for the LNG trucks is only 17 percent lower on an energy equivalent basis.
ACKNOWLEDGMENTS
7.
8.
9.
Project Guidelines, Alternative Fuel Truck Evaluation Project, Battelle, Columbus, Ohio, 1998. Chandler, K., Malcosky, N., Motta, R., Norton, P., Kelly, K., Schumacher, L., Lyons, D., Alternative Fuel Transit Bus Evaluation Program Results, 961082, SAE International, Warrendale, PA, 1996.
Motta, R., Chandler, K., Schumacher, L., Clark, N., Alternative Fuel Transit Buses, Final Results from the National Renewable Energy Laboratory (NREL) Vehicle Evaluation Program, National Renewable Energy Laboratory, Golden, Colorado, 1996, NRELITP-42520513 Chandler, K., Malcosky, N., Motta, R., Kelly, K., Norton, P., Shumacher, L., Final Alternative Fuel Transit Bus Evaluation Resutts, Battelle, Columbus, Ohio, 1996. Chandler, K., Norton, P., Clark, N., Atternative Fuel Truck Evaluation Project - Design and Preliminary Results, 981392, SAE International, Warrendale, PA, 1998. Clark, N., Lyons, D., Rapp, B., Gautam, M., Wang, W., Norton, P., White, C., Chandler, K., Emissions from Trucks and Buses Powered by Cummins L-10 Natural Gas Engines, 981393, SAE International, Warrendale, PA, 1998. Telephone conversation with Kenworth in Seattle, Washington, July 1997. Correspondence with Cummins Engine Company in Columbus, Indiana, October 1996. Battelle, Raley’s LNG Truck Fleet, Start-Up Experience, National Renewable Energy Laboratory, Golden, CO, 1997, NREUBR-540-23402.
The authors acknowledge the support of the partners and staff involved with each site participating in this
reject. Also, the support from and information xchange with Cummins Engine Company, Power
systems Associates, Mack Trucks, and MVE, Inc. is greatly appreciated.
10. Clark, N., Messer, D., McKain, D., Wang, W., Bata, R., Gautam, M., Lyons, D., Use of the West Virginia University Truck Test Cycle to Evaluate Emissions from Class 8 Trucks, 951016, SAE International, Warrendale, PA, 1995.
11. Gebert, K., Beck, J., Barkhimer, R., Wong, H., Wells, A., Development of Pilot Fuel Injection System for CNG Engine, 961100. SAE International, Warrendale, PA, 1996.
12. Gebert, K., Beck, J., Barkhimer, R., Wong, H., Strategies to Improve Combustion and Emission Characteristics of Dual-Fuel Pilot-Ignited Natural Gas Engines, 971712, SAE International, Warrendale, PA, 1997.
13. Battelle, Dual-Fuel Truck Fleet, Start-Up Experience, National Renewable Energy Laboratory, Golden, CO, 1998, NREUBR-640-25118.
15