Interim Results for Year Ending March 31, 2008 · Interim Results for Year Ending March 31, 2008...
37
―1― Interim Results for Year Ending March 31, 2008 November 9, 2007 Name TOLI Corporation Stock Exchange Tokyo Securities Exchange and Osaka Securities Exchange; First Section Code number 7971 URL http://www.toli.co.jp Representative of Company (Position) President and Representative Director (Name) Kenji Kashihara Official responsible for any inquiry (Position) General Manager of Accounting and Finance Department (Name) Jun Suzuki TEL: (06)6494-1534 Planned date for submission of interim report December 12, 2007 (Amounts of less than 1 million yen are rounded off) 1. Consolidated performance for year ended September 2007 (April 1, 2007 - September 30, 2007) (1) Consolidated results (% shows change from previous interim term.) Net sales Operating income Ordinary income Interim net income million yen % million yen % million yen % million yen % Interim term ended September 30, 2007 45,674 (0.7) (219) - (312) - (276) - Interim term ended September 30, 2006 45,988 2.7 173 (82.5) 243 (68.2) 56 (89.6) Year ended March 2007 100,936 - 2,200 - 2,128 - 1,619 - Interim net income per share Interim net income per share after residual securities adjustment yen yen Interim term ended September 30, 2007 (4.35) - Interim term ended September 30, 2006 0.88 - Year ended March 2007 25.44 - (For reference) investment gain or loss under equity method Interim term ended September 30, 2007 (4 million yen) Interim term ended September 30, 2006 57 million yen Year ended March 2007 29 million yen (2) Consolidated assets Total assets Net assets Capital-to-asset ratio Net asset per share million yen million yen % yen Interim term ended September 30, 2007 69,318 26,258 37.5 405.49 Interim term ended September 30, 2006 73,222 26,108 35.4 405.69 Year ended March 2007 78,034 27,340 34.8 428.12 (For reference) Shareholders’ equity Interim term ended September 30, 2007 26,026 million yen Interim term ended September 30, 2006 —million yen Year ended March 2007 27,131 million yen (3) State of consolidated cash flows Cash flows from operating activities Cash flows from investing activities Cash flows from financing activities Term-end balance of cash and cash equivalents million yen million yen million yen million yen Interim term ended September 30, 2007 1,383 (513) (866) 4,404 Interim term ended September 30, 2006 480 (219) (768) 4,555 Year ended March 2007 1,501 (784) (1,382) 4,398 2. Dividend payments Dividend per share (Date of record) End of midterm End of year For the year yen yen yen Year ended March 2007 - 7.00 7.00 Year ending March 2008 (results) - - Year ending March 2008 (projection) - 7.00 7.00 3. Consolidated forecasts for year ending March 2008 (April 1, 2007 - March 31, 2008) (% shows change from previous term.) Net sales Operating income Ordinary income Net income Net income per share million yen % million yen % million yen % million yen % yen Full-year results 100,000 (0.9) 1,700 (22.8) 1,550 (27.2) 800 (50.6) 12.46
-
Upload
phungtuyen -
Category
Documents
-
view
213 -
download
0
Transcript of Interim Results for Year Ending March 31, 2008 · Interim Results for Year Ending March 31, 2008...

―1―
Interim Results for Year Ending March 31, 2008
November 9, 2007
Name TOLI Corporation Stock Exchange Tokyo Securities Exchange and Osaka Securities Exchange; First Section
Code number 7971 URL http://www.toli.co.jp Representative of Company (Position) President and Representative Director (Name) Kenji Kashihara Official responsible for any inquiry (Position) General Manager of Accounting and
Finance Department (Name) Jun Suzuki TEL: (06)6494-1534 Planned date for submission of interim report December 12, 2007 (Amounts of less than 1 million yen are rounded off)1. Consolidated performance for year ended September 2007 (April 1, 2007 - September 30, 2007)
(1) Consolidated results (% shows change from previous interim term.) Net sales Operating income Ordinary income Interim net income
million yen % million yen % million yen % million yen % Interim term ended September 30, 2007 45,674 (0.7) (219) - (312) - (276) - Interim term ended September 30, 2006 45,988 2.7 173 (82.5) 243 (68.2) 56 (89.6)
Year ended March 2007 100,936 - 2,200 - 2,128 - 1,619 -
Interim net income per share
Interim net income per share after residual
securities adjustment yen yen
Interim term ended September 30, 2007 (4.35) - Interim term ended September 30, 2006 0.88 -
Year ended March 2007 25.44 - (For reference) investment gain or loss
under equity method Interim term ended
September 30, 2007(4 million yen) Interim term ended
September 30, 2006 57 million yenYear ended March 2007 29 million yen
(2) Consolidated assets
Total assets Net assets Capital-to-asset ratio Net asset per share million yen million yen % yen
Interim term ended September 30, 2007 69,318 26,258 37.5 405.49 Interim term ended September 30, 2006 73,222 26,108 35.4 405.69
Year ended March 2007 78,034 27,340 34.8 428.12 (For reference) Shareholders’ equity Interim term ended
September 30, 2007 26,026 million yen Interim term ended
September 30, 2006 —million yen Year ended March 2007 27,131 million yen
(3) State of consolidated cash flows
Cash flows from operating activities
Cash flows from investing activities
Cash flows from financing activities
Term-end balance of cash and cash equivalents
million yen million yen million yen million yen Interim term ended September 30, 2007 1,383 (513) (866) 4,404 Interim term ended September 30, 2006 480 (219) (768) 4,555
Year ended March 2007 1,501 (784) (1,382) 4,398 2. Dividend payments
Dividend per share
(Date of record) End of midterm End of year For the year
yen yen yen Year ended March 2007 - 7.00 7.00 Year ending March 2008
(results) - - Year ending March 2008
(projection) - 7.00 7.00
3. Consolidated forecasts for year ending March 2008 (April 1, 2007 - March 31, 2008) (% shows change from previous term.)
Net sales Operating income Ordinary income Net income Net income per share million yen % million yen % million yen % million yen % yen
Full-year results 100,000 (0.9) 1,700 (22.8) 1,550 (27.2) 800 (50.6) 12.46

―2―
4 Other matters (1) Significant changes to subsidiaries during the current term (changes for a specified subsidiary accompanying
a change in the scope of consolidation): None (2) Change in accounting principles, procedures, or statement methods, etc. pertaining to the presentation of
consolidated interim financial statements (matters reported under the heading of “Changes to the basis of presenting consolidated interim financial statements”)
1) Changes accompanying revision to accounting standards, etc.: Yes 2) Changes other than 1) above: None
Note: For more details, please refer to “Changes to the basis of presenting consolidated interm financial statements” on page 20.
(3) Number of shares outstanding (Ordinary stock) 1) Number of shares outstanding at end of year (including treasury stock)
Interim term ended September 2007
66,829,249 shares
Interim term ended September 2006
66,829,249 shares
Year ended March 2007
66,829,249 shares
2) Number of treasury stock at end of year
Interim term ended September 2007
2,644,015 shares
Interim term ended September 2006
2,957,976 shares
Year ended March 2007
3,454,779 shares
Note: For the number of shares that forms the basis of calculation for net income per share (consolidated), please refer to the “Per share data” stated on page 28.
(For reference) Outline of Company-specific business performance 1. Company-specific business performance for interim term ended September 2007 (April 1, 2007 – September 30,
2007) (1) Company-specific management performance (% shows change from previous term.)
Net sales Operating income Ordinary income Interim net income million yen % million yen % million yen % million yen %
Interim term ended September 30, 2007 27,498 2.4 (242) - (210) - (105) - Interim term ended September 30, 2006 26,849 3.2 5 (99.3) 151 (82.3) 158 (75.0)
Year ended March 2007 58,905 - 1,203 - 1,214 - 801 -
Interim net income per share yen
Interim term ended September 30, 2007 (1.67) Interim term ended September 30, 2006 2.48
Year ended March 2007 12.58
(2) Company-specific financial state Total assets Net assets Capital-to-asset ratio Net asset per share
million yen million yen % yen Interim term ended September 30, 2007 58,015 22,091 38.1 344.18 Interim term ended September 30, 2006 59,130 22,650 38.3 354.63
Year ended March 2007 63,450 22,974 36.2 362.52 (For reference) Shareholders’ equity Interim term ended
September 30, 2007 22,091 million yen Interim term ended
September 30, 2006 —million yen Year ended March 2007 22,974 million yen
2. Company-specific business performance projection for year ending March 2008 (April 1, 2007 - March 31, 2008) (% shows change from previous term.)
Net sales Operating income Ordinary income Net income Net income per share
million yen % million yen % million yen % million yen % yen Full-year results 60,000 1.9 900 (25.2) 800 (34.1) 350 (56.3) 5.45
* Explanations pertaining to adequate use of business performance projections and other special instructions
The performance projections were established based on the information available as of the time of writing, and actual business performance figures may differ from the projections due to various factors. For matters pertaining to the business performance projections, please refer to “Outlook for the current term” on page 4.

―3―
1 Management performance (1) Discussion and analysis of the management performance
(Unit: million yen)
Item Net sales Ordinary income or ordinary loss
Interim net income or interin net loss
Current interim term results 45,674 (312) (276) Previous interim term results 45,988 243 56
Change (314) (556) (333)(Compared with previous
interim term) ((0.7%)) (-) (-)
The Japanese economy sustained gradual growth during the interim term under review, driven by a strong
corporate performance, with sustained capital spending expansion in the private sector, encouraging improvements in employment and income situations. However, the interior decoration industry found itself in a tough operating environment, given factors such as the negative impact on construction starts of a decrease in construction confirmation applications and a screening delay that accompanied enforcement of the revised Building Standards Law, the rising cost of materials caused by high crude oil prices, and a shift in demand towards inexpensive products. In this environment, the TOLI Group took steps to bolster earnings capabilities in business operations and to enhance corporate value through measures aimed at achieving priority targets in “GROW UP 2008,” its medium-term business plan.
As a result, interim net sales came to 45,674 million yen (a 0.7% decrease from the previous interim term). In income, we sought to raise our profitability with actions such as comprehensive rationalization of the manufacturing processes and a Group-wide review of operational organizations. However, increased materials procurement costs, caused by the long-term appreciation of crude oil prices, had a considerable impact on our income. Consequently, the Group posted an ordinary loss of 312 million yen (compared with an ordinary income of 243 million yen in the previous interim term), and an interim net loss of 276 million yen (compared with an interim net income of 56 million yen in the previous interim term).
Shown below is the business performance according to segment for each business area. (Unit: million yen)
Net sales Operating income or loss Current interim
term Previous
interim term Change Current interim term
Previous interim term Change
Vinyl chloride-based products business 14,718 15,328 (610) 675 1,124 (448) Textile products
business 14,639 14,247 391 (133) (249) 115
Other businesses 16,316 16,412 (96) 25 85 (59) Total 45,674 45,988 (314) 567 959 (392)
Elimination - - - (786) (785) (0) Total 45,674 45,988 (314) (219) 173 (393)
Vinyl chloride-based products business
Among our vinyl chloride-based products, the Looselay series of vinyl floor tiles achieved strong results. These stylish tiles offering high workability and functionality were used to create a broad choice of space in facilities, including chic and quiet offices, simple and modern educational facilities, and medical and welfare facilities with a touch of warmth. In August 2007, we improved or discontinued five types of print tiles in our TERA and MER series in an attempt to present modern and distinct space featuring new and abstract designs that incorporate European furniture trends. Among them, TERA WOOD, a wood-tone pint tile, proved particularly popular for a broad range of applications, including commercial facilities and housing. Meanwhile, business results declined substantially for composition tiles, due to the diversification of flooring materials adopted for medium and large retail properties.
As a result of the developments stated above, net sales for the vinyl chloride-based products business decreased 4.0% from the previous interim term, to 14,718 million yen. Operating income for the business totaled 675 million yen (compared with 1,124 million yen for the previous interim term).

―4―
Textile products business
Net sales for the carpet business surpassed the level of the previous interim term, thanks primarily to robust sales of tiled carpets for new and refurbished offices in areas centering on large cities. The VARY series we brought to market in October 2006 also made a good start, winning a reputation with its expressive designs and sizes in compliance with new specifications. DIA・CARPET CO., LTD., a consolidated subsidiary we established in the previous fiscal year, increased revenue and made an additional contribution. As a result, net sales for the business increased from the previous interim term.
For the curtain business, we put on sale the elure 2007-2009 line of washable curtains offering diverse functions, including flameproof and light shielding, in July 2007, under a marketing concept of pleasant and comfortable living. However, market conditions remained tough, given the effects of user preferences for inexpensive products and further diversification of distribution channels. Net sales for the curtain business fell below the level of the previous interim term.
As a result of the developments stated above, net sales for the textile products business rose 2.8% from the previous interim term to 14,639 million yen. Operating loss for the business came to 133 million yen (compared with 249 million yen for the previous interim term).
Other businesses
The Ecological wallpaper series, consisting of products offering deodorant, moisture absorption and release, and other high functions such as bamboo charcoal and kenaf wallpapers and earth wallpapers, and of other products taking advantage of natural materials such as sisal hemp and sazanami Japanese paper, led sales of wallpaper material products. VS ’06-’08, a series of vinyl wallpapers introduced to the market in June 2006, also achieved favorable results by satisfying construction and reform demands in the condominium market. In the markets for stores, offices and welfare facilities, the Real Deco series of wood-tone dressing materials, offering calmness and elegance, achieved volumes and amounts surpassing the previous interim term with their extensive merchandise lineup.
However, net sales for other businesses declined 0.6% from the previous interim term to 16,316 million yen, under the effects of decreased sales of adhesives for flooring materials and smaller sales to subsidiaries in charge of sales. Operating income for other businesses totaled 25 million yen (compared with 85 million yen for the previous interim term).
(Outlook for the current term)
Turning to consider the business outlook, economic trends in the United State and the potential for rising interest rates are causes of concern. However, factors, including aggressive capital investments based on firm corporate performance and consumer spending improvement, appear to sustain moderate growth of the Japanese economy. Sources of concerns in the interior decoration industry include materials costs stuck at high levels, their rise again, and a temporary decrease in building materials demands due to enforcement of the revised Building Standards Law. In this environment, the Company plans to steadily implement action plans based on the three key strategic themes set out in the Company’s medium-term business plan, GROW UP 2008. By improving our sales capability, development capability and organizational power through these efforts, the Group will strive to bolster its earning capacity.
Based on the above outlook, for the current term, we expect consolidated net sales of 100,000 million yen, consolidated operating income of 1,700 million yen, consolidated ordinary income of 1,550 million yen, and consolidated net income of 800 million yen.

―5―
(2) Discussion and analysis of the financial situation (Unit: million yen)
Item Current interim term Previous interim term Change Cash flows from operating activities 1,383 480 902 Cash flows from investing activities (513) (219) (293) Cash flows from financing activities (866) (768) (98) Increase in cash and cash equivalents 3 (507) 510 Term-end balance of cash and cash
equivalents 4,404 4,555 (150)
Cash generated by operating activities in the current interim term stood at 1,383 million yen (compared with
480 million yen for the previous interim term). Notwithstanding a decrease in interim net income before corporation tax, lower corporation tax payments produced a greater cash inflow.
Cash used in investing activities was 513 million yen (compared with cash used of 219 million yen for the previous interim term). The cash outflow was higher than the previous interim term because of an increase in expenditure for the acquisition of investment securities and a decrease in proceeds from the sale of such securities.
Cash used for financing activities stood at 866 million yen (compared with cash used of 768 million yen for the previous interim term). Despite reduced repayments for long-term borrowings, the outflow increased on larger disbursements for repaying short-term debts.
As a result, the consolidated balance of cash and cash equivalents at the end of the interim term under review decreased by 150 million yen, to 4,404 million yen (compared with 4,555 million yen at the end of the previous interim term).
Cash flow indexes for the Group are shown below.
Year ended March 2005
Year ended March 2006
Year ended March 2007
Interim term ended September 2007
Capital-to-asset ratio (%) 32.0 35.1 34.8 37.5 Capital-to-asset ratio on market value basis (%) 26.9 36.0 27.7 26.2 Number of years for debt repayment (year) 4.2 4.1 8.4 -
Interest coverage ratio 14.3 16.6 8.8 14.6
Note: Capital-to-asset ratio: Shareholders’ equity / Total assets Capital-to-asset ratio on market value basis: Market capitalization for stock / Total assets Number of years for debt repayment: Interest bearing debt / Cash flows from operating activities (Not stated for the interim term) Interest coverage ratio: Cash flows from operating activities / Interest payment
1. Each of the indexes above was calculated based on the financial data on a consolidated basis. 2. Market capitalization for stock was calculated as follows: Term-end closing price for shares (closing price for
shares at the end of the interim term) x Term-end number of shares outstanding (number of shares outstanding at the end of the interim term) (after deduction for treasury stock).
3. For cash flows from operating activities, data for cash flows from operating activities as stated in consolidated statements of cash flows (consolidated interim statements of cash flows) was used. Interest-bearing debt include all types of debts with interest payment among the debts stated in consolidated balance sheets (consolidated interim balance sheets). For interest payments, data for interest paid as shown in consolidated statements of cash flows (consolidated interim statements of cash flows) was used.
(3) Basic policy regarding dividend payment, and dividend payments for the current term
TOLI understands that returning profits to our shareholders is an important mission for the Company, and its basic policy is to continue paying dividends using a stable approach. To do so, we must bolster our management and stabilize it on a long-term basis. We decide on dividend amounts and frequency by taking into consideration our overall management environment from medium- and long-term perspectives, in addition to our financial situation in each fiscal term. General meetings of shareholders and the Board of Directors are our decision-making bodies for term-end dividends and interim dividends, respectively. For the fiscal year under review, we plan to pay a term-end dividend of ¥7 per share. With respect to retained earnings, we

―6―
assume their use for capital investment and financial structure reinforcement.

―7―
2 The TOLI Group No important change took place in the contents of operations performed by the TOLI Group (the Company and
its affiliates) in the consolidated interim accounting term under review.
The following changes were made to Group companies during the current interim term.
1. GRACE CARPET LIMITED, formerly an equity method affiliate, changed its status to a consolidated subsidiary in the current interim period in accordance with its increased importance.
2. The liquidation process for Otsuka TOLI Carpet, a subsidiary in the textile products business that manufactured and processed carpets, was completed in August 2007, and the company was excluded from the scope of consolidation.
3 Management policy
(1) Basic management policy
The TOLI Group operates based on the following three management principles: “We will contribute to improving lifestyles and culture through our interior decoration business;” “Customer-first thinking is our code of conduct;” and “We seek to become the leader in the total interior business.” With “Everything is for the customer” as our action guideline, we aim to provide products and services that can bring quality to every kind of residential, commercial and other space that people encounter in their daily lives, including houses and residential buildings, office buildings, schools, medical and welfare facilities and commercial facilities. Through these activities, we seek to continually raise our corporate value. We will strictly observe all laws and ordinances, and we will always conduct ourselves as a good corporate citizen, fulfilling our responsibility toward society, for example by preserving the global environment. Our goal is to be a corporate group that society will trust, with great expectations.
(2) The Company’s medium-term business management strategy
The TOLI Group is currently in the process of implementing GROW UP 2008, a medium-term business plan that covers the fiscal years from 2006 until 2008. Under this plan, the Group aims to bolster operational profitability and improve asset efficiency to achieve its medium- and long-term management targets. To reach our goal of sustained, high growth for the Group, all companies will work as one to execute each of the necessary tasks, guided by the following three key strategic themes:
1) Bolstering sales capability: We will clearly allocate specific roles to the Company and the sales companies in the Group, carrying out
action programs based on the sales strategies for each of the categorized areas. Through these activities, we will strive to not only reinforce our profit base on the contract market, a traditional area of strength for the Group, but also to maximize the Group’s sales strength in the small-lot order market, by further drawing on our unique characteristics.
2) Improve frontline capabilities for technological development: TOLI plans to focus its management resources on the development of new technologies in the vinyl
chloride-based products business and the tiled carpet business, both core businesses for the Company, to develop next-generation products and products with a high value-added component that distinguishes them from other products. The Company will also step up cross-organizational collaborative activities among its different business areas, including sheet flooring, carpets, curtains, and wallpaper materials, capitalizing on its strengths as a comprehensive interior decoration manufacturer. A major aim of this initiative is to reinforce its strategic marketing functions.
3) Raise group-wide business management efficiency: To establish powerful and resilient management characteristics, the Group will take steps to reinforce and
bolster the efficiency of indirect departments across the Group; enhancing the competitiveness of the carpet business; reorganizing the curtain business; and establishing new logistics strategies, among other measures. By pursuing individual financial strategies based on the mid-term business target, the Group aims to achieve and maintain optimum structures and conditions on a Group-wide basis, and to increased the speed of the decision-making processes based on the most timely and useful information. We will strive to raise the Company’s earning capacity through these measures.
To effectively execute the key strategies described above, the Company will aim to reinforce the organizational basis of business management, from the perspectives focusing on the system for fostering and developing talent, better information-handling and planning capability, and the corporate governance structure.

―8―
(3) Challenges that the Company should address
TOLI has adopted GROW UP 2008, its medium-term business plan, and has been taking steps to achieve its key strategic goals. As a comprehensive interior decoration manufacturer and an industry leader, the Group is well aware of its mission in society and its responsibilities. We will strive to offer a rich lineup of products to satisfy wide-ranging needs, and we will actively implement sales promotion measures, so that we can make useful suggestions on more pleasant and enjoyable lifestyles to customers. By steadily executing the medium-term business plan, we aim to overcome the challenges that stem from uncertainties in the business environment, which include the rising costs of key materials resulting from high crude oil prices, and intensifying competition. We believe that a significant challenge for us is to bolster the foundations of our business to establish more powerful and resilient structures, and to accelerate the pace of growth. In a specific step, in December 2006, the Company took over the carpet business of Mitsubishi Rayon Carpet Co., Ltd. (currently MCP Corporation), and brought a manufacturing base in Yoro-gun, Gifu Prefecture (MRM Gifu Company, Limited) under the Group management. The Company also established a joint venture sales company (DIA・CARPET CO., LTD.; Head office in Minato-ku, Tokyo) with Mitsubishi Rayon Co., Ltd., and this new venture began operation. We seek to develop attractive products by blending the expertise and technologies possessed by each of the joint partners. We will also establish an efficient production structure that draws on economies of scale, and will increase sales by bolster our ability to supply products as quickly as possible, enhancing the earning power of the operations.
The Group is also stepping up efforts to develop an “internal control system relating to financial information” that conforms to the Financial Instruments Exchange Law, scheduled to be introduced in April 2008. With these initiatives, the Group aims to improve the reliability of its financial reports. At the same time, it will work to increase the efficiency and clarity of corporate management, and bolster governance, by steadily created and operating the internal control systems stipulated in the Company Law.
(4) Other important matters for corporate management:
No corresponding item exists.
―9―
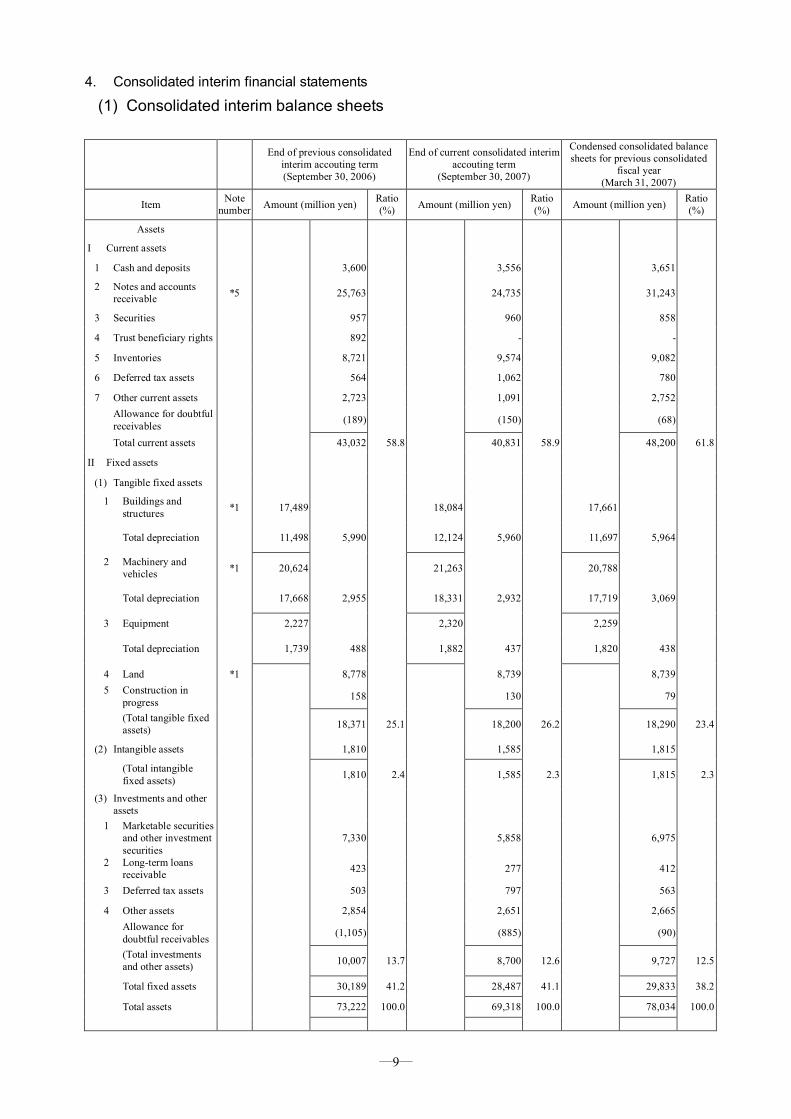
4. Consolidated interim financial statements
(1) Consolidated interim balance sheets
End of previous consolidated
interim accouting term (September 30, 2006)
End of current consolidated interim accouting term
(September 30, 2007)
Condensed consolidated balance sheets for previous consolidated
fiscal year (March 31, 2007)
Item Note number Amount (million yen) Ratio
(%) Amount (million yen) Ratio (%) Amount (million yen) Ratio
(%) Assets
I Current assets 1 Cash and deposits 3,600 3,556 3,651 2 Notes and accounts
receivable *5 25,763 24,735 31,243
3 Securities 957 960 858 4 Trust beneficiary rights 892 - - 5 Inventories 8,721 9,574 9,082 6 Deferred tax assets 564 1,062 780 7 Other current assets 2,723 1,091 2,752 Allowance for doubtful
receivables (189) (150) (68)
Total current assets 43,032 58.8 40,831 58.9 48,200 61.8 II Fixed assets
(1) Tangible fixed assets 1 Buildings and
structures *1 17,489 18,084 17,661
Total depreciation 11,498 5,990 12,124 5,960 11,697 5,964
2 Machinery and vehicles *1 20,624 21,263 20,788
Total depreciation 17,668 2,955 18,331 2,932 17,719 3,069
3 Equipment 2,227 2,320 2,259
Total depreciation 1,739 488 1,882 437 1,820 438
4 Land *1 8,778 8,739 8,739 5 Construction in
progress 158 130 79
(Total tangible fixed assets) 18,371 25.1 18,200 26.2 18,290 23.4
(2) Intangible assets 1,810 1,585 1,815 (Total intangible
fixed assets) 1,810 2.4 1,585 2.3 1,815 2.3
(3) Investments and other assets
1 Marketable securities and other investment securities
7,330 5,858 6,975
2 Long-term loans receivable 423 277 412
3 Deferred tax assets 503 797 563 4 Other assets 2,854 2,651 2,665 Allowance for
doubtful receivables (1,105) (885) (90)
(Total investments and other assets) 10,007 13.7 8,700 12.6 9,727 12.5
Total fixed assets 30,189 41.2 28,487 41.1 29,833 38.2
Total assets 73,222 100.0 69,318 100.0 78,034 100.0

―10―
End of previous consolidated
interim accouting term (September 30, 2006)
End of current consolidated interim accouting term
(September 30, 2007)
Condensed consolidated balance sheets for previous consolidated
fiscal year (March 31, 2007)
Item Note number Amount (million yen) Ratio
(%) Amount (million yen) Ratio (%) Amount (million yen) Ratio
(%)
Liabilities
I Current liabilities
1 Notes and accounts payable *5 25,472 23,176 29,201
2 Short-term borrowings *1 3,396 - 600
3 Current portion of long-term debt - 3,700 3,145
4 Bonds for redemption within current year - 1,000 1,000
5 Accrued corporation taxes 216 77 414
6 Accrued expenses 1,498 1,429 1,707 7 Reserve for bonus
payable 693 705 794 8 Other current
liabilities 1,094 883 795
Total current liabilities 32,369 44.2 30,972 44.7 37,658 48.3
II Fixed liabilities
1 Bonds 1,000 - -
2 Long-term borrowings 6,600 5,600 6,200 3 Reserve for retirement
allowance 5,135 4,628 4,866 4 Reserve for severance
indemnities to directors and corporate auditors
297 229 325
5 Other long-term liabilities 1,711 1,629 1,643
Total long-term liabilities 14,744 20.1 12,087 17.4 13,035 16.7
Total liabilities 47,114 64.3 43,059 62.1 50,693 65.0

―11―
End of previous consolidated
interim accouting term (September 30, 2006)
End of current consolidated interim accouting term
(September 30, 2007)
Condensed consolidated balance sheets for previous consolidated
fiscal year (March 31, 2007)
Item Note number Amount (million yen) Ratio
(%) Amount (million yen) Ratio (%) Amount (million yen) Ratio
(%)
Net assets
I Shareholders’ equity
1 Paid in Capital 6,855 9.3 6,855 9.9 6,855 8.8
2 Capital surplus 6,468 8.8 6,488 9.3 6,468 8.3
3 Earned Surplus 10,514 14.4 11,357 16.4 12,077 15.5
4 Treasury stock (758) (1.0) (698) (1.0) (911) (1.2)
Total shareholders’ equity 23,080 31.5 24,003 34.6 24,490 31.4
II Unrealized gain (loss) and translation gain(loss)
1 Unrealized gain (loss) on securities 2,826 3.9 1,994 2.9 2,624 3.4
2 Equity adjustment from foreign currency translation
5 0.0 28 0.0 16 0.0
Total unrealized gain (loss) and translation gain(loss)
2,831 3.9 2,022 2.9 2,640 3.4
III Minority interests in consolidated subsidiaries
196 0.3 232 0.4 209 0.2
Total net assets 26,108 35.7 26,258 37.9 27,340 35.0
Total liabilities and net assets 73,222 100.0 69,318 100.0 78,034 100.0

―12―
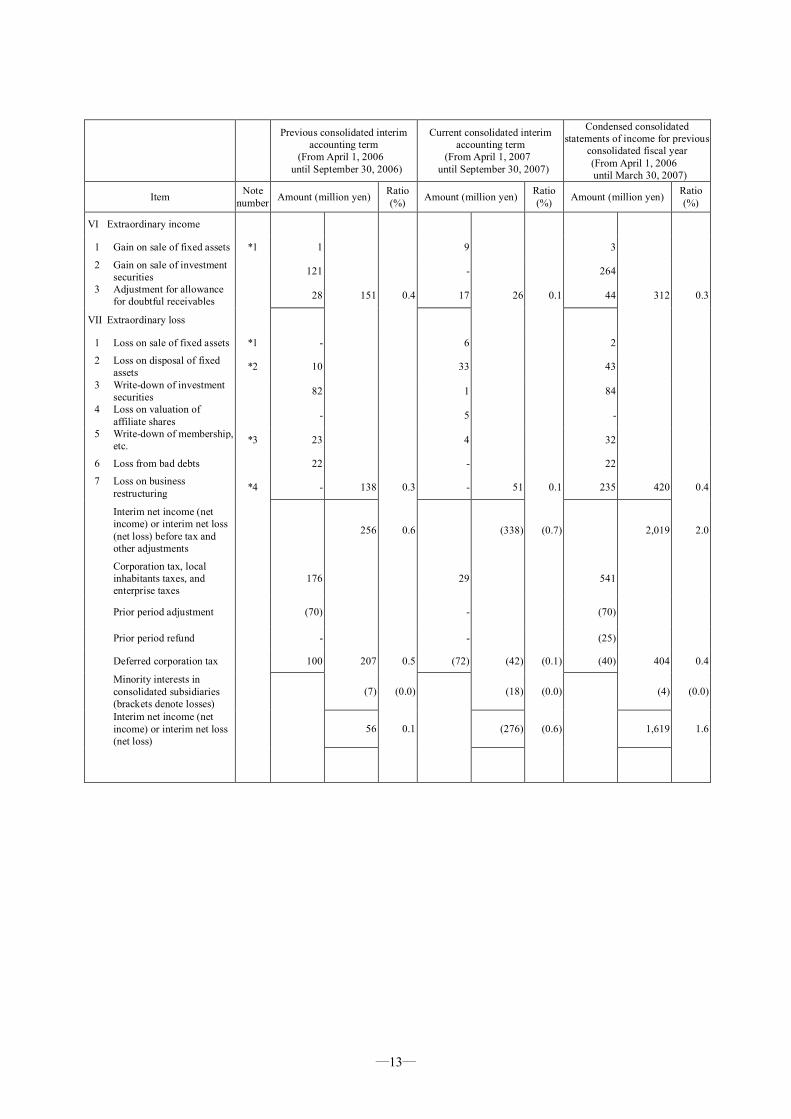
(2) Consolidated interim statements of income
Previous consolidated interim
accounting term (From April 1, 2006
until September 30, 2006)
Current consolidated interim accounting term
(From April 1, 2007 until September 30, 2007)
Condensed consolidated statements of income for previous
consolidated fiscal year (From April 1, 2006 until March 31, 2007)
Item Note number Amount (million yen) Ratio
(%) Amount (million yen) Ratio (%) Amount (million yen) Ratio
(%)
I Net sales 45,988 100.0 45,674 100.0 100,936 100.0
II Cost of sales 34,120 74.2 33,966 74.4 74,775 74.1
Gross profit 11,868 25.8 11,708 25.6 26,161 25.9 III Selling and administrative
expenses
1 Shipping expenses 2,614 2,696 5,656
2 Advertising expenses 1,079 1,068 2,055 3 Provision for allowance for
doubtful receivables 14 1 4
4 Salaries and bonuses 2,898 2,974 6,342 5 Provision for allowance for
bonuses 525 514 619 6 Depreciation and
amortization 520 514 1,054
7 Other expenses 4,040 11,694 25.4 4,158 11,927 26.1 8,228 23,960 23.7
Operating income or loss 173 0.4 (219) (0.5) 2,200 2.2
IV Non-operating income
1 Interest income 12 13 21
2 Dividend income 32 37 55
3 Purchase discount 46 39 85
4 Rent on real estate 68 50 128 5 Profit (loss) on equity
method investment 57 - 29
6 Insurance dividend received 24 16 77
7 Other expenses 75 318 0.7 51 209 0.5 137 535 0.5
V Non-operating expenses
1 Interest expense 82 94 173
2 Sales discount 51 56 113
3 Loss on inventories 46 81 175
4 Profit (loss) on equity method investment - 4 -
5 Other expenses 67 248 0.6 65 302 0.7 145 607 0.6
Ordinary income or ordinary loss 243 0.5 (312) (0.7) 2,128 2.1
―13―
Previous consolidated interim
accounting term (From April 1, 2006
until September 30, 2006)
Current consolidated interim accounting term
(From April 1, 2007 until September 30, 2007)
Condensed consolidated statements of income for previous
consolidated fiscal year (From April 1, 2006 until March 30, 2007)
Item Note number Amount (million yen) Ratio
(%) Amount (million yen) Ratio (%) Amount (million yen) Ratio
(%)
VI Extraordinary income
1 Gain on sale of fixed assets *1 1 9 3 2 Gain on sale of investment
securities 121 - 264 3 Adjustment for allowance
for doubtful receivables 28 151 0.4 17 26 0.1 44 312 0.3
VII Extraordinary loss
1 Loss on sale of fixed assets *1 - 6 2 2 Loss on disposal of fixed
assets *2 10 33 43 3 Write-down of investment
securities 82 1 84 4 Loss on valuation of
affiliate shares - 5 - 5 Write-down of membership,
etc. *3 23 4 32
6 Loss from bad debts 22 - 22 7 Loss on business
restructuring *4 - 138 0.3 - 51 0.1 235 420 0.4
Interim net income (net income) or interim net loss (net loss) before tax and other adjustments
256 0.6 (338) (0.7) 2,019 2.0
Corporation tax, local inhabitants taxes, and enterprise taxes
176 29 541
Prior period adjustment (70) - (70)
Prior period refund - - (25)
Deferred corporation tax 100 207 0.5 (72) (42) (0.1) (40) 404 0.4 Minority interests in
consolidated subsidiaries (brackets denote losses)
(7) (0.0) (18) (0.0) (4) (0.0)
Interim net income (net income) or interim net loss (net loss)
56 0.1 (276) (0.6) 1,619 1.6
―14―
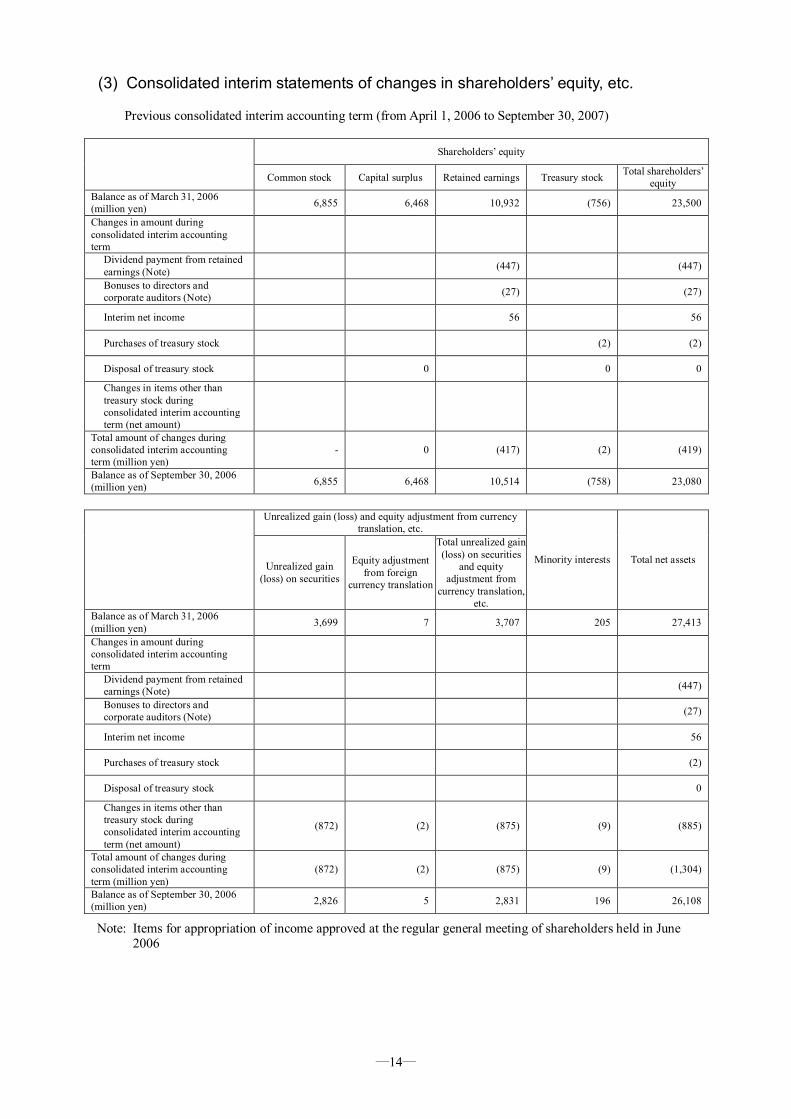
(3) Consolidated interim statements of changes in shareholders’ equity, etc.
Previous consolidated interim accounting term (from April 1, 2006 to September 30, 2007)
Shareholders’ equity
Common stock Capital surplus Retained earnings Treasury stock Total shareholders’ equity
Balance as of March 31, 2006 (million yen) 6,855 6,468 10,932 (756) 23,500 Changes in amount during consolidated interim accounting term
Dividend payment from retained earnings (Note) (447) (447) Bonuses to directors and corporate auditors (Note) (27) (27)
Interim net income 56 56
Purchases of treasury stock (2) (2)
Disposal of treasury stock 0 0 0 Changes in items other than treasury stock during consolidated interim accounting term (net amount)
Total amount of changes during consolidated interim accounting term (million yen)
- 0 (417) (2) (419)
Balance as of September 30, 2006 (million yen) 6,855 6,468 10,514 (758) 23,080
Unrealized gain (loss) and equity adjustment from currency
translation, etc.
Unrealized gain (loss) on securities
Equity adjustment from foreign
currency translation
Total unrealized gain (loss) on securities
and equity adjustment from
currency translation, etc.
Minority interests Total net assets
Balance as of March 31, 2006 (million yen) 3,699 7 3,707 205 27,413 Changes in amount during consolidated interim accounting term
Dividend payment from retained earnings (Note) (447) Bonuses to directors and corporate auditors (Note) (27)
Interim net income 56
Purchases of treasury stock (2)
Disposal of treasury stock 0 Changes in items other than treasury stock during consolidated interim accounting term (net amount)
(872) (2) (875) (9) (885)
Total amount of changes during consolidated interim accounting term (million yen)
(872) (2) (875) (9) (1,304)
Balance as of September 30, 2006 (million yen) 2,826 5 2,831 196 26,108
Note: Items for appropriation of income approved at the regular general meeting of shareholders held in June 2006
―15―
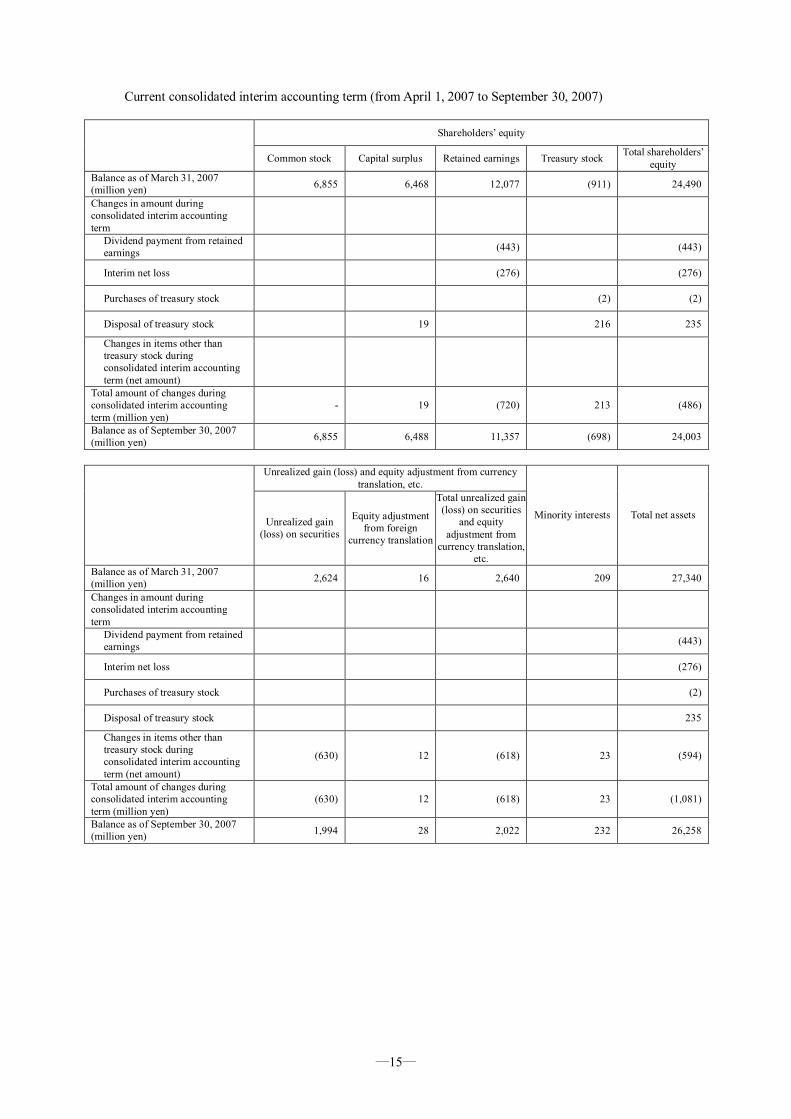
Current consolidated interim accounting term (from April 1, 2007 to September 30, 2007)
Shareholders’ equity
Common stock Capital surplus Retained earnings Treasury stock Total shareholders’
equity Balance as of March 31, 2007 (million yen) 6,855 6,468 12,077 (911) 24,490 Changes in amount during consolidated interim accounting term
Dividend payment from retained earnings (443) (443)
Interim net loss (276) (276)
Purchases of treasury stock (2) (2)
Disposal of treasury stock 19 216 235 Changes in items other than treasury stock during consolidated interim accounting term (net amount)
Total amount of changes during consolidated interim accounting term (million yen)
- 19 (720) 213 (486)
Balance as of September 30, 2007 (million yen) 6,855 6,488 11,357 (698) 24,003
Unrealized gain (loss) and equity adjustment from currency
translation, etc.
Unrealized gain (loss) on securities
Equity adjustment from foreign
currency translation
Total unrealized gain (loss) on securities
and equity adjustment from
currency translation, etc.
Minority interests Total net assets
Balance as of March 31, 2007 (million yen) 2,624 16 2,640 209 27,340 Changes in amount during consolidated interim accounting term
Dividend payment from retained earnings (443)
Interim net loss (276)
Purchases of treasury stock (2)
Disposal of treasury stock 235 Changes in items other than treasury stock during consolidated interim accounting term (net amount)
(630) 12 (618) 23 (594)
Total amount of changes during consolidated interim accounting term (million yen)
(630) 12 (618) 23 (1,081)
Balance as of September 30, 2007 (million yen) 1,994 28 2,022 232 26,258

―16―
Previous consolidated fiscal year (from April 1, 2006 to March 31, 2007)
Shareholders’ equity
Common stock Capital surplus Retained earnings Treasury stock Total shareholders’
equity Balance as of March 31, 2006 (million yen) 6,855 6,468 10,932 (756) 23,500 Change in amount during consolidated fiscal year
Dividend payment from retained earnings (Note) (447) (447) Bonuses to directors and corporate auditors (Note) (27) (27)
Net income 1,619 1,619
Purchases of treasury stock (155) (155)
Disposal of treasury stock 0 0 0 Changes in items other than treasury stock during consolidated fiscal year (Net amount)
Total amount of changes during consolidated fiscal year (million yen)
- 0 1,145 (155) 990
Balance as of March 31, 2007 (million yen) 6,855 6,468 12,077 (911) 24,490
Unrealized gain (loss) and equity adjustment from currency
translation, etc.
Unrealized gain (loss) on securities
Equity adjustment from foreign
currency translation
Total unrealized gain (loss) on securities
and equity adjustment from
currency translation, etc.
Minority interests Total net assets
Balance as of March 31, 2006 (million yen) 3,699 7 3,707 205 27,413 Change in amount during consolidated fiscal year
Dividend payment from retained earnings (Note) (447) Bonuses to directors and corporate auditors (Note) (27)
Net income 1,619
Purchases of treasury stock (155)
Disposal of treasury stock 0 Changes in items other than treasury stock during consolidated fiscal year (Net amount)
(1,074) 8 (1,066) 3 (1,062)
Total amount of changes during consolidated fiscal year (million yen)
(1,074) 8 (1,066) 3 (72)
Balance as of March 31, 2007 (million yen) 2,624 16 2,640 209 27,340
Note: Items for appropriation of income approved at the regular general meeting of shareholders held in June 2006

―17―
(4) Consolidated interim statements of cash flows
Previous consolidated interim
accounting term (From April 1, 2006
until September 30, 2006)
Current consolidated interim accounting term
(From April 1, 2007 until September 30, 2007)
Condensed consolidated statements of cash flows for previous consolidated fiscal
year (From April 1, 2006 until March 31, 2007)
Item Note number Amount (million yen) Amount (million yen) Amount (million yen)
I Cash flows from operating activities
Interim net income (net income) or interim net loss (net loss) before tax and other adjustments
256 (338) 2,019
Depreciation and amortization 854 938 1,777 Loss on disposal of fixed assets 10 33 43 Gain or loss on sale of fixed assets (brackets denote a gain) (1) (2) (1)
Gains or loss on sale of investment securities (brackets denote a gain) (121) 0 (264)
Write-down of investment securities 82 6 84 Change in allowance for doubtful receivables (brackets denote a decrease)
(20) (22) (257)
Change in reserve for retirement allowance (brackets denote a decrease)
(204) (237) (491)
Change in reserve for severance indemnities to directors and corporate auditors (brackets denote a decrease)
3 (96) 30
Equity in earnings or loss of subsidiary or affiliated company (brackets denote a gain)
(57) 4 (29)
Interest and dividend income (45) (51) (77) Interest expense 82 94 173 Change in trade receivables (brackets denote an increase) 3,673 6,381 (1,639)
Change in trust beneficiary rights (brackets denote an increase) - - 978
Change in inventories (brackets denote an increase) (960) (308) (1,321)
Change in trade payables (brackets denote a decrease) (1,561) (4,358) 2,270
Other (112) (722) 308
Sub total 1,877 1,319 3,604
Interest and dividend received 45 51 77 Interest paid (85) (94) (170)
Surcharge paid (267) - (267) Income taxes paid (1,088) 106 (1,741)
Cash flows from operating activities 480 1,383 1,501

―18―
Previous consolidated interim
accounting term (From April 1, 2006
until September 30, 2006)
Current consolidated interim accounting term
(From April 1, 2007 until September 30, 2007)
Condensed consolidated statements of cash flows for previous consolidated fiscal
year (From April 1, 2006 until March 31, 2007)
Item Note number Amount (million yen) Amount (million yen) Amount (million yen)
II Cash flows from investing activities
Acquisition of tangible fixed assets (347) (304) (770)
Proceeds of tangible fixed assets 9 67 53
Acquisition of intangible fixed assets (259) (61) (582)
Acquisition of investment securities (22) (239) (126)
Proceeds from sale of investment securities 171 0 407
Increase in loans (246) (8) (431) Income from loan collection 294 54 596 Proceeds from acquisition of stock of new consolidated subsidiary - - 54
Other 181 (23) 14
Cash flows from investing activities (219) (513) (784)
III Cash flows from financing activities
Net change in short-term debts (brackets denotes a decrease) 1,094 (600) (525)
Extension of long-term debt 1,700 1,500 2,900
Repayment of long-term debt (2,612) (1,545) (2,663)
Redemption of convertible bond (500) - (500) Proceeds and payments from sale and acquisition of treasury stock (1) (2) (155)
Proceeds from sale of treasury stock - 235 -
Payment to minority shareholders - (4) -
Income from payment by minority shareholders - - 10
Dividends paid (447) (443) (447) Dividends, etc. paid to minority shareholders (1) (6) (1)
Cash flows from financing activities (768) (866) (1,382)
IV Change in cash and cash equivalents (brackets denotes a decrease) (507) 3 (664)
V Cash and cash equivalents at beginning of year 5,062 4,398 5,062
VI Change in cash and cash equivalents due to additional consolidation - 3 -
VII Cash and cash equivalents at end of interim term (end of fiscal year) 4,555 4,404 4,398

―19―
(5) Basis of presenting consolidated interim financial statements
1 Matters related to the scope of consolidation (1) The number of consolidated subsidiaries is 14 Main consolidated subsidiaries
LIC Co. Ltd, Shiga TOLI Carpet Co., Ltd., KIRONY Co., Ltd., HOKKAIDO TOLI Corporation, Toli Warehouse and Distribution Company, Limited ., TOLI INTERIAKIKAKU Corporation, Hiroka TOLI Floor Co., Ltd., GRACE CARPET LIMITED, Santen TOLI Co., Ltd., DIA・CARPET CO., LTD. and MRM Gifu Company, Limited We changed the status of GRACE CARPET LIMITED from an equity method affiliate to a consolidated subsidiary in the consolidated interim accounting term under review in accordance with its increased importance. We removed Otsuka TOLI Carpet from our scope of consolidation following completion of its liquidation procedure.
(2) Names of main non-consolidated subsidiaries, etc. Main non-consolidated subsidiaries
Japan Reform System Co., Ltd., Hokkaido TOLI Sewing Co., Ltd., Interior System Support Co., Ltd. (The reason for the exclusion from consolidation)
These non-consolidated subsidiaries have been excluded from consolidation because they have no material effect on the consolidated interim financial statements due to the small size of their operations, in light of their total assets, net sales and net profit or loss (the amount corresponding to equity), etc.
2 Matters concerning the application of equity method (1) Number of non-consolidated subsidiaries with equity method applied: one
Company name: Works Co., Ltd. (2) Number of affiliated companies with equity method applied: two
Company name: True Heart Co., Ltd., Changzhou Liberty Toli Building Material Company Limited (3) Non-consolidated subsidiaries not under the equity method (Japan Reform System Co., Ltd., Hokkaido
TOLI Sewing Co., Ltd., and others) and affiliated companies (Naigai Carpet Kako Co., Ltd., TOLI Hiroshima Sewing Co., Ltd. and others) have been excluded from the scope of application of the equity method, because of their negligible effects on net profit or loss (the amount corresponding to equity) and retained earnings (the amount corresponding to equity), and because they have no material effect on the overall results.
3 Matters pertaining to interim closing dates of consolidated subsidiaries
The interim closing date for each of the consolidated subsidiaries matches the consolidated interim closing date.
4 Accounting policies (1) Valuation standards and method for important assets
1) Securities Other Securities
Securities with market value Market value method based on the market price on the last day of the consolidated interim accounting term, etc. (variance from valuation is processed as a component of shareholders’ equity, and the cost of securities sold is calculated using the moving average method.)
Securities without market value Moving average cost method
2) Inventories Mainly periodic average cost method
3) Derivatives Market value method

―20―
(2) Depreciation method for important depreciable assets
1) Tangible fixed assets The fixed rate method is mainly applied. However, for buildings acquired after April 1, 1998 (excluding equipment attached to buildings), the fixed amount method is applied. The effective lives of buildings and structures are three to 65 years. The effective lives for machinery and vehicles are seven to 15 years.
2) Intangible assets The fixed amount method is applied. However, for software (used by the Company), the fixed amount method based on an estimated useful life of five years is applied.
(3) Basis for calculating allowances 1) Allowance for doubtful receivables
In anticipation of potential loan losses, the Company posts non-recoverable amounts based on the loan loss ratio for general debts and in consideration of the collectability of specific debts including possible bad debts.
2) Reserve for bonus payable A reserve for bonuses payable is recorded based on the estimated amount of bonuses to employees.
3) Reserve for retirement allowance An amount deemed to have emerged at the end of the current consolidated interim accounting term is recorded as a reserve for retirement allowance, based on the estimated retirement benefit obligations and pension assets at the end of the fiscal year. Past service liabilities and actuarial differences are recorded as expenses based on the fixed amount method for certain years within the employees’ average remaining periods (mainly 10 years) at the time of the occurrence from the current fiscal year and following fiscal year respectively.
4) Reserve for severance indemnities to directors and corporate auditors The submitting company and certain consolidated subsidiaries (LIC Co. Ltd, HOKKAIDO TOLI Corporation, DIA・CARPET CO., LTD. and TECHNO KAMEI CORPORATION) record the amounts required at the end of the current consolidated interim accounting term, under internal regulations in anticipation of severance indemnities to directors and executive officers. Reserve for severance indemnities to executive officers (53 million yen in the current consolidated interim accounting term) had been included in “accrued expenses” until the previous consolidated fiscal year. In consideration of past payments, etc., we record the reserve under “reserve for severance indemnities to directors and corporate auditors,” starting the current interim term. The amounts of the concerned reserve included in “accrued expenses” were 61 million yen in the previous consolidated interim accounting term and 49 million yen in the previous consolidated fiscal year, respectively.
(4) Standards for translating assets or liabilities in foreign currencies into yen-denominated assets and liabilities Monetary assets and liabilities denominated in foreign currencies are translated into yen-denominated assets and liabilities based on the spot exchange rate at the closing day. Translation differences are recorded as gains or losses.
(5) Accounting of lease transactions The same accounting method applied to ordinary lease transactions is applied to finance lease transactions except those where the ownership of property is considered to be transferred to the lessee.
(6) Hedge accounting method 1) Hedge accounting method
Deferred hedge accounting is applied. Preferential procedures are employed for interest swap transactions satisfying requirements for preferential procedures.
2) Hedging instruments and hedging targets Hedging instruments Interest rate swap, Commodities Derivatives Hedging targets Borrowing interest, Raw materials
3) Hedging policy The Company hedges interest rate risks and raw material price fluctuation risks under the Derivatives Management Regulations. The Company has a policy of not engaging in derivatives transactions for the purpose of trading or speculation.

―21―
4) Method of valuating the effectiveness of hedging
The Company evaluates the relationships between price fluctuations of the hedging targets and market fluctuations of hedging instruments and the effectiveness of hedging by using statistical methods including regression analysis. Since interest rate swaps meet the requirements for preferential procedures, the Company omits the evaluation of their effectiveness.
(7) Accounting of consumption tax etc. The tax exclusion method is employed. Consumption tax, etc. paid temporarily and consumption tax, etc. received temporarily are balanced out, and included in “others” under current liabilities.
5. Scope of funds in consolidated interim statements of cash flows Funds consist of cash on hand, deposits that can be withdrawn as needed, and easily convertible short-term investments that mature within three months of the trading day for which there are only small risks of price fluctuations.
(6) Changes in the basis of presenting consolidated interim financial statements
(Changes in accounting policies) Following the revision of the Corporation Tax Law, the method for depreciating tangible fixed assets
acquired on or after April 1, 2007 was changed to the method prescribed in the revised Corporation Tax Law in the current consolidated interim accounting term.
The effect of the change on profit or loss is minor.
(Additional information) Following the revision of the Corporation Tax Law, for tangible fixed assets acquired on or before
March 31, 2007, the balance of an amount equivalent to 5% of the acquisition value and the memorandum price is depreciated in a straight-line method and recorded as depreciation expenses for a period of five years, starting in the consolidated fiscal year after the fiscal year in which depreciation based on a method stipulated in the pre-revision Corporation Tax Law reaches 5% of the acquisition value.
As a result of the change, gross profit decreased 64 million yen, operating loss increased 76 million yen, ordinary loss grew 77 million yen, and interim net loss before tax and other adjustments rose 77 million yen.
An impact on segment information is described the segment information section.

―22―
(7) Notes related to consolidated interim financial statements
(Notes related to consolidated interim balance sheets) End of previous consolidated interim accouting
term (September 30, 2006)
End of current consolidated interim accouting term
(September 30, 2007)
Condensed consolidated balance sheets for previous consolidated fiscal year
(March 31, 2007) *1 Pledged assets
Pledged assets Buildings and structures
1,483 million yen
(1,483 million yen)
Machinery and vehicles
1,322 million yen
(1,322 million yen)
Land 68 million yen (68 million yen)
Total 2,874 million yen
(2,874 million yen)
Liabilities corresponding to the above assets
Short-term borrowings 420 million yen(420 million yen)
Figures in brackets show the value of the pledged assets of the factory foundation and the corresponding liabilities. In addition to the above assets, consolidated subsidiaries’ land (book value of 266 million yen at the end of the interim term) and buildings (book value of 127 million yen at the end of the same term) are pledged as a joint mortgage of 26 companies of the Mishima Sawazi Industrial Park Cooperative for borrowings of 778 million yen of the cooperative.
*1 Pledged assets Consolidated subsidiaries’ land (book
value of 266 million yen at the term end) and buildings (book value of 119 million yen at the term end) are pledged as a joint mortgage of 26 companies of the Mishima Sawazi Industrial Park Cooperative for borrowings of 622 million yen of the cooperative.
*1 Pledged assets Consolidated subsidiaries’ land (book
value of 266 million yen at the term end) and buildings (book value of 123 million yen at the term end) are pledged as a joint mortgage of 26 companies of the Mishima Sawazi Industrial Park Cooperative for borrowings of 700 million yen of the cooperative.
2 Debt guarantee (1) The Company guarantees the
following liabilities on purchases of the following company: Kyushu KIRONY Co., Ltd. 0 million yen
2 Debt guarantee (1) The Company guarantees the
following liabilities on purchases of the following company:
Kyushu KIRONY Co., Ltd. 1 million yen
(2) The Company guarantees the
following lease obligations of the following company: Kingrun M.I.D Co., Ltd. 1 million yen
In addition to the above, consolidated subsidiaries co-sign a loan of 600 million yen owed by the Mishima Sawazi Industrial Park Cooperative jointly with 26 companies of the cooperative.
2 Debt guarantee Consolidated subsidiaries co-sign a loan
of 600 million yen owed by the Mishima Sawazi Industrial Park Cooperative jointly with 26 companies of the cooperative.
(2) The Company guarantees the following lease obligations of the following company:
Kingrun M.I.D Co., Ltd. 1 million yen
In addition to the above, consolidated subsidiaries co-sign a loan of 600 million yen owed by the Mishima Sawazi Industrial Park Cooperative jointly with 26 companies of the cooperative.
3 –––– 3 Obligation to buy back in association of liquidation of loans
633 million yen
3 Obligation to buy back in association of liquidation of loans
650 million yen 4 Discounted notes receivable
Discounted notes receivable 32 million yen
4 Discounted notes receivable Discounted notes receivable 37 million yen
4 Discounted notes receivable Discounted notes receivable 44 million yen
*5 Notes due at the end of consolidated
interim accounting term Notes due at the end of the consolidated interim accounting term are settled on the date of bill clearing. Since the last day of the consolidated interim accounting term fell on a bank holiday, the following notes due at the end of the consolidated interim accounting term are included in the term-end balance:
Notes receivable 872 million yenNotes payable 611 million yen
*5 Notes due at the end of consolidated interim accounting term
Notes due at the end of the consolidated interim accounting term are settled on the date of bill clearing. Since the last day of the consolidated interim accounting term fell on a bank holiday, the following notes due at the end of the consolidated interim accounting term are included in the term-end balance:
Notes receivable 973 million yenNotes payable 529 million yen
*5 Notes due at the end of the fiscal year Notes due at the end of the fiscal year are settled on the date of bill clearing.
Since the last day of the consolidated fiscal year fell on a bank holiday, the following notes due at the end of the fiscal year are included in the term-end balance: Notes receivable 1,002 million yenNotes payable 512 million yen

―23―
(Notes on consolidated interim statements of income) Previous consolidated interim accounting term
(From April 1, 2006 until September 30, 2006)
Current consolidated interim accounting term (From April 1, 2007
until September 30, 2007)
Condensed consolidated balance sheets for previous consolidated fiscal year
(From April 1, 2006 until March 31, 2007)
*1 The gain on sale of fixed assets is a gain on sale of machinery and vehicles.
*1 The gain on sale of fixed assets includes a gain on sale of machinery and vehicles of 9 million yen. The loss on sale of fixed assets includes a loss on sale of machinery and vehicles of 4 million yen and a loss on sale of buildings and structures of 2 million yen.
*1 The gain on sale of fixed assets includes a gain on sale of land of 2 million yen and a gain on sale of machinery and vehicles of 1 million yen. The loss of sale of fixed assets is a loss on sale of machinery and vehicles of 2 million yen.
*2 The loss on disposal of fixed assets includes a loss on disposal of machinery and vehicles of 8 million yen and a loss on disposal of buildings and structures of 1 million yen.
*2 The loss on disposal of fixed assets includes a loss on disposal of machinery and vehicles of 4 million yen, a loss on disposal of tools and equipment of 3 million yen and a loss on fixed assets removal of 24 million yen.
*2 The loss on disposal of fixed assets includes a loss on disposal of machinery and vehicles of 29 million yen and a loss on disposal of tools and equipment of 14 million yen.
*3 ––––– *3 The loss on valuation of membership includes provision for allowance for doubtful receivables of 3 million yen.
*3 The loss on valuation of membership includes provision for allowance for doubtful receivables of 20 million yen.
*4 ––––– *4 ––––– *4 The loss on business restructuring consists of a loss on disposal of inventory assets of 75 million yen associated with the liquidation of KIRONY Co., Ltd. (Minato-ku, Tokyo) and a loss on business restructuring of TECHNO KAMEI CORPORATION of 160 million yen.

―24―
(Notes Related to Consolidated Interim Statements of Changes in Shareholders’ Equity)
Previous consolidated interim accounting term (from April 1, 2006 to September 30, 2006)
1 Matters pertaining to the type and total number of stocks issued, and the type and number of treasury stocks
Type of stock Number of shares at the end
of previous consolidated fiscal year (shares)
Increase in the number of shares during previous consolidated interim
accounting term (shares)
Decrease in the number of shares during previous consolidated interim
accounting term (shares)
Number of shares at the end of previous consolidated interim accounting term
(shares) Stock issued
Common stock 66,829,249 - - 66,829,249
Total 66,829,249 - - 66,829,249
Treasury stock
Common stock 2,953,450 6,286 1,760 2,957,976
Total 2,953,450 6,286 1,760 2,957,976
(Note) The increase in treasury common stock by 6,286 shares reflects to requests for the acquisition of odd-lot shares. The decrease in such stock by 1,760 shares is because of requests for the further purchase of odd-lot shares.
2 Matters pertaining to dividends
(1) Dividend payment
Relevant resolution Type of stock Total dividends (million yen)
Dividend per share (yen) Date of record Effective from
Regular general meeting of
shareholders held on June 29, 2006
Common stock 447 7.00 March 31, 2006 June 30, 2006
(2) Dividends for which the date of record fell in the previous consolidated interim accounting term, but for
which the date on which the relevant resolution took effect fell after the previous consolidated interim accounting term No corresponding item exists.

―25―
Current consolidated interim accounting term (from April 1, 2007 to September 30, 2007)
1 Matters pertaining to the type and total number of stocks issued, and the type and number of treasury stocks
Type of stock Number of shares at the end
of previous consolidated fiscal year (shares)
Increase in the number of shares during current consolidated interim
accounting term (shares)
Decrease in the number of shares during current consolidated interim
accounting term (shares)
Number of shares at the end of current consolidated interim accounting term
(shares) Stock issued
Common stock 66,829,249 - - 66,829,249
Total 66,829,249 - - 66,829,249
Treasury stock
Common stock 3,454,779 8,152 818,916 2,644,015
Total 3,454,779 8,152 818,916 2,644,015
(Summary of reasons for changes) A breakdown in the increase in the number of treasury common stock is as follows. Increase due to request for acquisition of shares less than unit stock: 8,152 shares
A breakdown in the decrease in the number of treasury common stock is as follows. Decrease because of private placement based on Board of Directors resolution: 818,000 shares
Decrease due to request for further purchase of shares less than unit stock: 916 shares
2 Matters pertaining to dividends (1) Dividend payment
Relevant resolution Type of stock Total dividends (million yen)
Dividend per share (yen) Date of record Effective from
Regular general meeting of
shareholders held on June 28, 2007
Common stock 443 7.00 March 31, 2007 June 29, 2007
(2) Dividends for which the date of record falls in the current consolidated interim accounting term, but for
which the date on which the relevant resolution takes effect falls after the current consolidated interim accounting term No corresponding item exists.

―26―
Previous consolidated fiscal year (from April 1, 2006 to March 31, 2007)
1 Matters pertaining to the type and total number of stocks issued, and the type and number of treasury stocks
Type of stock Number of shares at the end
of previous consolidated fiscal year (shares)
Increase in the number of shares during current
consolidated fiscal year (shares)
Decrease in the number of shares during current
consolidated fiscal year (shares)
Number of shares at the end of current consolidated fiscal
year (shares)
Stock issued
Common stock 66,829,249 - - 66,829,249
Total 66,829,249 - - 66,829,249
Treasury stock
Common stock 2,953,450 503,205 1,876 3,454,779
Total 2,953,450 503,205 1,876 3,454,779
(Summary of reasons for changes) A breakdown in the increase in the number of treasury common stock is as follows.
Increase due to acquisition in the market based on resolution of the Board of Directors: 487,000 shares Increase due to request for acquisition of shares less than unit stock: 16,205 shares
A breakdown in the decrease in the number of treasury common stock is as follows. Decrease due to request for further purchase of shares less than unit stock: 1,876 shares
2 Matters pertaining to dividends
(1) Dividend payment
Relevant resolution Type of stock Total dividends (million yen)
Dividend per share (yen) Date of record Effective from
Regular general meeting of
shareholders held on June 29, 2006
Common stock 447 7.00 March 31, 2006 June 30, 2006
(2) The dividends for which the date of record falls in current consolidated fiscal year, but for which the date
on which the relevant resolution takes effect is in the next consolidated fiscal year
Relevant resolution Type of stock Dividend funds Total dividends (million yen)
Dividend per share (yen) Date of record Effective from
Regular general meeting of
shareholders held on June 28, 2007
Common stock Retained earnings 443 7.00 March 31, 2007 June 29, 2007
(Notes related to consolidated interim statements of cash flows) Previous consolidated interim accounting term
(From April 1, 2006 until September 30, 2006)
Current consolidated interim accounting term (From April 1, 2007
until September 30, 2007)
Previous consolidated fiscal year (From April 1, 2006 until March 31, 2007)
The relationship between cash and cash equivalents at the end of interim term and the itemized amount stated in consolidated interim balance sheets (As of September 30, 2006) Cash and deposit accounts 3,600 million yen
Time deposits over 3 months (2 million yen)
Securities accounts (MMF, etc.) 957 million yen
Cash and cash equivalents 4,555 million yen
The relationship between cash and cash equivalents at the end of interim term and the itemized amount stated in consolidated interim balance sheets (As of September 30, 2007) Cash and deposit accounts 3,556 million yen
Time deposits over 3 months (112 million yen)
Securities accounts (MMF, etc.) 960 million yen
Cash and cash equivalents 4,404 million yen
The relationship between cash and cash equivalents at the end of term and the itemized amount stated in Consolidated Balance Sheets (As of March 31, 2007) Cash and deposit accounts 3,651 million yen
Time deposits over 3 months (112 million yen)
Securities accounts (MMF, etc.) 858 million yen
Cash and cash equivalents 4,398 million yen

―27―
(Segment Information)
1 Business segment information Previous consolidated interim accounting term (from April 1, 2006 to September 30, 2006)
Vinyl chloride
products (million yen)
Textile products business
(million yen) Other businesses
(million yen) Total
(million yen)
Elimination or Group-wide businesses
(million yen)
Consolidated (million yen)
Net sales
(1) Net sales to external customers 15,328 14,247 16,412 45,988 - 45,988 (2) Internal sales or transfers
among segments - - - - (-) -
Total net sales 15,328 14,247 16,412 45,988 (-) 45,988
Operating expenses 14,204 14,497 16,327 45,029 785 45,815
Operating income or loss 1,124 (249) 85 959 (785) 173
Notes: 1 Business segments are determined based on units for sales aggregation. 2 Main products in each segment
(1) Vinyl chloride products segment: Vinyl-chloride tiles and vinyl chloride sheets (2) Textile products business: Carpets, curtains (3) Other businesses: Wallpaper, adhesives, blinds, etc.
3 Of operating expenses for the current consolidated interim accounting term under review, unallocatable operating expenses included in the segment of elimination or Group-wide businesses were 785 million yen. They were mainly consisted of expenses related to the General Affairs and Personnel Department, the Accounting Department, etc. of the head office of the submitting company.
Current consolidated interim accounting term (from April 1, 2007 to September 30, 2007)
Vinyl chloride
products (million yen)
Textile products business
(million yen) Other businesses
(million yen) Total
(million yen)
Elimination or Group-wide businesses
(million yen)
Consolidated (million yen)
Net sales
(1) Net sales to external customers 14,718 14,639 16,316 45,674 - 45,674 (2) Internal sales or transfers
among segments - - - - (-) -
Total net sales 14,718 14,639 16,316 45,674 - 45,674
Operating expenses 14,043 14,773 16,290 45,107 786 45,893
Operating income or loss 675 (133) 25 567 (786) (219)
Notes: 1 Business segments are determined based on units for sales aggregation. 2 Main products in each segment
(1) Vinyl chloride products segment: Vinyl-chloride tiles and vinyl chloride sheets (2) Textile products business: Carpets, curtains (3) Other businesses: Wallpaper, adhesives, blinds, etc.
3 Of operating expenses for the current consolidated interim accounting term under review, unallocatable operating expenses included in the segment of elimination or Group-wide businesses were 786 million yen. They were mainly consisted of expenses related to the General Affairs and Personnel Department, the Accounting Department, etc. of the head office of the submitting company.
4 As stated in the “Changes in the basis of presenting consolidated interim financial statements (additional information), following the revision of the Corporation Tax Law, for tangible fixed assets acquired on or before March 31, 2007, the balance of an amount equivalent to 5% of the acquisition value and the memorandum price is depreciated in a straight-line method and recorded as depreciation expenses for a period of five years, starting the consolidated fiscal year after the fiscal year in which depreciation based on a method stipulated in the pre-revision Corporation Tax Law reaches 5% of the acquisition value.
As a result of the change, operating expenses increased 56 million yen for the vinyl chloride products

―28―
business, 16 million yen for the textile products business and 2 million yen for other businesses (no increase for the Group as a whole) in the current consolidated interim accounting term. Operating income decreased or the operating loss grew by the same amounts for the respective segments.

―29―
Previous consolidated fiscal year (from April 1, 2006 to March 31, 2007)
Vinyl chloride
products (million yen)
Textile products business
(million yen) Other businesses
(million yen) Total
(million yen)
Elimination or Group-wide businesses
(million yen)
Consolidated (million yen)
Net sales
(1) Net sales to external customers 34,684 31,715 34,536 100,936 - 100,936
(2) Internal sales or transfers among segments - - - - (-) -
Total net sales 34,684 31,715 34,536 100,936 (-) 100,936
Operating expenses 31,594 31,461 34,106 97,161 1,574 98,736
Operating income 3,089 254 430 3,774 (1,574) 2,200
Notes: 1 Business segments are determined based on units for sales aggregation. 2 Main products in each segment
(1) Vinyl chloride products segment: Vinyl-chloride tiles and vinyl chloride sheets (2) Textile products business: Carpets, curtains (3) Other businesses: Wallpaper, adhesives, blinds, etc.
3 Of operating expenses for the fiscal year under review, unallocatable operating expenses included in the segment of elimination or Group-wide businesses were 1,574 million yen. They were mainly consisted of expenses related to the General Affairs and Personnel Department, the Accounting Department, etc. of the head office of the submitting company.
4 As stated in “Change in accounting,” the Accounting Standard for Directors’ Bonus (Accounting Standard No.4 issued by the Accounting Standards Board of Japan on November 29, 2007) is applied, starting in the current consolidated fiscal year. As a result of this change, operating expenses increased 7 million yen for the vinyl chloride products business, 3 million yen for the textile products business and 2 million yen for other businesses (no increase for the Group as a whole) in the current consolidated fiscal year. Operating income decreased by the same amounts for respective segments.
2 Geographical segment information
Previous consolidated interim accounting term (from April 1, 2006 to September 30, 2006) Not applicable, since the submitting company did not have overseas branches or consolidated subsidiaries.
Current consolidated interim accounting term (from April 1, 2007 to September 30, 2007)
Not applicable, since the submitting company did not have overseas branches or consolidated subsidiaries.
Previous consolidated fiscal year (from April 1, 2006 to March 31, 2007) Not applicable, since the submitting company did not have overseas branches or consolidated subsidiaries.
3 Overseas sales
Previous consolidated interim accounting term (from April 1, 2006 to September 30, 2006) Description of overseas sales is omitted because they were less than 10% of consolidated sales.
Current consolidated interim accounting term (from April 1, 2007 to September 30, 2007)
Description of overseas sales is omitted because they were less than 10% of consolidated sales.
Previous consolidated fiscal year (from April 1, 2006 to March 31, 2007) Description of overseas sales is omitted because they were less than 10% of consolidated sales.

―30―
(Omission of disclosure) Disclosure of items related to lease transactions, negotiable securities and derivatives transactions is
omitted because they are not significant for the purposes of the interim financial statements. (Per-share data)
Summary Previous consolidated interim
accounting term (From April 1, 2006
until September 31, 2006)
Current consolidated interim accounting term
(From April 1, 2007 until September 31, 2007)
Previous consolidated fiscal year (From April 1, 2006 until March 31, 2007)
Net assets per share 405.69 yen 405.49 yen 428.12 yen
Interim net income per share (net income per share) or interim net loss per share
0.88 yen (4.35 yen) 25.44 yen
Notes: 1 Diluted net income per share is omitted because there was no potential dilution. 2 The basis for calculation of interim net income per share (net income per share) or interim net loss per
share is as follows.
Previous consolidated interim
accounting term (From April 1, 2006
until September 30, 2006)
Current consolidated interim accounting term
(From April 1, 2007 until September 30, 2007)
Previous consolidated fiscal year
(From April 1, 2006 until March 31, 2007)
Interim net income (net income) or interim net loss (million yen) in the consolidated interim statements of income (consolidated statements of income)
56 (276) 1,619
Interim net income (net income) or interim net loss pertaining to common stock (million yen)
56 (276) 1,619
Amount not imputed to common shareholder (million yen) - - -
Average number of common stock shares during the period (thousands of shares)
63,874 63,579 63,683
(Important post-balance sheet events)
No applicable item exists.

―31―
5 Company-specific interim financial statements (1) Interim balance sheets
End of previous consolidated
interim accouting term (September 30, 2006)
End of current consolidated interim accouting term
(September 30, 2007)
Condensed balance sheets for previous fiscal year (March 31, 2007)
Item Amount (million yen) Ratio (%) Amount (million yen) Ratio
(%) Amount (million yen) Ratio (%)
Assets
I Current assets
1 Cash and deposits 2,093 1,921 1,729
2 Notes receivable 4,518 4,223 5,098
3 Accounts receivable 14,236 14,387 18,164
4 Securities 957 960 858
5 Inventories 7,284 8,059 7,844
6 Deferred tax assets 330 803 501
7 Accounts receivable 2,619 2,953 3,332
8 Other expenses 2,234 1,509 1,475 Allowance for doubtful
receivables (92) (105) (93)
Total current assets 34,183 57.8 34,713 59.8 38,913 61.3
II Fixed assets
(1) Tangible fixed assets
1 Buildings 4,496 4,333 4,417
2 Machinery 2,101 1,865 2,038
3 Land 6,075 6,075 6,075
4 Other expenses 786 652 662
(Total tangible fixed assets) 13,459 22.8 12,926 22.3 13,193 20.8
(2) Intangible assets 1,361 1,247 1,422
(Total intangible assets) 1,361 2.3 1,247 2.2 1,422 2.3
(3) Investments and other assets
1 Investment securities 7,412 6,432 7,162
2 Long-term loans receivable 1,748 986 1,221
3 Deferred tax assets 867 525 332
4 Other expenses 1,491 1,283 1,325 Allowance for doubtful
receivables (1,393) (99) (121) (Total investments and other
assets) 10,125 17.1 9,128 15.7 9,921 15.6
Total fixed assets 24,946 42.2 23,301 40.2 24,537 38.7
Total assets 59,130 100.0 58,015 100.0 63,450 100.0

―32―
End of previous consolidated
interim accouting term (September 30, 2006)
End of current consolidated interim accouting term
(September 30, 2007)
Condensed balance sheets for previous fiscal year (March 31, 2007)
Item Amount (million yen) Ratio (%) Amount (million yen) Ratio
(%) Amount (million yen) Ratio (%)
Liabilities
I Current liabilities
1 Notes payable 3,122 3,368 3,431
2 Accounts payable 12,222 12,458 15,070
3 Short-term borrowings 1,800 - 600 4 Current portion of long-term
debt 1,596 3,700 3,145 5 Bonds for redemption within
current year - 1,000 1,000
6 Accrued income taxes 50 47 40
7 Accrued expenses 1,371 1,243 1,566
8 Allowance for bonus payable 329 339 347
9 Other expenses 2,448 2,785 3,361
Total current liabilities 22,940 38.8 24,943 43.0 28,562 45.0
II Fixed liabilities
1 Bonds 1,000 - -
2 Long-term debt 6,600 5,600 6,200 3 Reserve for retirement
allowance 4,128 3,640 3,870 4 Reserve for severance
indemnities to directors and corporate auditors
232 154 252
5 Allowance for loss from investments - 27 27
6 Other expenses 1,577 1,558 1,563
Total fixed liabilities 13,538 22.9 10,980 18.9 11,913 18.8
Total liabilities 36,479 61.7 35,924 61.9 40,476 63.8

―33―
End of previous consolidated
interim accouting term (September 30, 2006)
End of current consolidated interim accouting term
(September 30, 2007)
Condensed balance sheets for previous fiscal year (March 31, 2007)
Item Amount (million yen) Ratio (%) Amount (million yen) Ratio
(%) Amount (million yen) Ratio (%)
Net assets
I Shareholders’ equity
(1) Common stock 6,855 11.6 6,855 11.8 6,855 10.8
(2) Capital surplus
1 Additional paid-in capital 1,789 1,789 1,789
2 Other capital surplus 4,679 4,698 4,679
Total capital surplus 6,468 11.0 6,488 11.2 6,468 10.2
(3) Retained earnings
Other retained earnings
General reserve 6,300 6,800 6,300 Retained earnings carried
forward 1,218 811 1,860
Total retained earnings 7,518 12.7 7,611 13.1 8,160 12.9
(4) Treasury stock (758) (1.3) (698) (1.2) (911) (1.5)
Total shareholders’ equity 20,084 34.0 20,257 34.9 20,573 32.4 II Unrealized gain (loss) and
translation gain (loss) Unrealized gain (loss) on
securities 2,566 4.3 1,833 3.2 2,400 3.8 Total unrealized gain (loss) on
securities and translation gain (loss), etc.
2,566 4.3 1,833 3.2 2,400 3.8
Total net assets 22,650 38.3 22,091 38.1 22,974 36.2
Total liabilities and net assets 59,130 100.0 58,015 100.0 63,450 100.0

―34―
(2) Interim statements of income
Previous interim accounting term
(From April 1, 2006 until September 30, 2006)
Current interim accounting term (From April 1, 2007
until September 30, 2007)
Condensed statements of income for previous fiscal year (From April 1, 2006 until March 30, 2007)
Item Amount (million yen) Ratio (%) Amount (million yen) Ratio
(%) Amount (million yen) Ratio (%)
I Net sales 26,849 100.0 27,498 100.0 58,905 100.0
II Cost of sales 18,798 70.0 19,696 71.6 41,222 70.0
Gross profit 8,051 30.0 7,802 28.4 17,683 30.0
III Selling and administrative expenses 8,045 30.0 8,045 29.3 16,479 28.0
Operating income or loss 5 0.0 (242) (0.9) 1,203 2.0
IV Non-operating income
1 Interest income 15 25 39
2 Other expenses 351 367 1.4 304 330 1.2 490 530 0.9
V Non-operating expenses
1 Interest expense 82 105 174
2 Other expenses 139 221 0.8 192 297 1.1 345 519 0.8
Ordinary income or ordinary loss 151 0.6 (210) (0.8) 1,214 2.1
VI Extraordinary income 149 0.5 38 0.1 304 0.5
VII Extraordinary loss 127 0.5 15 0.0 209 0.4
Interim net income before income taxes or interim net loss before income taxes
173 0.6 (187) (0.7) 1,309 2.2
Corporation tax, local inhabitants taxes, and enterprise taxes 20 20 40
Prior period adjustment (70) - (70)
Deferred corporation tax 65 15 0.0 (101) (81) (0.3) 538 508 0.8
Interim net income or interim net loss 158 0.6 (105) (0.4) 801 1.4

―35―
(3) Interim statements of changes in shareholders’ equity, etc. Previous interim accounting term (from April 1, 2006 to September 30, 2006)
Shareholders’ equity
Capital surplus Retained earnings
Other retained earnings Common stock Additional
paid-in capital Other capital
surplus General reserve
Retained earnings carried forward
Treasury stock Total
shareholders’ equity
Balance as of March 31, 2006 (million yen) 6,855 1,789 4,678 5,800 2,024 (756) 20,392 Change in amount during interim accounting term
Dividend payment from retained earnings (Note) (447) (447) Bonuses to directors and corporate auditors (Note) (18) (18)
General reserve aggregate (Note) 500 (500) -
Interim net income 158 158
Purchases of treasury stock (2) (2)
Disposal of treasury stock 0 0 0 Changes in items other than treasury stock during interim accounting term (net amount)
Total amount of changes during interim accounting term (million yen)
- - 0 500 (806) (2) (308)
Balance as of September 30, 2006 (million yen) 6,855 1,789 4,679 6,300 1,218 (758) 20,084
Unrealized gain (loss) and translation gain (loss), etc.
Unrealized gain (loss) on
securities
Total of unrealized
gain (loss) and translation gain (loss)
Total net assets
Balance as of March 31, 2006 (million yen) 3,380 3,380 23,773 Change in amount during interim accounting term
Dividend payment from retained earnings (Note) (447) Bonuses to directors and corporate auditors (Note) (18)
General reserve aggregate (Note) -
Interim net income 158
Purchases of treasury stock (2)
Disposal of treasury stock 0 Changes in items other than treasury stock during interim accounting term (net amount)
(814) (814) (814)
Total amount of changes during interim accounting term (million yen)
(814) (814) (1,123)
Balance as of September 30, 2006 (million yen) 2,566 2,566 22,650
Note: Items for appropriation of income approved at the regular general meeting of shareholders held in June 2006

―36―
Current interim accounting term (from April 1, 2007 to September 30, 2007)
Shareholders’ equity
Capital surplus Retained earnings
Other retained earnings Common stock Additional
paid-in capital Other capital
surplus General reserve
Retained earnings carried forward
Treasury stock Total
shareholders’ equity
Balance as of March 31, 2007 (million yen) 6,855 1,789 4,679 6,300 1,860 (911) 20,573 Change in amount during interim accounting term
Dividend payment from retained earnings (443) (443)
General reserve aggregate 500 (500) -
Interim net income (105) (105)
Purchases of treasury stock (2) (2)
Disposal of treasury stock 19 216 235 Changes in items other than treasury stock during interim accounting term (net amount)
Total amount of changes during interim accounting term (million yen)
- - 19 500 (1,049) 213 (316)
Balance as of September 30, 2007 (million yen) 6,855 1,789 4,698 6,800 811 (698) 20,257
Unrealized gain (loss) and
equity adjustment from currency translation, etc.
Unrealized gain (loss) on
securities
Total of unrealized
gain (loss) and equity
adjustment from currency
translation
Total net assets
Balance as of March 31, 2007 (million yen) 2,400 2,400 22,974 Change in amount during interim accounting term
Dividend payment from retained earnings (443)
General reserve aggregate -
Interim net income (105)
Purchases of treasury stock (2)
Disposal of treasury stock 235 Changes in items other than treasury stock during interim accounting term (net amount)
(567) (567) (567)
Total amount of changes during interim accounting term (million yen)
(567) (567) (883)
Balance as of September 30, 2007 (million yen) 1,833 1,833 22,091

―37―
Previous fiscal year (from April 1, 2006 to March 31, 2007)
Shareholders’ equity
Capital surplus Retained earnings
Other retained earnings Common stock Additional
paid-in capital Other capital
surplus General reserve
Retained earnings carried forward
Treasury stock Total
shareholders’ equity
Balance as of March 31, 2006 (million yen) 6,855 1,789 4,678 5,800 2,024 (756) 20,392 Change in amount during consolidated fiscal year
Dividend payment from retained earnings (Note) (447) (447) Bonuses to directors and corporate auditors (Note) (18) (18)
General reserve aggregate (Note) 500 (500) -
Net income 801 801
Purchases of treasury stock (155) (155)
Disposal of treasury stock 0 0 0 Changes in items other than treasury stock during consolidated fiscal year (Net amount)
Total amount of changes during consolidated fiscal year (million yen)
- - 0 500 (164) (155) 180
Balance as of March 31, 2007 (million yen) 6,855 1,789 4,679 6,300 1,860 (911) 20,573
Unrealized gain (loss) and
equity adjustment from currency translation, etc.
Unrealized gain (loss) on
securities
Total of unrealized
gain (loss) and equity
adjustment from currency
translation
Total net assets
Balance as of March 31, 2006 (million yen) 3,380 3,380 23,773 Change in amount during consolidated fiscal year
Dividend payment from retained earnings (Note) (447) Bonuses to directors and corporate auditors (Note) (18)
General reserve aggregate (Note) -
Net income 801
Purchases of treasury stock (155)
Disposal of treasury stock 0 Changes in items other than treasury stock during consolidated fiscal year (Net amount)
(980) (980) (980)
Total amount of changes during consolidated fiscal year (million yen)
(980) (980) (799)
Balance as of March 31, 2007 (million yen) 2,400 2,400 22,974
Note: Items for appropriation of income approved at the regular general meeting of shareholders held in June 2006