Interim Report Q3/2010 - Deutsche Börse...the Company is lowering its cost guidance for 2010 from...
38
Quarter 3 / 2010 Interim Report
Transcript of Interim Report Q3/2010 - Deutsche Börse...the Company is lowering its cost guidance for 2010 from...

Quarter 3 / 2010Interim Report

Deutsche Börse Group: Financial Highlights
Quarter ended Nine months ended
30 Sep. 2010 30 Sep. 2009 30 Sep. 2010 30 Sep. 2009
Consolidated income statement
Sales revenue €m 504.3 500.9 1,587.9 1,556.3
Net interest income from banking business €m 15.8 21.9 42.5 79.7
Earnings before interest and tax (EBIT) €m 244.1 243.7 747.1 804.1
Net income for the period €m 161.3 158.3 479.0 529.1
Consolidated cash flow statement
Cash flows from operating activities €m 223.9 248.0 675.5 592.8
Consolidated balance sheet (as at 30 September)
Equity €m 3,476.9 3,118.8 3,476.9 3,118.8
Total assets €m 178,398.2 168,923.4 178,398.2 168,923.4
Performance indicators
Earnings per share (basic) € 0.87 0.85 2.58 2.85
Earnings per share (diluted) € 0.87 0.85 2.57 2.84
Operating cash flow per share (basic) € 1.20 1.33 3.63 3.19
Operating cash flow per share (diluted) € 1.20 1.33 3.62 3.18
Market indicators
Xetra
Number of transactions m 45.2 41.7 141.0 128.4
Trading volume (single-counted) €bn 271.4 266.2 950.7 786.5
Floor trading
Trading volume (single-counted)1) €bn 13.2 15.1 46.0 45.0
Eurex
Number of contracts m 563.6 636.8 2,049.1 2,042.8
Clearstream
Value of securities deposited (average for the period) international €bn 5,845 5,453 5,804 5,385
domestic €bn 5,008 5,047 5,011 4,855
Number of transactions international m 8.3 7.5 27.0 22.3
domestic m 18.0 18.0 57.9 52.7
Global Securities Financing (average outstanding volume for the period) €bn 534.1 483.7 511.4 473.2
Deutsche Börse share price
Opening price2) € 50.08 55.28 58.00 50.80
High3) € 55.43 60.96 59.00 65.27
Low3) € 47.36 49.25 45.45 29.50
Closing price (as at 30 September) € 48.95 55.85 48.95 55.85
1) Excluding certificates and warrants 2) Closing price on preceding trading day 3) Intraday price

Group Management Report 1
Slight rise in Deutsche Börse’s sales revenue and EBIT in the third quarter
The recovery in the global economy led to a slight increase in trading and contract volumes on the cash and derivatives markets in the third quarter, in spite of lower volatility than in the same period of 2009. How-ever, trading volumes in the third quarter lagged be-hind the extremely strong second quarter of 2010, which had been driven by high volatility.
Sales revenue increased slightly year-on-year to €504.3 million (Q3/2009: €500.9 million).
Against the background of persistently low interest rates, net interest income from banking business dropped by 28 percent to €15.8 million (Q3/2009: €21.9 million) due to the expiry of interest rate hedges.
Total costs in the third quarter declined by 5 percent to €287.0 million (Q3/2009: €301.5 million). Operating costs were €235.4 million (Q3/2009: €242.9 million).
Earnings before interest and tax (EBIT) amounted to €244.1 million (Q3/2009: €243.7 million).
Basic earnings per share amounted to €0.87 for an average of 185.9 million shares (Q3/2009: €0.85 for 185.9 million shares).
EBIT and earnings per share rose in spite of the cost incurred for the operating efficiency program resolved in the first quarter. The expenses incurred in connec-tion with efficiency programs amounted to €12.9 mil-lion in the third quarter of 2010. The table on page 3 shows key figures adjusted for these effects.
Due to the positive cost trend in the first nine months, the Company is lowering its cost guidance for 2010 from €1,210 million to around €1,150 million before costs of efficiency programs.
Development of Deutsche Börse AG shares since the beginning of Q3/2010
0
400400
200200
30
5050
6060
4040
600600
30.6
.-2.7
.
5.7
.-9.7
.
12.7
.-16.7
.
19.7
.-23.7
.
26.7
.-30.7
.
2.8
.-6.8
.
9.8
.-13.8
.
16.8
.-20.8
.
23.8
.-27.8
.
30.8
.-3.9
.
6.9
.-10.9
.
13.9
.-17.9
.
20.9
.-24.9
.
27.9
.-1.1
0.
4.1
0.-
8.1
0.
18.1
0.-
22.1
0.
11.1
0.-
15.1
0.
Order book turnover of Deutsche Börse share
EURO STOXX 50® (EUR)1)
Daily Deutsche Börse closing share priceDAX® performance1)
1) Index-linked, closing price on 30 June 2010
Quoted price € Turnover €m

2 Group Management Report Financial Statements Notes
Group Interim Report
Deutsche Börse AG prepared this interim financial report in accordance with Interna-tional Financial Reporting Standards (IFRSs) as adopted by the EU. As stipulated by the Wertpapierhandelsgesetz (WpHG, German Securities Trading Act), it is supple-mented by a Group interim management report. This report also takes into account the requirements of German Accounting Standard (GAS) 16. Results of operations, financial position and net assets
Results of operations for the first nine months of 2010 After a stable first quarter and a very strong second quar-ter, Deutsche Börse Group recorded slight year-on-year increases in its trading activities in Q3 (Xetra and Eurex segments). Post-trading (Clearstream segment) and the data business (Market Data & Analytics segment) also benefitted from the generally positive business environ-ment. Nevertheless, as expected, Deutsche Börse Group’s business did not match the very high level reached in Q2, which had been driven by a number of exceptional factors that boosted trading volumes. The levels of government debt in Greece and several other European countries, the EU’s concerted rescue package and the decline of the euro against the US dollar led to extremely high levels of market volatility in the second quarter. In the middle of May, volatility – and thus trading activity – started to decline again, dropping below the levels seen in the prior-year quarter. Thanks to its broad-based business model, all business areas of Deutsche Börse Group benefitted from the overall improvement in the macroeconomic climate. As a result, there was a slight year-on-year im-provement in Deutsche Börse Group’s business perform-ance in the first nine months of 2010. In the first nine months, Deutsche Börse Group’s sales revenue rose slightly year-on-year, climbing 2 percent to €1,587.9 million (Q1–3/2009: €1,556.3 million). Net interest income from banking business generated in the
Clearstream segment fell by almost half to €42.5 million, mainly because of persistently low short-term interest rates worldwide and the expiry of interest rate hedges (Q1–3/2009: €79.7 million). Total costs increased by 4 percent year-on-year to €941.8 million in the first nine months of 2010 due to expenses in connection with efficiency programs (Q1–3/2009: €901.7 million, prior-year figures adjusted; see page 4 for changes in financial reporting). The efficiency programs pushed operating costs up by 9 percent to €784.8 million (Q1–3/2009: €717.9 million). EBIT declined by 7 percent in the first nine months of 2010 to €747.1 million (Q1–3/2009: €804.1 million). In addition to higher costs of efficiency programs, a 47 percent fall in net interest income from banking busi-ness led to reduced earnings. The Group’s financial result for the first nine months of 2010 was €–71.3 million (Q1–3/2009: €–56.5 million); this reflects in particular the interest expense from the financing of the acquisition of the International Securities Exchange (ISE) and expenses from the partial redemption mainly in Q2/2010 of a hybrid bond. Net income for the first nine months of 2010 amounted to €479.0 million (Q1–3/2009: €529.1 million). Basic earnings per share, based on a weighted average of 185.9 million shares outstanding, declined to €2.58 in the first nine months of 2010 (Q1–3/2009: €2.85 for an average of 185.8 mil-lion shares outstanding).

Group Management Report 3
The following table shows the key indicators for the first nine months, adjusted for the effects of efficiency pro-grams which have been implemented since 2007:
Key figures Q1–3/2010 (adjusted for efficiency programs)1)
Q1–3/2010 Q1–3/2009 Q1–3/2010
(adjusted) Q1–3/2009
(adjusted) €m €m €m €m
Total cost 941.8 901.7 819.1 914.4
Operating cost 784.8 717.9 662.1 730.6
EBIT 747.1 804.1 869.2 791.4
Net income fort he period 479.0 529.1 568.1 519.8
Earnings per share (basic) (€) 2.58 2.85 3.06 2.80
1) Adjusted for effects of efficiency programs which have been implemented since 2007
(Q1–3/2010: €–122.7 million, Q1–3/2009: €12.7 million); adjusted EBIT 2010
excludes other operating income in connection with reimbursement of costs of effi-
ciency programs amounting to €0.6 million.
Operating efficiency program To prepare timely for structural change in financial mar-kets and for changing customer requirements as well as in response to the uncertain market environment, Deutsche Börse AG’s Executive Board adopted additional measures in the first quarter of 2010 to optimize opera-tional processes and cost structures. To this end, Deutsche Börse resolved to reassign operating functions across the Group’s locations, further harmonize the IT infrastructure, trim down its management structure, and to intensify the focus on its core activities. This program will lead to a significant improvement in Deutsche Börse Group’s cost efficiency: the measures resolved will lead to savings totalling around €150 mil-lion a year from 2013 onwards. Since some of the meas-ures will be implemented sooner than planned, the Com-pany is expecting to generate around €25 million of the €85 million in savings originally expected for 2011 in the current year. A savings volume of around €115 million is expected in 2012. The measures complement the pro-grams to enhance efficiency, which have been imple-mented since 2007. More precise figures as to the cost of these efficiency programs have become available as the project continues to progress: they will amount to less than €200 million.
In the first nine months of 2010, expenses of €122.7 million were charged in connection with efficiency pro-grams in the consolidated income statement, primarily under staff costs in all Group segments. Most of the re-maining expenses will be incurred in 2011 and 2012.
Costs of efficiency programs 2010
Q1/2010 Q2/2010 Q3/2010 Q1–3/2010 €m €m €m €m
Xetra 6.0 15.0 1.6 22.6
Eurex 7.6 25.1 2.6 35.3
Clearstream 13.0 37.0 5.7 55.7
Market Data & Analytics 1.2 4.9 3.0 9.1
Total 27.8 82.0 12.9 122.7
For 2010, Deutsche Börse Group originally expected operating costs of no more than €945 million and total costs of no more than €1,210 million before costs in-curred in connection with the efficiency programs de-scribed above. Due to the positive cost trend in the first nine months, the Company now expects total costs before costs of efficiency programs of around €1,150 million for full-year 2010. Two reasons are material to this: on the one hand accelerated cost savings of €25 million, on the other hand the volume-related costs, which in 2010 are expected to be around €35 million Euro lower than planned, mainly due to lower than expected volume growth in the current business year. At the same time, Deutsche Börse is increasing spending on growth initiatives and new system infrastructure in 2010:
The Xetra segment is using the funds to expand the Xetra International Market (XIM) initiative launched in November 2009, extend the Tradegate Exchange offering, and further increase the variety of exchange-traded funds (ETFs).
In the Eurex segment, the expenditures are primarily directed at extending the global distribution network (focus on Asia, Central and Eastern Europe) and prod-uct range, strengthening the clearing services for OTC derivatives trading, and developing the joint trading infrastructure for Deutsche Börse Group.

4 Group Management Report Financial Statements Notes
The Clearstream segment has boosted its investment in collateral management services and is expanding the high-end custody services offering. In addition, the Singapore location is being upgraded to become a hub for customers in Asia.
Market Data & Analytics is focusing on machine-readable trading signals and other exclusive data prod-ucts for fully electronic trading. It is also planning to expand its business in growth regions outside Europe.
Deutsche Börse Group believes that these initiatives will help it maintain a leading position among financial mar-ket infrastructure operators. Changes in financial reporting With effect from 1 January 2010, Deutsche Börse Group has adjusted its internal reporting structure and, as a consequence, its segment structure. The Group’s busi-ness activities are now divided into four market segments: Xetra, Eurex, Clearstream and Market Data & Analytics. The external sales revenue of the former Information Technology segment (IT) and the costs of IT and Corpo-rate Services (central functions) have been divided be-tween the four market segments. The new structure im-proves the allocation of sales revenue and costs to the segments and makes it easier to compare Deutsche Börse Group with its peers. The figures for the previous year have been adjusted to the new segment structure to ensure comparability. Since 1 January 2010, own expenses capitalized are no longer reported separately as income in the consolidated income statement. Since then, expenses incurred in con-nection with internal development activities comprise only non-capitalized amounts. This change is reflected in a decrease of both total revenue and cost by around €40 million in 2010 and thus does not impact earnings. This change also harmonizes the treatment of acquired and internally developed intangible assets in the consoli-dated income statement. Prior-period figures were ad-justed accordingly. To further enhance reporting transparency, the Group has distinguished between volume-related and operating costs since 1 January 2010. Volume-related costs comprise
expenses that are correlated with the level of sales revenue, such as fee and commission expenses from banking business or costs for purchasing price information. Changes in the basis of consolidation impacted segment reporting as follows for 2010:
Xetra segment: Scoach Holding S.A., which was previ-ously fully consolidated, was deconsolidated effective 31 December 2009 and reclassified as a joint venture because Deutsche Börse AG no longer exercises control over the company as a result of a change in the coop-eration agreement with SIX Swiss Exchange AG. Since that date, Scoach Holding S.A. has been accounted for using the equity method by Deutsche Börse AG and is reported under the result from equity investments.
Xetra segment: With effect from 8 January 2010, Deutsche Börse AG acquired a 75 percent stake in Tradegate Exchange GmbH. The company was fully included in the consolidated financial statements for the first time in the first quarter of 2010. At the same time, Deutsche Börse AG acquired a 5 percent interest in Tradegate AG Wertpapierhandelsbank, which holds 25 percent of the fully consolidated company Tradegate Exchange GmbH. Tradegate AG Wertpapierhandelsbank is accounted for using the equity method.
Eurex segment: Eurex Frankfurt AG sold its 66 percent stake in BSP Regional Energy Exchange LLC, Ljubl-jana, Slovenia, on 19 August 2010.
Clearstream segment: On 21 July 2010, Clearstream International S.A. and Banque Centrale du Luxembourg formed LuxCSD S.A., in which Clearstream Inter-national S.A. holds a 50.0 percent stake. The company is included in full in the consolidated financial state-ments in the fourth quarter.
Market Data & Analytics segment: On 29 December 2009, Deutsche Börse AG increased its interest in STOXX Ltd. from 33.33 percent to 50.1 percent. Since then, STOXX has been fully consolidated rather than reported as an associate, as had been the case previously.
Market Data & Analytics segment: On 20 November 2009, Deutsche Börse Group acquired the US-based financial news service provider Need to Know News, LLC. Need to Know News has been fully consolidated since that date.
Market Data & Analytics segment: On 1 July 2010, Deutsche Börse Group sold its 77 percent interest in Avox Ltd.

Group Management Report 5
Results of operations for the third quarter of 2010 In the third quarter, Deutsche Börse Group recorded a slight increase in business activity in the cash market, on the Eurex European derivatives exchange and in Clear-stream’s post-trading activities. It generated significant increases in its data business, in part due to the continu-ous expansion of its offering. Deutsche Börse Group’s sales revenue rose slightly as against the prior-year quarter, climbing by 1 percent to €504.3 million (Q3/2009: €500.9 million). Net interest income from banking business generated in the Clear-stream segment followed the sharply lower trend of previ-ous quarters; it decreased by 28 percent year-on-year to €15.8 million (Q3/2009: €21.9 million). Given the per-sistently low short-term interest rates, the decline is due to the expiry of interest rate hedges, and longer-term investments reaching maturity. However, higher average overnight customer deposits and a small improvement in short-term market interest rates over the course of 2010 led to a stabilization of net interest income in the third quarter. Other operating income of €11.7 million includes a contribution of €10.7 million from the sale of the 77 percent interest in Avox Ltd. at the beginning of July. This income enabled Deutsche Börse Group to largely offset the effects of the euro/US dollar exchange rate as well as the impact of a modified recognition of income. Since the third quarter of 2010, income from IT services for the partner exchange Scoach has been recognized
retrospectively for the year as a whole as sales revenue in the Xetra segment, after previously having been recog-nized under other operating income. In spite of the expenses in connection with efficiency programs, Deutsche Börse Group’s total costs of €287.0 million in the third quarter were 5 percent down on the prior-year period (Q3/2009: €301.5 million, prior-year amount adjusted to reflect changes to the consoli-dated income statement, see page 4). Operating costs were down 3 percent year-on-year, at €235.4 million (Q3/2009: €242.9 million). The decline in amortization of intangible assets in connection with the International Securities Exchange resulting from the impairment charge recognized in the fourth quarter of 2009 and the positive effects of the ongoing efficiency measures had a positive impact on operating costs. Volume-related costs fell by 12 percent to €51.6 million (Q3/2009: €58.6 million) in spite of the slight increase in business activity. The year-on-year decline is primarily attributable to the con-solidation of STOXX Ltd. and the deconsolidation of Scoach Holding S.A. Due to the consolidation of STOXX Ltd., license fees that Group companies remit to STOXX are no longer recognized as external costs. In addition, Deutsche Börse Group was able to reduce fee and commission expenses from banking business as part of its ongoing efficiency measures, e.g. by renegotiating agreements with service providers.
Sales revenue and EBIT by quarter Breakdown of sales revenue by segment

6 Group Management Report Financial Statements Notes
Deutsche Börse Group’s result from equity investments amounted to €–0.7 million in the third quarter (Q3/2009: €3.7 million). It is generated primarily by Scoach Holding S.A., Direct Edge Holdings, LLC and European Energy Exchange AG. The positive contribution made by these companies was lower in the third quarter of 2010 and was also more than offset by write-downs of smaller equity investments such as, for example, ISE’s stake in Ballista Securities, LLC. EBIT amounted to €244.1 million, on a level with the prior-year period (Q3/2009: €243.7 million). The net financial result of €–18.6 million recognized in the third quarter of 2010 (Q3/2009: €–19.8 million) relates primarily to interest payments on noncurrent liabilities. At 27 percent, the effective Group tax rate in the third quarter of 2010 was similar to that recorded in the same period of 2009. The decline in the Group tax rate since the second half of 2008 reflects the relocation of employ-ees to Eschborn. Net income for the third quarter rose slightly to €161.3 million (Q3/2009: €158.3 million). Deutsche Börse Group’s basic earnings per share, based on a weighted average of 185.9 million shares outstanding, amounted to €0.87 in the third quarter of 2010 (Q3/2009: €0.85 for an average of 185.9 million shares outstanding). The following table shows the key indicators for the third quarter, adjusted for the expenses in connection with efficiency programs:
Key figures Q3/2010 (adjusted for efficiency programs)1)
Q3/2010 Q3/2009 Q3/2010 (adjusted)
Q3/2009 (adjusted)
€m €m €m €m
Total cost 287.0 301.5 274.1 303.6
Operating cost 235.4 242.9 222.5 245.0
EBIT 244.1 243.7 257.4 241.6
Net income for the period 161.3 158.3 171.0 156.8
Earnings per share (basic) (€) 0.87 0.85 0.92 0.84
1) Adjusted for effects of efficiency programs which have been implemented since 2007
(Q3/2010: €–12.9 million, Q3/2009: €2.1 million); adjusted EBIT 2010 excludes
other operating income in connection with reimbursement of costs of efficiency pro-
grams amounting to €–0.4 million
Xetra segment Q1–3/2010:
Sales revenue decreased to €199.1 million in the first nine months of 2010 (Q1–3/2009: €220.6 million) due to the deconsolidation of Scoach Holding S.A. Adjusted for deconsolidation effects, sales revenue increased by 7 percent.
Operating costs amounted to €123.5 million (Q1–3/2009: €119.3 million). Adjusted for the costs of efficiency programs, the cost base was also reduced, mainly as a result of the deconsolidation of Scoach.
EBIT decreased by 10 percent to €79.1 million (Q1–3/2009: €87.7 million) due to the costs of effi-ciency programs.
Xetra segment: key figures Q1–3/2010 (adjusted for efficiency programs)1)
Q1–3/2010 Q1–3/2009 Q1–3/2010
(adjusted) Q1–3/2009
(adjusted) €m €m €m €m
Total cost 131.2 138.7 108.6 139.1
Operating cost 123.5 119.3 100.9 119.7
EBIT 79.1 87.7 101.7 87.3
1) Adjusted for effects of efficiency programs which have been implemented since 2007
amounting to €–22.6 million (Q1–3/2009: €0.4 million)
Third quarter of 2010:
Sales revenue decreased to €63.3 million (Q3/2009: €73.2 million) due to the deconsolidation of Scoach. Adjusted for the deconsolidation, sales revenue in-creased by 2 percent.
The segment’s operating costs amounted to €35.2 million (Q3/2009: €39.5 million).
EBIT decreased to €25.7 million (Q3/2009: €30.5 million), in particular due to the lower sales revenue.
Xetra segment: key figures Q3/2010 (adjusted for efficiency programs)1)
Q3/2010 Q3/2009 Q3/2010 (adjusted)
Q3/2009 (adjusted)
€m €m €m €m
Total cost 37.7 46.2 36.1 46.3
Operating cost 35.2 39.5 33.6 39.6
EBIT 25.7 30.5 27.3 30.4
1) Adjusted for effects of efficiency programs which have been implemented since 2007
amounting to €–1.6 million (Q3/2009: €0.1 million)

Group Management Report 7
The economic environment improved significantly year-on-year in the first nine months of 2010. As a result, demand from institutional and private investors for trading services provided by the Xetra segment increased. Large government deficits in some of the euro zone countries and the resulting decline of the euro versus the US dollar led to significant market volatility on the capital markets in the first half of the second quarter in particular, which in turn resulted in high trading volumes. In total, Xetra® trading volumes rose in the period to 30 September 2010 compared with the previous year: the number of electronic transactions in Xetra trading was up by 10 percent in the first nine months of 2010 to 141.0 million (Q1–3/2009: 128.4 million). The trading volume grew by 21 percent in the first nine months to €950.7 billion (Q1–3/2009: €786.5 billion). The Xetra segment also recorded a year-on-year increase in the third quarter, with the number of transactions climbing to 45.2 million (Q3/2009: 41.7 million) and the trading volume to €271.4 billion (Q3/2009: €266.2 billion). However, trading activity by market par-ticipants was down sharply compared with the second quarter of 2010. The average value of a Xetra transaction was €13.5 thou-sand in the first nine months (Q1–3/2009: €12.2 thou-sand) and €12.0 thousand in the third quarter (Q3/2009: €12.8 thousand). Deutsche Börse’s market share of DAX® securities stabilized at around 70 percent in the first nine months of 2010.
Besides institutional investors, who primarily use Xetra, trading activity was again somewhat higher among private investors than in the previous year. The floor-traded volume at the Frankfurt Stock Exchange amounted to €46.0 billion in the first nine months of 2010 (Q1–3/2009: €45.0 billion) and €13.2 billion in the third quarter (Q3/2009: €15.1 billion). Tradegate Exchange, a trading platform that, with extended trading hours and special order types, is now geared even more strongly towards meeting the needs of private investors, recorded a trading volume of €11.9 billion in the first nine months of 2010 and €3.8 billion in the third quar-ter. Tradegate continuously increased its proportion of the volume of traded shares in the course of the year and achieved a market share of around 27 percent in the third quarter, making it the second-largest German exchange for private investors – after the trading floor of the Frank-furt Stock Exchange. dwpbank has also been connected to Tradegate since the end of September. As a result, around 1,600 institutions (including Postbank, the Spar- kassen, i.e. savings banks, and Volks- und Raiffeisen-banken, i.e. cooperative banks) have access to this trad-ing venue. The costs in connection with efficiency programs of €22.6 million pushed segment operating costs in the first nine months to €123.5 million, slightly higher than in the prior-year period (Q1–3/2009: €119.3 million). Third-quarter expenses in connection with efficiency programs were only €1.6 million, resulting in a decrease in operat-ing costs to €35.2 million (Q3/2009: €39.5 million).
Xetra segment: Key indicators
Q3/2010 Q3/2009 Change Q1–3/2010 Q1–3/2009 ChangeTrading volume (order book turnover, single counted)
€bn €bn % €bn €bn %
Xetra® 271.4 266.2 2 950.7 786.5 21
Floor1) 13.2 15.1 –13 46.0 45.0 2
Tradegate 3.8 – – 11,9 – –
Transactions m m m m
Xetra 45.2 41.7 8 141.0 128.4 10
1) Excluding certificates and warrants

8 Group Management Report Financial Statements Notes
Breakdown of sales revenue in the Xetra segment
The decline in sales revenue led to a slight decline in EBIT to €79.1 million in the first nine months (Q1–3/2009: €87.7 million) and €25.7 million in the third quarter (Q3/2009: €30.5 million). For over ten years, Deutsche Börse has operated Europe’s leading marketplace for exchange-traded funds (ETFs). Since being introduced to Europe, the number of ETFs, as well as their assets under management, has grown stead-ily. At the end of the third quarter of 2010, 717 ETFs were listed on Deutsche Börse (Q3/2009: 496 ETFs). Assets under management held by ETF issuers amounted to €144.5 billion (Q3/2009: €106.9 billion). Although the XTF segment’s trading volume declined by 5 percent in the third quarter of 2010 to €33.5 billion (Q3/2009: €35.4 billion), Deutsche Börse maintained its position as the European market leader with a market share of 36 percent (Q3/2009: 40 percent). The most heavily traded ETFs are based on the European STOXX equity indices and on the DAX index. Deutsche Börse’s steadily growing range of innovative indices is helping to further develop the segment. Innovative indices and the ETFs based on them make entire themes, industries and mar-kets accessible to a broad group of investors at an attrac-tive price and enable a wide variety of trading strategies.
Since May 2010, investors have additionally been able to include options on ETFs in their trading strategies or to use them to hedge their investments. 15 options on ETFs issued by db x-trackers, Lyxor and Source are currently available. The segment’s success makes it attractive for issuers: 15 issuers have now listed ETFs on the Frankfurt Stock Exchange. Following record growth in the second quarter, sales of Xetra-Gold® issued by Deutsche Börse Commodities GmbH were flat in the third quarter compared with the previous quarter. Gold experiences particularly high de-mand in periods of economic uncertainty; as expected, gold holdings in Deutsche Börse Group’s vaults therefore declined slightly as investor confidence in the stability of the markets picked up again. As at 30 September, Deutsche Börse Commodities held 49.91 tons of gold in custody. Given a gold price of €30.72 per gram, the value of the gold was equivalent to more than €1.5 bil-lion. Xetra-Gold has been approved for sale to the public in the United Kingdom and the Netherlands since the third quarter of 2010. Investors in German-speaking countries (including Switzerland, Austria and Luxem-bourg) can now buy this product. Since 29 June, insur-ance companies in Germany have also been permitted to purchase Xetra-Gold in the amount of up to 5 percent of their restricted assets as part of their commodities ratio thanks to an amendment to the Verordnung über die Anlage des gebundenen Vermögens von Versicherungs-unternehmen (AnlV, German Regulation on the Invest-ment of the Restricted Assets of Insurance Companies). Two other factors demonstrate that Xetra-Gold is among the leading investment vehicles for precious metals: due to substantial market interest, Eurex has offered futures and options on Xetra-Gold since 28 September. And since 27 August, Xetra-Gold has been depositable as collateral with Eurex Clearing, Europe’s largest central counterparty. In the listing business, Deutsche Börse recorded 39 new admissions in the third quarter, including Ströer Out-of-Home Media AG’s IPO in the Prime Standard with an issue volume of around €371 million. In addition, two newcomers – Tonkens Agrar AG and the Chinese com-pany KINGHERO AG – were admitted to the Entry Stan-dard. The placement volume in the third quarter of 2010 totalled approximately €399 million. To convince inves-tors and issuers of the benefits of a listing on the Frank-furt Stock Exchange, Deutsche Börse organized the third China-Europe Equity Forum in Shanghai, an information

Group Management Report 9
and networking event. With around 400 participants, including investment banks, private equity investors, law firms, IPO consultants, auditors from China and Europe, and Chinese companies looking for capital, the forum has established itself as Deutsche Börse’s most important capital markets event in China. In the third quarter, Deutsche Börse Group expanded its new trading segment for European blue chips, Xetra In-ternational Market (XIM), to include stocks from Switzer-land and the United Kingdom. In the fourth quarter, Deutsche Börse will extend the offering to include shares from Austria, Denmark, Sweden, Norway and Portugal, thus increasing the range of stocks that investors can trade on XIM and settle in their domestic market. As a result of Deutsche Bank’s capital increase, investors were able to trade rights for the bank’s shares. A large proportion of the trading, especially involving interna-tional investors, was executed via Xetra. The rights were traded in continuous trading from 22 to 30 September 2010 and in a final auction on the last trading day, 1 October. The rights were among the most traded securities every day and recorded a trading volume of €2.0 billion. Following a resolution by the Exchange Council, floor trading in the Regulated Market and the Open Market is expected to be discontinued at the latest in 2012. This will simplify the infrastructure for all market participants and increase Frankfurt’s competitiveness as a trading venue. International market participants connected to Xetra will in future have direct access to all securities traded on the Frankfurt Stock Exchange. Eurex segment Q1–3/2010:
Sales revenue in the first nine months rose by 3 per-cent to €655.9 million (Q1–3/2009: €638.5 million).
Operating costs were up 7 percent year-on-year, at €323.4 million (Q1–3/2009: €303.0 million), due to the costs of efficiency programs.
EBIT decreased by 3 percent to €348.6 million due to the costs of efficiency programs (Q1–3/2009: €358.7 million).
Eurex segment: key figures Q1–3/2010 (adjusted for efficiency programs)1)
Q1–3/2010 Q1–3/2009 Q1–3/2010
(adjusted) Q1–3/2009
(adjusted) €m €m €m €m
Total cost 334.1 326.7 298.8 327.2
Operating cost 323.4 303.0 288.1 303.5
EBIT 348.6 358.7 383.3 358.2
1) Adjusted for effects of efficiency programs which have been implemented since 2007
amounting to €–34.7 million (Q1–3/2009: €0.5 million)
Q3/2010:
Eurex sales revenue decreased by 2 percent to €196.0 million (Q3/2009: €200.2 million).
Despite costs of efficiency programs, operating costs decreased by 6 percent to €96.3 million (Q3/2009: €102.4 million).
EBIT decreased by 6 percent to €97.0 million (Q3/2009: €102.9 million).
Eurex segment: key figures Q3/2010 (adjusted for efficiency programs)1)
Q3/2010 Q3/2009 Q3/2010 (adjusted)
Q3/2009 (adjusted)
€m €m €m €m
Total cost 99.6 108.3 97.0 108.4
Operating cost 96.3 102.4 93.7 102.5
EBIT 97.0 102.9 100.0 102.8
1) Adjusted for effects of efficiency programs which have been implemented since 2007
amounting to €–3.0 million (Q3/2009: €0.1 million)
Against the background of the more positive macro-economic climate, the Eurex segment increased the con-tract volume for its European products year-on-year. The upward trend that was apparent in the first half of the year continued in the third quarter. As expected, however, trading activity by market participants declined in com-parison with the second quarter. On the one hand, this was due to lower volatility on the equity and interest rate markets following the normalization of the various eco-nomic crisis scenarios that had dominated the second quarter (refinancing of government debt, turbulent credit spreads, decline of the euro/US dollar exchange rate). On the other, trading activity usually peaks in the second quarter due to the German dividend season and the re-sulting increase in the volume of equity derivatives.

10 Group Management Report Financial Statements Notes
In the third quarter of 2010, the Eurex segment recorded a trading volume for European futures and options of 404.4 million contracts (Q3/2009: 389.6 million), up 4 percent year-on-year. The first three quarters saw growth of 15 percent to 1,484.3 million contracts (Q1–3/2009: 1,290.7 million). However, trading vol-umes on the International Securities Exchange (ISE) in the third quarter declined 36 percent against the previous year due to several factors (see next page for details). Overall, 2,049.1 million contracts were traded on Deutsche Börse Group’s derivatives exchanges in the first nine months (Q1–3/2009: 2,042.8 million) and 563.6 million contracts in the third quarter (Q3/2009: 636.8 million). European traded equity index derivatives remained the highest-volume product group. They recorded a 2 percent increase in the first nine months of 2010 to 622.9 mil-lion contracts (Q1–3/2009: 613.4 million), but a 7 per-cent decrease to 182.1 million contracts in the third quarter (Q3/2009: 195.7 million). Lower equity market volatility and the resulting decline in the need for hedging by investors were the main drivers of trading activity in this product group. Due to the growing business with dividend derivatives, sales revenue for index derivatives slightly outperformed contract volumes in the first nine months and remained stable in the third quarter of 2010 despite lower trading activity. In the equity derivatives product group, contract volumes rose by 27 percent in the first nine months of 2010 to 424.1 million (Q1–3/2009: 333.3 million) and by 9 percent in the third quarter to 85.4 million (Q3/2009: 78.3 million). The positive development in this product group is mainly due to the significant increase in the
trading volume of single-stock futures, which roughly doubled compared with the prior-year quarter. As a result of the high proportion of Eurex-cleared block trades with a fee cap, sales revenue did not develop in proportion to the number of traded contracts. For some time, interest rate market participants have expected central banks to adjust their interest rate poli-cies and therefore interest rate levels. As a result, there was a sustained recovery in Eurex-traded contract vol-umes in the interest rate derivatives product group fol-lowing a sharp decline in volumes due to the financial crisis: Eurex has recorded significant year-on-year growth in each month of 2010, and in September achieved its best result since the financial crisis. Over-all, this led to an increase of 27 percent in the first nine months to 436.3 million contracts (Q1–3/2009: 344.0 million) and an 18 percent rise in the third quar-ter to 136.6 million contracts (Q3/2009: 115.6 mil-lion). Sales revenue increased in line with trading volumes. As expected, the trading volume in US options on ISE was severely under pressure in a highly competitive environment: in the first nine months, contracts traded by market participants fell by 25 percent compared with the prior-year period to 564.8 million (Q1–3/2009: 752.1 million). The number of contracts in the third quarter was down by 36 percent year-on-year to 159.2 million (Q3/2009: 247.2 million). ISE’s market share of US equity options was 20 percent in the first nine months (Q1–3/2009: 28 percent) and 18 percent in the third quarter of 2010 (Q3/2009: 27 percent). In addition, sales revenue is subject to exchange rate effects and does not exactly reflect volume development. There are several reasons for the development of vol-umes and market share:
Contract volumes in the derivatives market
Q3/2010 Q3/2009 Change Q1–3/2010 Q1–3/2009 Change m contracts m contracts % m contracts m contracts %
European equity index derivatives 182.1 195.7 –7 622.9 613.4 2
European equity derivatives 85.4 78.3 9 424.1 333.3 27
European interest rate derivatives 136.6 115.6 18 436.3 344.0 27
Total European derivatives (Eurex)1) 404.4 389.6 4 1,484.3 1,290.7 15
US options (ISE) 159.2 247.2 –36 564.8 752.1 –25
Total Eurex and ISE1) 563.6 636.8 –11 2,049.1 2,042.8 0
1) The total shown does not equal the sum of the individual figures as it includes other traded derivatives such as ETF, volatility, agricultural, precious metals and emission deriva-
tives.
Group Management Report 11
In the second half of 2009, the U.S. Securities and Exchange Commission instructed ISE to discontinue a certain order type for transacting large institutional crossing orders. The current regulatory structure favours floor-based exchanges in the ability to accommodate the industry’s institutional crossing business, and as a result, ISE’s crossing business migrated to the floor-based exchanges. ISE continues to be in contact with the SEC to resolve this regulatory inconsistency.
Dividend trade transactions, which are promoted through fee caps on some floor-based US equity options ex-changes, continue to give a distorted impression of trading volumes and market share on the US equity options market. ISE does not offer these incentives but has rather geared its focus towards profitable business.
Changes in the ownership structure of ISE’s competitors led to fluctuations in market share. In October 2009, NYSE Euronext announced that it would sell part of its Amex options market to leading market participants (remutualization). Since then, the participants in the transaction have directed order flow to the exchange. In order to make up for this, ISE will focus even more on the acquisition of new customers and on the intro-duction of additional products and functionalities.
The second quarter of 2010 saw further fee changes in the industry. In response to these modifications, ISE introduced a modified maker-taker fee schedule for 100 names which incentivizes market participants by providing a rebate to market makers who meet certain market quality thresholds. Against previous quarters, this step led to a stabilization in market share and in the average sales revenue per contract traded in the third quarter.
Due to still pending regulatory approval for certain func-tions and the subdued trend on the US options market, the probability that an impairment loss will be recognized on the other intangible assets acquired as part of the
acquisition of ISE has increased in the third quarter 2010. In case the sustainable business prospects for ISE do not improve, Deutsche Börse expects to recognize an impairment loss on the other intangible assets in the fourth quarter 2010. Eurex Repo further expanded its volume of collateralized money market business. The average outstanding volume rose by 14 percent in the first nine months to €110.7 billion (Q1–3/2009: €97.4 billion, single-counted for both periods) and by 17 percent to a new record of €118.1 billion in the third quarter (Q3/2009: €100.7 billion). The collateralized money market seg-ment GC Pooling® (General Collateral Pooling), which Eurex Repo operates jointly with Eurex Clearing and Clearstream, enables balance-sheet friendly and anony-mous money market trading in which standardized collat-eral baskets (a group of securities with similar quality features such as issuer credit rating) are traded and cleared via a central counterparty (Eurex Clearing). Average outstanding volumes reached a new record of €93.7 billion in the third quarter, an increase of 30 per-cent year-on-year (Q3/2009: €72.2 billion, single-counted for both periods). In the first three quarters of 2010, GC Pooling recorded growth of 25 percent to €88.3 billion (Q1–3/2009: €70.6 billion). Eurex Repo generates sales revenue from the fees charged for trading and clearing repo transactions. Moreover, trading in a new segment, USD GC Pooling®, has been possible since the end of January 2010. Costs of efficiency programs in the amount of €35.3 mil-lion recognized in the Eurex segment for the first nine months resulted in a year-on-year rise in operating costs. In the third quarter 2010, these costs amounted to only €2.6 million – accordingly, operating costs were below Q3/2009. EBIT decreased by 3 percent to €348.6 million in the first nine months, due to costs of efficiency pro-grams. Despite lower costs, EBIT declined by 6 percent year-on-year to €97.0 million in the third quarter of 2010, mainly due to lower total revenues and impairment losses on software and minor equity investments.

12 Group Management Report Financial Statements Notes
Breakdown of sales revenue in the Eurex segment
Eurex operates an international market for emission rights together with European Energy Exchange (EEX). Under this cooperation, which was launched in December 2007, Eurex participants can trade the CO2 derivatives products listed on EEX via their existing infrastructure and a simplified admission process. The cooperation’s trading volume and market share increased significantly in the third quarter. This was mainly attributable to the launch of a new EUA future for the third European emissions trading period and the extension of exchange trading hours for CO2 futures. New products give derivatives market participants new impetus for their investment, hedging and arbitrage strategies. In the third quarter, Eurex again expanded its portfolio in several asset classes. The new instruments include additional options on leading ETFs, futures and options on EURO STOXX® and STOXX® Europe 600 indi-ces, as well as a future on short-term Italian government bonds (tradable since 18 October). The futures and op-tions on Xetra-Gold launched by Eurex on 28 September extend the commodity derivatives asset class. The fact
that a new asset class not only expands the portfolio but can also make a substantial value contribution is demon-strated by dividend derivatives: at 3.4 million contracts, this product continued to record strong growth in the first nine months (Q1–3/2009: 1.7 million) and accounted for 3 percent of sales revenue in the equity index derivatives product group. The expansion of Eurex’s product range and distribution network again focused on the Asia growth region in the third quarter:
On 30 August, Eurex and Korea Exchange (KRX), a leading Asian exchange, launched a Eurex/KRX link. This move enables cooperation in the trading and clearing of options on the Korean KOSPI 200 blue-chip index via Eurex during European and North American trading hours. For the first time, KOSPI 200 options will be available worldwide outside Korean trading hours. This extends the global product range for Eurex customers and offers them access to the most liquid Asian index product.
Eurex is cooperating with Singapore Exchange (SGX) with regard to the introduction of EURO STOXX 50 in-dex futures and options on EURO STOXX 50 index fu-tures in Asia. Subject to the approval of the supervisory authority in Singapore, EURO STOXX 50 index futures and options on EURO STOXX 50 index futures de-nominated in US dollars will be listed on SGX in the fourth quarter. Through this cooperation, Eurex extends the user base of Europe’s most liquid index derivatives contract.
On 4 October, Eurex and the Indian exchange operator Bombay Stock Exchange (BSE) launched futures and options on the SENSEX blue-chip index. This index tracks the daily share price performance of 30 of the largest and most traded companies that are listed on BSE. This offers Eurex customers additional investment opportunities in a fast-growing and emerging economic area.
In September, Eurex connected five market participants from Taiwan to its international distribution network for the first time. Including these new Taiwanese partici-pants, 19 members from five Asian countries now trade on Eurex.

Group Management Report 13
Clearstream segment Q1–Q3/ 2010:
Sales revenue increased by 2 percent to €569.6 mil-lion (Q1–3/2009: €556.4 million).
Net interest income dropped to €42.5 million (Q1–3/2009: €79.7 million), a minus of 47 percent.
Operating costs increased by 12 percent to €283.8 million (Q1–3/2009: €253.2 million), due to costs of efficiency programs.
EBIT went down by 19 percent to €222.5 million (Q1–3/2009: €275.6 million).
Clearstream segment: key figures Q1–3/2010 (adjusted for efficiency programs)1)
Q1–3/2010 Q1–3/2009 Q1–3/2010
(adjusted) Q1–3/2009
(adjusted) €m €m €m €m
Total cost 406.9 378.5 351.2 390.3
Operating cost 283.8 253.2 228.1 265.0
EBIT 222.5 275.6 278.2 263.8
1) Adjusted for effects of efficiency programs which have been implemented since 2007
amounting to €–55.7 million (Q1–3/2009: €11.8 million)
Q3/2010:
Sales revenue increased by 4 percent to €189.8 mil-lion (Q3/2009: €182.1 million).
Net interest income from banking business decreased by 28 percent to €15.8 million (Q3/2009: €21.9 mil-lion).
Operating costs decreased by 4 percent to €84.2 mil-lion (Q3/2009: €88.0 million).
EBIT remained stable at €83.2 million (Q3/2009: €83.7 million).
Clearstream segment: key figures Q3/2010 (adjusted for efficiency programs)1)
Q3/2010 Q3/2009 Q3/2010 (adjusted)
Q3/2009 (adjusted)
€m €m €m €m
Total cost 125.2 128.8 119.5 130.7
Operating cost 84.2 88.0 78.5 89.9
EBIT 83.2 83.7 88.9 81.8
1) Adjusted for effects of efficiency programs which have been implemented since 2007
amounting to €–5.7 million (Q3/2009: €1.9 million)
In the custody business, the average value of assets under custody in the first nine months of 2010 in-creased by 6 percent year-on-year, reaching €10.8 tril-lion (Q1–3/2009: €10.2 trillion). The average value of assets under custody in the third quarter 2010 in-creased by 3 percent to €10.9 trillion (Q3/2009: €10.5 trillion). Clearstream recorded an 8 percent increase in the average value of assets under custody on its international platform for the first nine months, to €5.8 trillion (Q1–3/2009: €5.4 trillion), and a 7 percent growth to €5.8 trillion for Q3/2010 (Q3/2009: €5.5 trillion). German domestic assets increased by 3 percent, to €5.0 trillion in the first nine months (Q1–3/2009: €4.9 trillion). The third quarter 2010, on the other hand, with €5.0 trillion shows a stable development in the average of assets under custody (Q3/2009: €5.0 trillion). The overall growth year-on-year was mainly due to the recovery in the market value of equities. As a result, sales revenue in the custody business went up by 3 percent to €337.4 million for the first nine months (Q1–3/2009: €329.0 million) and by 3 percent to €113.7 million for Q3/2010 (Q3/2009: €110.5 million).
14 Group Management Report Financial Statements Notes
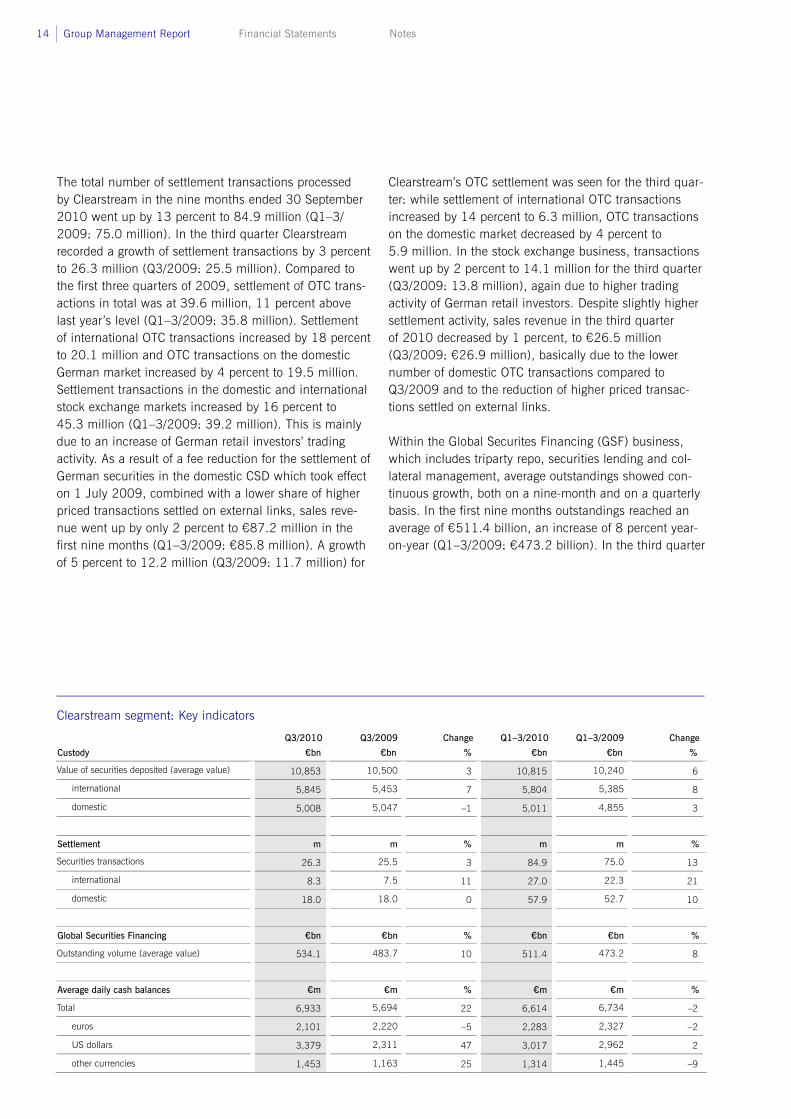
The total number of settlement transactions processed by Clearstream in the nine months ended 30 September 2010 went up by 13 percent to 84.9 million (Q1–3/ 2009: 75.0 million). In the third quarter Clearstream recorded a growth of settlement transactions by 3 percent to 26.3 million (Q3/2009: 25.5 million). Compared to the first three quarters of 2009, settlement of OTC trans-actions in total was at 39.6 million, 11 percent above last year’s level (Q1–3/2009: 35.8 million). Settlement of international OTC transactions increased by 18 percent to 20.1 million and OTC transactions on the domestic German market increased by 4 percent to 19.5 million. Settlement transactions in the domestic and international stock exchange markets increased by 16 percent to 45.3 million (Q1–3/2009: 39.2 million). This is mainly due to an increase of German retail investors’ trading activity. As a result of a fee reduction for the settlement of German securities in the domestic CSD which took effect on 1 July 2009, combined with a lower share of higher priced transactions settled on external links, sales reve-nue went up by only 2 percent to €87.2 million in the first nine months (Q1–3/2009: €85.8 million). A growth of 5 percent to 12.2 million (Q3/2009: 11.7 million) for
Clearstream’s OTC settlement was seen for the third quar-ter: while settlement of international OTC transactions increased by 14 percent to 6.3 million, OTC transactions on the domestic market decreased by 4 percent to 5.9 million. In the stock exchange business, transactions went up by 2 percent to 14.1 million for the third quarter (Q3/2009: 13.8 million), again due to higher trading activity of German retail investors. Despite slightly higher settlement activity, sales revenue in the third quarter of 2010 decreased by 1 percent, to €26.5 million (Q3/2009: €26.9 million), basically due to the lower number of domestic OTC transactions compared to Q3/2009 and to the reduction of higher priced transac-tions settled on external links. Within the Global Securites Financing (GSF) business, which includes triparty repo, securities lending and col-lateral management, average outstandings showed con-tinuous growth, both on a nine-month and on a quarterly basis. In the first nine months outstandings reached an average of €511.4 billion, an increase of 8 percent year-on-year (Q1–3/2009: €473.2 billion). In the third quarter
Clearstream segment: Key indicators
Q3/2010 Q3/2009 Change Q1–3/2010 Q1–3/2009 Change
Custody €bn €bn % €bn €bn %
Value of securities deposited (average value) 10,853 10,500 3 10,815 10,240 6
international 5,845 5,453 7 5,804 5,385 8
domestic 5,008 5,047 –1 5,011 4,855 3
Settlement m m % m m %
Securities transactions 26.3 25.5 3 84.9 75.0 13
international 8.3 7.5 11 27.0 22.3 21
domestic 18.0 18.0 0 57.9 52.7 10
Global Securities Financing €bn €bn % €bn €bn %
Outstanding volume (average value) 534.1 483.7 10 511.4 473.2 8
Average daily cash balances €m €m % €m €m %
Total 6,933 5,694 22 6,614 6,734 –2
euros 2,101 2,220 –5 2,283 2,327 –2
US dollars 3,379 2,311 47 3,017 2,962 2
other currencies 1,453 1,163 25 1,314 1,445 –9

Group Management Report 15
of 2010 the outstandings grew by 11 percent year-on-year to €534.1 billion (Q3/2009: €483.7 billion). The rise reflects the growing importance of secured financing and the continued move of collateral towards central international liquidity pools. In particular, collateral man-agement services significantly contributed to the increase of volumes. The Euro GC Pooling® service, offered in co-operation with Eurex, continued to show a strong growth in outstandings, reaching a daily average of €88.3 billion for the first three quarters and €93.7 billion for the third quarter (Q1–3/2009: €70.6 billion, Q3/2009: €72.2 bil-lion). Despite the rise in overall GSF volumes, sales revenue in the GSF business decreased by 3 percent to €50.8 million for the first nine months (Q1–3/2009: €52.6 million), mainly because of a decline of the market prices for securities as collateral in the first two quarters, which account for Clearstream’s sales revenue in this business area. However, the third quarter taken into account separately, shows a reversal of this trend. In addition, due to significantly higher volumes in the lend-ing business (Automated Securities Lending, Automated Securities Lending Plus and Lending Management Sys-tem), sales revenue grew by 6 percent to €17.7 million (Q3/2009: €16.7 million). On a net basis, sales revenue for the third quarter even increased by 34 percent.
Breakdown of sales revenue in the Clearstream segment
Average overnight customer cash deposits slightly de-creased to €6.6 billion in the first nine months 2010 (Q1–3/2009: €6.7 billion), but showed an increase in the course of the year, to reach €6.9 billion in the third quarter (Q3/2009: €5.7 billion). Net interest income from banking business decreased by 47 percent to €42.5 million in the nine months to 30 September 2010 (Q1–3/2009: €79.7 million), and, with €15.8 million in Q3/2010, was still considerably lower than last year (Q3/2009: €21.9 million). This is due to extremely low short-term interest rates, the expiry of an interest rate hedge in 2009 as well as longer-term investments reach-ing maturity. The segment’s operating costs in the first nine months went up to €283.8 million due to €55.7 million costs of efficiency programs. In the third quarter costs of effi-ciency programs stood at just €5.7 million and, conse-quently, operating costs decreased year-on-year. In addi-tion, Clearstream’s staff costs in 2009 were reduced by the one-off effect of reversing a previous provision of some €11 million relating to the relocation of business areas to Prague. The costs of efficiency programs together with the decrease in net interest income from banking business led to a decrease of Clearstream’s EBIT for both the first nine months and the third quarter of 2010.
Settlement and safekeeping of Eurobonds is Clearstream’s core business. While the trading as well as the post-trading landscape has substantially changed in the past years, it is Clearstream’s goal to bring simplicity to the post-trade services industry by offering the complete range of services through a single window. In the emerg-ing European market infrastructure, Clearstream will continue to build competitiveness in the cross-border securities processing area through interoperability and partnerships.

16 Group Management Report Financial Statements Notes
One project in this context is REGIS-TR, a joint initiative of Bolsas y Mercados Españoles (BME), the Spanish stock exchange operator, and Clearstream. REGIS-TR is a European central register where all contracts agreed over a wide variety of derivative financial instruments traded OTC can be registered. REGIS-TR facilitates administrative tasks and helps improve the operational management of these transactions. The trade repository fully complies with all new regulatory proposals that have been made public in the context of the European Commission’s pro-posed European Market Infrastructure Regulation and that aim at increasing the transparency in the OTC derivatives market. REGIS-TR will be rolled out to customers before the end of the year and provides early compliance with the upcoming regulation. Clearstream continues to invest in the Asia-Pacific growth region and expanded its existing link to Hong Kong. As of 27 September 2010, the Chinese Renminbi (RMB) held outside of mainland China became a full settlement cur-rency in Clearstream, an important breakthrough for in-vestors. The new offering applies to RMB held in Clear-stream’s Cash Correspondent Bank. BOC International Holdings Limited (BOCI) will be the first market partici-pant to issue securities denominated in RMB – Standard Chartered Bank (Hong Kong) Limited will be another key issuer – that can be safekept by an International Central Securities Depository (ICSD), under the new regulation. With Clearstream’s adoption of the RMB as an inter-national investment currency, customers are now able to buy and hold RMB denominated investment products in Hong Kong.These developments mark a new milestone for the ongoing evolution of the Asian markets in the international financial environment. Clearstream’s network currently reaches 47 domestic markets around the globe: 30 in Europe, 5 in the Amer-icas, 10 in the Asia Pacific region and 2 in Middle-East and Africa. It is the widest network of any ICSD and enables counterparties in local markets to efficiently settle eligible securities through Clearstream’s operational hubs in Luxembourg and Singapore.
In the most recent “Agents Banks in Major Markets Sur-vey” conducted by Global Custodian magazine, Clear-stream was top-rated for the seventh consecutive year. Clearstream was the only top-rated ICSD in the “Leading Clients” category. It also received 10 out of 11 “Best in Class” awards in this category and was again top-rated in the “Cross-Border” category. Respondents to this annual survey – regarded as one of the most important surveys in the securities industry – grade their agent banks and ICSDs on the quality of their service. Market Data & Analytics segment Q1–Q3/2010:
Following the full consolidation of STOXX Ltd., sales revenue rose by 16 percent in the first nine months to €163.3 million (Q1–3/2009: €140.8 million).
Operating costs were up 43 percent year-on-year, at €88.9 million (Q1–3/2009: €62.1 million) due to the full consolidation of STOXX and the cost of efficiency programs.
EBIT increased by 18 percent to €96.9 million (Q1–3/2009: €82.1 million).
Market Data & Analytics segment: key figures Q1–3/2010 (adjusted for efficiency programs)1)
Q1–3/2010 Q1–3/2009 Q1–3/2010
(adjusted) Q1–3/2009
(adjusted) €m €m €m €m
Total cost 104.4 77.5 95.3 77.5
Operating cost 88.9 62.1 78.8 62.1
EBIT 96.9 82.1 106.0 82.1
1) Adjusted for effects of efficiency programs which have been implemented since 2007
amounting to €–9.1 million (Q1–3/2009: €0 million)
Third quarter of 2010:
Following the full consolidation of STOXX Ltd., segment sales revenue rose by 22 percent to €55.2 million (Q3/2009: €45.4 million).
Operating costs amounted to €29.9 million (Q3/2009: €19.8 million).
EBIT increased by 44 percent year-on-year to €38.2 million (Q3/2009: €26.6 million) mainly due to the gain on the sale of the stake in Avox Ltd.

Group Management Report 17
Market Data & Analytics segment: key figures Q3/2010 (adjusted for efficiency programs)1)
Q3/2010 Q3/2009 Q3/2010 (adjusted)
Q3/2009 (adjusted)
€m €m €m €m
Total cost 34.7 25.0 31.7 25.0
Operating cost 29.9 19.8 26.9 19.8
EBIT 38.2 26.6 41.2 26.6
1) Adjusted for effects of efficiency programs which have been implemented since 2007
amounting to €–3.0 million (Q3/2009: €0 million)
Since Deutsche Börse increased its interest in STOXX Ltd. to 50 percent plus one share in the fourth quarter of 2009 and is able to exercise control, STOXX Ltd. is now fully consolidated in financial year 2010. The same ap-plies to the US financial news agency Need to Know News, in which Market News International (MNI) had acquired a 100 percent interest in November 2009 and which the Group consolidates since that time. The sales revenue of Market Data & Analytics increased due to the consolidation of STOXX Ltd. and Need to Know News, among other factors. However, even excluding these changes in the Group structure, the segment lifted its sales revenue by 1 percent in the first nine months and by 7 percent in the third quarter. Despite sustained cost pressure in the financial services sector, Market Data & Analytics recorded stable overall sales of licenses for real-time data – which continue to account for the largest proportion of the segment’s sales revenue. It gained additional licensees for the purely machine-readable (non-display) use of this data. The AlphaFlash® data feed, a service for machine-readable data of macroeconomic indicators launched in March 2010, is also growing due to both new customers and the distribution of the data feed to additional data centers at existing customers. Market Data & Analytics will launch AlphaFlash on the Asia market in the fourth quar-ter and enrich it with key indicators from China, Japan and Australia.
In the index business, the fee model adjusted as at 1 January became effective in the third quarter: following the general practice in the international index business, the segment has since made the latest detailed parame-ters relating to the composition of an index available to registered customers only. A positive side effect of the switch is that Market Data & Analytics gained additional customers that were not previously direct contractual partners of Deutsche Börse. Sales revenue in the index business was also positively impacted by the ETF market, which continued to grow overall despite partial outflows in the blue-chip sector. In this market, the segment bene-fits directly from the assets managed via ETFs. It is devel-oping new indices as underlyings for ETFs, e.g. the ShortSupersector indices, which allow for short invest-ment strategies on one of the 19 STOXX Supersector indices. Other innovative indices such as the EURO STOXX 50 Risk Control 20% Index focus on risk control.
The back office data business was stable in the third quarter. The segment offset the decline in demand for the TRICE® service – which Deutsche Börse uses to support securities firms in meeting their reporting requirements – through successful sales of historical data.
Expenses for efficiency programs of €9.1 million were recognized in the Market Data & Analytics segment in the first three quarters and of €3.0 million in the third quar-ter of 2010. EBIT was also negatively impacted by a €3.2 million goodwill impairment for Infobolsa S.A., which is consolidated in full. However, the segment could increase its EBIT year-on-year, mainly due to the sale of the equity interest in Avox Ltd.
In order to focus the Market Data & Analytics segment’s activities on tradable information, such as indices, benchmarks and trading signals, Deutsche Börse sold its 77 percent interest in Avox Ltd. to the US company De-pository Trust & Clearing Corporation. The transaction resulted in a €10.7 deconsolidation effect that was re-flected in earnings in the third quarter.

18 Group Management Report Financial Statements Notes
Financial position Cash flow Deutsche Börse Group generated cash flow from operat-ing activities of €675.5 million in the first nine months of 2010 (Q1–3/2009: €592.8 million). The basic operating cash flow per share amounted to €3.63 (Q1–3/2009: €3.19). The changes in operating cash flow are due to the following factors:
The decline in net profit by €52.6 million to €493.2 million.
A cash inflow of €32.2 million (Q1–3/2009: cash inflow of €13.7 million) primarily due to the increase of noncurrent provisions, amongst others in connection with the costs of efficiency programs.
A cash inflow of €34.9 million (Q1–3/2009: cash in-flow of €19.7 million) due to the decline in receivables and other assets, primarily in connection with the set-tlement of the financial loss liability insurance policy that was terminated in the fourth quarter of 2009. The cash inflow in the previous year was mainly due to the fall in receivables from the CCP business, trade receiv-ables and associate receivables.
A cash inflow of €54.2 million (Q1–3/2009: cash out-flow of €79.1 million) due to an increase in current liabilities. The increase was mainly due to an increase in other current provisions related to costs of efficiency programs. The cash outflow in the previous year was primarily due to the decline in other current provisions relating to share-based payments and trade payables.
The cash outflow from investing activities amounted to €620.9 million in the first nine months of 2010 (Q1–3/2009: cash outflow of €1,865.2 million), primarily because the Group continued to increase its investments in securites with an original maturity of more than one year and in current receivables, securities and liabilities from banking business with an original maturity of more than three months, although by less than in the prior year period, in order to partially compensate for low short-term interest rates.
Cash outflows from financing activities amounted to €488.2 million (Q1–3/2009: cash outflow of €477.9 million). The cash flow from financing activities regularly contains effects from dividend payments and liabilities that are taken out or repaid for short-term liquidity management under the Company’s commercial paper program. The dividend payment in May 2010 for financial year 2009 amounted to €390.5 million. In addi-tion, a net cash outflow of €89.8 million in the first nine months of 2009 relating to the repayment of current liabilities (commercial paper) is comparable to a cash outflow of €97.2million in the first nine months of 2010 resulting from the partial redemption of a hybrid bond. Cash and cash equivalents as at 30 September 2010 therefore amounted to €–715.5 million (30 September 2009: €–1,301.8 million). At €585.8 million free cash flow, i.e. cash flows from operating activities less pay-ments to acquire intangible assets and property, plant and equipment, was above the previous year’s level due to the increase in operating cash flow (Q1–3/2009: €532.5 million). Capital management Deutsche Börse Group’s capital management principles remain unchanged: the Group aims at a dividend distribu-tion ratio of 40 to 60 percent of consolidated net income for the year and executes share buy-backs in order to dis-tribute funds not required for the Group’s operating busi-ness and further development to its shareholders. The principles take into account capital requirements, which are derived from the Group’s capital and liquidity needs from legal, regulatory, credit rating and economic capital perspectives. To ensure the continued success of the Clearstream segment, which is active in securities cus-tody and settlement, the Company aims to retain Clear-stream Banking S.A.’s strong “AA” credit rating. Deutsche Börse AG also needs to maintain a strong credit profile for the benefit of the activities at its subsidiary Eurex Clearing AG.

Group Management Report 19
Customers expect their service providers to maintain conservative interest coverage and debt/equity ratios and thus maintain strong credit ratings. Deutsche Börse Group therefore continues to pursue the objective of reaching an interest coverage ratio (ratio of EBITDA to interest expenses from financing activities) of at least 16 at the Group level. Adjusted for the cost of efficiency programs as part of the operating efficiency program, Deutsche Börse Group achieved this target in the first nine months of 2010 with an interest coverage ratio of 17.8. The interest coverage ratio is based on a relevant interest expense of €54.5 mil-lion and EBITDA adjusted for the cost of efficiency pro-grams of €969.7 million. For the third quarter of 2010 the interest coverage ratio is 16.7 based on a relevant interest expense of €17.8 million and EBITDA adjusted for the cost of efficiency programs of €296.4 million. To strengthen the interest coverage ratio, the Group repur-chased – until 30 September 2010 – a total of €93.0 million (nominal amount) of the hybrid bond issued in 2008, mostly in the second quarter. This measure reduces the interest expense and improves the interest coverage ratio. On 28 May 2010, Deutsche Börse AG paid a dividend of €2.10 per share for financial year 2009, unchanged from the previous year. The distribution ratio, adjusted for the ISE impairment charge recognized in the fourth quarter of 2009, is 56 percent of net income (2008: 38 percent). Net assets As at 30 September 2010, Deutsche Börse Group’s non-current assets amounted to €5,557.1 million (30 Sep-tember 2009: €4,953.6 million). They consisted primar-ily of intangible assets and financial assets. Intangible assets included goodwill of €2,037.9 million (30 Sep-tember 2009: €1,949.1 million) and other intangible assets of €1,358.8 million (30 September 2009:
€1,272.8 million). The ISE impairment charge amounting to €415.6 million recognized in the fourth quarter of 2009 had a reducing effect on intangible assets while the consolidation of STOXX Ltd. increased the intangible as-sets. In addition, the US dollar exchange rate caused a rise in the goodwill and other intangible assets, particu-larly in connection with ISE. Noncurrent receivables and securities from banking business of €1,676.5 million (30 September 2009: €1,257.0 million) represented the largest part of financial assets, which amounted to €1,919.5 million as at the balance sheet date (30 Sep-tember 2009: €1,497.7 million). This increase also caused the increase in total noncurrent assets compared with 30 September 2009. Noncurrent assets may be compared with equity in the amount of €3,476.9 million (30 September 2009: €3,118.8 million) and noncurrent liabilities in the amount of €2,076.1 million (30 September 2009: €2,170.5 million). Noncurrent liabilities mainly related to interest-bearing liabilities from the long-term financing of the ISE transaction of €1,447.6 million (30 Septem-ber 2009: €1,502.6 million) and deferred taxes of €463.4 million (30 September 2009: €552.2 million). Changes in current liabilities were the result of, among other things, the decline in other current liabilities to €350.2 million (30 September 2009: €404.8 million), primarily because of the decrease in current financial instruments (commercial paper). No commercial paper was outstanding as at the end of the third quarter of 2010 (30 September 2009: €110.0 million). Overall, Deutsche Börse Group invested €89.7 million (Q1–3/2009: €60.3 million) in intangible assets and property, plant and equipment in the first nine months of 2010 – 49 percent more than in the prior-year period. The investments were made in particular in the Eurex and Clearstream segments.
20 Group Management Report Financial Statements Notes
Risk report
Deutsche Börse Group provides detailed information on its risk management strategy, organization, processes and methods in its annual report. Risk management is a fundamental component of man-agement and control within Deutsche Börse Group, which has therefore established a Group-wide risk management concept. This comprises roles, processes and responsibili-ties and is binding on all staff and organizational entities. The concept ensures that emerging risks can be identified and dealt with appropriately at an early stage. The Executive Board is responsible for the management of all risks. Responsibility for the risk management pro-cesses within Deutsche Börse Group is based on a division of labour. The front office areas are responsible for identi-fying risks and reporting these promptly to Group Risk Management (GRM), a central function with Group-wide responsibilities. GRM assesses all new and existing risks and reports these on a monthly basis to the Executive Board and on a quarterly basis to the Supervisory Board. In special cases, GRM also reports to these boards on an ad hoc basis. Risk control is performed in the front office areas, i.e. in the areas where the risks occur. The Group uses the concept of “value at risk” (VaR) to measure and report all risks. The Group’s models are based on a one-year time horizon and assume uncorrelated events; the calculation is performed for different confidence levels. In addition, stress tests are performed for key risk drivers. The most substantial operating risks for Deutsche Börse Group relate to the non-availability of its trading, clearing and settlement systems as well as to the incorrect pro-cessing of customer instructions in the custody business. The Group manages availability risk through intensive activities in the field of business continuity management. The risk of incorrect processing is mitigated through a reduction in the amount of manual intervention necessary or through better protection. There are also legal risks and risks associated with business practices. In addition, accidents or natural hazards as well as sabotage and terrorism could lead to financial losses.
Deutsche Börse Group’s financial performance also de-pends on its external environment. It could be impacted by external factors such as interest rates, GDP growth and financial market performance and volatility. A lack of investor confidence in the financial markets could also have a negative effect on the Group’s financial perform-ance. Regulatory measures represent an additional busi-ness risk. On the one hand, they could adversely affect Deutsche Börse Group’s competitive position; on the other, they could also impact the business models of Deutsche Börse Group’s customers and reduce their de-mand for the Group’s products and services. Moreover, Deutsche Börse Group is exposed to the risk of changes in its competitive environment. For example, it cannot be ruled out that Deutsche Börse Group’s financial perform-ance will deteriorate due to fierce competition for market share in individual business areas. This could mean that intangible assets have to be partially or fully written down following an impairment test. Due to still pending regulatory approval for certain func-tions and the subdued trend on the US options market, the probability that an impairment loss will be recognized on the other intangible assets acquired as part of the acquisition of ISE has increased in the third quarter 2010. In case the sustainable business prospects for ISE do not improve, Deutsche Börse expects to recognize an impairment loss on the other intangible assets in the fourth quarter 2010. Deutsche Börse Group is exposed to financial risks mainly in the form of credit risk at the subsidiaries of Clearstream Holding AG and at Eurex Clearing AG. There is also lim-ited market risk from investments and liquidity risk. The majority of investments involve transactions for which securities are received as collateral. This minimizes liquidity risks from such investments. The Group evaluates its risk situation on an ongoing basis in order to take mitigating actions at an early stage. In the view of the Executive Board, no threat to the continued existence of the Group can be identified at this time.

Group Management Report 21
Report on expected developments
The report on expected developments describes the expected development of Deutsche Börse Group in the current and in the next financial year. It contains state-ments on expectations and assumptions relating to the future as at the time of publication of this report on ex-pected developments. Forward-looking statements are by nature subject to risks and uncertainty factors, in particu-lar because many of these factors are outside the Group’s control. Thus, the actual development of the Group could deviate substantially from the assumptions made at the time of publication of this report on expected develop-ments. The Company has no obligation to update for-ward-looking statements as a result of new information or future events. Development of results of operations The forecasts for economic growth in the course of 2010 have been increased as compared to the fore-casts for the development of operating environment that were made in the consolidated financial statements 2009. Instead of about 1.5 percent, which was origi-nally expected, the Company now anticipates GDP growth of about 3.5 percent. Accordingly, growth in the euro zone is expected to increase by about 1 percent-age point to about 1.5 to 2 percent. For the remainder of financial year 2010, Deutsche Börse Group expects no additional significant deviations from the forecasts for its operating environment that were made in the consolidated financial statements for full-year 2009. Based on the assumption that overall conditions will continue to develop positively in the forecast period, Deutsche Börse Group considers itself well positioned to achieve growth in sales revenue and earnings (the latter adjusted for restructuring expenses and the ISE impair-ment charge recognized in the fourth quarter of 2009) in the forecast period as compared to the previous year. At the time this report on expected developments was pre-pared, the financial markets had not yet returned to nor-mal despite indications of an economic recovery. In addition, events in the context of Greece’s debt crisis and the tight financial situation in further EU countries
have increased uncertainty in 2010. Investors’ confi-dence, for example, has declined continuously on a global level in the course of the year. This situation makes it diffi-cult to make a statement on the sustainability of the busi-ness recovery in the forecast period. The year 2009 has shown, however, that Deutsche Börse Group with its integrated business model and its flexible planning and control systems can adjust to a changed market environ-ment. If the business environment does not recover to the extent expected, the Group believes it is in a good posi-tion to continue to do business profitably due to its inte-grated business model and the cost reduction measures that have already been implemented and that are planned. If the recovery in the financial markets is stronger and the rise in short-term interest rates comes earlier than expected, this will have a correspondingly positive effect on the Group’s earnings situation. The measures to increase operational efficiency commu-nicated in the first quarter of 2010 will have a positive impact on earnings from 2011 onward. They are ex-plained in more detail above under results of operations. Due to the encouraging cost trend in the first nine months of 2010, the Company is lowering its cost guidance for 2010 from the maximum of €1,210 million forecast originally to around €1,150 million before costs of effi-ciency programs. Development of the Group’s financial position The Group expects operating cash flow to remain positive. As part of its cash flow from investing activities, Deutsche Börse plans to invest around €120 million per year in intangible assets and property, plant and equipment dur-ing the forecast period. These investments will serve primarily to develop new and enhance existing products and services in the Xetra, Eurex and Clearstream seg-ments. The difference in investment volume compared with previous years is primarily the result of the joint trading infrastructure for Deutsche Börse Group which is presently being developed. Under its capital management principles, Deutsche Börse will react flexibly to a changing market environment in the forecast period. Deutsche Börse Group continues to pursue the objective of achieving an interest cover ratio (ratio of EBITDA to interest expenses from financing activities) of at least 16 at Group level.

22 Group Management Report Financial Statements Notes
Consolidated Income Statement for the period 1 January to 30 September 2010
Quarter ended Nine months ended 30 Sep. 2010 30 Sep. 2009 30 Sep. 2010 30 Sep. 2009 €m €m €m €m
Sales revenue 504.3 500.9 1,587.9 1,556.3
Net interest income from banking business 15.8 21.9 42.5 79.7
Other operating income 11.7 18.7 48.8 53.8
Total sales revenue 531.8 541.5 1,679.2 1,689.8
Volume-related costs – 51.6 – 58.6 – 157.0 – 183.8
Total sales revenue less volume-related costs 480.2 482.9 1,522.2 1,506.0
Staff costs – 105.8 – 103.8 – 411.3 – 307.6
Depreciation, amortization and impairment losses – 39.0 – 32.7 – 100.5 – 100.3
Other operating expenses – 90.6 – 106.4 – 273.0 – 310.0
Operating costs1) – 235.4 – 242.9 – 784.8 – 717.9
Result from equity investments – 0.7 3.7 9.7 16.0
Earnings before interest and tax (EBIT) 244.1 243.7 747.1 804.1
Financial income 6.5 4.2 15.3 48.3
Financial expense – 25.1 – 24.0 – 86.6 – 104.8
Earnings before tax (EBT) 225.5 223.9 675.8 747.6
Income tax expense – 61.0 – 60.2 – 182.6 – 201.8
Net profit for the period 164.5 163.7 493.2 545.8
thereof shareholders of parent company (net income for the period) 161.3 158.3 479.0 529.1
thereof non-controlling interests 3.2 5.4 14.2 16.7
Earnings per share (basic) (€) 0.87 0.85 2.58 2.85
Earnings per share (diluted) (€) 0.87 0.85 2.57 2.84
1) Including effects for efficiency programs: in the amount of €12.9 million (30 September 2009: €–2.1 million) for the third quarter ended 30 September 2010 and in the amount of €122.7 million (30 September 2009: €–12.7 million) for the nine months ended 30 September 2010

Financial Statements 23
Consolidated Statement of Comprehensive Income for the period 1 January to 30 September 2010
Quarter ended Nine months ended 30 Sep. 2010 30 Sep. 2009 30 Sep. 2010 30 Sep. 2009 €m €m €m €m
Net profit for the period reported in consolidated income statement 164.5 163.7 493.2 545.8
Exchange rate differences1) – 152.9 – 55.6 76.6 – 59.5
Remeasurement of cash flow hedges 5.3 – 7.2 0.8 – 7.9
Remeasurement of other financial instruments 2.5 13.3 – 11.0 13.1
Deferred taxes 49.6 13.6 – 20.6 15.4
Other comprehensive income/(expense) – 95.5 – 35.9 45.8 – 38.9
Total comprehensive income 69.0 127.8 539.0 506.9
thereof shareholders of parent company 93.8 132.3 510.5 500.9
thereof non-controlling interests – 24.8 – 4.5 28.5 6.0
1) Exchange rate differences include the following amounts that were taken directly to accumulated profit as part of the result from equity investments: €–10.4 million (30 September 2009: €–3.6 million) for the third quarter ended 30 September 2010 and €3.7 million (30 September 2009: €–3.9 million) for the nine months ended 30 September 2010.

24 Group Management Report Financial Statements Notes
Consolidated Balance Sheet as at 30 September 2010
30 Sep. 2010 31 Dec. 2009 30 Sep. 2009 €m €m €m
ASSETS
Noncurrent assets
Intangible assets 3,501.1 3,431.5 3,346.9
Property, plant and equipment 125.4 99.4 90.4
Financial assets 1,919.5 1,709.7 1,497.7
Other noncurrent assets 11.1 10.4 18.6
5,557.1 5,251.0 4,953.6
Current assets
Financial instruments of Eurex Clearing AG 156,113.3 143,178.4 147,057.3
Current receivables and securities from banking business 10,120.5 7,192.4 9,666.5
Other receivables and other assets1) 417.7 433.4 357.4
Restricted bank balances 5,537.5 4,745.6 6,344.0
Other cash and bank balances 652.1 559.7 544.6
172,841.1 156,109.5 163,969.8
Total assets 178,398.2 161,360.5 168,923.4
EQUITY AND LIABILITIES
Equity
Shareholders’ equity 2,990.8 2,866.2 2,789.1
Non-controlling interests 486.1 472.6 329.7
Total equity 3,476.9 3,338.8 3,118.8
Noncurrent liabilities
Provisions for pensions and other employee benefits 40.2 30.1 32.1
Other noncurrent provisions 102.8 80.5 73.2
Deferred tax liabilities 463.4 442.0 552.2
Interest-bearing liabilities 1,447.6 1,514.9 1,502.6
Other noncurrent liabilities 22.1 26.0 10.4
2,076.1 2,093.5 2,170.5
Current liabilities
Tax provisions 347.3 316.8 257.3
Other current provisions 142.0 67.4 37.7
Financial instruments of Eurex Clearing AG 156,113.3 143,178.4 147,057.3
Liabilities from banking business 10,636.6 7,221.0 9,541.5
Cash deposits by market participants 5,255.8 4,741.5 6,335.5
Other current liabilities 350.2 403.1 404.8
172,845.2 155,928.2 163,634.1
Total liabilities 174,921.3 158,021.7 165,804.6
Total equity and liabilities 178,398.2 161,360.5 168,923.4
1) Thereof €12.4 million (31 December 2009: €14.8 million and 30 September 2009: €17.0 million) with a remaining maturity of more than one year from corporation tax credits in accordance with section 37 (5) of the Körperschaftsteuergesetz (KStG, the German Corporation Tax Act)

Financial Statements 25
Consolidated Cash Flow Statement for the period 1 January to 30 September 2010
Nine months ended 30 Sep. 2010 30 Sep. 2009 €m €m
Net profit for the period 493.2 545.8
Depreciation, amortization and impairment losses 100.5 100.3
Increase in noncurrent provisions 32.2 13.7
Deferred tax income – 18.6 – 20.3
Other non-cash expense 5.9 12.1
Changes in working capital, net of non-cash items:
Decrease in receivables and other assets 34.9 19.7
Increase/(decrease) in current liabilities 54.2 – 79.1
(Decrease)/increase in noncurrent liabilities – 7.8 0.3
(Net gain)/net loss on disposal of noncurrent assets – 19.0 0.3
Cash flows from operating activities 675.5 592.8
Payments to acquire intangible assets and property, plant and equipment – 89.7 – 60.3
Payments to acquire noncurrent financial instruments – 770.0 – 886.6
Payments to acquire subsidiaries, net of cash acquired – 2.9 – 6.7
Effects of the disposal of (shares in) subsidiaries, net of cash disposed 10.7 0
Payments to acquire investments in associates – 2.5 – 1.3
Proceeds from the disposal of shares in associates 0 6.3
Net increase in current receivables, securities and liabilities from banking business with an original term greater than three months – 115.9 – 1,005.3
Proceeds from disposals of available-for-sale noncurrent financial instruments 349.4 88.7
Cash flows from investing activities – 620.9 – 1,865.2
Proceeds from sale of treasury shares 0 4.1
Payments to non-controlling interests 0 – 1.6
Repayment of long-term financing – 97.2 0
Repayment of short-term financing – 100.0 – 701.3
Proceeds from short-term financing 99.9 611.5
Finance lease payments – 0.4 – 0.4
Dividends paid – 390.5 – 390.2
Cash flows from financing activities – 488.2 – 477.9
Net change in cash and cash equivalents – 433.6 – 1,750.3
Effect of exchange rate differences1) 3.5 0.3
Cash and cash equivalents as at beginning of period2) – 285.4 448.2
Cash and cash equivalents as at end of period2) – 715.5 – 1,301.8
Operating cash flow per share (basic) (€) 3.63 3.19
Operating cash flow per share (diluted) (€) 3.62 3.18
Interest income and other similar income 14.3 46.9
Dividends received from investments in associates and other equity investments 7.1 11.4
Interest paid – 91.3 – 133.9
Income tax paid – 175.9 – 152.8
1) Primarily includes the exchange rate differences arising on translation of the ISE subgroup 2) Excluding cash deposits by market participants

26 Group Management Report Financial Statements Notes
Consolidated Statement of Changes in Equity for the period 1 January to 30 September 2010
thereof included in total comprehensive income
Nine months ended Nine months ended 30 Sep. 2010 30 Sep. 2009 30 Sep. 2010 30 Sep. 2009 €m €m €m €m
Subscribed capital
Balance as at 1 January 195.0 195.0
Balance as at 30 September 195.0 195.0
Share premium
Balance as at 1 January 1,247.0 1,247.0
Balance as at 30 September 1,247.0 1,247.0
Treasury shares
Balance as at 1 January – 587.8 – 596.4
Sales within the Group Share Plan 1.3 8.5
Balance as at 30 September – 586.5 – 587.9
Revaluation surplus
Balance as at 1 January 125.2 29.3
Remeasurement of other financial instruments – 11.0 13.1 – 11.0 13.1
Remeasurement of cash flow hedges 0.8 – 7.9 0.8 – 7.9
Increase in share-based payments – 1.9 11.3 0 0
Deferred taxes on remeasurement of financial instruments 3.3 – 0.6 3.3 – 0.6
Balance as at 30 September 116.4 45.2
Accumulated profit
Balance as at 1 January 1,886.8 1,779.4
Dividends paid – 390.5 – 390.2 0 0
Net income for the period 479.0 529.1 479.0 529.1
Exchange rate differences and other adjustments 67.5 – 44.5 62.3 – 48.8
Deferred taxes – 23.9 16.0 – 23.9 16.0
Balance as at 30 September 2,018.9 1,889.8
Shareholders’ equity as at 30 September 2,990.8 2,789.1 510.5 500.9
Non-controlling interests
Balance as at 1 January 472.6 324.0
Changes due to capital increases/(decreases) – 15.3 0 0 0
Changes due to share in net gain of subsidiaries for the period 14.2 16.7 14.2 16.7
Exchange rate differences and other adjustments 14.6 – 11.0 14.3 – 10.7
Total non-controlling interests as at 30 September 486.1 329.7 28.5 6.0
Total as at 30 September 3,476.9 3,118.8 539.0 506.9

Notes 27
Notes to the Interim Financial Statements 1. Accounting policies
These interim financial statements were prepared in accordance with the International Financial Report-ing Standards (IFRSs) as adopted by the European Union. The significant accounting policies applied by the Company to the consolidated financial statements for the year ended 31 December 2009 were also applied to the interim financial statements. In accordance with the provisions of Wertpapierhandelsgesetz (WpHG, German Securities Trading Act), these interim financial statements are supplemented by a Group interim management report. In order to further improve transparency, volume-related costs have been reported separately in the con-solidated income statement since 1 January 2010. This item comprises expenses that are correlated with the amount of sales revenue. In addition, own expenses capitalized have no longer been reported separately as income in the consolidated income statement since 1 January 2010. Expenses incurred in connection with internal development activities comprise only non-capitalized amounts since then. This change harmonizes the treatment of acquired and internally developed intangible assets in the consoli-dated income statement. Reflecting the management reporting, a simplified, more transparent segment structure was introduced for segment reporting as of 1 January 2010. This presents the four market segments Xetra, Eurex, Clear-stream and Market Data & Analytics. Income and expenses relating to the Corporate Services and Infor-mation Technology services areas are allocated proportionately to the market segments. Prior-year figures have been adjusted accordingly. In addition to the standards and interpretations applied as of 31 December 2009, the following standards and interpretations were applied:
Changes resulting from the “Annual Improvements Project” (April 2009) Amendments to IFRS 2 “Group Cash-settled Share-based Payment Transactions” Revised IFRS 3 “Business Combinations” Amendments to IAS 27 “Consolidated and Separate Financial Statements” Amendments to IFRIC 9 and IAS 39 “Embedded Derivatives” IFRIC 17 “Distribution of Non-cash Assets to Owners” IFRIC 18 “Transfers of Assets from Customers”
The application of these standards and interpretations did not have any material or any impact on Deutsche Börse Group’s financial reporting. In addition, IAS 34 (“Interim Financial Reporting”) was applied.

28 Group Management Report Financial Statements Notes
The IASB had also issued the following standards and interpretations by the date of publication of this half-yearly financial report on the second quarter of 2010, although they have not yet been adopted by the European Union: Changes resulting from the “Annual Improvements Project” The IASB published the “Improvements to IFRSs” on 6 May 2010. Unless otherwise specified, the amendments are effective for annual periods beginning on or after 1 January 2011, with earlier applica-tion permitted. Amendments to IFRS 7 „Financial Instruments: Disclosures – Transfer of financial assets“ The IASB issued amendments to IFRS 7 Financial Instruments; the amendments will improve the under-standing of transfer transactions of financial assets. An entity shall apply those amendments for annual periods beginning on or after 1 July 2011. Earlier application is permitted. Deutsche Börse Group does not expect the application of the revised standards and interpretations to have any material or any impact. 2. Group structure
With effect from 8 January 2010, Deutsche Börse AG acquired a share of 75.0 percent in Tradegate Exchange GmbH, Berlin, Germany, for a purchase price of €0.4 million. Purchase price allocation, which had been completed as of the reporting date, did not result in any goodwill. The company was fully included in the consolidated financial statements for the first time in the first quarter of 2010. Furthermore, with effect from 8 January 2010, Deutsche Börse AG acquired a 5.0 percent interest in Tradegate AG Wertpapierhandelsbank, Berlin, Germany – which holds 25.0 percent of the fully conso-lidated company Tradegate Exchange GmbH – for a purchase price of €2.5 million. Tradegate AG Wert-papierhandelsbank is classified as an associate and accounted for using the equity method. The previously fully consolidated subsidiary Avox Ltd., Wrexham, United Kingdom, in which Deutsche Börse AG held a 76.82 percent interest, was sold with effect from 1 July 2010. The sale price amounted to €11.3 million. Eurex Frankfurt AG, Frankfurt/Main, Germany, sold its 66.0 percent stake in BSP Regional Energy Exchange LLC, Ljubljana, Slovenia, on 19 August 2010. On 21 July 2010, Clearstream International S.A., Luxembourg, and Banque Centrale du Luxembourg formed LuxCSD S.A., Luxembourg, in which Clearstream International S.A. holds a 50.0 percent stake. In the fourth quarter the company will be included in full in the consolidated financial statements. 3. Seasonal influences and valuations
The Group’s revenues are influenced more by the volatility and the transaction volume on the capital markets than by seasonal factors. Owing to a concentration of costs for projects only coming to comple-tion in the fourth quarter, costs in the fourth quarter tend to be higher than in the first three quarters of the business year.
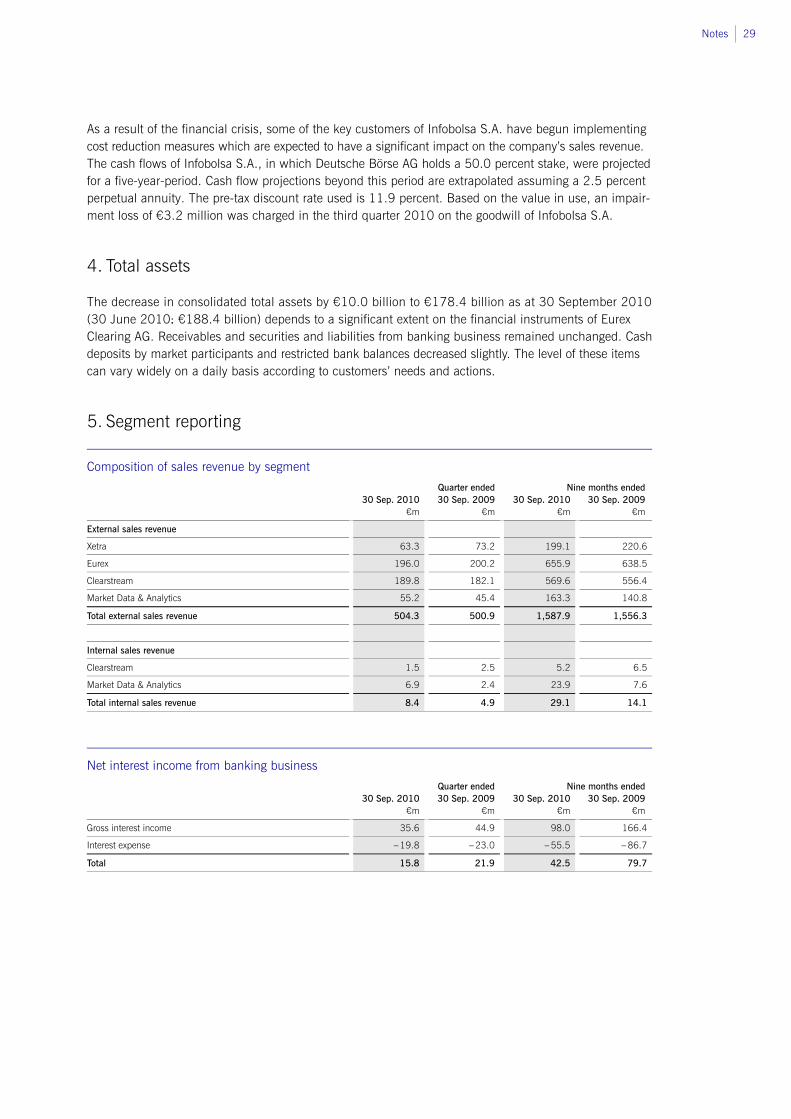
Notes 29
As a result of the financial crisis, some of the key customers of Infobolsa S.A. have begun implementing cost reduction measures which are expected to have a significant impact on the company’s sales revenue. The cash flows of Infobolsa S.A., in which Deutsche Börse AG holds a 50.0 percent stake, were projected for a five-year-period. Cash flow projections beyond this period are extrapolated assuming a 2.5 percent perpetual annuity. The pre-tax discount rate used is 11.9 percent. Based on the value in use, an impair-ment loss of €3.2 million was charged in the third quarter 2010 on the goodwill of Infobolsa S.A. 4. Total assets
The decrease in consolidated total assets by €10.0 billion to €178.4 billion as at 30 September 2010 (30 June 2010: €188.4 billion) depends to a significant extent on the financial instruments of Eurex Clearing AG. Receivables and securities and liabilities from banking business remained unchanged. Cash deposits by market participants and restricted bank balances decreased slightly. The level of these items can vary widely on a daily basis according to customers’ needs and actions. 5. Segment reporting
Composition of sales revenue by segment
Quarter ended Nine months ended 30 Sep. 2010 30 Sep. 2009 30 Sep. 2010 30 Sep. 2009 €m €m €m €m
External sales revenue
Xetra 63.3 73.2 199.1 220.6
Eurex 196.0 200.2 655.9 638.5
Clearstream 189.8 182.1 569.6 556.4
Market Data & Analytics 55.2 45.4 163.3 140.8
Total external sales revenue 504.3 500.9 1,587.9 1,556.3
Internal sales revenue
Clearstream 1.5 2.5 5.2 6.5
Market Data & Analytics 6.9 2.4 23.9 7.6
Total internal sales revenue 8.4 4.9 29.1 14.1
Net interest income from banking business
Quarter ended Nine months ended 30 Sep. 2010 30 Sep. 2009 30 Sep. 2010 30 Sep. 2009 €m €m €m €m
Gross interest income 35.6 44.9 98.0 166.4
Interest expense – 19.8 – 23.0 – 55.5 – 86.7
Total 15.8 21.9 42.5 79.7
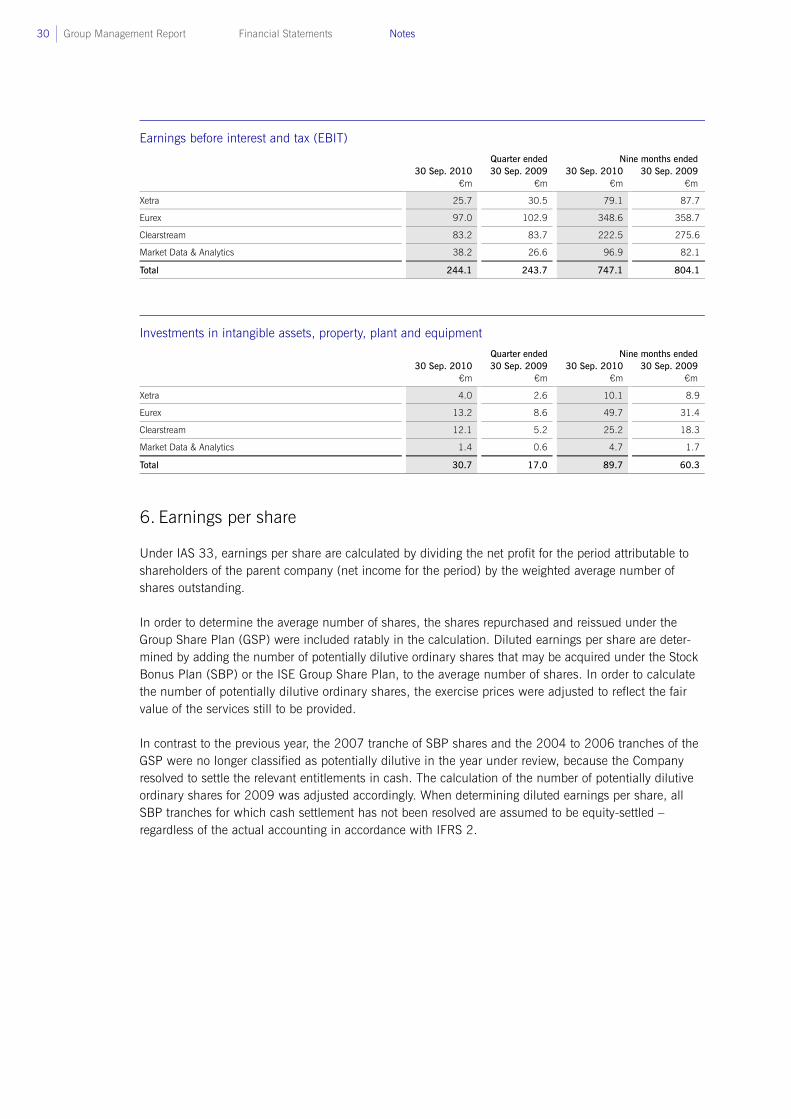
30 Group Management Report Financial Statements Notes
Earnings before interest and tax (EBIT)
Quarter ended Nine months ended 30 Sep. 2010 30 Sep. 2009 30 Sep. 2010 30 Sep. 2009 €m €m €m €m
Xetra 25.7 30.5 79.1 87.7
Eurex 97.0 102.9 348.6 358.7
Clearstream 83.2 83.7 222.5 275.6
Market Data & Analytics 38.2 26.6 96.9 82.1
Total 244.1 243.7 747.1 804.1
Investments in intangible assets, property, plant and equipment
Quarter ended Nine months ended 30 Sep. 2010 30 Sep. 2009 30 Sep. 2010 30 Sep. 2009 €m €m €m €m
Xetra 4.0 2.6 10.1 8.9
Eurex 13.2 8.6 49.7 31.4
Clearstream 12.1 5.2 25.2 18.3
Market Data & Analytics 1.4 0.6 4.7 1.7
Total 30.7 17.0 89.7 60.3
6. Earnings per share
Under IAS 33, earnings per share are calculated by dividing the net profit for the period attributable to shareholders of the parent company (net income for the period) by the weighted average number of shares outstanding. In order to determine the average number of shares, the shares repurchased and reissued under the Group Share Plan (GSP) were included ratably in the calculation. Diluted earnings per share are deter-mined by adding the number of potentially dilutive ordinary shares that may be acquired under the Stock Bonus Plan (SBP) or the ISE Group Share Plan, to the average number of shares. In order to calculate the number of potentially dilutive ordinary shares, the exercise prices were adjusted to reflect the fair value of the services still to be provided. In contrast to the previous year, the 2007 tranche of SBP shares and the 2004 to 2006 tranches of the GSP were no longer classified as potentially dilutive in the year under review, because the Company resolved to settle the relevant entitlements in cash. The calculation of the number of potentially dilutive ordinary shares for 2009 was adjusted accordingly. When determining diluted earnings per share, all SBP tranches for which cash settlement has not been resolved are assumed to be equity-settled – regardless of the actual accounting in accordance with IFRS 2.

Notes 31
There were the following potentially dilutive rights to purchase shares as at 30 September 2010:
Calculation of the number of potentially dilutive ordinary shares
Tranche Exercise price
Adjusted exercise price in accordance
with IAS 33 Average number of
outstanding options Average price
for the period1)
Number of potentially dilutive ordinary
shares € € 30 Sep. 2010 € as at 30 Sep. 2010
20082) 0 2.87 529,634 52.14 500,481
20092) 0 17.35 251,000 52.14 167,477
20103) 0 33.81 199,621 52.14 70,177
1) Volume-weighted average price of Deutsche Börse AG shares on Xetra for the period 1 January to 30 September 2010 2) This relates to rights to shares under the SBP for Executive Board members and senior executives and under the SBP of ISE as well as to rights to GSP shares of ISE. 3) This relates to rights to SBP shares for Executive Board members and senior executives and to rights to SBP shares of ISE.
As the volume-weighted average share price was higher than the adjusted exercise prices for the 2008 to 2010 tranches, these options are considered dilutive under IAS 33.
Calculation of earnings per share (basic and diluted)
Quarter ended Nine months ended 30 Sep. 20101) 30 Sep. 20092) 30 Sep. 20101) 30 Sep. 20092)
Number of shares outstanding as at beginning of period 185,942,821 185,919,236 185,922,690 185,790,599
Number of shares outstanding as at 30 September 185,942,801 185,920,580 185,942,801 185,920,580
Weighted average number of shares outstanding 185,942,821 185,919,251 185,936,260 185,838,868
Number of potentially dilutive ordinary shares 653,067 547,116 738,135 489,527
Weighted average number of shares used to compute diluted earnings per share 186,595,888 186,466,367 186,674,395 186,328,395
Net income for the period (€m) 161.3 158.3 479.0 529.1
Earnings per share (basic) (€) 0.87 0.85 2.58 2.85
Earnings per share (diluted) (€) 0.87 0.85 2.57 2.85
1) Due to the switch to cash settlement, the GSP tranches 2004 to 2006 as well as the SBP tranche 2007 were no longer included in the calculation of the poten-tially dilutive ordinary shares.
2) The number of dilutive ordinary shares was adjusted for the GSP shares of the 2004 and 2005 tranches as well as the SBP shares of the 2007 tranche in order to enhance comparability with disclosures for the reporting period. In the business year as at 30 September 2009, diluted earnings per share increased from €2.84 to €2.85; for the third quarter 2009 they remained unchanged.

32 Group Management Report Financial Statements Notes
7. Material transactions with related parties
Material transactions with associates
Amount of the transactions Outstanding balances
Quarter ended Nine months ended 30 Sep. 2010 30 Sep. 2009 30 Sep. 2010 30 Sep. 2009 30 Sep. 2010 30 Sep. 2009 €m €m €m €m €m €m
License fees paid by Eurex Frankfurt AG to STOXX Ltd.1) n.a. – 4.9 n.a. – 15.8 n.a. – 4.9
Loans from Scoach Holding S.A. and Scoach Europa AG to Deutsche Börse AG as part of cash pooling2) 0 n.a. 0 n.a. – 3.4 n.a.
Services of Deutsche Börse AG for Scoach Europa AG2) 1.5 n.a. 4.5 n.a. 2.4 n.a.
Operation of trading and clearing software by Deutsche Börse Systems AG for European Energy Exchange AG and affiliates 2.6 2.7 7.1 9.2 1.0 1.2
Provision of price data by STOXX Ltd. to Deutsche Börse AG1) n.a. – 1.0 n.a. – 3.1 n.a. 0
Operation of the trading system by Deutsche Börse Systems AG for U.S. Futures Exchange LLC3) 0 0 0 0 0 0
IT services and infrastructure by International Securities Exchange, LLC for Direct Edge Holdings, LLC 0.6 1.2 2.2 3.9 0.4 0
Development and operation of the Link Up Converter system by Clearstream Services S.A. for Link-Up Capital Markets, S.L. 0.5 0.4 1.5 6.0 0.9 0
Money market placements of European Commodity Clearing AG with Clearstream Banking S.A. and the interest paid thereon4) – 0.1 – 0.9 – 0.3 – 2.2 – 433.9 – 339.2
Other transactions with associates – – – – – 0.5 1.4
Total – 433.1 – 341.5
1) STOXX Ltd. has been fully consolidated since 29 December 2009. Consequently, disclosures are no longer required for financial year 2010. 2) The Scoach subgroup was fully consolidated until 31 December 2009. Since then, the companies have been classified as associates.
Consequently, disclosures are not required for financial year 2009. 3) Valuation allowances have been charged in full on receivables totalling €0.2 million. 4) The European Commodity Clearing AG is a subsidiary of European Energy Exchange AG, which is classified as an associate.

Notes 33
Material transactions with other related parties
Amount of the transactions Outstanding balances
Quarter ended Nine months ended 30 Sep. 2010 30 Sep. 2009 30 Sep. 2010 30 Sep. 2009 30 Sep. 2010 30 Sep. 2009 €m €m €m €m €m €m
Office and administrative services by Eurex Zürich AG for SIX Swiss Exchange AG 3.8 5.7 16.6 19.3 2.2 5.1
Loans from SIX Group AG provided to STOXX Ltd. as part of the acquisition and interest charges thereon1) – 0.2 n.a. – 0.4 n.a. – 15.4 n.a.
Office and administrative services by SIX Group AG for STOXX Ltd.1) – 1.1 n.a. – 2.5 n.a. – 1.1 n.a.
Office and administrative services by SIX Swiss Exchange AG for Eurex Zürich AG – 1.9 – 1.6 – 6.0 – 5.1 – 0.7 – 0.7
Operation and development of Eurex software by Deutsche Börse Systems AG for SIX Swiss Exchange AG 4.2 4.5 13.3 10.8 2.7 2.9
Office and administrative services by SIX Swiss Exchange AG for Eurex Frankfurt AG – 2.1 – 2.7 – 4.6 – 4.9 – 0.5 – 0.4
Transfer of Eurex fee revenue by Eurex Zürich AG to SIX Swiss Exchange AG n.a. n.a. n.a. n.a. – 14.0 – 24.5
Operation and development of Xontro by Deutsche Börse Systems AG for BrainTrade Gesellschaft für Börsensysteme mbH2) 3.5 4.1 11.8 12.3 1.5 1.7
Operation of the floor trading system by BrainTrade Gesellschaft für Börsen-systeme mbH for Deutsche Börse AG2) – 2.1 – 3.1 – 6.5 – 7.2 – 0.8 – 1.0
Other transactions with other investors - - - - 0.5 0.4
Total – 25.6 – 16.5
1) STOXX Ltd. has been fully consolidated since 29 December 2009. Consequently, no disclosures are required for financial year 2009. 2) Due to the deconsolidation of Scoach Europa AG as of 31 December 2009, the interest in BrainTrade Gesellschaft für Börsensysteme mbH has declined
to 14.3 percent. BrainTrade Gesellschaft für Börsensysteme mbH has been accounted for as “other equity investment” since 1 January 2010.
8. Employees
Employees
Quarter ended Nine months ended 30 Sep. 2010 30 Sep. 2009 30 Sep. 2010 30 Sep. 2009
Average number of employees during the period 3,506 3,571 3,555 3,535
Employed as at the balance sheet date 3,507 3,585 3,507 3,585
There was an average of 3,254 full-time equivalent (FTE) employees during the third quarter of 2010 (Q3/2009: 3,361).

34 Group Management Report Financial Statements Notes
Frankfurt/Main, 27 October 2010 Deutsche Börse AG The Executive Board

Contact Investor Relations Phone +49-(0) 69- 2 11-1 16 70 Fax +49-(0) 69- 2 11-1 46 08 E-mail [email protected] www.deutsche-boerse.com/ir_e Publications service The annual report 2009 may be obtained from the publications service of Deutsche Börse Group. Phone +49-(0) 69- 2 11-1 15 10 Fax +49-(0) 69- 2 11-1 15 11 Downloads at www.deutsche-boerse.com Reproduction – in whole or in part – only with the written permission of the publisher Registered trademarks AlphaFlash®, DAX®, Euro GC Pooling®, GC Pooling®, TRICE®, USD GC Pooling®, Xetra® and Xetra-Gold® are registered trademarks of Deutsche Börse AG. EURO STOXX®, EURO STOXX 50® and STOXX® Europe 600 are registered trade- marks of STOXX Ltd.

Published byDeutsche Börse AG60485 Frankfurt / MainGermanywww.deutsche-boerse.com
October 2010 Order number 1015-3085