INTERIM REPORT JANUARY JUNE 2015 - Investment … 2015_eng.pdf2 INTERIM REPORT JANUA RY – JUNE...
20
INTERIM REPORT JANUARY−JUNE 2015
Transcript of INTERIM REPORT JANUARY JUNE 2015 - Investment … 2015_eng.pdf2 INTERIM REPORT JANUA RY – JUNE...

INTERIM REPORT JANUARY−JUNE
2015

2 INTERIM REPORT JANUARY – JUNE 2015
Interim report January – June 2015
NET ASSET VALUE AND THE LATOUR SHARE • The net asset value rose to SEK 277 per share, compared to SEK 250 per share at the beginning of the year. This is an
increase of 13.5 per cent, adjusted for dividends. By comparison, the Stockholm Stock Exchange's Total Return Index (SIXRX) increased by 10.0 per cent. The net asset value was SEK 293 per share at 17 August.1
• The total return on the Latour share was 15.6 per cent for the period, which is better than the SIXRX index.
INDUSTRIAL OPERATIONS The second quarter • The industrial operations' incoming orders rose 12 per cent to SEK 2,211 m (1,970), which means an unchanged level for
comparable entities adjusted for foreign exchange effects. • The industrial operations' net sales rose 12 per cent to SEK 2,161 m (1,935), which represents a 1 per cent decrease for
comparable entities adjusted for foreign exchange effects. • The operating profit increased by 19 per cent to SEK 246 m (207), which is equivalent to an operating margin of 11.4
(10.7) per cent for continuing operations. • During the quarter, Latour Industries acquired Produal, which has 95 employees and an annual turnover of EUR 18 m.
Specma Group has acquired Hydraulikhuset, which has 26 employees and an annual turnover of SEK 60 m. REAC has finalised the agreement for the acquisition of a small-scale business from the Ergolet Group in Poland.
January to June • The industrial operations' order intake rose 14 per cent to SEK 4,355 m (3,813), which means a 1 per cent increase for
comparable entities adjusted for foreign exchange effects. • The industrial operations' net sales rose 14 per cent to SEK 4,191 m (3,665), which represents a 0.2 per cent increase for
comparable entities adjusted for foreign exchange effects. • The operating profit increased by 37 per cent to SEK 453 m (331), which is equivalent to an operating margin of 10.8
(9.0) per cent for continuing operations.
GROUP • The Group's profit after financial items was SEK 1,872 m (897). • The Group's profit after tax, including capital gains of SEK 670 m, was SEK 1,735 m (829), which is equivalent to SEK
10.88 (5.20) per share. • Net debt at the end of June was SEK 3,599 m (2,543) and is equivalent to 7.5 per cent of the market value of total assets. • Latour acquired 18 per cent of the shares in Steelwrist in June.
INVESTMENT PORTFOLIO • During the six months, the value of the investment portfolio increased by 15.5 per cent adjusted for dividends. The
comparable index (SIXRX) increased by 10.0 per cent. • Ownership in Nobia dropped to 10.1 per cent following the disposal of 5,395,000 shares. Earlier in the year, 30.1 per
cent of the shares in Troax were acquired. The company reports annual sales of approximately SEK 900 m.
EVENTS AFTER THE REPORTING PERIOD • Latour announced its intention to sell the Specma Group business area.
1 The calculation of the net asset value on 17 August 2015 was based on the value of the investment portfolio at 1 p.m. on 17 August and the same values as on 30 June were used for the unlisted portfolio.
LATOUR AT A GLANCE Investment AB Latour is a mixed investment company consisting primarily of wholly-owned industrial operations and an investment portfolio of listed holdings in which Latour is the principal owner or one of the principal owners. The investment portfolio consists of ten substantial holdings that on 30 June 2015 had a market value of about SEK 34 billion. The holdings in the investment portfolio with the greatest value are Assa Abloy, Securitas and Sweco. The wholly-owned industrial operations are grouped into five business areas: Hultafors Group, Latour Industries, Nord-Lock, Specma Group and Swegon, and generate a turnover of approximately SEK 8 billion.

INTERIM REPORT JANUARY – JUNE 2015 3
Comments from the CEO "We are pleased to be able to report yet another quarter of robust performance despite the fact that volume growth adjusted for foreign exchange effects is sluggish. We are experiencing positive growth, albeit rather tepid, in much of Europe, where the most significant share of Latour's industrial operations conduct business. We are seeing stronger growth in our operations in Asia and North America, although these markets still account for a small proportion of total sales.
During the second quarter, incoming orders for the industrial operations were unchanged, when adjusted for foreign exchange effects and acquisitions. Net sales decreased by 1 per cent. The quarter's weak growth in volumes is somewhat coloured by Nord-Lock, in particular, being measured against a very robust quarter in the previous year. Including acquisitions and foreign exchange effects, both order intake and invoiced sales grew by 12 per cent in the industrial operations. To date this year, order intake is exceeding invoiced sales by more than SEK 160 m.
Compared with the adjusted profit in the previous year, profit rose 19 per cent to SEK 246 m (207), which is equivalent to an operating margin of 11.4 (10.7) per cent. Latour Industries accounts for the largest increase in profits from a previously low level. Hultafors Group and Specma Group have also contributed with significant growth in profits.
We can still see good potential for reporting strong earnings even if market growth is relatively weak. We continue to conduct our operations based on the premise that we cannot count on the economic situation offering us any significant help. However, we are not holding back on investments in product development and sales.
There was slightly more acquisition activity in the second quarter in the wholly-owned operations. REAC in Latour Industries finalised the agreement for the acquisition of parts of the Ergolet Group in Poland. The business generates sales of SEK 30 m and is based in Jasien in Poland. The deal ensures that REAC has a supply chain for key components.
Latour Industries also acquired Produal, a leading Finnish manufacturer of devices for building automation measurement and room control. Produal has 95 employees and generates sales of EUR 18 m with a very high level of
profitability and operates in an area that is related to our holdings in the field of energy efficiency in buildings, Kabona, Bastec and Elvaco.
Specma Group made a smaller acquisition in the quarter with its purchase of Hydraulikhuset. The company has 26 employees and generates sales of approximately SEK 60 m. The acquisition enhances Specma's position in hydraulic systems and in the after-sales market in west Sweden.
We have also decided to announce our intention of selling the Specma Group business area, with annual revenue of SEK 1.3 billion. Since we have adopted a more rigorous acquisition strategy, which focuses explicitly on business operations with proprietary products and brands, it is only natural to sell Specma. A significant share of Specma's operations are trading services and it is a small player in the huge hydraulics market, with limited potential for expansion outside the Nordic region.
Most of our listed holdings have submitted their reports for the second quarter. On the whole, the companies have reported very positive performances in terms of growth and profitability, although market expectations were even higher in some cases. Several companies have continued to make acquisitions. Sweco's public takeover bid by the Dutch company, Grontmij, is particularly exciting. When finalised, the acquisition will make Sweco the leading technology consultancy company in Europe. Latour reduced its shareholding in Nobia to 10.1 per cent during the quarter.
The value of the investment portfolio rose 15.5 per cent during the first six months. This is higher than the comparable index (SIXRX), which rose 10.0 per cent. The net asset value in Latour increased in the first six months of 2015 by 13.5 per cent to SEK 277 per share, adjusted for dividends.
Finally, Latour has also expanded its portfolio of other unlisted holdings with the acquisition of 18 per cent of the shares in Steelwrist. Steelwrist develops, manufactures and sells tools that increase excavator efficiency, operator-friendliness and safety and had annual revenue of SEK 116 m in 2014."
Jan Svensson President and Chief Executive Officer

4 INTERIM REPORT JANUARY – JUNE 2015
Industrial operations Order intake, invoicing and earnings The total order intake increased to SEK 2,211 m (1,970) during the second quarter. Invoicing increased to SEK 2,161 m (1,935), which is equivalent to a 1 per cent organic decline when adjusted for foreign exchange effects and acquisitions. The operating profit in the wholly-owned industrial operations increased by 19 per cent to SEK 246 m (207) in the quarter. The operating margin was 11.4 (10.7) per cent. In the six-month period, incoming orders increased to SEK 4,355 m (3,813). Invoicing increased to SEK 4,191 m (3,665) which, adjusted for foreign exchange effects and acquisitions, means organic growth is unchanged. The operating profit in the wholly-owned industrial operations increased by 37 per cent to SEK 453 m (331). The operating margin was 10.8 (9.0) per cent. * The comparative figures indicate adjusted operating profit and adjusted operating margin for divested operations.
Acquisitions REAC AB finalised the agreement for the acquisition of a small-scale business from the Ergolet Group in Poland during the quarter. The business manufactures components for actuators and tilt and lift systems. REAC AB is part of the Latour Industries business area. This acquisition will consolidate REAC's market position in the field of electric wheelchairs. It will create opportunities for REAC to increase its competitive edge and capacity and to lay the foundation for future growth. The deal is being managed via REAC Components, which is REAC's new subsidiary. The company will generate annual sales of approximately SEK 30 m and is based in Jasien in Poland.
Latour Industries also acquired Produal, a leading Finnish manufacturer of devices for building automation measurement and room control. Produal has 95 employees and generates sales of EUR 18 m with a very high level of
profitability and operates in an area that is related to our holdings in the field of energy efficiency in buildings, Kabona, Bastec and Elvaco. Produal has its head office in Kotka in Finland, and its product range includes temperature sensors, pressure transmitters, room controllers, transducers and accessories. Its products are sold through subsidiaries in Finland, Sweden, Denmark and France, and partners in other European countries. In less than three years, Produal has nearly doubled its international business and has achieved sales growth of almost 20 per cent per annum.
Specma made a smaller acquisition in the quarter with its purchase of Hydraulikhuset. The company has 26 employees and generates sales of approximately SEK 60 m. Hydraulikhuset sells and manufactures hydraulic systems for OEM manufacturers, distributes components and conducts repair and service business in the after-sales market. The company's head office is in Gothenburg and it has operations in Kungsbacka and Falkenberg. The acquisition enhances Specma's position in hydraulic systems and in the after-sales market in west Sweden.
Latour has also expanded its portfolio of other unlisted holdings with the acquisition of 18 per cent of the shares in Steelwrist. The company develops, manufactures and sells tools that increase excavator efficiency, operator-friendliness and safety. The aim is to build an industrial group, with Steelwrist as a key element, in the field of quick couplers, tiltrotators, electronics and equipment for excavators and other tool carriers. Its main products are tiltrotators and quick couplers, but the company also sells buckets and other accessories that are optimised for use with tiltrotators. Steelwrist has its headquarters, product development and manufacturing facilities in Sollentuna, Sweden. The company has 57 employees and had an annual turnover of SEK 116 m in 2014.

INTERIM REPORT JANUARY – JUNE 2015 5
Industrial operations summary
Business area results
Group trailing 12 months
2015 2014 2015 2014 2015 2014 2015 2014 2015 2014 2015 2014SEK m Q2 Q2 6 mths 6 mths Q2 Q2 6 mths 6 mths Q2 Q2 6 mths 6 mths
Hultafors Group 362 322 712 625 48 41 90 75 13.2 12.8 12.6 11.9
Latour Industries 311 277 601 519 41 20 78 28 13.3 7.3 13.0 5.3
Nord-Lock 197 192 405 360 57 57 123 98 28.9 29.6 30.3 27.3
Swegon 928 801 1,770 1,501 80 74 119 111 8.6 9.2 6.7 7.4
Eliminations - -1 -4 -4 - - - - - - - -
1,798 1,591 3,484 3,001 226 192 410 312 12.6 12.1 11.8 10.4
Specma Group ² 363 344 707 664 20 15 43 19 5.5 4.4 6.1 2.9
2,161 1,935 4,191 3,665 246 207 453 331 11.4 10.7 10.8 9.0Restructuring and non-recurring expenses - - - - - -41 - -41 - - - -
2,161 1,935 4,191 3,665 246 166 453 290 11.4 8.6 10.8 7.9Gain/loss from sale/purchase of businesses - - - - -3 -8 -5 -9
Other companies and items ¹ - 5 - 21 -1 4 -1 -8
2,161 1,940 4,191 3,686 242 162 447 273
Net sales Operating profit Operating margin %
² Specma Group is reported on a separate line due to the devestment decision.
The comparative year have been adjusted to correspond to the existing structure
¹ Net sales refer to the operations (Carstens) divested in 2014 preniously presented as part of Latour Industries.
2015 2014 2015 2014 Of which Of whichSEK m Trailing 12 Trailing 12 Trailing 12 Trailing 12 2015 acquisitions currency
Hultafors Group 1,030 787 18.7 21.5 13.9 5.6 4.7
Latour Industries 991 752 12.0 8.2 15.7 9.4 0.9
Nord-Lock 617 538 38.2 27.4 12.5 - 13.5
Swegon 2,279 1,252 13.4 24.1 17.9 17.1 4.8
4,917 3,329 15.5 17.4 16.1 11.3 5.1
Specma Group 590 586 11.2 -4.3 6.5 - 4.0
Total 5,507 3,915 16.7 16.7 14.4 9.3 4.9
³ Calculated as total assets less cash and other interest-bearing assets and less non-interest-bearing liabilities. Calculated on the average for the past 12 months.
Operating capital ³ Return on operating capital % Growth in net sales %
1000
2000
3000
4000
5000
6000
7000
8000
9000
10000
100
200
300
400
500
600
700
800
900
1000
SEK mSEK m
Operating profit Orders received Invoicing

6 INTERIM REPORT JANUARY – JUNE 2015
Development per business area
Hultafors Group
Highlights • Invoicing increased by 12.7 per cent during the quarter.
Growth was 3.6 per cent when adjusted for foreign exchange effects and acquisitions.
• All product areas reported organic growth. • Increased demand compared to last year, particularly in
Finland, Ireland and the Netherlands. • Operating profit remains at a good level despite pressure
on the margin, which is partly due to a negative currency-exchange situation.
Breakdown of net sales
Latour Industries
Highlights • Net sales rose 12.3 per cent during the quarter. Growth
was 5.2 per cent when adjusted for foreign exchange effects and acquisitions.
• Significant earnings growth compared with the previous year, with Specma Seals and AVT in particular reporting much improved earnings.
• Produal, a leading Finnish manufacturer of devices for building automation measurement and room control, was acquired at the end of June. The company is an excellent complement to our holdings in energy efficiency, Kabona, Elvaco and Bastec. (See page 4 for further information.)
• REAC has finalised the agreement for the acquisition of a small-scale business from the Ergolet Group in Poland. (See page 4 for further information.)
Breakdown of net sales
2015 2014 2015 2014 2014 Trailing(SEK m) Q2 Q2 6 mths 6 mths Full Year 12 mths
Net sales 362 322 712 625 1,306 1,392
EBITDA, adjusted* 52 45 97 83 195 209
EBITA, adjusted* 49 42 91 77 182 196
EBIT, adjusted* 48 41 90 75 177 192
EBIT, reported 48 41 90 75 177 192
EBITA %, adjusted* 13.4 13.1 12.8 12.2 13.9 14.1
EBIT %, adjusted* 13.2 12.8 12.6 11.9 13.6 13.8
Growth % 12.7 14.0 13.9 9.6 8.1
Of which exchange effects 3.6 3.7 4.7 2.8 3.6
Of which acquisitions 5.5 - 5.6 - 0.7
Average number of employees 648 620 648 614 617
* Excluding resttructuring costs
2015 2014 2015 2014 2014 Trailing(SEK m) Q2 Q2 6 mths 6 mths Full Year 12 mths
Workwear 178 169 355 324 688 718
Tools 124 119 241 234 474 481
Ladders 39 33 75 68 135 143
Tradeport 23 - 41 - 9 50
362 322 712 625 1,306 1,392
Pro forma adjustment¹ 26
Trailing 12 month pro forma 1,418
¹ Pro forma for completed acquisitions
2015 2014 2015 2014 2014 Trailing(SEK m) Q2 Q2 6 mths 6 mths Full Year 12 mths
Net sales 311 277 601 519 1,034 1,116
EBITDA, adjusted* 47 25 89 38 89 140
EBITA, adjusted* 42 21 80 29 70 121
EBIT, adjusted* 41 20 78 27 68 119
EBIT, reported 41 20 78 27 68 119
EBITA %, adjusted* 13.6 7.5 13.3 5.5 6.8 10.9
EBIT %, adjusted* 13.3 7.3 13.0 5.3 6.5 10.6
Growth % 12.3 15.5 15.7 12.5 12.1
Of which exchange effects 0.8 1.3 0.9 1.0 1.1
Of which acquisitions 6.3 6.6 9.4 3.4 7.5
Average number of employees 944 738 822 704 733
* Excluding resttructuring costs
2015 2014 2015 2014 2014 Trailing(SEK m) Q2 Q2 6 mths 6 mths Full Year 12 mths
LSAB Group 120 115 232 230 434 435
REAC 75 72 140 128 242 254
Kabona 36 33 72 66 126 132
Elvaco 21 17 42 17 55 79
Specma Seals 29 27 60 48 98 109
AVT 15 13 30 30 57 58
Bastec 15 - 26 - 22 48
311 277 601 519 1,034 1,116
Pro forma adjustment¹ 20
Trailing 12 month pro forma 1,136
¹ Pro forma for completed acquisitions
Hultafors Group offers products in the categories of clothing for professionals, safety footwear, hand tools, ladders and scaffolding. The products are marketed through the brands that have strong positions in their respective markets: Snickers Workwear, Dunderdon, Solid Gear, Toe Guard, Hultafors and Wibe Ladders. Hultafors Group is also a distributor for the German manufacturing company Fein on the Swedish market.
Latour Industries consists of a number of operating areas, each with its own business concept and business model. Our ambition is to develop independent entities within the business area which can eventually become new business areas within Latour.
INTERIM REPORT JANUARY – JUNE 2015 7
Nord-Lock
Highlights • Net sales rose 2.8 per cent during the quarter. Organic
growth was negative when adjusted for foreign exchange effects, which can partly be explained by a very strong second quarter in the previous year.
• Strong operating profit in line with the same period in the previous year.
• Continuing strong growth in Asia, net sales increased by 32 per cent in the second quarter and 39 per cent in the first six months.
• Growth was weaker in North America due to the lower rate of investment in oil, gas and mining.
• Increased investment in product development.
Breakdown of net sales
Specma Group
Highlights • Net sales rose 5.6 per cent during the quarter. Organic
growth was 1.6 per cent when adjusted for foreign exchange effects.
• Particularly strong growth in the Global Division. • Cost reduction measures and a focus on improved
productivity have had a positive effect on earnings. • Hydraulikhuset was acquired at the end of June, thus
enhancing Specma's position in hydraulic systems to OEM manufacturers and in the after-sales market in west Sweden. (See page 4 for further information.)
Breakdown of net sales
2015 2014 2015 2014 2014 Trailing(SEK m) Q2 Q2 6 mths 6 mths Full Year 12 mths
Net sales 197 192 405 360 722 767
EBITDA, adjusted* 62 61 133 107 229 255
EBITA, adjusted* 58 58 125 100 214 239
EBIT, adjusted* 57 57 123 98 211 236
EBIT, reported 57 57 123 98 211 236
EBITA %, adjusted* 29.5 30.0 30.8 27.7 29.6 31.1
EBIT %, adjusted* 28.9 29.6 30.3 27.3 29.3 30.7
Growth % 2.8 20.9 12.5 17.0 15.8
Of which exchange effects 11.4 3.4 13.5 2.5 4.9
Of which acquisitions - - - -
Average number of employees 372 382 367 384 367
* Excluding resttructuring costs
2015 2014 2015 2014 2014 Trailing(SEK m) Q2 Q2 6 mths 6 mths Full Year 12 mths
Europe 106 105 214 196 394 412
North America 51 50 107 98 198 206
Asia Pacific 37 28 75 54 114 135
Emerging markets 6 9 16 13 24 27
Other -2 -2 -7 -2 -8 -13
197 192 405 360 722 767
Pro forma adjustment¹ -
Trailing 12 month pro forma 767
¹ Pro forma for completed acquisitions
2015 2014 2015 2014 2014 Trailing(SEK m) Q2 Q2 6 mths 6 mths Full Year 12 mths
Net sales 363 344 707 664 1,294 1,338
EBITDA, adjusted* 25 20 53 28 61 85
EBITA, adjusted* 20 15 43 19 42 66
EBIT, adjusted* 20 15 43 19 42 66
EBIT, reported 20 -26 43 -22 1 66
EBITA %, adjusted* 5.5 4.4 6.1 2.9 3.2 5.0
EBIT %, adjusted* 5.5 4.4 6.1 2.9 3.2 4.9
Growth % 5.6 14.0 6.5 14.2 12.3
Of which exchange effects 4.0 1.4 4.0 1.3 1.9
Of which acquisitions - 3.2 - 3.6 2.7
Average number of employees 748 764 728 768 760
* Excluding resttructuring costs
2015 2014 2015 2014 2014 Trailing(SEK m) Q2 Q2 6 mths 6 mths Full Year 12 mths
Global Division 262 244 507 465 924 967
Nordic Division 101 100 200 199 370 371
363 344 707 664 1,294 1,338
Pro forma adjustment¹ 60
Trailing 12 month pro forma 1,398
¹ Pro forma for completed acquisitions
Nord-Lock is a world leader in bolt-securing systems. Its innovative products include wedge-locking technology and Superbolt tensioners which have been providing customers in all major industrial sectors with safe, reliable and effective bolt-securing solutions for over 30 years. Nord-Lock optimises the most demanding types of applications using its extensive technical expertise.
Specma Group is an industry leader and Nordic player with an international presence in application customised systems and components for hydraulics. The business is divided into a Global Division that serves major international OEM customers, and a Nordic Division that serves smaller OEM customers, offers industry an MRO concept and serves the after-sales market in the Nordic region.
8 INTERIM REPORT JANUARY – JUNE 2015
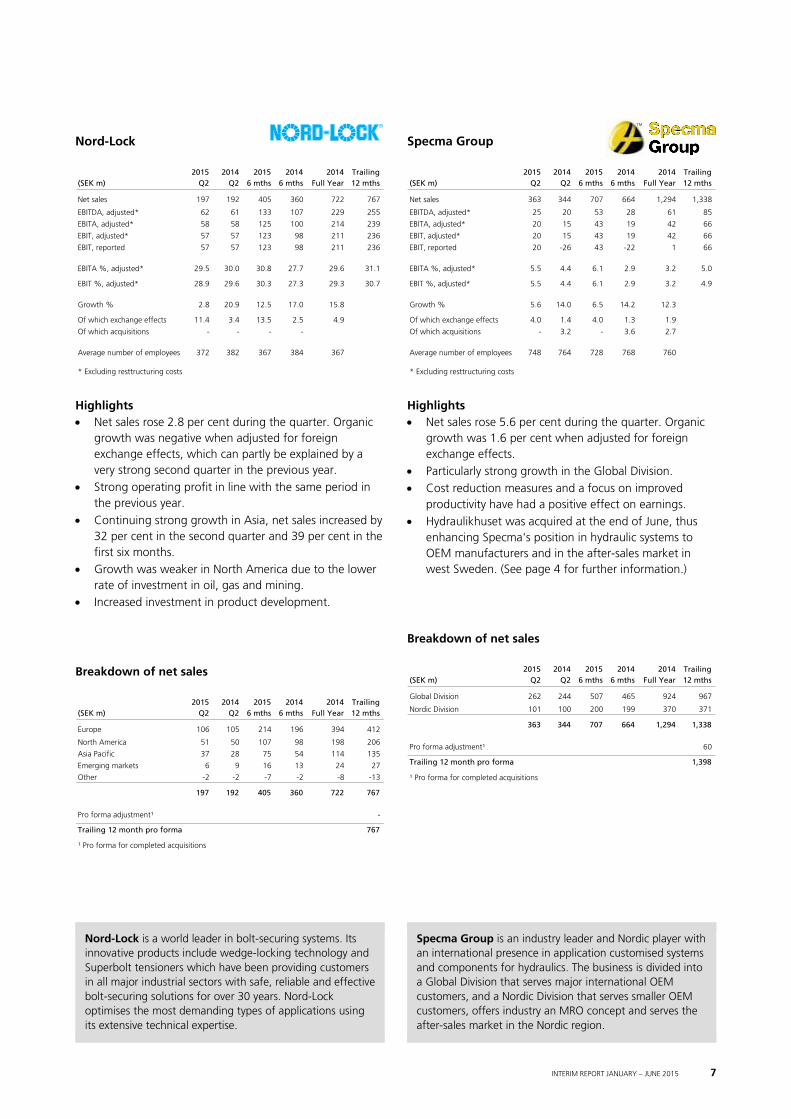
Swegon
Highlights • The order intake showed slight positive organic growth
during the quarter, while invoicing declined by 4 per cent when adjusted for foreign exchange effects and acquisitions.
• All in all, growth in orders had clearly improved by the end of the quarter. The order book was at a good level at the end of the second quarter.
• Growth in the markets of Europe is still fragmented. The Nordic region is largely positive. Other markets provide a more mixed picture.
• Growth has been good in North America, where we acquired Vibro-Acoustics in 2014. There has been a gradual improvement in both sales and the order book.
Breakdown of net sales
2015 2014 2015 2014 2014 Trailing(SEK m) Q2 Q2 6 mths 6 mths Full Year 12 mths
Net sales 928 801 1,770 1,501 3,209 3,479
EBITDA, adjusted* 101 91 160 146 373 387
EBITA, adjusted* 82 75 123 113 303 312
EBIT, adjusted* 80 74 119 111 298 306
EBIT, reported 80 74 119 111 298 306
EBITA %, adjusted* 8.8 9.4 6.9 7.5 9.4 9.0
EBIT %, adjusted* 8.6 9.2 6.7 7.4 9.3 8.8
Growth % 15.9 6.5 17.9 6.9 9.3
Of which exchange effects 3.8 2.8 4.8 2.0 3.0
Of which acquisitions 16.2 9.5 17.1 10.3 13.8
Average number of employees 1,850 1,621 1,835 1,561 1,674
* Excluding resttructuring costs
2015 2014 2015 2014 2014 Trailing(SEK m) Q2 Q2 6 mths 6 mths Full Year 12 mths
Sweden 221 188 434 364 712 782
Rest of Nordic region 200 191 391 382 767 776
Rest of world 507 422 945 755 1,730 1,920
928 801 1,770 1,501 3,209 3,478
Pro forma adjustment¹ 38
Trailing 12 month pro forma 3,516
¹ Pro forma for completed acquisitions
2015 2014 2015 2014 2014 Trailing(SEK m) Q2 Q2 6 mths 6 mths Full Year 12 mths
Cooling 249 221 470 390 847 928
Home Solutions 66 41 119 83 171 208
Commercial Ventilation 579 539 1,105 1,040 2,169 2,233
North America 48 11 99 11 81 169
Eliminations -14 -11 -23 -23 -59 -59
928 801 1,770 1,501 3,209 3,479
Swegon provides components and innovative system solutions that create a good indoor climate and contribute to significant energy savings in all types of buildings. Swegon's products constitute a turnkey solution for the perfect indoor climate. Including foreign sales companies, Swegon has 1,800 employees and generates a turnover in excess of SEK 3.5 billion.
8 I N T E R I M R E P O R T J A N U A R Y – M A R C H 2 0 1 5

INTERIM REPORT JANUARY – JUNE 2015 9
The Latour share's net asset value
In order to facilitate the evaluation of Latour's net asset value, Latour provides an estimated range of the value (Enterprise Value) for each business area based on EBIT multiples. These multiples have been calculated by comparing valuations of listed companies in comparable industries. Since there are variations in the listed companies’ valuations these are reflected in the tables by valuing each business area in a range. Deductions are then made for the Group's net debt. The evaluation of comparable companies is based on the share price on the balance sheet date. Any price changes after the balance sheet date have not been taken into consideration. A more detailed description can be found on pages
20–21 in Latour's Annual Report for 2014. In some cases, the valuation multiples for comparable
companies span over a very big range. For this reason the multiples may be adjusted in order to avoid unreasonable values. The valuation multiple EV/sales has been used for certain entities. The indicative value stated below is not a complete market valuation of Latour's holdings.
The net asset value increased to SEK 277 per share during the period from SEK 250 at the beginning of the year. The net asset value consequently increased by 13.5 per cent, adjusted for dividends, which can be compared to SIXRX which rose 10.0 per cent.
EBIT miltiple or Valuation²Net sales¹ EV/sales multiple Valuation² Valuation² SEK/share³
SEK m EBIT¹ Range Range Average Range
Hultafors Group 1,418 195 11 – 15 2,145 – 2,925 2,535 13 – 18Latour Industries 1,136 116 11 – 15 1,276 – 1,740 1,508 8 – 11Nord-Lock 767 236 12 – 16 2,832 – 3,776 3,304 18 – 24Specma Group 1,338 66 0.5 – 0.6 669 – 803 736 4 – 5Swegon 3,516 309 13 – 17 4,017 – 5,253 4,635 25 – 33
8,175 922 10,939 – 14,497 12,718 69 – 91
Listed shares (see table on page 10 for breakdown) 34,462 216
Unlisted part-owned companiesDiamorph⁴, 21.2 % 125 1Oxeon⁵, 31.1 % 25 0Steelwrist⁶, 18,0 % 20 0
Other assetsShort trading portfolio 42 0Dilution effect of option programme -56 0Other -13 0Payed aquisitions in the Industrial operation⁷ 426 3
Consolidated net debt -3,599 -23
Estimated value 44,150 277(42 385 – 45 943) (266 – 288)
¹ Trailing 12 months for current company structure. EBIT is reported before restructuring costs.
² EBIT and EV/sales recalculated taking into consideration the listed share price on 30 June 2015 for comparable companies in each business area.
³ Calculated on the basis of the number of outstanding shares.
⁴ Valued according to the latest transaction.
⁵ Valued according to Latour's latest acquisition price.
⁶ Valued according to Latour's latest acquisition price.
⁷ Payed aquisitions in the Industrial operations that is not yet in the evaluation, but have influenced the net debt.
5.0%
10.0%
15.0%
20.0%
25.0%
30.0%
60.0
80.0
100.0
120.0
140.0
160.0
180.0
200.0
220.0
240.0
260.0
2009 2010 2011 2012 2013 2014 2015
Net asset discountSEK per share
Market price Net asset discount
10 INTERIM REPORT JANUARY – JUNE 2015
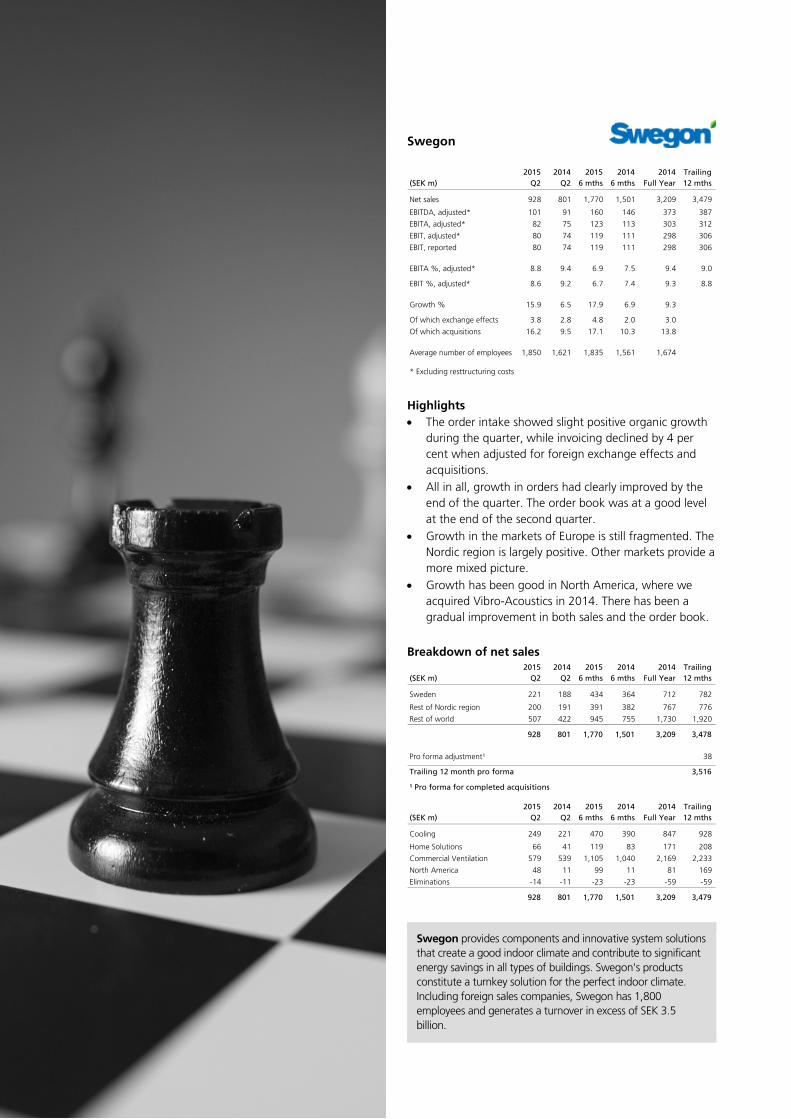
Investment portfolio 30 June 2015
In the six-month period, the aggregate value of the investment portfolio increased by 15.5 per cent, adjusted for dividends, while the comparable index (SIXRX) increased by 10.0 per cent.
Ownership in Nobia dropped to 10.1 per cent in the quarter following the sale of 5,395,000 shares in Nobia. Earlier in the year, 6,020,000 shares in Troax were purchased, representing 30.1 per cent of the company's capital and votes.
Cost Listed share price¹ Market value Share of votes ⁷ Share of equity ⁷Aktie Number SEK m SEK SEK m % %
Assa Abloy² ³ 105,495,729 1,697 156 16,468 29.5 9.5Fagerhult³ ⁴ 18,620,400 571 142 2,644 49.0 49.2HMS Networks³ 3,027,322 250 210 636 26.7 26.7Loomis² ³ 7,538,328 108 233 1,753 28.6 10.0Nederman³ 3,512,829 306 194 680 30.1 30.1Nobia 17,700,000 359 87 1,540 10.5 10.5Securitas² ³ 39,732,600 1,081 110 4,355 29.6 10.9Sweco² ³ 28,997,760 152 108 3,132 22.8 31.8Tomra³ ⁵ 36,560,000 1,795 72 NOK⁶ 2,736 24.7 24.7Troax³ 6,020,000 397 86 519 30.1 30.1
Total 6,716 34,462
³ Shown as associated companies in the balance sheet.
⁴ At the end of June 2015, 90,000 shares were loaned out and are therefore not counted in Latour's share of votes.
⁵ At the end of the report period, the listed share price was NOK 71.75 which has been translated to SEK at the exchange rate on the balance sheet date.
⁶ The last price paid is used as the listed share price.
⁷ Shares calculated after deduction of treasury shares.
¹ Purchase price at the end of the report period.
² The shareholdings in Assa Abloy, Loomis, Securitas and Sweco consist of class A and class B shares. Due to the limited trading in class A shares in Sweco, and the fact that the other three companies' class A shares are unlisted, the shares are reported together and have been given the same listed share price.
30,5
-0,07*
1,90,6
0,50,5 0,2 0,1 0,1 0,06 0,05 34,5
29
30
31
32
33
34
35
14/12/31 Assa Abloy Securitas Tomra Troax HMS Nederman Fagerhult Sweco Loomis Nobia 15/06/30
Movements in investment portfolio values
+ SEK 3,9 billion
SEK billion
Movements in investment portfolio values (SEK billion). These figures include acquired/sold cost but not dividend payments for the period.
* The Nobia share contributed a negative change in the graph above due disposal of shares. At unchanged ownership would Nobiacontributed positively by SEK 0,4 billion.
-10%
0%
10%
20%
30%
40%
50%
HMS Troax Nobia Tomra Securitas Assa Abloy Nederman Loomis Fagerhult Sweco
Total return for the portfolio companies
SIXRX (10,0%)
The total return, including share price development and dividends, for each portfolio company.

INTERIM REPORT JANUARY – JUNE 2015 11
Results and financial position
Group The Group's profit after financial items was SEK 1,872 m (897). Profit after tax was SEK 1,735 m (829), which is equivalent to SEK 10.88 (5.20) per share.
The Group’s cash in hand and liquid investments amounted to SEK 432 m (265). Interest-bearing debt, excluding pension liabilities, was SEK 4,025 m (2,818). The Group's net debt, including pension liabilities, was SEK 3,599 m (2,543). The equity ratio was 86 (86) per cent calculated on reported equity in relation to total assets, including undisclosed surpluses in associated companies.
There have been no transactions with related parties that have had a material effect on the results or financial position of the Group.
Investments During the period, SEK 67 m (89) was invested in property, plant and equipment, of which SEK 47 m (58) was machinery and equipment, SEK 13 m (17) vehicles and 7 m (14) buildings. Out of total investments for the year, SEK 20 m (31) refers to fixed assets in new acquisitions.
Parent company The parent company's profit after financial items was SEK 1,522 m (819). The parent company's equity ratio was 99 (80) per cent.
Not including repurchased shares, the number of outstanding shares at 30 June 2015 amounted to 159,557,500. At the end of the period, Latour held 402,500 repurchased class B shares. The total number of outstanding call options is 513,000.
The allocation of issued shares is 11,931,278 class A shares and 148,028,722 class B shares.
Events after the reporting period Latour announced its intention to sell the Specma Group
business area.
Risks and uncertainties The main risk to which the Group and the parent company are exposed is the risk attributable to adverse changes in the values of financial instruments, including a general decline in the stock market or in the value of an individual holding. This includes uncertainties relating to changes in exchange rates and interest rates. Latour has a well-diversified holding of shares, spread across nine listed holdings and five wholly-owned business areas. This means that the development and performance of an individual holding will not have a drastic impact on the portfolio as a whole. As the wholly-owned industrial operations have increased in size, Latour as a whole is influenced to a greater degree by changes attributable to these operations. On the whole, Latour is deemed to have a good risk diversification in its portfolio, which covers several industries, with a certain emphasis on sectors linked to the construction industry. Construction can also be divided into several dimensions, such as new builds or government-subsidised repair, conversion or extension work, locally or globally, and housing, office and industrial premises or infrastructure projects. No other material risks in addition to those described in Note 34 of Latour's Annual Report 2014 are deemed to have arisen.
Audit and accounting policies This interim report has been prepared in accordance with the Swedish Annual Accounts Act and IAS 34 Interim Reporting in respect of the Group and in accordance with the Annual Accounts Act and Recommendation RFR 2 Accounting for Legal Entities of the Swedish Financial Reporting Board in respect of the parent company.
New accounting standard requirements that came into effect on 1 January 2015 have not had any impact on the Group's or parent company's accounting as of 30 June 2015.
In other respects, the accounting policies adopted by the Group and parent company are consistent with those used in the preparation of the most recent annual report.
This report has not been audited by the company's auditors.
Gothenburg, 18 August 2015
Jan Svensson President and CEO

12 INTERIM REPORT JANUARY – JUNE 2015
The Board of Directors and the Chief Executive Officer declare that the statements for the six month period give a true and fair view of the company's and the Group's operations, financial positions and performance and describe significant risks and
uncertainties faced by the company and the Group's companies.
Gothenburg, 18 August 2015 Investment AB Latour
Fredrik Palmstierna Chairman
Mariana Burenstam Linder Board member
Anders Böös Board member
Anders G. Carlberg Board member
Carl Douglas Board member
Elisabeth Douglas Board member
Eric Douglas Board member
Jan Svensson Board member/President
For further information please contact: Jan Svensson, President and CEO, tel. +46 (0)705-77 16 40. Anders Mörck, Chief Financial Officer, tel. +46 (0)706-46 52 11 or +46 (0)31-89 17 90.
Conference call Investment AB Latour invites you to listen to a conference call with Jan Svensson and Anders Mörck commencing at 11 a.m. today. The number to call is +46 (0)8 566 426 92. The conference will be broadcast on the Internet. To follow the presentation, please visit our website, www.latour.se. The interim report for the period January – September 2015 will be published on 6 November 2015 The 2015 Year-End Report will be published on 18 February 2016
The information contained in this report constitutes information which the company is required to disclose under the Swedish Securities Market Act. The information was submitted for publication on 18 August 2015, at 8:30 a.m.

INTERIM REPORT JANUARY – JUNE 2015 13
Consolidated income statement
Consolidated statement of comprehensive income
Consolidated cash flow statement
2015 2014 2015 2014 12 mths Jul-Jun Full YearSEK m Q2 Q2 6 mths 6 mths 2014/2015 2014
Net sales 2,161 1,940 4,191 3,686 8,086 7,581Cost of goods sold -1,339 -1,263 -2,599 -2,369 -4,987 -4,757
Gross profit 822 677 1,592 1,317 3,099 2,824Sales costs -401 -361 -789 -718 -1,543 -1,472Administrative costs -143 -128 -293 -268 -548 -523Research and development costs -51 -34 -97 -72 -180 -155Other operating income 21 20 43 28 103 88Other operating expenses -6 -12 -9 -14 -11 -16
Operating profit 242 162 447 273 920 746Income from interests in associates 395 318 1,059 617 1,789 1,347Income from portfolio management 368 20 373 32 377 36Management costs -4 -3 -8 -7 -16 -15
Profit before financial items 1,001 497 1,871 915 3,070 2,114Finance income - 22 64 35 134 105Finance expense incl redemption of pension liability -18 -28 -63 -53 -165 -155
Profit after financial items 983 491 1,872 897 3,039 2,064Taxes -81 -38 -137 -68 -259 -190
Profit for the period 902 453 1,735 829 2,780 1,874- - - - - -
Attributable to:Parent company shareholders 902 453 1,735 829 2,780 1,874Non-controlling interests - - - - - -
Earnings per share regarding profit attributable to parent company shareholders Basic share, SEK 5.65 2.84 10.88 5.20 17.43 11.75 Diluted share, SEK 5.63 2.83 10.83 5.18 17.36 11.70Average number of basic shares outstanding 159,564,538 159,415,912 159,528,967 159,397,061 159,473,781 159,445,425Average number of diluted shares outstanding 160,172,725 160,079,000 160,197,724 160,079,000 160,156,721 160,121,214Number of outstanding shares 159,557,500 159,493,000 159,557,500 159,493,000 159,493,000 159,493,000
2015 2014 2015 2014 12 mths Jul-Jun Full YearSEK m Q2 Q2 6 mths 6 mths 2014/2015 2014
Profit for the period 902 453 1,735 829 2,780 1,874Other comprehensive incomeItems that will not be recycled to the income statementRestatement of net pension obligations - - - - -3 -3
0 0 0 0 -3 -3 Items that may subsequently be recycled to the income statemChange in translation reserve for the period -26 45 -23 52 48 123Change in fair value reserve for the period -104 -34 51 30 364 343Change in hedging reserve for the period -14 -6 39 -6 50 5Change in associated companies' equity 356 -8 718 118 983 383
212 -3 785 194 1,445 854
Other comprehensive income, net after tax 212 -3 785 194 1,442 851
Comprehensive income for the period 1,114 450 2,520 1,023 4,222 2,725Attributable to:Parent company shareholders 1,114 450 2,520 1,023 4,222 2,725Non-controlling interests - - - - - -
2015 2014 2015 2014 12 mths Jul-Jun Full YearSEK m Q2 Q2 6 mths 6 mths 2014/2015 2014
Operating cash flows before movements in working capital 218 160 407 305 883 781Movements in working capital -70 13 -178 -175 -269 -266Operating cash flows 148 173 229 130 614 515Acquisitions of subsidaries -475 -67 -475 -163 -1,034 -722Sale of subsidaries - 4 - 4 - 4Other investments -35 -45 -63 -66 -160 -163Portfolio management 1,117 609 1,172 354 1,084 266Cash flow after investments 755 674 863 259 504 -100Financial payments -726 -721 -857 -485 -358 14Cash flow for the period 29 -47 6 -226 146 -86

14 INTERIM REPORT JANUARY – JUNE 2015
Consolidated balance sheet
Consolidated changes in equity
Key ratios, Group
SEK m 2015/06/30 2014/06/30 2014/12/31
ASSETSGoodwill 3,855 2,262 3,506Other intangible assets 126 69 70Property, plant and equipment 737 730 741Financial assets 12,676 10,228 11,613Inventories etc. 1,351 1,139 1,250Current receivables 1,890 1,710 1,582Cash and bank 432 265 428
Total assets 21,067 16,403 19,190
EQUITY AND LIABILITIESCapital and reserves attributable to parent company shareholders 15,079 11,817 13,523Non-controlling interests 0 0 0Total equity 15,079 11,817 13,523Inerest-bearing long-term liabilities 842 537 842Non-interest-bearing long-term liabilities 227 193 221Interest-bearing current liabilities 3,215 2,308 3,139Non-interest-bearing current liabilities 1,704 1,548 1,465
Equity and liabilities 21,067 16,403 19,190
Share Repurchased Other Profit brought Non-controllingSEK m capital treasury shares reserves forward interests Total
Opening balance 1 Jan 2014 133 -48 725 10,848 0 11,658
Total comprehensive income for the period 471 2,254 2,725Issued call options 3 3Exercise of call options 10 4 14Dividends -877 -877Closing balance 31 Dec 2014 133 -38 1,196 12,232 0 13,523
Opening balance 1 Jan 2015 133 -38 1,196 12,232 0 13,523
Total comprehensive income for the period 67 2,453 2,520Exercise of call options 17 13 30Repurchased treasury shares -37 -37Dividends -957 -957 Closing balance 30 jun 2015 133 -58 1,263 13,741 0 15,079
2015/06/30 2014/06/30 2014/12/31
Return on equity (%) 24 14 15Return on total capital (%) 19 12 13Adjusted equity ratio ¹ (%) 86 86 85Adjusted equity ¹ (SEK m) 37,171 28,587 33,015Surplus value in associated companies² (SEK m) 22,092 16,746 19,492Net debt/equity ratio (%) 10 9 11Net debt/EBITDA 3.3 3.2 3.8Listed share price (SEK) 228 196 203Repurchased shares 402,500 467,000 467,000Average number of repurchased shares 456,309 562,939 514,575Average number of employees 4,412 4,057 4,185Outstanding convertible bonds - - -Issued warrants - - -Issued call options on repurchased shares 513,000 586,000 730,000
¹ Incl. fair value gain in associated companies
² The difference between the carrying amount and market value

INTERIM REPORT JANUARY – JUNE 2015 15
Parent company income statement
Parent company statement of comprehensive income
Parent company balance sheet
Parent company statement of changes in equity
2015 2014 2015 2014 12 mths Jul-Jun Full YearSEK m Q2 Q2 6 mths 6 mths 2014/2015 2014
Income from interests i Group companies 365 330 365 330 365 330Income from interest in associates 518 464 838 464 838 464Income from portfolio management 320 23 320 23 319 22Management costs -3 -2 -5 -4 -10 -9
Profit before financial items 1,200 815 1,518 813 1,512 807
Interest income and similar items 6 13 15 26 37 48Interest expense and similar items -2 -10 -11 -20 -30 -39
Profit after financial items 1,204 818 1,522 819 1,519 816
Taxes - - - - - -
Profit for the period 1,204 818 1,522 819 1,519 816
2015 2014 2015 2014 12 mths Jul-Jun Full YearSEK m Q2 Q2 6 mths 6 mths 2014/2015 2014
Profit for the period 1,204 818 1,522 819 1,519 816Change in fair value reserve for the period -51 -32 97 29 394 326
Total other comprehensive income -51 -32 97 29 394 326
Comprehensive income for the period 1,153 786 1,619 848 1,913 1,142
SEK m 2015/06/30 2014/06/30 2014/12/31
ASSETSFinancial assets 9,121 10,084 9,858Current receivables from Group companies 5 13 10Other current liabilities 2 1 2Cash and bank 5 6 6
Total assets 9,133 10,104 9,876
EQUITY AND LIABILITIESEquity 9,026 8,073 8,371Interese-bearing long-term lilabilities 101 101 101Non-interest-bearing long-term liabilities 5 5 5Interese-bearing current liabilities - 1,912 1,395Non-interest-bearing current liabilities 1 13 4
Equity and liabilities 9,133 10,104 9,876
SEK m 2015/06/30 2014/06/30 2014/12/31
Amount at beginning of year 8,371 8,089 8,089Total comprehensive income for the period 1,619 848 1,142Issued call options - - 3Exercise of call options 30 13 14Repurchased treasury shares -37 14 15Dividends -957 -877 -877
Amount at end of year 9,026 8,073 8,371

16 INTERIM REPORT JANUARY – JUNE 2015
Segment reporting: Development per business area 1 Jan 2015 - 30 June 2015
Segment reporting: Development per business area 1 Jan 2014 – 30 June 2014
Change in consolidated interest-bearing net debt
Hultafors Latour Specma PortfolioSEK m Group Industries Nord-Lock Group Swegon Other management Total
INCOMEExternal sales 712 597 405 707 1,770 4,191Internal sales 4 4RESULTOperating profit 90 78 123 43 119 -6 447
Income from portfolio management 1,424 1,424Finance income 64Finance expense -63Taxes -137
Profit for the period 1,735
OTHER DISCLOSURESInvestments in: property, plant and equipment 4 22 4 6 17 14 67 intangible assets 368 46 9 11 434Depreciation/amortisation 7 11 10 10 42 8 88
Industrial operations
Hultafors Latour Specma PortfolioSEK m Group Industries Nord-Lock Group Swegon Other management Total
INCOMEExternal sales 625 515 360 664 1,501 21 3,686Internal sales 4 4RESULTSOperating result 75 27 98 -22 111 -16 273
Income from portfolio management 642 642Finance income 35Finance expense -53Taxes -68
Profit for the period 829
OTHER DISCLOSURESInvestments in: property, plant and equipment 6 13 12 8 40 10 - 89 intangible assets 106 158 - 264Depreciation/amortisation 8 11 8 9 35 9 80
Industrial operations
SEK m 2014/12/31 Change in cash Change in loans Other changes 2015/06/30
Interest-bearing receivables 37 -11 26Cash 428 4 432Pensions provisions -30 -2 -32Long-term liabilities -812 2 -810Utilised bank overdraft facilities -45 -79 -124Interest-bearing current liabilities -3,094 3 -3,091
Interest-bearing net debt -3,516 4 -74 -13 -3,599

INTERIM REPORT JANUARY – JUNE 2015 17
Five year overview
Note 1: Business combinations
During the period, Latour acquired the entire shareholding of Reac Components Sp zoo, the entire shareholding of Laudorp Holding Oy and the entire shareholding of Hydraulikhuset BKH AB.
Laudorp Holding Oy is the parent company of the Produal Group, which in addition to the parent company consists of the subsidiaries Laudrop Oy, Produal Holding Oy, Produal Oy, Produal Sverige AB, Produal A/S and Produal S.A.S.
During the period, Reac Components contributed SEK 3 m in income and SEK -1 m in operating profit. Neither Laudorp Holding Oy nor Hydraulikhuset BKH AB have contributed any revenues or profit during the period, but will contribute from 1 July 2015.
All acquisitions have been made with the aim of strengthening and developing the Latour Group's existing operations. Transaction costs for acquisitions made during the period amount to SEK 4 m. Estimated additional purchase prices have
been booked for the acquisition of Hydraulikhuset BKH AB and can amount to a maximum of SEK 7 m. This sum has also been reserved.
SEK m Jul-Jun 2014/2015 2014 2013 2012 2011
Net sales, SEK m 8,086 7,581 6,944 6,788 7,171Operating profit, SEK m 920 746 621 635 883Income from interest in associates, SEK m 1,789 1,347 1,060 914 1,449Income from portfolio management, SEK m 377 36 43 35 -41Profit after finance items, SEK m 3,070 2,064 1,710 1,497 2,230Earnings per share, SEK 17 12 9 8 14Return on equity, % 21 15 13 13 18Return on total capital, % 17 13 12 12 17Adjusted equity ratio, % 86 85 88 86 84Net debt/equity ratio, % 10 11 7 8 7Listed share price, SEK 228 203 172 124 107
Specification of acquisitions
Transfer date Country Business area Number of employees
1 May 2015 Ergolet/Reac Components Poland Latour Industries 11517 June 2015 Laudorp Holding Oy (Produal) Finland Latour Industries 9529 June 2015 Hydraulikhuset BKH AB Sweden Specma Group 26
Two other acquisitions have been made in addition to those mentioned above but these have no material impact on the financial statements.
Assets and liabilities in acquisitions
Consolidated carrying amount
Intangible assets 172Property, plant and equipment 20Finance assets 3Inventories 42Account receivable 36Other receivable 3Cash 34Long-term liabilities -1Current liabilities -48
Net indentifiable assets and liabilities 261Group goodwill 255
Total purchase price 516
Additional purchase price -7
Cash settlement purchase price 509Acquisition of non-cash items -Acquired cash -34
Effect of Group cash 475

18 INTERIM REPORT JANUARY – JUNE 2015
Note 2: Information regarding financial assets and liabilities The table below shows how fair value is determined for the financial instruments valued at fair value in the report on financial positions. Fair value is determined according to three different levels. Compared to the 2014 annual accounts, there were no transfers between the different levels of the fair value hierarchy and there were no changes in the methods and/or principles used during the first six months of 2015.
Financial instruments – Fair value THE GROUP 30 June 2015
Listed financial assets are valued at their quoted market price on the balance sheet date. Fair value on unlisted financial assets is determined by using valuation techniques such as a recent transaction, the price of a similar instrument or discounted cash flows.
Hedging instruments consist of forward exchange contracts and interest rate swaps and are included in level 2. Valuation at fair value of the forward exchange contracts is based on levels established by the bank on an active market.
The fair value of accounts receivable and other receivables, current receivables, cash and other liquid funds, accounts payable and other liabilities as well as long-term liabilities are estimated to have the same value as their carrying amount. Market interest is not believed to materially deviate from the discount rate for interest-bearing long-term liabilities and therefore the carrying amount is considered in essence equal to the fair value.
The Group's valuation process is carried out by the Group finance and treasury department where a team works with valuation of the financial assets and liabilities held by the Group.
Loans and
Financial assets Derivatives accounts
Available-for-sales values at fair value used for receivable, Other Total carryingfinancial assets via profit and loss hedging purposes cash liabilities amount
FINANCIAL ASSETSListed shares, management 1 540¹ 1,540Other long-term securities holdings 21² 21Other long-term receivables 24³ 24Listed shares, trading 42¹ 42Unrealised gains, currency derivatives 74² 74Other current receivables 1 625³ 1,625Cash 432³ 432
Total 1,561 42 74 2,081 0 3,758
FINANCIAL LIABILITIESLong-term loans 810³ 810Bank overdraft facilities 124³ 124Current loans 3 091³ 3,091Other liabilities 995³ 995Unrealised gains, currency derivatives 13² 25
Total 0 0 13 0 5,020 5,033
¹ Level 1 – valued at fair value based on quoted prices on an active market for identical assets.
² Level 2 – valued at fair value based on other observable inputs for assets and liabilities than quoted price included in level 1.
³ Level 3 – valued at fair value based on inputs for assets and liabilities unobservable to the market.

INTERIM REPORT JANUARY – JUNE 2015 19
Information by quarter
SEK m Q2 Q1 Full Year Q4 Q3 Q2 Q1 Full Year Q4 Q3 Q2 Q1
INCOME STATEMENTNet sales 2,161 2,030 7,581 2,018 1,877 1,940 1,746 6,944 1,844 1,716 1,764 1,620Cost of goods sold -1,339 -1,260 -4,757 -1,257 -1,131 -1,263 -1,106 -4,399 -1,173 -1,077 -1,117 -1,032
Gross profit 822 770 2,824 761 746 677 640 2,545 671 639 647 588
Costs etc. for the operation -580 -565 -2,078 -550 -484 -515 -529 -1,924 -534 -437 -496 -457
Operating profit 242 205 746 211 262 162 111 621 137 202 151 131
Total portfolio management 759 665 1,368 422 304 335 307 1,089 283 354 238 214
Profit before financial items 1,001 870 2,114 633 566 497 418 1,710 420 556 389 345
Net financial items -18 19 -50 -26 -6 -6 -12 -52 -4 -24 -7 -17
Profit after financial items 983 889 2,064 607 560 491 406 1,658 416 532 382 328
Taxes -81 -56 -190 -55 -67 -38 -30 -175 -36 -53 -52 -34
Profit for the period 902 833 1,874 552 493 453 376 1,483 380 479 330 294
KEY RATIOSEarnings per share, SEK 5.65 5.22 11.75 3.46 3.09 2.84 2.36 9.30 2.38 3.01 2.07 1.85Cash flow for the period 29 -23 -86 19 121 -47 -179 230 194 73 -9 -28Adjusted equity ratio, % 86 87 85 85 85 86 87 88 88 86 84 86Adjusted equity 37,171 39,271 33,015 33,015 30,256 28,587 28,181 26,830 26,830 24,197 21,494 22,013Net asset value 44,150 46,379 39,859 39,859 37,117 35,582 35,022 33,799 33,799 30,459 27,229 27,942Net asset value per share, SEK 277 291 250 250 233 223 220 212 212 191 171 175Listed share price, SSEK 228 247 203 203 191 196 196 172 172 157 135 148
NET SALESHultafors Group 362 350 1,306 365 315 322 304 1,208 333 305 282 288Latour Industries 311 290 1,055 286 229 281 243 982 264 223 256 239Nord-Lock 197 208 722 169 193 192 169 624 154 162 158 150Specma Group 363 344 1,294 328 302 344 320 1,152 306 265 302 279Swegon 928 842 3,209 870 838 801 700 2,936 783 748 753 652Other companies and eliminations 0 -4 -5 – 0 0 10 42 4 13 13 12
2,161 2,030 7,581 2,018 1,877 1,940 1,746 6,944 1,844 1,716 1,764 1,620
OPERATING PROFITHultafors Group 48 42 177 53 50 41 33 126 54 40 12 20Latour Industries 41 37 68 29 11 20 8 63 16 18 13 16Nord-Lock 57 66 211 45 68 57 42 114 13 36 35 30Specma Group 20 23 1 5 18 -26 4 0 -3 0 2 1Swegon 80 39 298 98 90 74 37 346 89 101 96 59
246 207 755 229 237 166 124 649 169 196 158 126Gain/loss from sale/purchase of -3 -2 -13 0 -4 -8 -1 -25 -20 -2 - -3Other companies and items -1 0 4 -18 29 4 -12 -3 -13 8 -7 8
242 205 746 211 262 162 111 621 136 202 151 131
OPERATING MARGIN (%)Hultafors Group 13.2 11.9 13.6 14.5 15.8 12.8 11.1 10.4 16.1 13.3 4.2 6.9Latour Industries 13.3 12.7 6.4 10.2 4.9 7.2 2.9 6.5 6.2 8.2 5.1 6.6Nord-Lock 28.9 31.6 29.3 26.7 35.1 29.6 24.7 18.3 8.6 22.0 22.0 20.5Specma Group 5.5 6.7 0.1 1.5 5.8 -7.5 1.2 0.0 -0.9 -0.2 0.6 0.4Swegon 8.6 4.6 9.3 11.2 10.7 9.2 5.3 11.8 11.4 13.5 12.8 9.1
11.4 10.2 10.0 11.4 12.6 8.6 7.1 9.3 9.2 11.4 8.9 8.6
2015 2014 2013

Investment AB Latour (publ) Corporate ID no. 556026–3237
J A Wettergrens gata 7, Box 336, SE-401 25 Gothenburg, Sweden. Tel +46 (0)31-89 17 90. Fax +46 (0)31-45 60 63 [email protected], www.latour.se