Interim report - Book cheap flights with the low-cost ... · Q22017 norwegian.com Interim report...
16
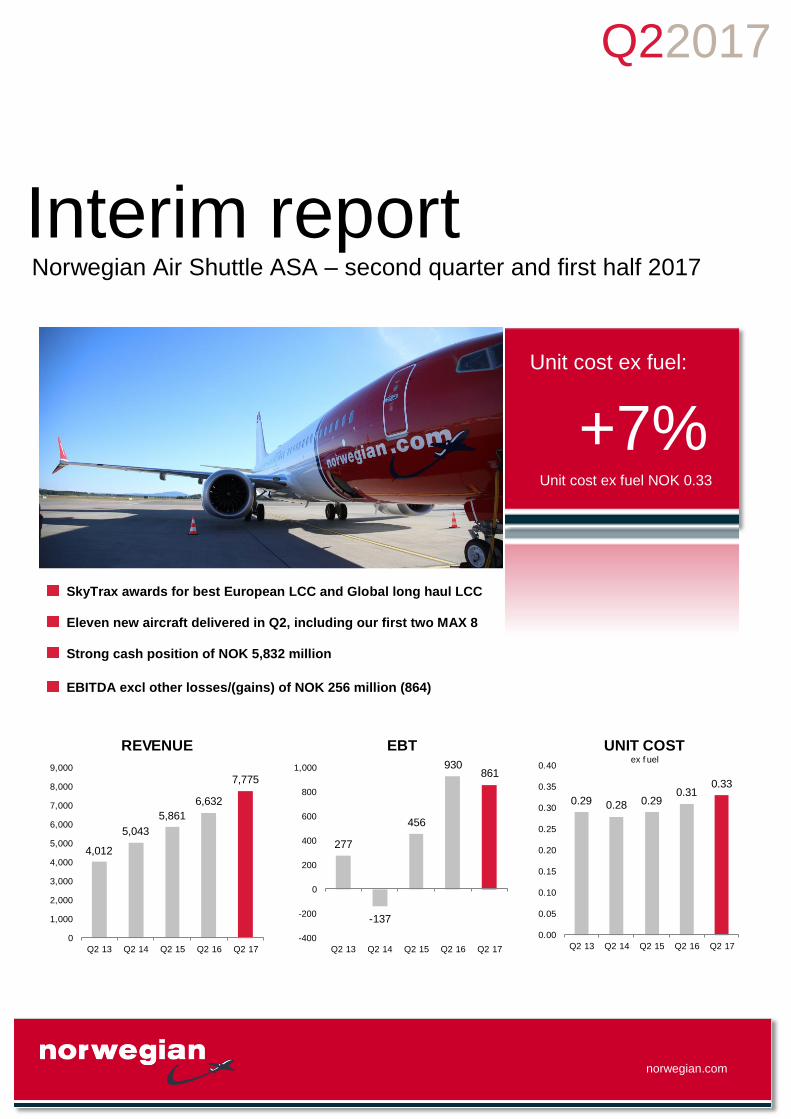
Q22017 norwegian.com Interim report Norwegian Air Shuttle ASA – second quarter and first half 2017 4,012 5,043 5,861 6,632 7,775 0 1,000 2,000 3,000 4,000 5,000 6,000 7,000 8,000 9,000 Q2 13 Q2 14 Q2 15 Q2 16 Q2 17 REVENUE 277 -137 456 930 861 -400 -200 0 200 400 600 800 1,000 Q2 13 Q2 14 Q2 15 Q2 16 Q2 17 EBT 0.29 0.28 0.29 0.31 0.33 0.00 0.05 0.10 0.15 0.20 0.25 0.30 0.35 0.40 Q2 13 Q2 14 Q2 15 Q2 16 Q2 17 UNIT COST ex f uel SkyTrax awards for best European LCC and Global long haul LCC Eleven new aircraft delivered in Q2, including our first two MAX 8 Strong cash position of NOK 5,832 million EBITDA excl other losses/(gains) of NOK 256 million (864) Unit cost ex fuel: +7% Unit cost ex fuel NOK 0.33
Transcript of Interim report - Book cheap flights with the low-cost ... · Q22017 norwegian.com Interim report...
Q22017
norwegian.com
Interim report Norwegian Air Shuttle ASA – second quarter and first half 2017
4,012
5,043
5,861
6,632
7,775
0
1,000
2,000
3,000
4,000
5,000
6,000
7,000
8,000
9,000
Q2 13 Q2 14 Q2 15 Q2 16 Q2 17
REVENUE
277
-137
456
930861
-400
-200
0
200
400
600
800
1,000
Q2 13 Q2 14 Q2 15 Q2 16 Q2 17
EBT
0.29 0.28 0.290.31
0.33
0.00
0.05
0.10
0.15
0.20
0.25
0.30
0.35
0.40
Q2 13 Q2 14 Q2 15 Q2 16 Q2 17
UNIT COSTex f uel
SkyTrax awards for best European LCC and Global long haul LCC
Eleven new aircraft delivered in Q2, including our first two MAX 8
Strong cash position of NOK 5,832 million
EBITDA excl other losses/(gains) of NOK 256 million (864)
Unit cost ex fuel:
+7% Unit cost ex fuel NOK 0.33
Q22017
norwegian.com
2| Report for the second quarter and first half 2017
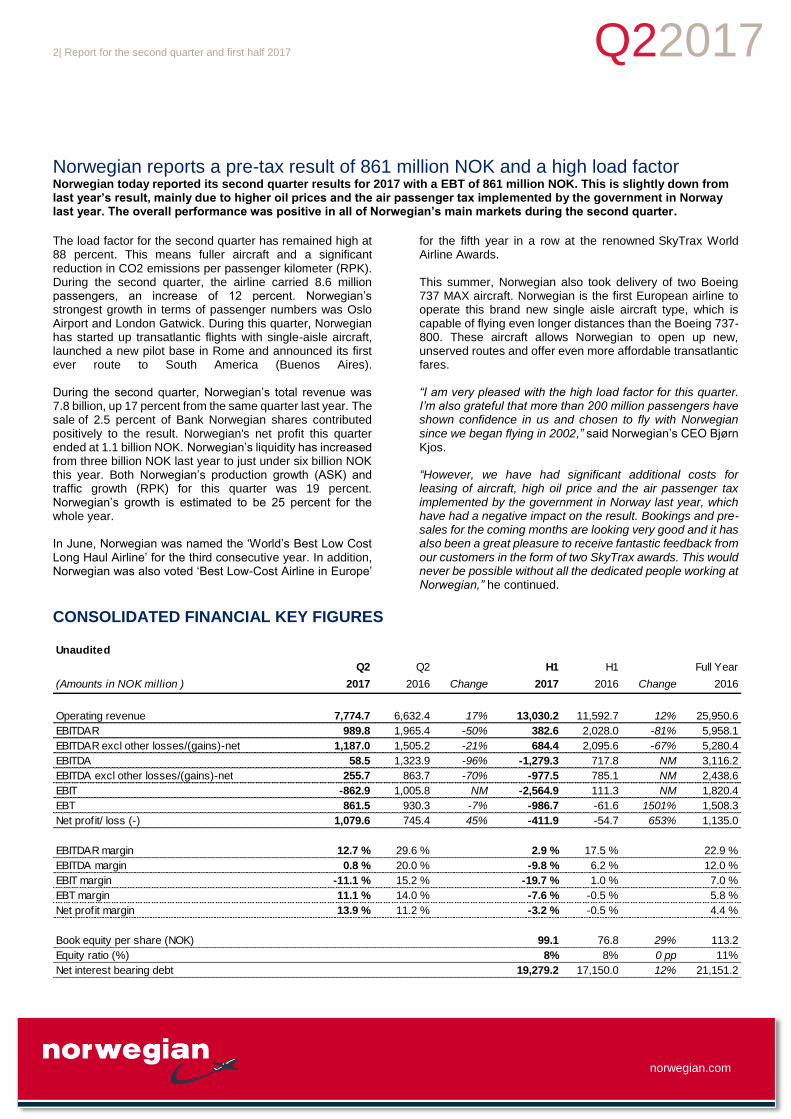
Norwegian reports a pre-tax result of 861 million NOK and a high load factor Norwegian today reported its second quarter results for 2017 with a EBT of 861 million NOK. This is slightly down from last year’s result, mainly due to higher oil prices and the air passenger tax implemented by the government in Norway last year. The overall performance was positive in all of Norwegian’s main markets during the second quarter. The load factor for the second quarter has remained high at 88 percent. This means fuller aircraft and a significant reduction in CO2 emissions per passenger kilometer (RPK). During the second quarter, the airline carried 8.6 million passengers, an increase of 12 percent. Norwegian’s strongest growth in terms of passenger numbers was Oslo Airport and London Gatwick. During this quarter, Norwegian has started up transatlantic flights with single-aisle aircraft, launched a new pilot base in Rome and announced its first ever route to South America (Buenos Aires). During the second quarter, Norwegian’s total revenue was 7.8 billion, up 17 percent from the same quarter last year. The sale of 2.5 percent of Bank Norwegian shares contributed positively to the result. Norwegian's net profit this quarter ended at 1.1 billion NOK. Norwegian’s liquidity has increased from three billion NOK last year to just under six billion NOK this year. Both Norwegian’s production growth (ASK) and traffic growth (RPK) for this quarter was 19 percent. Norwegian’s growth is estimated to be 25 percent for the whole year. In June, Norwegian was named the ‘World’s Best Low Cost Long Haul Airline’ for the third consecutive year. In addition, Norwegian was also voted ‘Best Low-Cost Airline in Europe’
for the fifth year in a row at the renowned SkyTrax World Airline Awards. This summer, Norwegian also took delivery of two Boeing 737 MAX aircraft. Norwegian is the first European airline to operate this brand new single aisle aircraft type, which is capable of flying even longer distances than the Boeing 737-800. These aircraft allows Norwegian to open up new, unserved routes and offer even more affordable transatlantic fares. “I am very pleased with the high load factor for this quarter. I’m also grateful that more than 200 million passengers have shown confidence in us and chosen to fly with Norwegian since we began flying in 2002,” said Norwegian’s CEO Bjørn Kjos. “However, we have had significant additional costs for leasing of aircraft, high oil price and the air passenger tax implemented by the government in Norway last year, which have had a negative impact on the result. Bookings and pre-sales for the coming months are looking very good and it has also been a great pleasure to receive fantastic feedback from our customers in the form of two SkyTrax awards. This would never be possible without all the dedicated people working at Norwegian,” he continued.
CONSOLIDATED FINANCIAL KEY FIGURES
Unaudited
Q2 Q2 H1 H1 Full Year
(Amounts in NOK million ) 2017 2016 Change 2017 2016 Change 2016
Operating revenue 7,774.7 6,632.4 17% 13,030.2 11,592.7 12% 25,950.6
EBITDAR 989.8 1,965.4 -50% 382.6 2,028.0 -81% 5,958.1
EBITDAR excl other losses/(gains)-net 1,187.0 1,505.2 -21% 684.4 2,095.6 -67% 5,280.4
EBITDA 58.5 1,323.9 -96% -1,279.3 717.8 NM 3,116.2
EBITDA excl other losses/(gains)-net 255.7 863.7 -70% -977.5 785.1 NM 2,438.6
EBIT -862.9 1,005.8 NM -2,564.9 111.3 NM 1,820.4
EBT 861.5 930.3 -7% -986.7 -61.6 1501% 1,508.3
Net profit/ loss (-) 1,079.6 745.4 45% -411.9 -54.7 653% 1,135.0
EBITDAR margin 12.7 % 29.6 % 2.9 % 17.5 % 22.9 %
EBITDA margin 0.8 % 20.0 % -9.8 % 6.2 % 12.0 %
EBIT margin -11.1 % 15.2 % -19.7 % 1.0 % 7.0 %
EBT margin 11.1 % 14.0 % -7.6 % -0.5 % 5.8 %
Net profit margin 13.9 % 11.2 % -3.2 % -0.5 % 4.4 %
Book equity per share (NOK) 99.1 76.8 29% 113.2
Equity ratio (%) 8% 8% 0 pp 11%
Net interest bearing debt 19,279.2 17,150.0 12% 21,151.2

Q22017
norwegian.com
3| Report for the second quarter and first half 2017
OPERATIONAL REVIEW
CONSOLIDATED TRAFFIC FIGURES AND RATIOS
Unaudited
Q2 Q2 H1 H1 Full Year
(Ratios in NOK) 2017 2016 Change 2017 2016 Change 2016
Yield 0.41 0.42 -3% 0.38 0.41 -9% 0.42
Unit Revenue 0.36 0.37 -3% 0.32 0.36 -9% 0.36
Unit Cost 0.43 0.40 9% 0.44 0.41 7% 0.41
Unit Cost ex fuel 0.33 0.31 7% 0.34 0.33 2% 0.32
Ancillary Revenue/PAX 136 131 4% 137 134 2% 134
Internet bookings 73% 72% 1 pp 75% 74% 1 pp 75%
ASK (million) 17,330 14,512 19% 31,979 26,315 22% 57,910
RPK (million) 15,195 12,743 19% 27,563 22,793 21% 50,798
Passengers (million) 8.62 7.72 12% 15.28 13.55 13% 29.30
Load Factor 87.7 % 87.8 % -0.1 pp 86.2 % 86.6 % -0.4 pp 87.7 %
Average sector length (km) 1,508 1,418 6% 1,519 1,432 6% 1,473
Fuel consumption (metric tonnes) 352,119 296,538 19% 651,320 541,420 20% 1,190,017
CO2 per RPK 73 73 0% 74 75 -1% 74
Traffic Development 8.62 million passengers travelled with Norwegian in the second quarter of 2017, compared to 7.72 million in the second quarter of 2016, an increase of 12%. Production (ASK) and passenger traffic (RPK) increased by 19%. The load factor was stable at 87.7% compared to second quarter last year. At the end of the quarter, the total fleet including aircraft on maintenance and excluding wetlease comprised 133 aircraft. The Group utilized every operational aircraft on average 11.5 block hours per day in the second quarter compared to 11.6 last year.
Operating performance Punctuality, share of flights departing on schedule, was 78% in the second quarter, equal to last year. Regularity, share of scheduled flights actually taking place, was 99.4% in the second quarter, a slight decline from 99.6% in the same quarter last year.

Q22017
norwegian.com
4| Report for the second quarter and first half 2017
FINANCIAL REVIEW
Income statement and financial key figures Second quarter underlying earnings were affected by strong production growth of 19%, introduction to new markets, increasing jet fuel prices and increasing share of leased aircraft in the fleet. Unit revenue decreased by 3% influenced by increased average sector length and currency effects. The unit cost increased by 9% from the same quarter last year, while the unit cost ex fuel increased by 7% in the same period. Additionally, non recurring events from sale- and leaseback transactions for old and new aircraft and a realization of 2.5% of the investment in Norwegian Finans Holding ASA, significantly affected second quarter earnings. Following the realization of shares, the investment in Norwegian Finans Holding ASA will be measured at fair market value. Operating profit before interest, depreciation, amortization, restructuring, rent/leasing and associated company (EBITDAR) excluding other losses/(gains) for the first quarter was NOK 1,187 million (1,505), while profit (loss) before tax (EBT) was NOK 861 million (930). Included in second quarter EBT are other losses/(gains) amounting to a net loss of NOK 197 million, compared to a net gain of NOK 460 million last year. Other losses/(gains) include effects from foreign currency contracts, forward fuel contracts, losses or gains on translation of working capital in foreign currency and net losses or gains on sale of fixed assets.
Revenue Total revenue in the second quarter was NOK 7,775 million (6,632), an increase of 17%. NOK 6,268 million (5,413) of the revenue in the second quarter was related to passenger revenue. Passenger revenue per unit produced (unit revenue) in the second quarter was NOK 0.36, a decrease of 3% compared to the same quarter last year (NOK 0.37). Increased sector length, depreciation of NOK against foreign currencies and lower prices have affected the yield and unit revenue in the quarter. Unit revenue in constant currency was 1 p.p lower than last year. Ancillary revenue was NOK 1,173 million (1,010) in the second quarter, and ancillary revenue per passenger was NOK 136 per passenger (NOK 131). Other revenue of NOK 334 million (210) consist of freight, commissions, third-party products and external aircraft lease. From this quarter onwards, Norwegian presents gain or loss from sale of fixed assets as other gains/(losses). In previous periods, net gains from sale of fixed assets have been included in other revenue. Comparative figures have been adjusted accordingly. Norwegian has grown rapidly expanding international traffic and adding new bases, destinations and markets to its portfolio. Consequently, the share of passengers outside Scandinavia has increased significantly during the second quarter, with the strongest passenger growth in Spain, the US and France. The international expansion enables continued cost efficiency and continuously improves competitive power.
7.0%
-3.0%
8.0%
14.0%
11.0%
-5%
0%
5%
10%
15%
20%
Q2 13 Q2 14 Q2 15 Q2 16 Q2 17
EBT MARGIN
5,413
1,010
210
6,268
1,173
334
0
1,000
2,000
3,000
4,000
5,000
6,000
7,000
Passenger revenue Ancillary passenger
revenue
Other revenue
REVENUE SPLIT
Q2 2016 Q2 2017
0% 10% 20% 30% 40%
Norway
Spain
Sweden
Denmark
UK
Other
Finland
USA
Germany
France
Italy
Poland
PASSENGERS BY ORIGIN
Q2 2016 Q2 2017

Q22017
norwegian.com
5| Report for the second quarter and first half 2017
Operating expenses
COST BREAKDOWN
Unaudited
Q2 Q2 H1 H1 Full Year
(Amounts in NOK million ) 2017 2016 Change 2017 2016 Change 2016
Personnel expenses 1,261.9 941.7 34% 2,428.1 1,866.0 30% 3,971.4
Sales/distribution expense 238.2 195.9 22% 462.2 395.3 17% 758.7
Aviation fuel 1,744.1 1,262.3 38% 3,270.2 2,123.1 54% 5,052.9
Airport and ATC charges 981.9 863.7 14% 1,715.1 1,548.3 11% 3,303.8
Handling charges 844.2 777.5 9% 1,566.0 1,377.2 14% 2,995.6
Technical maintenance expenses 647.1 413.7 56% 1,196.3 821.3 46% 1,865.0
Other f light operation expenses 367.3 282.8 30% 749.5 619.2 21% 1,206.4
General and adm expenses 502.9 389.6 29% 958.3 747.0 28% 1,519.1
Other losses/(gains) - net 197.2 -460.2 NM 301.8 67.6 347% -677.7
Total operating expenses 6,784.8 4,667.0 45% 12,647.6 9,565.0 32% 19,995.4
Leasing 931.3 641.5 45% 1,661.9 1,310.2 27% 2,841.9
Total operating expenses incl lease 7,716.2 5,308.5 45% 14,309.4 10,875.2 32% 22,837.2
Total operating expenses excluding leasing and
depreciation increased by 45% to NOK 6,785 million (4,667) this quarter. Operating expenses increased mainly due to a production increase of 19%, increasing jet fuel prices and effects from other losses/(gains). The unit cost was NOK 0.43, an increase of 9% compared to the second quarter last year. Unit cost excluding fuel was NOK 0.33, an increase of 7% compared to the same quarter last year. At constant currency, unit cost excluding fuel increased by 5% compared to the same quarter last year. Personnel expenses increased by 34% to NOK 1,262
million (942) in the second quarter compared to the same quarter last year. Unit cost for personnel expenses increased by 12% from the same quarter last year. Increased capacity and continued international expansion have affected the unit cost in the second quarter, partially offset by increased average sector length. The average number of full time equivalents (FTE) increased by 41% compared to same quarter last year. Sales and distribution expenses increased by 22% to NOK
238 million (196) in the second quarter compared to the same quarter last year. Unit cost for sales and distribution expenses increased by 2%. Increased credit card commissions from sales in international markets and increased sales through travel agents are partially offset by unit cost reductions from increased production and increased average sector length. Aviation fuel expenses increased by 38% to NOK 1,744
million (1,262) in the second quarter compared to the same quarter last year. Unit cost has increased by 16%, due to an increase in jet fuel prices in USD of 15% and depreciation of NOK against USD, partially offset by efficiency gains from
adding new fuel-efficient aircraft in the fleet and increased sector length. The Group has at the end of the second quarter 2017 forward contracts to cover approximately 52% of fuel exposure in 2017 at an average price of USD 494 per ton, and approximately 27% of fuel exposure in 2018 at an average price of USD 494 per ton. Airport and air traffic control (ATC) charges increased by
14% to NOK 982 million (864) in the second quarter compared to the same quarter last year. Unit cost for airport and ATC charges decreased by 5%, mainly due to increased average sector length. Handling charges increased by 9%, to NOK 844 million
(778) in the second quarter compared to the same quarter last year. Unit cost for handling decreased by 9%, mainly due to increased average sector length. Technical maintenance expenses increased by 56% to
NOK 647 million (414) in the second quarter compared to the same quarter last year. Four new leased 787 Dreamliners and nineteen new leased 737-800s have been added to the fleet in the past twelve months, while five leased 737-800s have been redelivered. Unit cost for technical maintenance increased by 31%, due to changes in the aircraft portfolio, scalating engine service costs and depreciation of NOK against USD. A larger share of leased aircraft in the fleet, and a larger share of 787 aircraft lead to increased unit costs. Estimated maintenance costs on owned aircraft are capitalized and depreciated over the estimated useful life of the maintenance and overhaul components or until next planned maintenance. Estimated maintenance on leased aircraft are accrued based on aircraft utilization and

Q22017
norwegian.com
6| Report for the second quarter and first half 2017
recognized in the income statement in advance of maintenance checks. Other flight operation expenses increased by 30% to NOK
367 million (283) in the second quarter compared to the same quarter last year. Other flight operation expenses include costs directly attributable to operation of the aircraft fleet, such as de-icing, insurance and other leases, as well as training, meals and housing for crew. Unit cost increased by 9% in the quarter, mainly due to external training and accommodation for pilots and crew to prepare for further international expansion. General and administrative expenses increased by 29% to
NOK 503 million (390) in the second quarter compared to the same quarter last year, due to the introduction of new markets, products and international bases as well as increased costs from issuing cash points. Unit cost for general and administrative expenses increased by 8%. Other losses/(gains)-net; includes gains and losses from
foreign currency contracts, forward fuel contracts and translation of working capital in foreign currency. Net gain or loss from sale of fixed assets are also included in other losses/(gain)-net from the second quarter 2017. Comparative figures have been adjusted accordingly. Net loss in the second quarter was NOK 197 million (gain of NOK 460 million last year), including a loss of NOK 116 million from translation of working capital in foreign currency, a loss of NOK 240 million from forward contracts on currency and fuel and a net gain of NOK 159 million from sale of fixed assets. Leasing costs increased by 45% to NOK 931 million (642)
in the second quarter compared to the same quarter last year. Unit cost for leasing increased by 22%. The cost increases from adding four new leased Boeing 787 Dreamliners and fourteen leased 737-800s, net of redeliveries, in the past twelve months and from increased use of wetlease in the quarter. In June, Norwegian signed a Letter of Intent (LOI) for a sale and leaseback transaction totaling 11 used Boeing 737-800 aircraft. Depreciation increased by 9% to NOK 345 million (318) in
the second quarter compared to the same quarter last year. During the second quarter the Group operated 64 (59) owned Boeing 737-800s, three (3) owned Boeing 787-8 Dreamliners and introduced our two first owned Boeing MAX8. Three owned Airbus 320neo were leased to HK Express, none in the same quarter last year. Profit/loss from associated companies in the second
quarter was estimated to NOK 50 million (74) which represents the Group’s share of Norwegian Finans Holding’s results up until May 2017 and 50% share of estimated net profit in joint venture OSM Aviation Ltd. From June 2017, following the sale of 4.7 million shares related to Norwegian Finans Holding, the Group’s investment in Norwegian Finans Holding is measured at fair market value with realized gain presented under financial items. A Cash Settled Total Return Swap without buy-back option was entered after the sale of shares to obtain financial exposure, while reducing voting rights.
Financial Items were NOK 1,674 million (-149) in the second
quarter, including an impact of NOK 2,047 million related to the sale of 4.7 million shares and reclassification of the investment related to Norwegian Finans Holding. Interest on prepayments of NOK 136 million (84) was capitalized, reducing interest expenses. Income taxes amounted to a tax benefit of NOK 218 million
in the second quarter compared to an expense of NOK 185 million last year. The effective tax rate is impacted by the non-taxable gain from the transaction related to shares in Norwegian Finans Holding.
Financial position and liquidity Aircraft assets are accounted for in USD, creating a natural hedge against USD denominated borrowings when translated into NOK. Eight 737-800 aircraft were delivered during the second quarter, financed through a sale-leaseback arrangement. Following a signed Letter Of Intent (LOI) for sale and leaseback transaction totaling 11 used Boeing 737-800 aircraft operated by Norwegian, these aircraft are now classified as assets held for sale and measured at fair value. In the second quarter, the company also received two new Boeing MAX8, financed with an insurance guaranteed financing product. Net assets at the end of second quarter 2017 is affected by an appreciation of NOK against USD year to date of 3%. Net interest bearing debt at the end of the second quarter was NOK 19,279 million compared to NOK 21,151 million at the end of last year. At the end of the second quarter, the equity ratio is 8%, compared to 8% at the same period last year and 11% at the end of 2016. Total non-current assets amount to NOK 28,936 million at
the end of the second quarter, compared to NOK 31,969 million at the end of last year. The main investments during the year are prepayments to aircraft manufacturers for aircraft on order and delivery of three new owned aircraft, while the LOI for new sale leaseback arrangements on owned used aircraft have reduced tangible fixed assets by approximately NOK 2.5 billion. Total current assets amount to NOK 15,128 million at the
end of the second quarter, compared to NOK 5,793 million at the end of last year. Assets held for sale related to the LOI for sale leasback of 11 owned used aircraft amount to NOK 1,900 million. Investments include economic interests in Norwegian Finans Holding as well as unrealized gains on currency and jet fuel hedges and amount to NOK 2,609 million. Receivables have increased by NOK 1,672 million during the year due to increased production and seasonality. Cash and cash equivalents have increased by NOK 3,508 million during the year. Total non-current liabilities at the end of the second quarter
were NOK 19,111 million, compared to NOK 20,303 million at the end of last year. Long-term borrowings have decreased by NOK 1,422 million during the year, due to unsecured bond NAS 06 moving to short term borrowings, repayment of long term aircraft financing and reclassification of borrowings

Q22017
norwegian.com
7| Report for the second quarter and first half 2017
related to 11 aircraft presented as assets held for sale. A new unsecured bond NAS 08 of SEK 1,000 million and borrowings for three new owned aircraft have increased non-current liabilities in the first half. Other non-current liabilities increased by NOK 230 million. Total short-term liabilities at the end of the second quarter
were NOK 21,408 million, compared to NOK 13,411 million at the end of last year. Current liabilities increased by NOK 568 million from end of last year. Short-term borrowings increased by NOK 3,058 million during the year due to NAS06 falling into short term, net drawdowns on credit facility of NOK 350 million, new pre-delivery payment financing and reclassification of borrowings related to assets held for sale, partially offset by reduced pre-delivery payment financing due to aircraft deliveries. Air traffic settlement liabilities increased by NOK 4,372 million from end of last year due to increased production, increased ticket sales and seasonal effects. Equity at the end of the second quarter was NOK 3,544
million compared to NOK 4,049 million at the end of last year. Equity decreased mainly due to net losses in the period of NOK 412 million and exchange rate losses from subsidiaries of NOK 105 million.
Cash flow Cash and cash equivalents were NOK 5,832 million at the end of the second quarter compared to NOK 2,324 million last year. Cash flow from operating activities in the second quarter
amounted to NOK 1,397 million compared to NOK 1,223 million in the second quarter last year. Air traffic settlement liability increased by NOK 484 million (282) and receivables increased by NOK 1,102 million (55) during the second quarter, mainly due to increased production. Cash from other adjustments amounted to NOK 232 million (-253) during the second quarter. Other adjustments mainly consist of changes in current liabilities and currency gain/loss with no cash effects. Cash flow from investment activities in the second quarter
was NOK -321 million, compared to NOK -1,986 million in the second quarter last year. Prepayments to aircraft manufacturers and investments in new aircraft are the main investments, offset by proceeds from sale-leaseback. Two new owned aircraft were delivered in the second quarter, while five owned aircraft were delivered in the second quarter last year. Cash flow from financing activities in the second quarter
was NOK 0 million compared to NOK 625 million in the second quarter last year. Proceeds from new bond issues, financing of new aircraft and pre-delivery payment financing are offset by down payments on borrowings and financing costs in the quarter.
RISK AND UNCERTAINTIES The airline industry is undergoing a challenging time as a consequence of Brexit and strong competition. Future
demand is dependent on sustained consumer and business confidence in the Company’s key markets. A market place where capacity growth exceeds market growth will increase the risk of yield pressure. However, low yield stimulates new demand, thus growing the market further. This necessitates a similar reduction in the cost level in order to maintain profitability. In the event of industrial actions, operations may be disrupted, causing inconvenience for passengers and affect financial performance. Fuel price and currency fluctuations, as well as hedging of such, are risks that can have a significant impact on Norwegian’s business and financial results. Sudden and significant changes in fuel price and foreign exchange rates could significantly affect fuel and other costs, and debt and assets denominated in foreign currency.
OUTLOOK The demand for travelling with Norwegian and advance
bookings have been satisfactory entering the third quarter of
2017. Norwegian will continue to take advantage of its
increasing competitive power realized through continuous
cost efficiency, and from introducing larger aircraft
(seventeen new Boeing 737-800Ws, nine new Boeing 787-
9s and six 737-MAX will be delivered in 2017) with a lower
operating cost. In addition, three Airbus 320neo aircraft are
scheduled to be delivered in 2017, which will be leased to
airline HK Express.
Norwegian has twenty-three operational bases globally.
Norwegian guides for a production growth (ASK) of 25 % for
2017. The growth in Boeing 737 production comes from
adding Boeing 737-800s, and introducing Boeing 737-MAX.
The Boeing 787 production will grow in accordance with the
phasing in of aircraft and the company will have twenty-one
Boeing 787s by the end of 2017. Norwegian may decide to
adjust capacity in order to optimize the route portfolio
depending on the development in the overall economy and
in the marketplace.
Assuming a fuel price of USD 500 per ton, USD/NOK 8.25
and EUR/NOK 9.00 for the remaining year 2017 (excluding
hedged volumes) and with the currently planned route
portfolio, the company is targeting a unit cost (CASK) in the
area of NOK 0.42 for 2017. This is an increase from
previous guiding and is a result of effects from lower
production (ASK), sale and leaseback, currency and fuel.
Norwegian continues to establish and develop an
organizational structure that will secure cost efficient
international expansion and necessary traffic rights for the
future.
Fornebu, July 12, 2017 Board of Directors, Norwegian Air Shuttle ASA

Q22017
norwegian.com
8| Report for the second quarter and first half 2017
CONDENSED CONSOLIDATED INCOME STATEMENT
Unaudited
Q2 Q2 H1 H1 Full Year
(Amounts in NOK million ) Note 2017 2016 2017 2016 2016
Operating revenue
Total operating revenue 3 7,774.7 6,632.4 13,030.2 11,592.7 25,950.6
Total operating revenue 7,774.7 6,632.4 13,030.2 11,592.7 25,950.6
Operating expenses
Operational expenses 4,822.8 3,795.9 8,959.4 6,884.4 15,182.5
Payroll and other personnel expenses 1,261.9 941.7 2,428.1 1,866.0 3,971.4
Other operating expenses 700.1 -70.6 1,260.1 814.9 838.6
Total operating expenses 6,784.8 4,667.0 12,647.6 9,565.0 19,992.5
Operating profit before leasing, depreciation
and amortization (EBITDAR) 989.8 1,965.4 382.6 2,028.0 5,958.1
Leasing 931.3 641.5 1,661.9 1,310.2 2,841.9
Operating profit before depreciation
and amortization (EBITDA) 58.5 1,323.9 -1,279.3 717.8 3,116.2
Depreciation and amortization 345.3 318.1 709.5 606.5 1,295.8
Impairment assets held for sale 576.2 0.0 576.2 0.0 0.0
Operating profit (EBIT) -862.9 1,005.8 -2,564.9 111.3 1,820.4
Financial items
Interest income 32.6 8.8 43.9 21.6 43.6
Interest expense 270.9 123.7 456.1 255.8 686.0
Other f inancial income (expense) 1,912.4 -34.4 1,879.5 -48.2 117.5
Net financial items 1,674.2 -149.4 1,467.3 -282.5 -524.9
Profit/loss from associated companies 50.2 73.8 110.9 109.6 212.8
Profit (loss) before tax (EBT) 861.5 930.3 -986.7 -61.6 1,508.3
Income tax expense (income) -218.1 184.9 -574.8 -6.9 373.4
Net profit (loss) 1,079.6 745.4 -411.9 -54.7 1,135.0
Net profit attributable to:
Ow ners of the parent company 1,072.7 745.4 -410.4 -54.7 1,135.3
Non-controlling interests 6.9 0.0 -1.5 0.0 -0.3
Earnings per share (NOK) - Basic 30.0 20.8 -11.5 -1.5 31.7
Earnings per share (NOK) - Diluted 29.5 20.8 -11.5 -1.5 31.5
No. of shares at the end of the period 35,759,639 35,759,639 35,759,639 35,759,639 35,759,639
Average no. of shares outstanding 35,759,639 35,759,639 35,759,639 35,759,639 35,759,639
Average no. of shares outstanding - diluted 36,384,639 35,759,639 36,384,639 35,759,639 36,072,139

Q22017
norwegian.com
9| Report for the second quarter and first half 2017
CONDENSED CONSOLIDATED STATEMENT OF FINANCIAL POSITION Unaudited
30 Jun 30 Jun 31 Dec
(Amounts in NOK million ) Note 2017 2016 2016
ASSETSNon-current assets
Intangible assets 966.6 795.9 439.8
Tangible f ixed assets 27,110.6 26,722.7 30,099.7
Fixed asset investments 858.6 1,155.8 1,429.9
Total non-current assets 28,935.8 28,674.4 31,969.3
Current assets
Assets held for sale 1,899.8 0.0 0.0
Inventory 101.5 100.4 102.5
Investments 2,609.2 0.0 353.2
Receivables 4,685.5 3,215.8 3,014.0
Cash and cash equivalents 5,831.7 3,010.4 2,323.6
Total current assets 15,127.6 6,326.6 5,793.3
TOTAL ASSETS 44,063.4 35,001.0 37,762.7
EQUITY AND LIABILITIESShareholders equity
Shareholder's equity 7 3,520.6 2,746.1 4,038.2
Non-controlling interests 23.5 0.0 10.8
Total equity 3,544.1 2,746.1 4,049.0
Non-current liabilities
Other non-current liabilities 1,827.0 1,394.2 1,596.9
Long term borrow ings 6 17,284.1 18,124.3 18,706.1
Total non-current liabilities 19,111.1 19,518.4 20,303.0
Short term liabilities
Current liabilities 4,543.5 3,449.3 3,975.6
Short term borrow ings 6 7,826.8 2,036.2 4,768.8
Air traff ic settlement liabilities 9,038.0 7,251.0 4,666.2
Total short term liabilities 21,408.3 12,736.5 13,410.7
Total liabilities 40,519.3 32,255.2 33,713.7
TOTAL EQUITY AND LIABILITIES 44,063.4 35,001.0 37,762.7

Q22017
norwegian.com
10| Report for the second quarter and first half 2017
CONDENSED CONSOLIDATED STATEMENT OF CASH FLOW
Unaudited
Q2 Q2 H1 H1 Full Year
(Amounts in NOK million ) 2017 2016 2017 2016 2016
OPERATING ACTIVITIES
Profit before tax 861.5 930.3 -986.7 -61.6 1,508.3
Paid taxes 0.0 0.0 40.2 0.0 -28.6
Depreciation, amortization and impairment 921.4 318.1 1,285.7 606.5 1,295.8
Impairment assets held for sale 576.2 0.0 576.2 0.0 0.0
Fair value adjustment of f inancial assets -2,046.8 0.0 -2,046.8 0.0 0.0
Changes in air traff ic settlement liabilities 483.8 282.4 4,371.8 3,236.5 651.8
Changes in accounts receivable -1,101.6 -54.6 -1,671.5 -638.8 -549.4
Other adjustments 231.6 -253.1 -243.8 87.9 168.6
Net cash flows from operating activities 1,396.7 1,223.1 2,795.7 3,230.5 3,046.5
INVESTMENT ACTIVITIES
Purchases, proceeds and prepayment of tangible assets -320.6 -1,925.7 -415.2 -3,592.0 -6,447.2
Other investing activities -0.1 -60.0 -99.6 -60.0 -65.3
Net cash flows from investing activities -320.7 -1,985.7 -514.7 -3,652.0 -6,512.4
FINANCING ACTIVITIES
Loan proceeds 954.3 1,211.2 2,915.5 2,205.7 5,805.8
Principal repayments -502.4 -348.5 -946.4 -792.9 -1,572.8
Financing costs paid -452.2 -238.2 -743.6 -413.3 -941.9
Net cash flows from financial activities -0.3 624.5 1,225.5 999.4 3,302.8
Foreign exchange effect on cash -1.6 -41.3 1.5 -21.6 32.6
Net change in cash and cash equivalents 1,074.3 -179.3 3,508.0 556.3 -130.5
Cash and cash equivalents in beginning of period 4,757.4 3,189.8 2,323.6 2,454.2 2,454.2
Cash and cash equivalents in end of period 5,831.7 3,010.4 5,831.7 3,010.4 2,323.6
CONDENSED CONSOLIDATED STATEMENT OF COMPREHENSIVE INCOME Unaudited
Q2 Q2 H1 H1 Full Year
(Amounts in NOK million ) 2017 2016 2017 2016 2016
Net profit (loss) for the period 1,079.6 745.4 -411.9 -54.7 1,135.0
Actuarial gains and losses 0.0 0.0 0.0 0.0 24.5
Exchange rate differences Group -78.1 15.3 -105.1 -164.5 -104.3
Exchange rate differences non-controlling interests 0.0 0.0 0.0 0.0 1.2
Share of OCI associated companies -0.7 0.0 -0.4 0.0 1.2
Total comprehensive income for the period 1,000.9 760.7 -517.4 -219.2 1,057.5
Total comprehensive income attributable to:
Ow ners of the company 993.9 760.7 -515.9 -219.2 1,056.6
Non-controlling interests 6.9 0.0 -1.5 0.0 0.9
CONDENSED CONSOLIDATED CHANGES IN EQUITY
Unaudited
H1 H1 Full Year
(Amounts in NOK million ) 2017 2016 2016
Equity - Beginning of period 4,049.0 2,965.3 2,965.3
Total comprehensive income for the period -517.4 -219.2 1,057.5
Transactions w ith non-controlling interests 0.0 0.0 9.9
Equity change on employee options 12.5 0.0 16.3
Equity - End of period 3,544.1 2,746.1 4,049.0

Q22017
norwegian.com
11| Report for the second quarter and first half 2017
NOTES TO THE CONDENSED CONSOLIDATED INTERIM FINANCIAL STATEMENTS
Note 1 General and accounting principles The condensed consolidated interim financial statements comprise Norwegian Air Shuttle ASA and its subsidiaries (the Group). The Company is a limited liability company incorporated in Norway. The consolidated financial statements of the Group for the year ended December 31, 2016 is available at www.norwegian.com. These condensed consolidated interim financial statements have been prepared in accordance with rules and regulations of Oslo Stock Exchange and International Financial Reporting Standards (IAS) 34 Interim Financial Reporting. They do not include all of the information required for full annual consolidated financial statements, and should be read in conjunction with consolidated financial statements for the Group at December 31, 2016. These condensed interim financial statements are unaudited. The accounting policies applied by the Group in these condensed consolidated financial statements are the same as those applied by the Group in its consolidated financial statements for the year ended December 31, 2016.
Judgments, estimates and assumptions The preparation of condensed consolidated interim financial statements in accordance with IFRS and applying the chosen accounting policies requires management to make judgments, estimates and assumptions that affect the reported amounts of assets, liabilities, income and expenses. The estimates and associated assumptions are based on historical experience and various other factors that are believed to be reasonable under the circumstances. Actual results may differ from these estimates. The estimates and the underlying assumptions are reviewed on an ongoing basis. Revisions to accounting estimates are recognized in the period in which the estimate is revised if the revision affects only that period or in the period of the revision and future periods if the revision affects both current and future periods. In preparing these condensed consolidated interim financial statements, the significant judgments made by management in applying the Group’s accounting policies and the key sources of estimation uncertainty were the same as those that applied to the consolidated financial statements for the period ended December 31, 2016.
Note 2 Risk
SENSITIVITY ANALYSIS Unaudited
Effect on income
MNOK
1% decrease in jet fuel price 65
1% depreciation of NOK against USD -149
1% depreciation of NOK against EURO -5 The sensitivity analysis reflects the effect on operating costs in 2017 by changes in market prices and exchange rates. The effect on operating costs is annualized based on current level of production, fuel prices and exchange rates. Operational hedges are not included in the calculation of the sensitivity.
Q22017
norwegian.com
12| Report for the second quarter and first half 2017
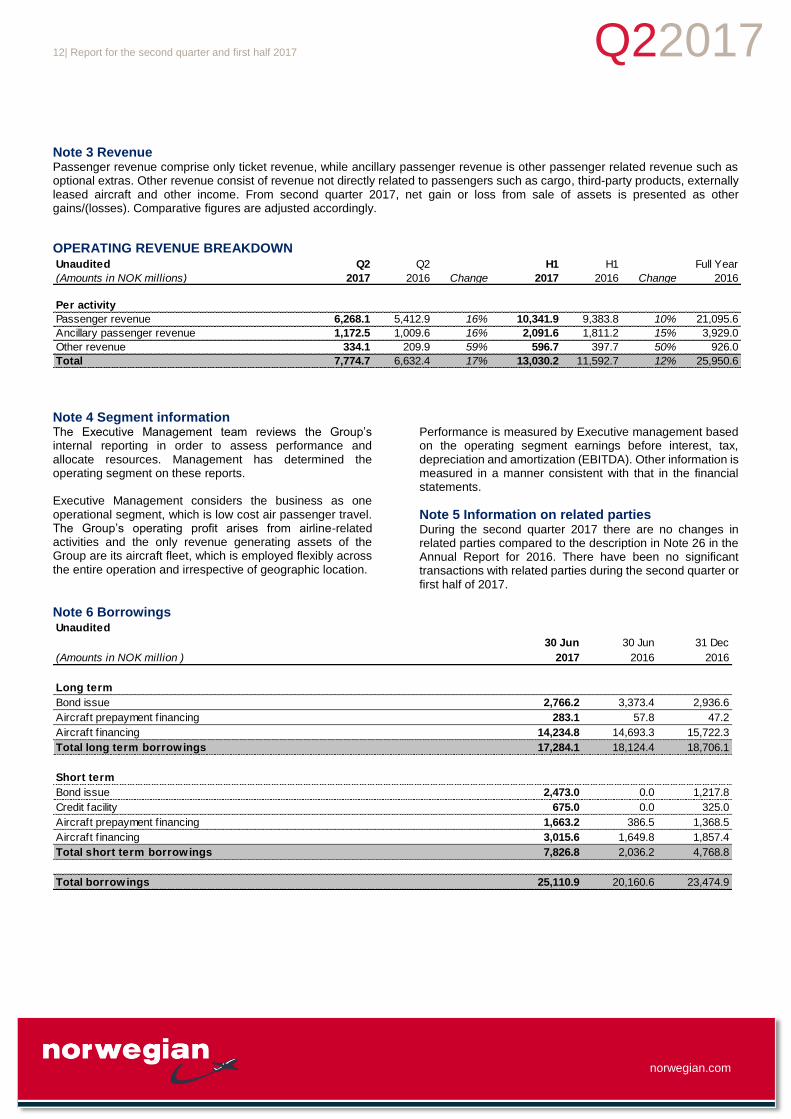
Note 3 Revenue Passenger revenue comprise only ticket revenue, while ancillary passenger revenue is other passenger related revenue such as optional extras. Other revenue consist of revenue not directly related to passengers such as cargo, third-party products, externally leased aircraft and other income. From second quarter 2017, net gain or loss from sale of assets is presented as other gains/(losses). Comparative figures are adjusted accordingly.
OPERATING REVENUE BREAKDOWN Unaudited Q2 Q2 H1 H1 Full Year
(Amounts in NOK millions) 2017 2016 Change 2017 2016 Change 2016
Per activity
Passenger revenue 6,268.1 5,412.9 16% 10,341.9 9,383.8 10% 21,095.6
Ancillary passenger revenue 1,172.5 1,009.6 16% 2,091.6 1,811.2 15% 3,929.0
Other revenue 334.1 209.9 59% 596.7 397.7 50% 926.0
Total 7,774.7 6,632.4 17% 13,030.2 11,592.7 12% 25,950.6
Note 4 Segment information The Executive Management team reviews the Group’s internal reporting in order to assess performance and allocate resources. Management has determined the operating segment on these reports. Executive Management considers the business as one operational segment, which is low cost air passenger travel. The Group’s operating profit arises from airline-related activities and the only revenue generating assets of the Group are its aircraft fleet, which is employed flexibly across the entire operation and irrespective of geographic location.
Performance is measured by Executive management based on the operating segment earnings before interest, tax, depreciation and amortization (EBITDA). Other information is measured in a manner consistent with that in the financial statements.
Note 5 Information on related parties
During the second quarter 2017 there are no changes in related parties compared to the description in Note 26 in the Annual Report for 2016. There have been no significant transactions with related parties during the second quarter or first half of 2017.
Note 6 Borrowings Unaudited
30 Jun 30 Jun 31 Dec
(Amounts in NOK million ) 2017 2016 2016
Long term
Bond issue 2,766.2 3,373.4 2,936.6
Aircraft prepayment f inancing 283.1 57.8 47.2
Aircraft f inancing 14,234.8 14,693.3 15,722.3
Total long term borrowings 17,284.1 18,124.4 18,706.1
Short term
Bond issue 2,473.0 0.0 1,217.8
Credit facility 675.0 0.0 325.0
Aircraft prepayment f inancing 1,663.2 386.5 1,368.5
Aircraft f inancing 3,015.6 1,649.8 1,857.4
Total short term borrowings 7,826.8 2,036.2 4,768.8
Total borrowings 25,110.9 20,160.6 23,474.9

Q22017
norwegian.com
13| Report for the second quarter and first half 2017
Note 7 Shareholder information
20 Largest shareholders at June 30, 2017
Shareholder Country Number of shares Percent
1 HBK Invest AS Norw ay 6,405,873 17.9 %
2 Folketrygdfondet Norw ay 2,551,203 7.1 %
3 Skagen AS Norw ay 2,297,218 6.4 %
4 Danske Capital (Norw ay) Norw ay 1,816,517 5.1 %
5 Ferd AS Norw ay 1,500,000 4.2 %
6 DNB Asset Management AS Norw ay 1,118,627 3.1 %
7 KLP Forsikring Norw ay 934,787 2.6 %
8 Pareto Nordic Investments AS Norw ay 635,000 1.8 %
9 Bank of America Merrill Lynch (UK) United Kingdom 623,181 1.7 %
10 Apollo Asset Limited Monaco 410,000 1.1 %
11 Statoil Kapitalforvaltning ASA Norw ay 381,123 1.1 %
12 DNB Markets Norw ay 370,581 1.0 %
13 Nordnet Bank AB Norw ay 367,498 1.0 %
14 TT International United Kingdom 344,623 1.0 %
15 Credit Suisse Securities (Europe) Limited United Kingdom 336,931 0.9 %
16 Alfred Berg Kapitalforvaltning AS Norw ay 325,790 0.9 %
17 Storebrand Kapitalforvaltning AS Norw ay 324,538 0.9 %
18 Catella Bank S.A. Luxembourg 300,580 0.8 %
19 Altair Investment Management Limited Bermuda 291,299 0.8 %
20 Saxo Bank A/S Denmark 289,321 0.8 %
Top 20 shareholders 21,624,690 60.5 %
Other shareholders 14,134,949 39.5 %
Total number of shares 35,759,639 100.0 %
Norwegian Air Shuttle ASA had a total of 35,759,639 shares outstanding at June 30, 2017, equal to December 31, 2016. There were a total of 14,364 shareholders at the end of the second quarter. *The shareholding of HBK Holding AS reflects the actual shareholding and may deviate from the official shareholder register as HBK Holding AS has signed a securities lending agreement with Nordea and Danske Bank. Under this agreement, these institutions may borrow shares from HBK Holding AS for a limited period to improve the liquidity in the share trading, for example by fulfilling their market maker obligations.
Note 8 Contingencies and legal claims The Norwegian Group disclosed comments in note 27 to the Annual Financial Statements for 2016 relating to indications from the Central Tax Office for Large Enterprises, that the rules on contingent tax-free transfers within a group nor applies to the transfer of business in 2014. In July 2017, Norwegian received a reassessment from the tax office in which it argues that tax-free transfers within a group does not apply to the transfer of the business in 2014. The reassessment resulted in increased taxable income in 2014. Norwegian and its tax advisor are still of the opinion that the reassessments for 2013 and 2014 by the tax office are without merit and has thus not made any provisions for any potential tax claim in its interim financial statements as of first half 2017. The 2013/2014 reassessments have been/will be appealed. There are no other additions or changes to the information regarding contingencies or legal claims presented in note 27 to the Annual Financial Statements for 2016.
Note 9 Events after the reporting date There have been no other material events subsequent to the reporting period that might have a significant effect on the consolidated interim financial statements for the second quarter or first half of 2017.

Q22017
norwegian.com
14| Report for the second quarter and first half 2017
Responsibility statement
We confirm, to the best of our knowledge, that the condensed set of financial statements for the period from January 1 to June 30
2017 has been prepared in accordance with IAS 34 – Interim Financial Reporting, and gives a true and fair view of the Group’s
assets, liabilities, financial position and profit or loss as a whole. We also confirm, to the best of our knowledge, that the interim
management report includes a fair review of important events that have occurred during the first six months of the financial year
and their impact on the condensed set of financial statements, a description of the principal risks and uncertainties for the
remaining six months of the financial year, and major related parties transactions.
Fornebu, July 12, 2017
The Board of Directors of Norwegian Air Shuttle ASA
Bjørn H. Kise
Chair
Liv Berstad
Deputy Chair
Ada Kjeseth
Director
Christian Fredrik Stray
Director
Geir Olav Øien
Director (employee representative)
Linde Olsen
Director (employee representative)
Marcus Hall
Director (employee representative)

Q22017
norwegian.com
15| Report for the second quarter and first half 2017
DEFINITIONS
Alternative performance measures
Norwegian Air Shuttle’s financial information is prepared in accordance with International Financial Reporting Standards (IFRS). In addition, the company presents alternative performance measures (APM). The APMs are regularly reviewed by management and their aim is to enhance stakeholders’ understanding of the company’s performance. APMs are calculated consistently over time and are based on financial data presented in accordance with IFRS and other operational data as described in the table below.
Aircraft lease expense Lease and rental expenses on aircraft including both dry leases and wet leases.
Ancillary revenue / PAX Ancillary passenger revenue divided by passengers.
ASK Available seat kilometers. Number of available passenger seats multiplied by flight distance.
Average sector length Total flown distance divided by number of flights.
Book equity per share Total equity divided by number of shares outstanding.
Clean EBITDA
EBITDA adjusted for certain non-recurring items. Clean EBITDA is shown in the presentation accompanying this quarterly report, including a reconciliation to EBITDA as presented in the quarterly report and a detailed specification of any non-recurring items. Clean EBITDA is useful to users of the quarterly presentation in order to evaluate the company’s operating performance over time and compared to competitors.
CO2 per RPK Amount of CO2 emissions divided by RPK.
Constant currency A currency exchange rate that excludes the impact of exchange rate fluctuations from comparable period, e.g. last year as comparable period.
EBIT Earnings before net financial items, income tax expense (income) and share of profit (loss) from associated companies. Equivalent to operating profit in the consolidated income statement in the annual report.
EBIT margin EBIT divided by total operating revenue.
EBITDA Earnings before net financial items, income tax expense (income), depreciation, amortization, impairment, and share of profit (loss) from associated companies.
EBITDA ex other losses/(gains)
Earnings before net financial items, income tax expense (income), depreciation, amortization and share of profit (loss) from associated companies, adjusted for other losses/(gains)-net.
EBITDA margin EBITDA divided by total operating revenue.
EBITDAR Earnings before net financial items, income tax expense (income), depreciation, amortization and impairment, restructuring, aircraft leasing expense and share of profit (loss) from associated companies.
EBITDAR ex other losses/(gains)
Earnings before net financial items, income tax expense (income), depreciation, amortization, restructuring, rent/leasing, and share of profit (loss) from associated companies, adjusted for other losses/(gains)-net.
EBITDAR margin EBITDAR divided by total operating revenue.
EBT Earnings before income tax expense (income). Equivalent to profit (loss) before income tax expense (income) in the Consolidated Income Statement in the annual report.
EBT margin EBT divided by total operating revenue.
Equity ratio Book equity divided by total assets.
Fixed asset investment Consists of the following items presented in the statement of financial position in the annual report: Financial assets available for sale, investment in associate and other receivables.
Fuel consumption Aviation fuel consumed, presented in metric tons.
Load factor RPK divided by ASK. Describes the utilization of available seats.
Net interest bearing debt Long term borrowings plus short term borrowings less cash and cash equivalents.
Other losses/(gains)-net Consist of fair value losses/(gains) on financial assets at fair value through profit or loss and foreign exchange losses/(gains) on operating activities.
Passengers Number of passengers flown.
RPK Revenue passenger kilometers. Number of sold seats multiplied by flight distance.
Total operating expenses Total operating expenses not including aircraft lease expenses, depreciation, amortization and impairment.
Total operating expenses incl lease
Total operating expenses not including depreciation, amortization and impairment.
Unit cost Total operating expenses plus leasing, excluding other losses/(gains)-net, divided by ASK.
Unit cost ex fuel Total operating expenses plus leasing, excluding other losses/(gains)-net and aviation fuel expense, divided by ASK.
Unit revenue Passenger revenue divided by ASK.
Yield Passenger revenue divided by RPK. A measure of average fare per kilometer.

Q22017
norwegian.com
16| Report for the second quarter and first half 2017
Information about the Norwegian Group
Head office Norwegian Air Shuttle ASA Mailing address P.O. Box 113
NO–1366 Lysaker Visiting address Oksenøyveien 3, Fornebu Telephone +47 67 59 30 00 Telefax +47 67 59 30 01 Internet www.norwegian.com Organization Number NO 965 920 358 MVA
Board of Directors Norwegian Air Shuttle ASA Bjørn H. Kise Chair Liv Berstad Deputy Chair Ada Kjeseth Director Christian Fredrik Stray Director Geir Olav Øien Director (employee representative) Linda Olsen Director (employee representative) Marcus Hall Director (employee representative)
Group Management Bjørn Kjos Chief Executive Officer Tore Østby Chief Financial Officer Asgeir Nyseth Chief Operating Officer Anne-Sissel Skånvik Chief Communications Officer Thomas A. Ramdahl Chief Commercial Officer Jan Dahm-Simonsen Chief Human Resources Officer Frode Berg Chief Legal Officer Dag Skage Chief Information Officer Tore K. Jenssen CEO, Arctic Aviation Assets Ltd
and CEO, Norwegian Air International Ltd
Edward Thorstad Chief Customer Officer Bjørn Erik Barman-Jensen Managing Director, Norwegian
Air Resources Ltd Lennart Ceder Accountable Manager,
Norwegian Air UK Ltd Brede Huser Senior Vice President
Norwegian Reward
Investor Relations Tore Østby [email protected]
Other sources of Information Annual reports www.norwegian.no/om-oss/selskapet/investor-relations/reports-and-presentations/annual-reports/ Quarterly publications www.norwegian.no/om-oss/selskapet/investor-relations/reports-and-presentations/interim-reports-and-
presentations/
Financial Calendar 2017
4 August Monthly traffic data July
6 September Monthly traffic data August
5 October Monthly traffic data September
26 October Third Quarter Results
6 November Monthly traffic data October
6 December Monthly traffic data November