Interim Report as of March 31, 2015 - Deutsche Bank · Deutsche Bank Interim Report as of March 31,...
124
Interim Report as of March 31, 2015
-
Upload
phungkhanh -
Category
Documents
-
view
213 -
download
0
Transcript of Interim Report as of March 31, 2015 - Deutsche Bank · Deutsche Bank Interim Report as of March 31,...

Interim Reportas of March 31, 2015
Deutsche Bank Interim Report as of March 31, 2015
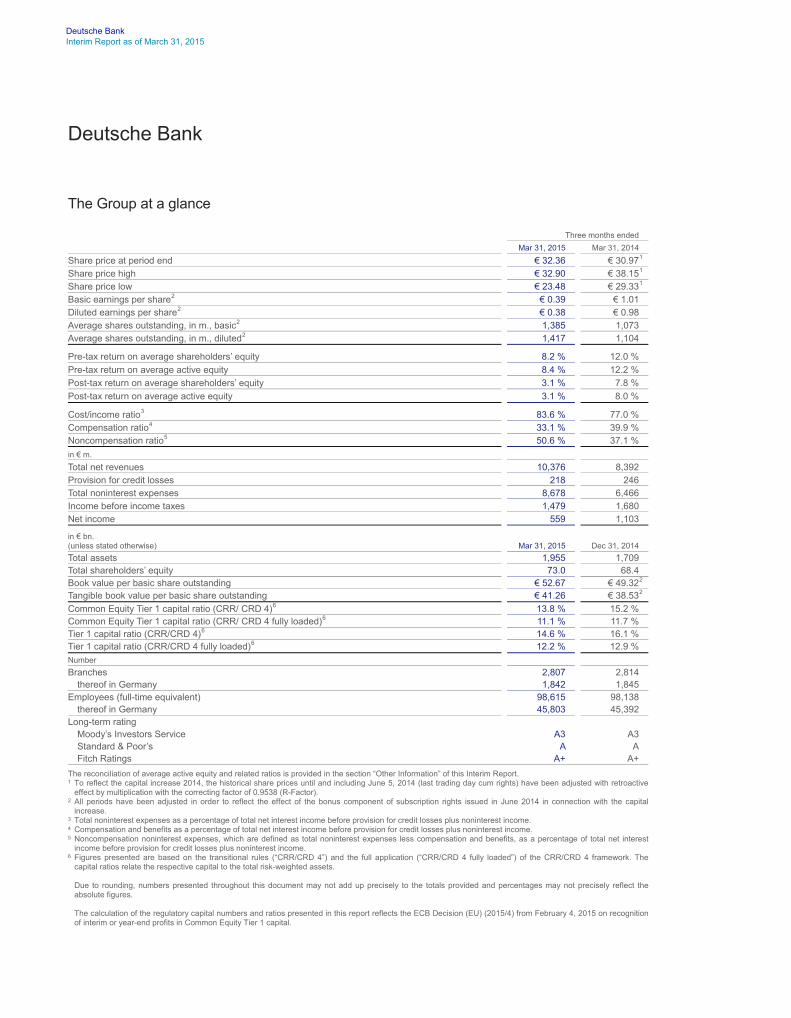
The Group at a glance
Three months ended
Mar 31, 2015 Mar 31, 2014
Share price at period end € 32.36 € 30.97
1 Share price high € 32.90 € 38.15
1 Share price low € 23.48 € 29.33
1 Basic earnings per share
2 € 0.39 € 1.01 Diluted earnings per share
2 € 0.38 € 0.98 Average shares outstanding, in m., basic
2 1,385 1,073 Average shares outstanding, in m., diluted
2 1,417 1,104 Pre-tax return on average shareholders’ equity 8.2 % 12.0 %
Pre-tax return on average active equity 8.4 % 12.2 %
Post-tax return on average shareholders’ equity 3.1 % 7.8 %
Post-tax return on average active equity 3.1 % 8.0 % Cost/income ratio
3 83.6 % 77.0 % Compensation ratio
4 33.1 % 39.9 % Noncompensation ratio
5 50.6 % 37.1 %
in € m.
Total net revenues 10,376 8,392 Provision for credit losses 218 246 Total noninterest expenses 8,678 6,466 Income before income taxes 1,479 1,680 Net income 559 1,103 in € bn. (unless stated otherwise) Mar 31, 2015 Dec 31, 2014
Total assets 1,955 1,709 Total shareholders’ equity 73.0 68.4 Book value per basic share outstanding € 52.67 € 49.32
2 Tangible book value per basic share outstanding € 41.26 € 38.53
2
Common Equity Tier 1 capital ratio (CRR/ CRD 4)
6 13.8 % 15.2 % Common Equity Tier 1 capital ratio (CRR/ CRD 4 fully loaded)
6 11.1 % 11.7 % Tier 1 capital ratio (CRR/CRD 4)
6 14.6 % 16.1 % Tier 1 capital ratio (CRR/CRD 4 fully loaded)
6 12.2 % 12.9 %
Number
Branches 2,807 2,814 thereof in Germany 1,842 1,845
Employees (full-time equivalent) 98,615 98,138 thereof in Germany 45,803 45,392
Long-term rating Moody’s Investors Service A3 A3 Standard & Poor’s A A Fitch Ratings A+ A+
The reconciliation of average active equity and related ratios is provided in the section “Other Information” of this Interim Report. 1 To reflect the capital increase 2014, the historical share prices until and including June 5, 2014 (last trading day cum rights) have been adjusted with retroactive
effect by multiplication with the correcting factor of 0.9538 (R-Factor). 2 All periods have been adjusted in order to reflect the effect of the bonus component of subscription rights issued in June 2014 in connection with the capital
increase. 3 Total noninterest expenses as a percentage of total net interest income before provision for credit losses plus noninterest income. 4 Compensation and benefits as a percentage of total net interest income before provision for credit losses plus noninterest income. 5 Noncompensation noninterest expenses, which are defined as total noninterest expenses less compensation and benefits, as a percentage of total net interest
income before provision for credit losses plus noninterest income. 6 Figures presented are based on the transitional rules (“CRR/CRD 4”) and the full application (“CRR/CRD 4 fully loaded”) of the CRR/CRD 4 framework. The
capital ratios relate the respective capital to the total risk-weighted assets.
Due to rounding, numbers presented throughout this document may not add up precisely to the totals provided and percentages may not precisely reflect the absolute figures.
The calculation of the regulatory capital numbers and ratios presented in this report reflects the ECB Decision (EU) (2015/4) from February 4, 2015 on recognition of interim or year-end profits in Common Equity Tier 1 capital.
Deutsche Bank

Management Report
02 Operating and Financial ReviewEconomic Environment – 2Deutsche Bank Performance – 3Consolidated Results of Operations – 4Segment Results of Operations – 6Financial Position – 13
18 Outlook
24 Risk Report
Confirmations
Consolidated Financial Statements
70 Review Report
71 Consolidated Statement of Income
72 Consolidated Statement of Comprehensive Income
73 Consolidated Balance Sheet
74 Consolidated Statement of Changes in Equity
76 Consolidated Statement of Cash Flows
Content
Notes to the Consolidated Financial Statements
Other Information
77 Basis of Preparation
78 Impact of Changes in Accounting Principles
80 Segment Information
81 Information on the Consolidated Income Statement
84 Information on the Consolidated Balance Sheet
105 Other Financial Information
117 Non-GAAP Financial Measures

Deutsche Bank Management Report 2 Interim Report as of March 31, 2015 Operating and Financial Review Economic Environment
Management Report
Operating and Financial Review
Economic Environment
In the first quarter of 2015, we expect the pace of growth in the global economy at 3.2 % to be slightly slower than the first quarter of 2014. While we estimate growth in industrialized countries to have accelerated from 1.6 % in the fourth quarter of 2014 to 2.0 % in the first quarter of 2015, year-on-year growth in emerging mar-kets in the first quarter of 2015 is estimated to have slowed from 4.9 % to 4.2 %.
On an annualized basis, we estimate the eurozone economy to have grown by 2.0 % in the first quarter of 2015, after expanding by 1.3 % in the fourth quarter of 2014. Low oil prices and the weak euro have had a favorable impact. The German economy is expected to have grown by 3.1 % in the first quarter of 2015, buoyed in part by the mild winter weather. In the previous quarter, growth amounted to 2.8 %.
Following annualized growth of 2.2 % compared to the fourth quarter of 2014, economic growth in the U.S. is expected to have fallen to 1.7 % in the first quarter of 2015 for weather related reasons. Japanese economic growth is projected to have accelerated somewhat to 2.9 % on the previous quarter, after coming in at 1.5 % in the fourth quarter of 2014.
The year-on-year rate of economic growth in China likely fell from 7.2 % in the fourth quarter of 2014 to 6.8 % in the first quarter of 2015. This decline is mainly attributable to a correction in the real-estate sector. Following a decline of 0.4 % on the prior year in the last quarter of 2014, the Russian economy is expected to have con-tracted by 6.6 % in the first quarter of 2015.
The global banking sector got off to a relatively successful start in 2015 despite numerous geopolitical crises. In the eurozone, there was a slight upturn in lending to companies in the first quarter of 2015 so that the year-on-year comparison continued to stabilize. The upward trend in household lending, which had begun in late summer 2014, continued in the first quarter of 2015. Growth in private sector deposits remained robust despite very low interest rates. In fact, growth rates for deposits from companies, up by more than 7 % on the year, were at their highest since the start of 2008. As a result, private sector deposits in the eurozone have now increased by almost 40 % since the start of the financial crisis in summer 2007. Growth in total assets of euro-zone banks continued to pick up speed in the first quarter of 2015.
In Germany, lending to households was a mixed picture, further solid growth in mortgage lending was accom-panied by a continued contraction in consumer lending volumes. Apparently, German consumers were able to fund their growing propensity to consume with rising incomes; at least there seems to be no demand for greater consumer credit financing at present. Lending to companies grew surprisingly strongly at the start of the year, indicating catch-up effects after the very weak second half of 2014 and an increasing willingness of firms to invest.
In the U.S., the rapid expansion, at double-digit growth rates, in corporate lending accelerated even further in the first quarter of 2015. The retail business also picked up somewhat, largely thanks to a sudden increase in mortgage lending. On the other hand, home equity loans were sluggish and there was a seasonal stagnation in consumer loans. The sharp slowdown in deposits in the fourth quarter of 2014 was entirely offset by very strong growth at the start of the year with an annualized growth rate of more than 8 %.

Deutsche Bank Management Report 3 Interim Report as of March 31, 2015 Operating and Financial Review Deutsche Bank Performance
In global investment banking, the largely positive sentiment of recent months continued. Bank revenues in debt capital markets rose, mainly thanks to a favorable trend in the high-yield segment, although total issuance volumes were on balance slightly down compared to the same period of 2014. On the whole, activity levels improved in the U.S. and Europe, while they declined in the emerging markets. For equity issuance volumes, it was the best first quarter since the start of data collection in 1980, not least thanks to a record number of sec-ondary placements. IPOs, however, were slightly down compared to the first quarter of 2014. Overall, all three major regions (North America, Europe and Asia) experienced double-digit growth. While revenues from equity underwritings were unchanged from the prior-year period, there was a further increase in M&A transactions in the best first quarter since 2007, particularly in Asia and the U.S. Bank revenues in the M&A advisory business rose slightly. Trading in equities and debt securities also increased slightly in comparison to the first quarter of 2014.
Asset management operations benefited from a highly favorable environment, in particular on European capital markets, with substantial gains in both equity and bond markets. This is largely attributable to direct market intervention by the ECB, which began large-scale purchases of government bonds. In the U.S., the Dow Jones Industrial Average hit another all-time high in March although the first quarter of 2015 as a whole was shaped by a sideways trend close to the record level. Yields on U.S. government bonds continued to decline despite growing signs of a turnaround in monetary policy. The increased volatility, especially on foreign-exchange mar-kets with the continued depreciation of the euro, likely has not harmed banks' earnings.
On balance, we expect the profitability of both U.S. and European banks may have increased in the first quar-ter of 2015 thanks to operational progress, the improved macroeconomic environment and fewer litigation charges.
Among other regulatory and supervisory developments, the Basel 3 liquidity coverage ratio (LCR) was intro-duced at the start of the year 2015. At the same time, in the context of the European Banking Union the imple-mentation phase for the rules on the recovery and resolution of failed banks began, including the specification of a precise methodology for calculating banks' contributions to the Single Resolution Fund. Finally, the con-cept of a Capital Markets Union became more concrete as the European Commission issued a Green Paper. Discussions about the so-called banking structural reform continued.
Deutsche Bank Performance
Overall results in the first quarter 2015 were strong, excluding € 1.5 billion litigation costs recorded. Results benefited from an improved market environment, increased market volatility and favorable movements in for-eign exchange rates. Offsetting these were the aforementioned legal and regulatory matters, as well as im-pacts from the low interest rate environment, higher bank levy and increased regulatory expenditures. We strengthened our capital base and have continued to implement our cultural and cost initiatives.
The key financial results for the Group in the first quarter 2015 are summarized as follows:
— Group net revenues were € 10.4 billion in the first quarter 2015, increased by 24 % as compared to the first quarter 2014;
— Income before income taxes was € 1.5 billion, decreased by 12 % as compared to the first quarter 2014; — Net income was € 559 million, decreased by 49 % as compared to the first quarter 2014; — Post-tax return on average tangible shareholders’ equity was 3.9 % at the end of first quarter 2015; — Capital Requirements Regulation/Capital Requirements Directive 4 (CRR/CRD 4) fully loaded Common
Equity Tier 1 capital ratio was 11.1 % at the end of the first quarter 2015; — Fully loaded CRR/CRD 4 leverage ratio was 3.4 % at the end of the first quarter 2015; and — CRR/CRD 4 fully loaded risk-weighted assets were € 431 billion as of March 31, 2015.

Deutsche Bank Management Report 4 Interim Report as of March 31, 2015 Operating and Financial Review Consolidated Results of Operations
The financial Key Performance Indicators (KPIs) of the Group for the first quarter are detailed in the table below:
Group Key Performance Indicators Mar 31, 2015 Mar 31, 2014
Post-tax return on average active equity (reported)
1 3.1 % 8.0 % Post-tax return on average active equity (adjusted)
2 13.2 % 10.2 % Cost/income ratio (reported)
3 83.6 % 77.0 % Cost/income ratio (adjusted)
4 64.6 % 71.4 % Cost savings
5 € 3.6 bn € 2.3 bn Costs to achieve savings
6 € 3.1 bn € 2.1 bn CRR/CRD 4 fully loaded Common Equity Tier 1 ratio
7 11.1 % 9.5 % Fully loaded CRR/CRD 4 leverage ratio
8 3.4 % 2.5 % 1 Based on Net Income attributable to Deutsche Bank shareholders. 2 Based on Net Income attributable to Deutsche Bank shareholders, adjusted for litigation, CtA, impairment of goodwill and intangible assets, other severances and
CRR/CRD 4 Credit Valuation Adjustment (CVA)/Debt Valuation Adjustment (DVA)/Funding Valuation Adjustment (FVA). Calculation is based on an adjusted tax rate of 35 % for three months ended March 31, 2015 and 34 % for three months ended March 31, 2014. For further information, please refer to “Other Information: Non-GAAP Financial Measures” of this report.
3 Total noninterest expenses as a percentage of total net interest income before provision for credit losses plus noninterest income. 4 Based on noninterest expenses, adjusted for litigation, CtA, impairment of goodwill and intangible assets, policyholder benefits and claims, other severances and
other divisional specific cost one-offs; divided by reported revenues. For further information, please refer to “Other Information: Non-GAAP Financial Measures” of this report.
5 Cost savings resulting from the implementation of the OpEx program. 6 Costs-to-achieve (CtA) savings are costs which are directly required for the realization of savings in the OpEx program. 7 The CRR/CRD 4 fully loaded Common Equity Tier 1 ratio represents our calculation of our Common Equity Tier 1 ratio without taking into account the transitional
provisions of CRR/CRD 4. Further detail on the calculation of this ratio is provided in the Risk Report. 8 Further detail on the calculation of this ratio is provided in the Risk Report.
Consolidated Results of Operations
Three months ended
in € m. (unless stated otherwise)
Mar 31, 2015
Mar 31, 2014
Absolute Change
Change in %
Net revenues: Thereof: CB&S 4,654 4,042 612 15 PBC 2,471 2,452 20 1 GTB 1,133 1,018 114 11 Deutsche AWM 1,379 1,065 314 29 NCOU 336 63 273 N/M
Total net revenues 10,376 8,392 1,983 24
Provision for credit losses 218 246 (28) (12)
Noninterest expenses 8,678 6,466 2,212 34
Income before income taxes 1,479 1,680 (201) (12)
Income tax expense (benefit) 920 577 344 60
Net income (loss) 559 1,103 (544) (49)
N/M – Not meaningful
In the first quarter 2015 higher net revenues compared to the first quarter 2014 were reported across all our business divisions, driven by an improved market environment, increased market volatility and favorable movements in foreign exchange rates, supported by the on-going progress reflecting our de-risking activities in the NCOU. The Operational Excellence (OpEx) program continued to focus on more complex initiatives and achieved further cost reductions in the first quarter 2015, however, these savings were more than offset by higher costs from litigation-related charges, higher bank levy, increased regulatory requirements and continued investments in integrating platforms and process enhancements.

Deutsche Bank Management Report 5 Interim Report as of March 31, 2015 Operating and Financial Review Consolidated Results of Operations
Group net revenues in the first quarter 2015 increased by € 2.0 billion, or 24 %, to € 10.4 billion compared to € 8.4 billion in the first quarter 2014 supported by favorable movements in foreign exchange rates. CB&S reve-nues were € 4.7 billion, an increase of € 612 million, or 15 %, compared to the first quarter 2014. This was attributable to Sales & Trading (equity), where revenues increased by € 242 million, or 31 %, resulting from increased client balances and favorable market conditions and Sales & Trading (debt and other products), where revenues increased by € 208 million, or 9 %, resulting from higher market volatility and increased client activity. PBC revenues were € 2.5 billion in the first quarter 2015, a slight increase to the first quarter 2014 of € 20 million, or 1 %, compared to the first quarter 2014 mainly driven by strong operational revenues in Global credit and Investment & insurance products. In GTB, revenues of € 1.1 billion in the first quarter 2015 improved by € 114 million, or 11 %, compared to the first quarter 2014 with strong volumes and increased business activ-ity compensating for the impacts from the challenging market environment. Deutsche AWM revenues of € 1.4 billion increased by € 314 million, or 29 %, compared to the first quarter 2014, driven by increased market levels and favorable foreign exchange developments. NCOU revenues were € 336 million, an increase of € 273 million in the first quarter 2015, reflecting ongoing de-risking and a specific litigation charge recovery in the first quarter 2015. Revenues in Consolidation & Adjustments (C&A) were € 402 million in the first quarter 2015, compared to negative € 247 million in the first quarter 2014, with the development predominantly driven by valuation and timing differences from different accounting methods used for management reporting and IFRS, as well as FVA on internal uncollateralized derivatives between Treasury and CB&S.
Provision for credit losses were € 218 million in the first quarter 2015, a decrease of € 28 million, or 12 %, compared to the same period 2014. This mainly resulted from lower provisions for IAS 39 reclassified assets in NCOU partly offset by an increase in CB&S due to higher provisions in our shipping portfolio.
Noninterest expenses were € 8.7 billion in the first quarter an increase of € 2.2 billion, or 34 %, compared to the first quarter 2014 mainly due to litigation-related charges and the aforementioned effects from foreign ex-change rate movements. Compensation and benefits amounted to € 3.4 billion, an increase of € 84 million, or 3 %, compared to the first quarter 2014. This primarily reflects higher fixed compensation costs to comply with regulatory requirements, mainly in CB&S, as well as strategic hires for our new control functions. These in-creases were partly offset by lower variable compensation compared to the first quarter 2014. General and administrative expenses of € 5.1 billion increased by € 2.1 billion, or 68 %, compared to the first quarter 2014. Main drivers for this increase were the aforementioned litigation-related charges and costs for bank levy. Litiga-tion-related charges were € 1.5 billion in the first quarter 2015. Bank levy costs increased by € 527 million quarter-on-quarter due to increases in size and a different timing of recognition within the year, both triggered by a change in bank levy regime. Noninterest expenses were further affected by higher regulatory induced expenses. Offsetting effects include benefits from the ongoing implementation of our OpEx program and from the sales of The Cosmopolitan of Las Vegas and BHF-BANK in 2014. Policyholder benefits and claims, which are offset by mark-to-market movements on investments held to back insurance policyholder claims in Abbey Life, were € 153 million in the first quarter 2015, an increase of € 102 million compared to the first quarter 2014.
Group income before income taxes was € 1.5 billion in the first quarter 2015 versus € 1.7 billion in the first quarter 2014. This decrease was predominantly driven by increases in noninterest expenses, mainly from litigation provisions, partly offset by a favorable revenue development and lower provision for credit losses.
Net income for the first quarter 2015 was € 559 million, compared to € 1.1 billion in the first quarter 2014. In-come tax expense in the first quarter 2015 was € 920 million versus € 577 million in the comparative period. The effective tax rate in the current quarter of 62 % was mainly impacted by non tax deductible litigation-related charges. The effective tax rate in the first quarter 2014 was 34 %.
Deutsche Bank Management Report 6 Interim Report as of March 31, 2015 Operating and Financial Review Segment Results of Operations
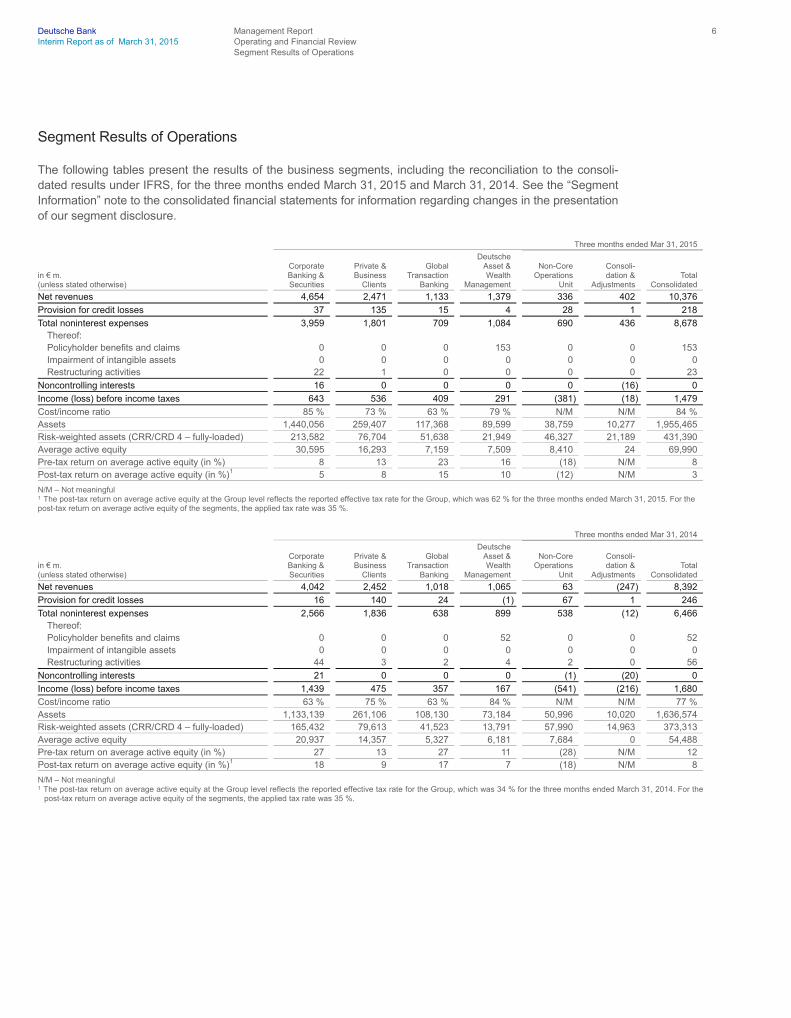
Segment Results of Operations
The following tables present the results of the business segments, including the reconciliation to the consoli-dated results under IFRS, for the three months ended March 31, 2015 and March 31, 2014. See the “Segment Information” note to the consolidated financial statements for information regarding changes in the presentation of our segment disclosure.
Three months ended Mar 31, 2015
in € m. (unless stated otherwise)
Corporate Banking & Securities
Private & Business Clients
Global Transaction Banking
Deutsche Asset & Wealth Management
Non-Core Operations Unit
Consoli- dation & Adjustments
Total Consolidated
Net revenues 4,654 2,471 1,133 1,379 336 402 10,376
Provision for credit losses 37 135 15 4 28 1 218
Total noninterest expenses 3,959 1,801 709 1,084 690 436 8,678 Thereof: Policyholder benefits and claims 0 0 0 153 0 0 153 Impairment of intangible assets 0 0 0 0 0 0 0 Restructuring activities 22 1 0 0 0 0 23
Noncontrolling interests 16 0 0 0 0 (16) 0
Income (loss) before income taxes 643 536 409 291 (381) (18) 1,479
Cost/income ratio 85 % 73 % 63 % 79 % N/M N/M 84 % Assets 1,440,056 259,407 117,368 89,599 38,759 10,277 1,955,465 Risk-weighted assets (CRR/CRD 4 – fully-loaded) 213,582 76,704 51,638 21,949 46,327 21,189 431,390 Average active equity 30,595 16,293 7,159 7,509 8,410 24 69,990 Pre-tax return on average active equity (in %) 8 13 23 16 (18) N/M 8 Post-tax return on average active equity (in %)
1 5 8 15 10 (12) N/M 3 N/M – Not meaningful 1 The post-tax return on average active equity at the Group level reflects the reported effective tax rate for the Group, which was 62 % for the three months ended March 31, 2015. For the post-tax return on average active equity of the segments, the applied tax rate was 35 %.
Three months ended Mar 31, 2014
in € m. (unless stated otherwise)
Corporate Banking & Securities
Private & Business Clients
Global Transaction Banking
Deutsche Asset & Wealth Management
Non-Core Operations Unit
Consoli- dation & Adjustments
Total Consolidated
Net revenues 4,042 2,452 1,018 1,065 63 (247) 8,392
Provision for credit losses 16 140 24 (1) 67 1 246
Total noninterest expenses 2,566 1,836 638 899 538 (12) 6,466 Thereof: Policyholder benefits and claims 0 0 0 52 0 0 52 Impairment of intangible assets 0 0 0 0 0 0 0 Restructuring activities 44 3 2 4 2 0 56
Noncontrolling interests 21 0 0 0 (1) (20) 0
Income (loss) before income taxes 1,439 475 357 167 (541) (216) 1,680
Cost/income ratio 63 % 75 % 63 % 84 % N/M N/M 77 % Assets 1,133,139 261,106 108,130 73,184 50,996 10,020 1,636,574 Risk-weighted assets (CRR/CRD 4 – fully-loaded) 165,432 79,613 41,523 13,791 57,990 14,963 373,313 Average active equity 20,937 14,357 5,327 6,181 7,684 0 54,488 Pre-tax return on average active equity (in %) 27 13 27 11 (28) N/M 12 Post-tax return on average active equity (in %)
1 18 9 17 7 (18) N/M 8 N/M – Not meaningful 1 The post-tax return on average active equity at the Group level reflects the reported effective tax rate for the Group, which was 34 % for the three months ended March 31, 2014. For the
post-tax return on average active equity of the segments, the applied tax rate was 35 %.

Deutsche Bank Management Report 7 Interim Report as of March 31, 2015 Operating and Financial Review Corporate Divisions
Corporate Divisions
Corporate Banking & Securities Corporate Division (CB&S) Three months ended
in € m. (unless stated otherwise) Mar 31, 2015
Mar 31, 2014
Absolute Change
Change in %
Net revenues: Sales & Trading (debt and other products) 2,643 2,435 208 9 Sales & Trading (equity) 1,012 770 242 31 Origination (debt) 433 358 75 21 Origination (equity) 206 160 46 29 Advisory 145 107 39 36 Loan products 277 255 22 9 Other products (61) (42) (19) 45 Total net revenues 4,654 4,042 612 15
Provision for credit losses 37 16 21 137
Total noninterest expenses 3,959 2,566 1,393 54 Thereof: Restructuring activities 22 44 (22) (50) Impairment of intangible assets 0 0 0 N/M
Noncontrolling interests 16 21 (6) (27)
Income before income taxes 643 1,439 (796) (55)
Post-tax return on average active equity (adjusted)
1,2 18 % 19 % N/M – Not meaningful 1 Based on Net Income (loss) after income taxes attributable to Deutsche Bank shareholders, as adjusted for litigation, CtA, impairment of goodwill and intangible
assets, other severances and CVA / DVA / FVA. For further information, please refer to “Other Information: Non-GAAP Financial Measures” of this report. 2 Calculation is based on an adjusted tax rate of 34 % for first quarter ending Mar 31, 2015 and same for the first quarter ending Mar 31, 2014.
CB&S reported strong revenues in the first quarter 2015 driven by an improved market environment, increased market volatility and favorable movements in foreign exchange rates.
Sales & Trading (debt and other products) net revenues were € 2.6 billion in the first quarter 2015, an increase of € 208 million, or 9 %, compared to the first quarter 2014. Revenues in Foreign Exchange were significantly higher than the prior year quarter driven by increased client activity and higher market volatility. Revenues in Rates were higher than the prior year quarter driven by increased client activity notably in Europe. Flow Credit revenues were significantly higher and Emerging Markets revenues were higher than the prior year quarter, driven by an improved market environment. Revenues in Distressed Products were significantly lower com-pared to a strong first quarter 2014. RMBS revenues were significantly lower driven by challenging market conditions. Revenues in Credit Solutions and Global Liquidity Management were in line with the prior year quarter. Sales & Trading (debt and other products) net revenues included two valuation adjustment items total-ling a loss of € 208 million. First, a mark-to-market loss of € 16 million (first quarter 2014: a gain of € 28 million) relating to RWA mitigation efforts arising on Credit Valuation Adjustment (CVA). Second, a Funding Valuation Adjustment (FVA) loss of € 193 million (first quarter 2014: a gain of € 14 million) including a negative impact of € 84 million due to a calculation refinement.
Deutsche Bank Management Report 8 Interim Report as of March 31, 2015 Operating and Financial Review Corporate Divisions
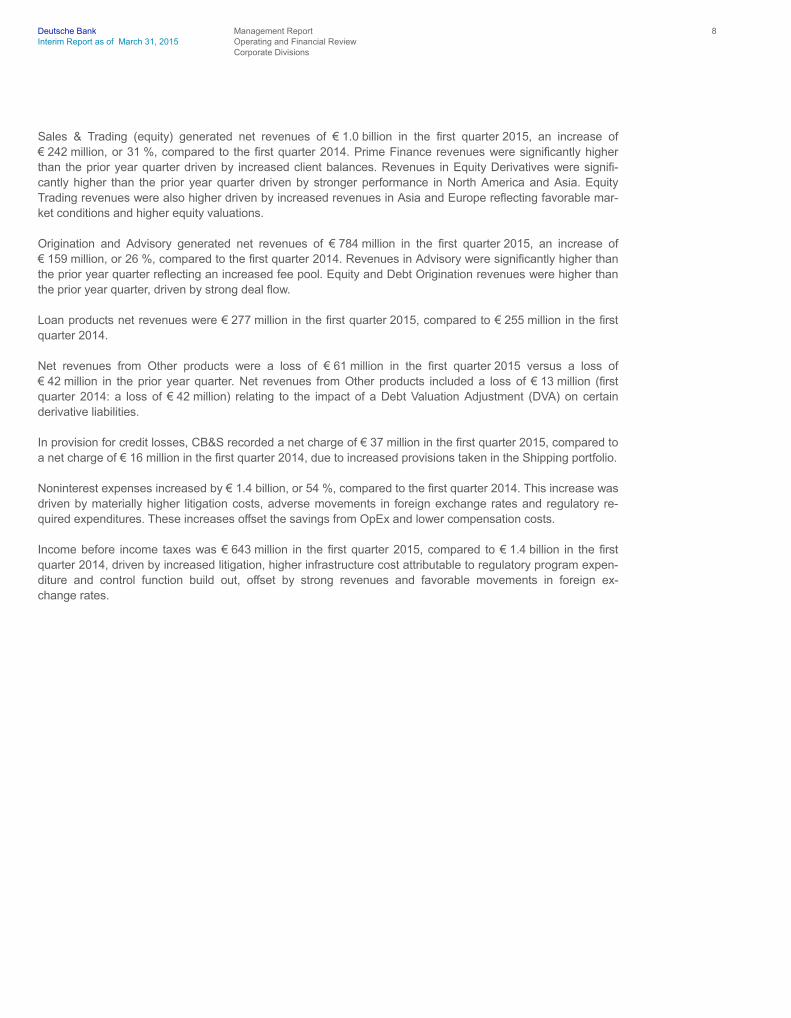
Sales & Trading (equity) generated net revenues of € 1.0 billion in the first quarter 2015, an increase of € 242 million, or 31 %, compared to the first quarter 2014. Prime Finance revenues were significantly higher than the prior year quarter driven by increased client balances. Revenues in Equity Derivatives were signifi-cantly higher than the prior year quarter driven by stronger performance in North America and Asia. Equity Trading revenues were also higher driven by increased revenues in Asia and Europe reflecting favorable mar-ket conditions and higher equity valuations.
Origination and Advisory generated net revenues of € 784 million in the first quarter 2015, an increase of € 159 million, or 26 %, compared to the first quarter 2014. Revenues in Advisory were significantly higher than the prior year quarter reflecting an increased fee pool. Equity and Debt Origination revenues were higher than the prior year quarter, driven by strong deal flow.
Loan products net revenues were € 277 million in the first quarter 2015, compared to € 255 million in the first quarter 2014.
Net revenues from Other products were a loss of € 61 million in the first quarter 2015 versus a loss of € 42 million in the prior year quarter. Net revenues from Other products included a loss of € 13 million (first quarter 2014: a loss of € 42 million) relating to the impact of a Debt Valuation Adjustment (DVA) on certain derivative liabilities.
In provision for credit losses, CB&S recorded a net charge of € 37 million in the first quarter 2015, compared to a net charge of € 16 million in the first quarter 2014, due to increased provisions taken in the Shipping portfolio.
Noninterest expenses increased by € 1.4 billion, or 54 %, compared to the first quarter 2014. This increase was driven by materially higher litigation costs, adverse movements in foreign exchange rates and regulatory re-quired expenditures. These increases offset the savings from OpEx and lower compensation costs.
Income before income taxes was € 643 million in the first quarter 2015, compared to € 1.4 billion in the first quarter 2014, driven by increased litigation, higher infrastructure cost attributable to regulatory program expen-diture and control function build out, offset by strong revenues and favorable movements in foreign ex- change rates.

Deutsche Bank Management Report 9 Interim Report as of March 31, 2015 Operating and Financial Review Corporate Divisions
Private & Business Clients Corporate Division (PBC) Three months ended
in € m. (unless stated otherwise) Mar 31, 2015 Mar 31, 2014
Absolute Change
Change in %
Net revenues: Global credit products 930 846 83 10 Deposits 694 757 (63) (8) Payments, cards & account products 235 247 (12) (5) Investment & insurance products 406 348 57 16 Postal and supplementary Postbank Services 61 105 (43) (41) Other products 145 148 (3) (2) Total net revenues 2,471 2,452 20 1
Provision for credit losses 135 140 (6) (4)
Total noninterest expenses 1,801 1,836 (36) (2) Thereof: Impairment of intangible assets 0 0 0 N/M
Noncontrolling interests 0 0 0 N/M
Income before income taxes 536 475 61 13
Breakdown of PBC by business
1
Private & Commercial Banking: Net revenues 951 1,023 (73) (7) Provision for credit losses 14 20 (6) (31) Noninterest expenses 816 804 11 1
Income before income taxes 121 199 (78) (39)
Advisory Banking International: Net revenues 586 523 63 12 Provision for credit losses 60 66 (6) (9) Noninterest expenses 317 350 (32) (9)
Income before income taxes 208 107 101 95
Postbank:
2 Net revenues 935 906 29 3 Provision for credit losses 60 54 7 13 Noninterest expenses 668 683 (15) (2) Noncontrolling interests 0 0 0 N/M
Income before income taxes 207 169 37 22
N/M – Not meaningful 1 Effective January 1 2015, PBC has refined its internal cost allocation among the business units Private & Commercial Banking and Advisory Banking International.
Prior periods have been restated accordingly. 2 Contains the major core business activities of Postbank AG as well as BHW and norisbank.
Despite the prevailing low interest rate environment PBC recorded a very strong result in the first quarter of 2015 with an income before income taxes of € 536 million. This is an increase of € 61 million, or 13 %, com-pared to the prior year quarter which had included a non-recurring gain related to a business sale closed in a prior period. PBC’s strong performance was driven by operational revenues in Global credit and Investment & insurance products which more than offset shortfalls in revenues from Deposits, Payments, cards & accounts and Postal and supplementary Postbank Services as well as declining noninterest expenses.
Net revenues in PBC increased by € 20 million compared to the prior year quarter. Higher Global credit product revenues of € 83 million, or 10 %, compared to the first quarter 2014 reflected higher loan volumes and im-proved loan margins, especially in Mortgages and Home Loan & Savings. This was accompanied by specific effects from successful contract alignments with business partners in Postbank and impacts related to updates of internal funding models in Private & Commercial Banking. Revenues from Investment & insurance products achieved a quarterly record high since the financial crisis in a positive overall market environment with an in-crease of € 57 million, or 16 %, reflecting continuing strong securities brokerage business with higher levels of transactions compared to the prior year period. The decline in net revenues from Deposits of € 63 million, or 8 %, compared to the prior year quarter was mainly caused by the continued low interest rate environment in Europe. Net revenues from Postal and supplementary Postbank Services decreased by € 43 million, or 41 %, compared to the first quarter 2014 due to a new contract with Deutsche Post DHL, partly compensated by

Deutsche Bank Management Report 10 Interim Report as of March 31, 2015 Operating and Financial Review Corporate Divisions
lower costs related to the same contractual changes. The decrease in net revenues from Payments, cards & account products of € 12 million, or 5 %, compared to the first quarter 2014, was mainly driven by tightening in regulation with regard to payment and card fees. Other product revenues decreased by € 3 million, or 2 %, compared to the prior year quarter. The first quarter of 2014 has been impacted by the positive effect of a sub-sequent gain in Private & Commercial Banking related to a business sale closed in a prior period, while the current quarter benefitted from higher revenues related to Postbank nonoperating activities as well as a better performance of the Hua Xia Bank equity investment.
Provision for credit losses remained at the low level of the first quarter 2014, continuing to benefit from the quality of PBC’s loan book and a benign economic environment in Germany.
Noninterest expenses decreased by € 36 million, or 2 %, to € 1.8 billion, compared to the first quarter 2014. Cost-to-achieve for our OpEx and Postbank integration programs decreased by € 23 million, in line with the expected progress of these programs. Additionally, PBC continued to realize incremental savings from effi-ciency measures implemented under the OpEx program. These effects were partly offset by higher infrastruc-ture expenses, mainly caused by regulatory requirements and establishment of new control functions.
Income before income taxes increased by € 61 million, or 13 %, compared to the first quarter of 2014, benefit-ting from a positive operational business development.
Invested assets increased by € 11 billion compared to December 31, 2014, mainly due to market appreciation and slight inflows in securities.
Global Transaction Banking Corporate Division (GTB) Three months ended
in € m. (unless stated otherwise) Mar 31, 2015 Mar 31, 2014
Absolute Change
Change in %
Net revenues: Transaction services 1,133 1,018 114 11 Total net revenues 1,133 1,018 114 11
Provision for credit losses 15 24 (9) (39)
Total noninterest expenses 709 638 71 11 Thereof: Restructuring activities 0 2 (2) N/M Impairment of intangible assets 0 0 0 N/M
Noncontrolling interests 0 0 0 N/M
Income before income taxes 409 357 53 15
N/M – Not meaningful
In the first quarter 2015, GTB reported the highest net revenues since the division was established in 2001, amounting to € 1.1 billion. This was achieved despite a continued challenging market environment with persis-tent low interest rates and heightened geopolitical risks. Additionally, the business environment remained highly competitive, while the weakening of the Euro positively impacted the contribution from activities denominated in foreign currencies.
In this environment, GTB’s net revenues increased by € 114 million, or 11 %, compared to the first quar-ter 2014, which included a gain on sale of registrar services GmbH. Revenues in Trade Finance benefited from growing volumes, which more than offset for the impact from low interest environment and continued pressure on margins. In Securities Services, revenues increased due to strong volume growth mainly in the Asia Pacific region. In Cash Management, business activity also increased.
Provision for credit losses of € 15 million in the first quarter 2015 decreased by € 9 million compared to the first quarter 2014, driven by lower provisions in Trade Finance and in commercial banking activities in the Netherlands.

Deutsche Bank Management Report 11 Interim Report as of March 31, 2015 Operating and Financial Review Corporate Divisions
Noninterest expenses increased by € 71 million, or 11 %, compared to the prior year quarter. The increase was primarily driven by higher expenses to comply with regulatory requirements as well as increased revenue-related expenses. The first quarter 2015 included cost-to-achieve related to the OpEx program of € 12 million versus € 19 million in the first quarter 2014.
Income before income taxes increased by € 53 million, or 15 %, compared to the first quarter 2014 due to record revenues as well as lower provision for credit losses.
Deutsche Asset & Wealth Management Corporate Division (Deutsche AWM) Three months ended
in € m. (unless stated otherwise) Mar 31, 2015 Mar 31, 2014
Absolute Change
Change in %
Net revenues: Management Fees and other recurring revenues 822 613 209 34 Performance and transaction fees and other non recurring revenues 185 183 2 1 Net interest income 192 148 43 29 Other product revenues 4 71 (67) (95) Mark-to-market movements on policyholder positions in Abbey Life 176 49 127 N/M Total net revenues 1,379 1,065 314 29
Provision for credit losses 4 (1) 5 N/M
Total noninterest expenses 1,084 899 185 21 Thereof: Policyholder benefits and claims 153 52 102 197 Restructuring activities 0 4 (5) N/M Impairment of intangible assets 0 0 0 N/M
Noncontrolling interests 0 0 0 (53)
Income before income taxes 291 167 125 75
N/M – Not meaningful
In the first quarter of 2015, Deutsche AWM continued to benefit from higher market levels, increased net new money and greater assets under management. However, performance continues to be impacted by increased regulatory costs and an ongoing low interest rate environment, which challenges retirement product revenue and deposit revenue margins.
In Deutsche AWM, net revenues were € 1.4 billion in the first quarter 2015, an increase of € 314 million, or 29 %, compared to the first quarter 2014.
Management Fees and other recurring revenues increased by € 209 million, or 34 %, due to an increase in the average assets under management for the quarter following positive flow, increased market levels and foreign currency effects. Net interest income increased by € 43 million, or 29 %, due to increased lending volume and positive foreign exchange development. Other product revenues decreased compared to the first quarter 2014 by € 67 million, or 95 %, mainly due to unfavorable impacts to retirement products from the low interest envi-ronment and a write-down in active products in regards to HETA exposure of € 110 million, partially offset by alternative products. Mark-to-market movements on policyholder positions in Abbey Life increased by € 127 million versus first quarter 2014 following increased market gains.
Provision for credit losses remained at very low levels.
Noninterest expenses of € 1.1 billion in the first quarter 2015 increased by € 185 million, or 21 %, compared to the first quarter 2014 driven by higher policyholder benefits and claims, foreign exchange impact, higher reve-nue-driven costs, increased compensation costs mainly in respect of higher regulatory requirements and stra-tegic hirings, partly offset by lower costs-to-achieve related to OpEx and lower litigation costs.
Income before income taxes was € 291 million in the first quarter 2015, an increase of € 125 million, or 75 %, compared to the first quarter 2014.

Deutsche Bank Management Report 12 Interim Report as of March 31, 2015 Operating and Financial Review Corporate Divisions
In the first quarter 2015, invested assets were € 1.2 trillion, an increase of € 120 billion, mainly driven by for-eign exchange movements of € 63 billion, market appreciation of € 46 billion and inflows of € 17 billion.
Non-Core Operations Unit Corporate Division (NCOU) Three months ended
in € m. (unless stated otherwise) Mar 31, 2015 Mar 31, 2014
Absolute Change
Change in %
Net revenues 336 63 273 N/M
Provision for credit losses 28 67 (39) (59)
Total noninterest expenses 690 538 152 28 Thereof: Restructuring activities 0 2 (2) (95) Impairment of intangible assets 0 0 0 N/M
Noncontrolling interests 0 (1) 1 N/M
Income (loss) before income taxes (381) (541) 160 (30)
N/M – Not meaningful
The results for NCOU in the first quarter reflect the good progress from de-risking activity, as well as fair value movements, impairments and developments in regard to litigation-related matters.
Net revenues for the NCOU in the reporting period increased by € 273 million, to € 336 million driven by a specific litigation recovery of € 219 million. Lower portfolio revenues following the sale of BHF-BANK and The Cosmopolitan of Las Vegas in 2014 have been offset by the net effect arising from valuation adjustments and mark-to-market impacts. NCOU’s de-risking activity generated revenue gains of € 98 million compared to net gains of € 67 million in the same period in 2014.
Provision for credit losses in the first quarter 2015 was € 39 million lower compared to the same quarter in 2014 due to lower provisions taken against IAS 39 reclassified assets.
Noninterest expenses increased by € 152 million, or 28 %, compared to the first quarter 2014. The increase was predominantly due to higher litigation-related expenses, offset by the sale of BHF-BANK and The Cosmo-politan of Las Vegas in 2014, and the non-recurrence of an one-time impairment in the prior year.
The loss before income taxes decreased by € 160 million, compared to the same quarter in 2014, primarily driven by the aforementioned movements and impacts.
Consolidation & Adjustments (C&A) Three months ended
in € m. (unless stated otherwise) Mar 31, 2015 Mar 31, 2014
Absolute Change
Change in %
Net revenues 402 (247) 650 N/M Provision for credit losses 1 1 0 N/M Noninterest expenses 436 (12) 447 N/M Noncontrolling interests (16) (20) 5 (24)
Income (loss) before income taxes (18) (216) 197 (91)
N/M – Not meaningful
Loss before income taxes in C&A was € 18 million in the first quarter 2015, compared to a loss of € 216 million in the prior year quarter. This development was predominantly attributable to valuation and timing differences from different accounting methods used for management reporting and IFRS, which showed a positive impact of € 324 million compared to negative € 134 million in the prior year quarter. In addition, FVA on internal uncol-lateralized derivatives between CB&S and Treasury contributed a positive € 1 million in the first quarter 2015, in contrast with a negative effect of € 95 million in the first quarter 2014. These positive developments were partially offset by a negative impact of € 426 million in bank levy compared to a positive € 1 million in the prior year quarter, driven by increases in size and a different timing of recognition within the year, both triggered by a change in bank levy regime. These costs will be allocated to the corporate divisions over the course of the year.

Deutsche Bank Management Report 13 Interim Report as of March 31, 2015 Operating and Financial Review Financial Position
Financial Position
in € m. (unless stated otherwise) Mar 31, 2015 Dec 31, 2014
Absolute Change
Change in %
Cash and due from banks 21,645 20,055 1,590 8 Interest-earning deposits with banks 70,659 63,518 7,142 11 Central bank funds sold, securities purchased under resale agreements and securities borrowed 57,908 43,630 14,278 33 Trading assets 212,185 195,681 16,504 8 Positive market values from derivative financial instruments 746,084 629,958 116,126 18 Financial assets designated at fair value through profit or loss 125,810 117,285 8,524 7
Thereof: Securities purchased under resale agreements 68,481 60,473 8,008 13 Securities borrowed 17,880 20,404 (2,524) (12)
Loans 428,548 405,612 22,935 6 Brokerage and securities related receivables 165,518 115,054 50,464 44 Remaining assets 127,108 117,910 9,198 8 Total assets 1,955,465 1,708,703 246,762 14
Deposits 572,921 532,931 39,990 8 Central bank funds purchased, securities sold under repurchase agreements and securities loaned 19,894 13,226 6,668 50 Trading liabilities 54,231 41,843 12,388 30 Negative market values from derivative financial instruments 724,120 610,202 113,918 19 Financial liabilities designated at fair value through profit or loss 41,340 37,131 4,209 11
Thereof: Securities sold under repurchase agreements 23,892 21,053 2,839 13 Securities loaned 825 1,189 (364) (31)
Other short-term borrowings 39,260 42,931 (3,671) (9) Long-term debt 157,519 144,837 12,682 9 Brokerage and securities related payables 193,016 143,210 49,805 35 Remaining liabilities 75,232 69,170 6,062 9 Total liabilities 1,877,533 1,635,481 242,053 15
Total equity 77,932 73,223 4,709 6
Movements in Assets The overall growth of € 247 billion (or 14 %) of our balance sheet during the first quarter 2015 was heavily impacted by the depreciation of the euro against all other major currencies, which contributed € 109 billion to the increase over this period, of which 75 % related to the significant strengthening of the US dollar versus the euro. These increases stemming from foreign exchange rate movements are also contained in the movements per balance sheet line item as discussed below.
Positive market values from derivative financial instruments increased by € 116 billion during the period, pri-marily from interest rate and foreign exchange rate movements.
Brokerage and securities related receivables contributed € 50 billion to the overall growth, following the sea-sonality pattern we typically observe of lower year-end levels versus higher volumes over the course of the year, as well as from higher collateral requirements corresponding to the increase in negative market values from derivative financial instruments.
Loans increased by € 23 billion, driven by exposure increases in CB&S, GTB and Deutsche AWM, also primar-ily related to foreign exchange rate movements, accounting for € 17 billion of the increase.
Central bank funds sold, securities purchased under resale agreements and securities borrowed, under both accrual and fair value accounting, increased by € 20 billion, of which € 13 billion were driven by foreign ex-change rate movements.

Deutsche Bank Management Report 14 Interim Report as of March 31, 2015 Operating and Financial Review Financial Position
Trading assets increased by € 17 billion during the first quarter, cash and due from banks together with inter-est-earning deposits with banks increased by € 9 billion. Both increases were largely attributable to foreign exchange rate movements.
Financial assets available for sale (reported as part of Remaining Assets) increased by € 8 billion mainly driven by increases in highly liquid securities held in the Group’s Strategic Liquidity reserve. These increases are the result of the Group’s ongoing optimization of its liquidity reserves.
Movements in Liabilities As of March 31, 2015, total liabilities increased by € 242 billion (or 15 %) compared to year-end 2014.
Similar to total assets, the overall increase in liabilities also reflects the impact of foreign exchange rate move-ments during the quarter.
Compared to December 31, 2014, negative market values from derivative financial instruments, and brokerage and securities related payables increased by € 114 billion and € 50 billion, respectively, primarily due to the same reasons driving the movements in positive market values from derivative financial instruments and bro-kerage and securities related receivables as outlined above.
Deposits were up by € 40 billion, primarily in our funding through transaction banking, largely related to in-creased current account deposits stemming from clearing activities, retail and unsecured wholesale. Foreign exchange rate movements also contributed to this increase.
Long-term debt increased by € 13 billion, primarily driven by foreign exchange rate movements as well as higher funding activities which exceeded the amount of debt that matured during the quarter.
Trading liabilities increased by € 12 billion, with more than two-thirds relating to equity securities and the re-mainder to debt securities.
Central bank funds purchased, securities sold under repurchase agreements and securities loaned, under both accrual and fair value accounting, have increased by € 9 billion in total, driven by increased secured funding of trading inventory and foreign exchange rate movements.
Other short-term borrowings were down by € 4 billion, primarily from reductions in GTB with a corresponding increase in deposits, and to a lesser extent in our NCOU.
Liquidity Liquidity reserves amounted to € 203 billion as of March 31, 2015 (compared to € 184 billion as of Decem- ber 31, 2014). We maintained a positive liquidity stress result as of March 31, 2015 (under the combined scenario).
Equity Total equity as of March 31, 2015 increased by € 4.7 billion. The main factors contributing to this development were positive effects from exchange rate changes of € 3.7 billion (especially in the U.S. dollar). Further contrib-uting to the increase were net income attributable to Deutsche Bank shareholders of € 544 million and unreal-ized net gains on financial assets available for sale of € 412 million, which mainly resulted from improved market prices of debt securities from European issuers.

Deutsche Bank Management Report 15 Interim Report as of March 31, 2015 Operating and Financial Review Financial Position
Regulatory Capital The calculation of the regulatory capital numbers and ratios presented in this report reflects the ECB Decision (EU) (2015/4) from February 4, 2015 on recognition of interim or year-end profits in Common Equity Tier 1 capital.
Starting January 1, 2014, the calculation of our regulatory capital, risk-weighted assets and capital ratios incor-porates the capital requirements following the Capital Requirements Regulation (CRR) and Capital Require-ments Directive 4 (CRD 4), published on June 27, 2013 including certain transitional rules. When referring to the results according to the transitional rules that are currently applicable to us, we use the term “CRR/CRD 4”. When referring to the results according to the full application of the final framework we use the term “fully loaded CRR/CRD 4”.
Our Tier 1 capital according to CRR/CRD 4 as of March 31, 2015 was € 63.0 billion, € 0.9 billion lower than at the end of 2014, resulting in a CRR/CRD 4 Tier 1 capital ratio of 14.6 %, down from 16.1 % at December 31, 2014. Our Common Equity Tier 1 (CET 1) capital according to CRR/CRD 4 decreased in the first three months by € 0.4 billion to € 59.7 billion, resulting in a CRR/CRD 4 CET 1 capital ratio of 13.8 % as of March 31, 2015, compared with 15.2 % at the end of 2014. Our Additional Tier 1 (AT1) capital according to CRR/CRD 4 de-creased by € 0.5 billion to € 3.3 billion.
The increase in our CET 1 capital instruments and reserves in the first three months 2015 was mainly the re-sult of positive effects from foreign currency translation within Accumulated other comprehensive income of € 3.7 billion, but was more than offset by higher regulatory adjustments to CET 1 capital of € 4.1 billion com-pared to the year-end 2014 mainly due to CET 1 capital deductions that are phased in with a rate of 40 % in 2015 (20 % in 2014), primarily intangible assets and deferred tax assets. First quarter 2015 net income attrib-utable to Deutsche Bank shareholders of € 544 million was fully offset by dividend accrual due to the applica-tion of a pay-out ratio assumption of 100 % according to the above mentioned ECB decision.
The decrease in our AT1 capital instruments of € 2.6 billion compared to December 31, 2014 resulted mainly from our redemptions of legacy Hybrid Tier 1 capital instruments. An offsetting effect arose from certain deduc-tions (mainly intangible assets) that were phased out from AT1 capital. These deductions reflect the residual amount of certain CET 1 deductions (i.e. 60 % in 2015 compared to 80 % in 2014) that are subtracted from CET 1 capital under “fully-loaded” rules, but are allowed to reduce AT1 capital during transitional period. This resulted in lower regulatory adjustments to AT 1 capital of € 2.1 billion in the first three months 2015.
Our fully loaded CRR/CRD 4 Tier 1 capital as of March 31, 2015 was € 52.5 billion, € 1.8 billion higher than at the end of 2014, resulting in a fully loaded CRR/CRD 4 Tier 1 capital ratio of 12.2 %, down from 12.9 % as of December 31, 2014. Our fully loaded CRR/CRD 4 CET 1 capital increased in the first three months 2015 by € 1.8 billion to € 47.8 billion, resulting in a fully loaded CRR/CRD 4 CET 1 capital ratio of 11.1 %, compared with 11.7 % at the end of 2014.
The increase in our fully loaded CRR/CRD 4 CET 1 mainly reflects the positive effects from foreign currency translation within Accumulated other comprehensive income of € 3.7 billion that were partly offset by higher regulatory adjustments to CET 1 capital of € 2.1 billion, also mainly driven by foreign exchange movements, compared to year-end 2014. The positive effect in our CET 1 capital and its impact on the ratio however was more than offset by an increase in fully loaded CRR/CRD 4 RWA.
RWA according to CRR/CRD 4 were € 432 billion as of March 31, 2015, compared with € 397 billion at the end of 2014. The overall increase of € 35 billion largely reflects the change in foreign exchange movements by € 18 billion and operational risk risk-weighted assets with € 8 billion being explained by the inclusion of industry losses in our model calculations. Additional contributors are increases in credit and market risk RWA reflecting movements in business volumes.

Deutsche Bank Management Report 16 Interim Report as of March 31, 2015 Operating and Financial Review Financial Position
Risk-weighted assets according to CRR/CRD 4 fully-loaded were € 431 billion as of March 31, 2015 being € 0.7 billion lower compared to the RWA under the transitional rule reflecting lower RWA from our deferred tax assets that rely on future profitability and arises from temporary differences and holdings by the institution of the CET 1 instruments of financial sector entities where the institution has a significant investment in those entities, which are subject to threshold exemptions as outlined in Article 48 CRR.
Amendments to IAS 39 and IFRS 7, “Reclassification of Financial Assets” As of March 31, 2015 and December 31, 2014 the carrying value of reclassified assets was € 7.3 billion and € 7.4 billion, respectively, compared with a fair value of € 7.4 billion and € 7.4 billion as of March 31, 2015 and December 31, 2014, respectively. These assets are held in the NCOU.
Please refer to the note “Amendments to IAS 39 and IFRS 7, ‘Reclassification of Financial Assets’” for addi-tional information on these assets and on the impact of their reclassification.
Exposure to Monoline Insurers The following is an update on the development of protection purchased from monoline insurers.
Monoline exposure related to U.S. residential mortgages
Mar 31, 2015
Dec 31, 2014
in € m. Notional amount
Value prior to CVA
1 CVA
1 Fair value after CVA
1 Notional amount
Value prior to CVA
1 CVA
1 Fair value after CVA
1
AA Monolines:
2 Other subprime 103 27 (5) 22 95 30 (7) 23 Alt-A 1,544 466 (66) 400 1,405 423 (61) 361
Total AA Monolines
3 1,647 493 (71) 422 1,500 452 (68) 384 1 For monolines with actively traded CDS, the Credit Valuation Adjustment (CVA) is calculated using a full CDS-based valuation model. For monolines without actively traded CDS, a model-
based approach is used with various input factors, including relevant market driven default probabilities, the likelihood of an event (either a restructuring or an insolvency), an assessment of any potential settlement in the event of a restructuring, and recovery rates in the event of either restructuring or insolvency. The monolines CVA methodology is reviewed on a quarterly basis by management.
2 Ratings are the lowest of Standard & Poor’s, Moody’s or our own internal credit ratings. 3 A portion of the mark-to-market monoline exposure has been mitigated with CDS protection arranged with other market counterparties and other economic hedge activity.
Other Monoline exposure
Mar 31, 2015
Dec 31, 2014
in € m. Notional amount
Value prior to CVA
1 CVA
1 Fair value after CVA
1 Notional amount
Value prior to CVA
1 CVA
1
Fair value after CVA
1
AA Monolines:
2 TPS-CLO 1,322 273 (45) 228 1,269 254 (43) 210 CMBS 778 (2) 0 (2) 712 (2) 0 (2) Student loans 365 51 (10) 41 322 44 (9) 35 Other 567 77 (15) 62 506 72 (14) 59
Total AA Monolines 3,032 400 (70) 329 2,810 368 (66) 302
Non Investment- Grade Monolines:
2 TPS-CLO 341 87 (18) 69 329 77 (16) 61 CMBS 1,647 (2) 0 (2) 1,476 (2) 0 (2) Corporate single name/Corporate CDO 31 6 (1) 5 28 5 0 5 Student loans 765 74 (10) 64 679 66 (9) 57 Other 845 136 (44) 92 774 136 (50) 86
Total Non Investment- Grade Monolines 3,629 301 (73) 228 3,285 282 (75) 207
Total
3,4 6,661 701 (143) 557 6,095 650 (141) 509 1 For monolines with actively traded CDS, the Credit Valuation Adjustment (CVA) is calculated using a full CDS-based valuation model. For monolines without actively traded CDS, a model-based
approach is used with various input factors, including relevant market driven default probabilities, the likelihood of an event (either a restructuring or an insolvency), an assessment of any potential settlement in the event of a restructuring, and recovery rates in the event of either restructuring or insolvency. The monolines CVA methodology is reviewed on a quarterly basis by management.
2 Ratings are the lowest of Standard & Poor’s, Moody’s or our own internal credit ratings. 3 Excludes counterparty exposure to monoline insurers that relates to wrapped bonds of € 26 million as of March 31, 2015, and € 22 million as of December 31, 2014, which represents an estimate
of the potential mark-downs of wrapped assets in the event of monoline defaults. 4 A portion of the mark-to-market monoline exposure has been mitigated with CDS protection arranged with other market counterparties and other economic hedge activity.

Deutsche Bank Management Report 17 Interim Report as of March 31, 2015 Operating and Financial Review Events after the Reporting Period
Related Party Transactions
We have business relationships with several companies in which we own significant equity interests. We also have business relationships with a number of companies where members of our Management Board hold positions on boards of directors or non-executive boards. Our business relationships with these companies cover many of the financial services we provide to our clients generally. For more detailed information, please refer to the section “Other Financial Information” of this Interim Report.
Management and Supervisory Board
Mr. Christian Sewing became a member of the Management Board as of January 1, 2015, and is responsible for the Legal Department, Group Audit and Incident Management.
Events after the Reporting Period
On April 22, 2015 Deutsche Bank signed an agreement to purchase additional Postbank shares. With this transaction Deutsche Bank’s share in Postbank increases to approximately 97 %. The transaction will result in a net loss of approximately € 93 million in the second quarter of 2015.

Deutsche Bank Management Report 18 Interim Report as of March 31, 2015 Outlook The Global Economy
Outlook
The following section should be read in conjunction with the Outlook section in the Management Report pro-vided in the Financial Report 2014 that outlined our expectations for 2015 and 2016.
The Global Economy
In 2015, we expect global economic growth to remain unchanged, compared to last year, at 3.4 % on an an-nual average, which is below the trend growth rate seen prior to the financial crisis. Global inflation is likely to drop to 3.3 %, owing to the weak trend in commodity prices and underutilized capacities.
We anticipate that growth in the industrialized countries will accelerate sharply to 2.2 % with a muted rise of 0.5 % in consumer prices. By contrast, we expect growth in emerging markets to fall to 4.3 %. We expect infla-tion to be 5.5 %.
In the eurozone, GDP looks likely to rise by 1.4 % in 2015 on the back of the global economic recovery, an easing of lending conditions, significantly lower oil prices and a weaker euro. The continuing geopolitical risks and the need to reduce private sector debt levels are likely to have a dampening effect. We expect hysteresis effects and moderate growth will likely lead to only a slow improvement of the job market. We expect unem-ployment to fall to an average of 11.0 % in 2015. The weak trend in commodity prices and underutilized capaci-ties will likely, in our view, lead to a stagnation of consumer prices in 2015. We expect the eurozone economy will continue to enjoy strong support from the ongoing expansive monetary policy of the European Central Bank (ECB), which, as part of its unconventional program of measures, increased its asset purchases to € 60 billion per month in March 2015 and, in addition to its purchases of covered bonds and asset-backed securities, also began buying bonds issued by central governments of the eurozone, agencies and European institutions. Political uncertainty is likely to remain relatively high throughout the year due to the difficult ongoing negotiations between the EU, IMF and Greece, as well as pending elections in Finland, Portugal and Spain, where eurosceptic parties could gain a larger share of the votes. Driven by predominantly domestic growth, we expect the German economy to expand by 2.0 % in 2015, once again at a faster rate than the eurozone overall.
In the U.S., we expect above-trend growth of 3.1 % in 2015 and the U.S. looks set to be the main driver of growth in industrial countries, especially as the slowdown in growth in the first quarter 2015 caused by weather factors is likely to be temporary. As a result of weak commodity prices and moderate wage pressure, consumer prices will likely, in our view, rise by 0.6 % in 2015. We expect the continued recovery of the job market and increased housing-related expenditure will likely result in stronger economic growth. Households are in good financial shape. Together with the fall in energy costs, this financial strength is likely to stimulate stronger con-sumption. The Federal Reserve's monetary policy should continue to support the U.S. economy. We expect the first key interest rate hike to come in September 2015 and a key rate of 0.6 % by the end of this year.
The Japanese economy is expected to expand by 0.9 % in 2015. Fiscal measures and the ongoing, extremely expansionary monetary policy are likely to provide further stimulus for growth. Inflation is expected to fall to 0.7 % as the effects of the rise in sales tax ease off and the weak commodity prices take hold.
In 2015, we expect emerging market growth to weaken across all key regions. Economic activity in Asia (ex-cluding Japan) is expected to experience a moderate slowdown to 6.4 % with inflation at 2.7 %. Overall, we expect growth in the Chinese economy to slow to 7 % in 2015 with inflation at 1.8 %, primarily as a result of the real estate market cooling off. Monetary and fiscal policy are likely to become more expansive. In India, we expect overall growth to accelerate to 7.5 % in 2015 and consumer prices to rise by 5.3 %.

Deutsche Bank Management Report 19 Interim Report as of March 31, 2015 Outlook The Banking Industry
In the emerging market economies of Eastern Europe, the Middle East and Africa, we anticipate that growth will slow to 0.6 % in 2015, with consumer prices increasing by 8.4 %. We expect weak oil prices will put pres-sure on the oil producing countries, with the Russian economy, especially, feeling the effects. We anticipate that Russia will slide into a recession with its economy contracting by 5.2 %. In particular, the sanctions im-posed in response to the Ukraine crisis will have, in our view, a dampening effect. We expect inflation in Russia to be at 16.2 %.
Growth in Latin America is expected to cool to 0.7 % in 2015, slowed by supply-side restrictions and low com-modities prices. Consumer prices are projected to rise by 12.8 %. The Brazilian economy is expected to con-tract by 0.7 % in 2015 while consumer prices look set to rise by 7.9 %.
Risks for our forecast include the impending turnaround in U.S. monetary policy, which could prove bumpy and lead to a far greater rise in bond-market rates than we originally assumed. This would have a negative impact on the financial markets and could create problems especially for the emerging markets. Furthermore, the negative effect of the appreciation of the U.S. dollar could turn out to be greater than expected. In Europe, an emerging discussion on future monetary policy, the lack of fiscal consolidation and delays in implementing structural reforms as well as increasing support for eurosceptic parties could potentially have a substantial impact on our forecasts. Our outlook for developments in the emerging market countries is subject to three main risks; demand from the industrialized countries could prove weaker than anticipated, the crisis in the Ukraine could intensify, and China's attempt to cool its economy could lead to a hard landing.
The Banking Industry
European banks may see an improvement in their business over the course of 2015, as laid out in the Finan-cial Report 2014. A moderate rise is expected in revenues as well as private-sector lending volumes and de-posits. A further reduction in provisions for credit losses is likely, provided the macroeconomic environment continues to stabilise as expected and no new major disruptions occur in the context of the debt crisis.
In the U.S., different trends are likely to overlap on the revenue side. On the one hand, we believe business volumes look set to grow further; on the other hand, ongoing margin pressure will likely weigh on net interest income. The expected turnaround in monetary policy could provide relief in the medium term. At the same time, there are signs that loan loss provisions may rise from their very low level at present.
A slight upturn in global investment banking seems possible in 2015. Activity in M&A, equity capital markets and parts of the fixed-income segment could pick up.
The asset management business should benefit globally from a range of factors including increasingly diver-gent monetary policies on both sides of the Atlantic leading to greater volatility on capital markets, stronger economic growth both in Europe and the U.S., very high valuations in many securities markets and a growing risk appetite among investors.
With regard to financial regulation and supervision, the main focus in the euro area is likely to be on the further implementation of the common supervision as well as the establishment of the Single Resolution Mechanism. In addition, work will continue on fleshing out the Capital Markets Union project and decisions are pending on the so-called banking structural reform and the financial transaction tax. Globally, the debate on the introduc-tion of new requirements concerning the Total Loss-Absorbing Capacity (TLAC) and the nominal leverage ratio will be, in our view, particularly important. Litigation charges could remain substantial.

Deutsche Bank Management Report 20 Interim Report as of March 31, 2015 Outlook The Deutsche Bank Group
The Deutsche Bank Group
Since we announced our strategic and financial aspirations for 2015 in our Strategy 2015+, we believe we have made significant progress with respect to our Strategy 2015+ aspirations. In particular, our CET 1 capital ratio has improved significantly since 2012, and we believe we are better balanced as each of our core busi-nesses contributed more than € 1 billion in income before income taxes in 2014. However, our regulatory and the protracted low interest rate environment, combined with high costs resulting from litigation and investiga-tions to which we are subject, increased regulatory and compliance costs as well as the persistence of our operating complexity and continued high controllable costs have made it more challenging to meet our Strat-egy 2015+ targets than we originally anticipated. After completing a rigorous strategy review process we have developed the next phase in our strategy covering the period through 2020, which we refer to as “Strategy 2020”. We have made the following key decisions:
— We intend to deleverage Corporate Banking & Securities (CB&S) and emphasize those business areas that can help us build a more focused, resilient and relationship-driven investment bank. Through these measures, we plan to reduce our CRR/CRD 4 leverage exposure by approximately € 200 billion (gross) in CB&S by 2018. This is expected to be achieved by a reduction of low-yielding assets, reduced prod-uct/client perimeter and derivatives roll-off and is expected to be partially offset by redeployment and growth of approximately € 50-70 billion. We believe the impact of our exposure reduction aspirations will result in a reduction of revenues on an ongoing basis of approximately € 0.6 billion and deleveraging charges of approximately € 0.8 billion by 2018, but that these effects will be more than offset by market growth and revenues from redeploying our assets.
— We believe that our ability to fully realize the value of our acquisition of Postbank eroded in the face of the changed regulatory environment and our revised strategy. As part of our refocus, we intend to deconsoli-date Postbank and launch a re-IPO in 2016. This step should lead to a CRR/CRD 4 leverage exposure re-duction of approximately € 140 billion. Facilitating the implementation of the above, we intend to initiate the process of squeezing-out non-controlling shareholders in Postbank in 2015. This step is intended to pro-vide us with additional flexibility in executing the envisaged re-IPO of Postbank.
— We plan to invest groupwide up to € 1 billion by 2020 to deploy additional digital technologies across our platform. We intend to focus on customer experience, revenue opportunities, enabling our platform, and new clients.
— We plan to invest more than € 1.5 billion by 2020 in our core product engines to accelerate growth in GTB and Deutsche AWM. With respect to GTB, we expect an increase of more than € 50 billion in our incre-mental CRR/CRD 4 leverage exposure, which we believe will support our services to corporate clients and financial institutions. With respect to Deutsche AWM, we plan to increase our lending balance sheet by 5 - 10 % per year to support our clients’ needs and to increase relationship managers in key markets by 15 % in the next two years. In connection with these activities, we anticipate increasing the balance sheet totals of GTB and Deutsche AWM by approximately 30 to 40 % by 2020.
— We intend to rationalize our geographic footprint with a targeted reduction / exit of presence in 7-10 coun-tries and invest in high growth hubs.
— We intend to redesign operating and governance model to achieve higher efficiency by deemphasizing certain products and client segments and locations and modernizing our IT infrastructure and platforms. This is intended to reduce complexity, maintain even stronger controls and achieve easier resolvability with a target of additional organic gross cost reductions of approximately € 3.5 billion by 2020, with targeted aggregate cost to achieve of approximately € 3.7 billion.

Deutsche Bank Management Report 21 Interim Report as of March 31, 2015 Outlook The Deutsche Bank Group
With the implementation of Strategy 2020, we aim to achieve the following medium term financial ambitions:
— Fully loaded CRR/CRD 4 Leverage Ratio equal to or greater than 5 % — Fully loaded CRR/CRD 4 Common Equity Tier 1 (CET1) Ratio of approximately 11 % — Post-tax Return on Tangible Equity greater than 10 % — Organic gross cost reduction of approximately € 3.5 billion and a cost/income ratio of approximately 65 % — Payout ratio, meaning the aggregate of dividends we pay and the prices of shares we repurchase in the
market, of at least 50 %
We are now focused on the successful execution of Strategy 2020 and the related financial targets rather than those key performance indicators and financial targets that we previously communicated under Strategy 2015+ and the related updated aspirations from May 2014.
Our aspirations are subject to a number of internal and external factors, including market, economic and politi-cal uncertainties, which could negatively impact or prevent the implementation of our strategic goals or the realization of their anticipated benefits. These include economic factors such as the recurrence of extreme turbulence in the markets in which we are active, weakness in global, regional and national economic condi-tions, including with respect to the protracted low interest rate environment, increased competition for business and political instability, especially in Europe. In particular, we expect NCOU to have a negative effect on our income before income taxes in the medium term as we run down assets at a slower pace and we continue to settle litigation matters. In addition, we have presented our cost reduction targets on a gross basis, and our net costs may not decline by the amounts indicated above or at all, even if our gross cost reduction targets are achieved. The extent to which we are able to achieve our aspirations may also be impacted by regulatory changes that may affect our businesses differently than we currently expect. In particular, regulators could demand changes to our business model or organization that could reduce our profitability. As these govern-mental initiatives are subject to ongoing discussions, we cannot at this stage quantify any future impact. We are also involved in numerous litigation, arbitration and regulatory proceedings and investigations in Germany and in a number of jurisdictions outside of Germany, especially in the United States. Such matters are subject to many uncertainties. While we have resolved a number of important legal matters and made progress on others, we expect the litigation environment to continue to be challenging. If litigation and regulatory matters continue to occur at the same rate and magnitude as in recent years, we may not be able to achieve our Strat-egy 2020 aspirations.
If we fail to implement our strategic initiatives in whole or in part or should the initiatives that are implemented fail to produce the anticipated benefits, or should the costs we incur to implement our initiatives exceed the € 3.7 billion we have anticipated, we may fail to achieve our financial objectives, or incur losses or low profit-ability or erosions of our capital base, and our share price may be materially and adversely affected.

Deutsche Bank Management Report 22 Interim Report as of March 31, 2015 Outlook The Business Segments
The Business Segments
Corporate Banking & Securities (CB&S) along with the rest of the investment banking industry saw improved revenues in the first quarter of 2015, reflecting an increase in volatility, higher equity valuations and robust corporate finance deal flow. Going forward we expect investment banking industry revenues to see moderate growth supported by a better macroeconomic outlook and increased volatility. However, challenges will remain including ongoing regulatory pressure, continued pressure on resources and the potential impact of geo-political events. In Sales & Trading, we expect global fixed income revenues to grow slightly in 2015 versus 2014 levels, supported by increased volatility and client activity driven by increasing monetary policy diver-gence. In Corporate Finance, we expect the 2015 fee pool to be flat versus 2014 levels. Building on improved revenue momentum from previous quarters, we plan to continue to dynamically optimize the business, while executing on our cost, capital and leverage targets, and delivering cultural change. Geographically, we plan to ensure that resources are appropriately allocated to market opportunities in order to maximize profitability and returns.
Private & Business Clients (PBC) seeks to realise opportunities by further strengthening our leadership in the German home market whilst extending our well-positioned advisory franchises in selected international mar-kets. In terms of investment products, we aim to continue our growth path across all our businesses which is particularly dependent on movements in the European macroeconomic environment and an improving cus-tomer confidence in Germany. Additionally, we intend to invest in digital platforms to expand our multi-channel offering and offer new customer experience. The low interest rate environment is expected to remain in the near term and may continue to impact our deposit revenues. Further revisions in regulatory requirements may additionally affect our overall revenue generation capacity.
For Global Transaction Banking (GTB) comparably low interest rate levels, with even negative interest rates in keys markets, a highly competitive environment and challenges from geopolitical events are likely to continue to adversely impact business in 2015. However, we anticipate a slight recovery in the interest rate environment in some markets towards the end of the year and the volume growth in trade finance and cash management transactions to continue and therefore counterbalance these headwinds. Together with our continued focus on building and developing client relationships and a comprehensive offering of high quality and innovative prod-ucts and services, we believe this leaves us well-placed to cope with the challenging environment and further grow our business.
Deutsche Asset & Wealth Management (Deutsche AWM) expects to remain on track on its growth path, driven by the continued revenue growth through expanded market share in key client segments and the delivery of innovative investment solutions and performance, as well as continued cost management and the successful execution of ongoing initiatives to optimize our operating and technology platform. In wealth management, we continue to expand relationships with ultra-high net worth clients in both developed and emerging markets. In asset management, we combine traditional strengths in active investment management with a growing empha-sis on passive/ Exchange Traded Funds, alternative asset and multi-asset solutions to serve the needs of retail and institutional clients alike. Additionally, across Deutsche AWM we plan to further broaden our relationships with other divisions of Deutsche Bank to extend product distribution and client service. We expect focused execution of ongoing transformation projects in respect of the operating platform, including improved systems for investment management and client service and reporting. Looking ahead, while certain macroeconomic developments such as European sovereign debt issues, emerging market volatility, and the changing regulato-ry environment create uncertainty, continued global economic recovery is expected to bolster the asset and wealth management industry through 2015 to the benefit of large, solutions-oriented managers including Deutsche AWM. In the near term, a decrease in wealth management transactional activity could offset broader growth in assets and revenues.

Deutsche Bank Management Report 23 Interim Report as of March 31, 2015 Outlook The Business Segments
The Non-Core Operations Unit (NCOU) is expected to further contribute to the Group’s strategic targets includ-ing the deleveraging program. The aim is to reduce balance sheet size, free up capital and protect shareholder value by reducing risks from remaining assets and business activities.This has translated into an emphasis on reducing capital demand to improve Deutsche Bank’s capital ratios without diluting shareholders. Going for-ward, we expect to focus on deleveraging the balance sheet as measured under CRR/CRD 4, thereby assist-ing the bank to meet its leverage ratio targets. Additional focus is on resolving high-profile contingent risks and non-bank assets as well as aligning the underlying cost base of the NCOU division as de-risking progresses. Challenges remain for the successful execution of this strategy, including exposure to changes in the wider economic environment and macro market conditions. Such changes may make the associated timeline for de-risking activity less certain and may also impact future results. In addition, the NCOU continues to incur the associated costs from expensive liabilities and for the use of Deutsche Bank Group platforms. The pace of de-risking has slowed as the portfolio size has decreased. In addition to the uncertainty which arises from the NCOU de-risking strategy, we also expect that the litigation and enforcement environment will continue to be challenging.

Deutsche Bank Management Report 24 Interim Report as of March 31, 2015 Risk Report Introduction
Risk Report
Introduction
Risk Management Framework The wide variety of our businesses requires us to identify, measure, aggregate and manage our risks effec-tively, and to allocate our capital among our businesses appropriately. We operate as an integrated group through our divisions, business units and infrastructure functions. We manage risk and capital through a framework of principles, organizational structures and monitoring processes that are closely aligned with the activities of the divisions and business units. Further information about our risk management framework, which has remained principally unchanged since year-end 2014, can be found in our Financial Report 2014.
Basel 3 and CRR/CRD 4 In the European Union, the new Basel 3 capital framework was implemented by the “Regula-tion (EU) No 575/2013 on prudential requirements for credit institutions and investment firms” as amended (Capital Requirements Regulation, or “CRR”), and the “Directive 2013/36/EU on access to the activity of credit institutions and the prudential supervision of credit institutions and investment firms” as amended (Capital Requirements Directive 4, or “CRD 4”) published on June 27, 2013. The CRR/CRD 4 framework replaced the laws implementing the international capital adequacy standards as recommended by the Basel Committee on Banking Supervision, commonly referred to as Basel 2 and Basel 2.5. In order to create a single “rulebook” for credit institutions and investment firms in the European Union, the CRR was made directly applicable to them, which eliminated the need for national implementing legislation with respect to the regulatory areas covered by it. As a result, the German Banking Act (KWG) was amended to remove all provisions that have been sup-planted by the CRR. Newly effective provisions governing regulatory capital requirements, the assessment of counterparty risk and securitizations, and many other regulations relevant for Deutsche Bank are now located in the CRR. In addition, the CRD 4 was implemented into German law by means of further amendments to the German Banking Act (KWG) and the German Solvency Regulation (SolvV) and accompanying regulations. Jointly, these laws and regulations represent the new regulatory framework applicable in Germany to among other things, capital, leverage and liquidity as well as disclosures.
The new regulatory framework became effective on January 1, 2014, subject to certain transitional rules. Therefore when referring to the results according to the transitional rules we use the term “CRR/CRD 4”. When referring to our results according to the full application of the final envisaged framework (and thus without con-sideration of applicable transitional methodology), we use the term “CRR/CRD 4 fully loaded”. At the same time, CRR/CRD 4 left in place unchanged transitional rules that had been adopted in earlier capital adequacy frameworks through Basel 2.5 regarding the risk weighting of certain categories of assets, e.g the rule permit-ting the grandfathering of equity investments at a risk-weight of 100 %. In this case, our CRR/CRD 4 method-ology assumes that the impact of the expiration of these transitional rules will be mitigated through sales of the underlying assets or other measures prior to the expiration of the grandfathering provisions at the end of 2017.
The new minimum capital ratios were phased in beginning of 2015. Most regulatory adjustments (i.e., capital deductions and regulatory filters) are being phased in through 2018. Capital instruments that no longer qualify under the new rules are being phased out through 2022. New capital buffer requirements are being phased in by 2019. Although they were subject to supervisory reporting starting from 2014, binding minimum require-ments for short-term liquidity are introduced in 2015 and a standard for longer term liquidity is expected to become effective in 2018. The introduction of a binding leverage ratio is expected from 2018 following disclo-sure of the ratio starting in 2015.

Deutsche Bank Management Report 25 Interim Report as of March 31, 2015 Risk Report Overall Risk Assessment
For purpose of clarity, we aligned the nomenclature from the CRR/CRD 4 framework relating to the elements of regulatory capital throughout this report.
As there are still some interpretation uncertainties with regard to the CRR/CRD 4 rules and some of the related binding Technical Standards are not yet finally available, we will continue to refine our assumptions and models as our and the industry’s understanding and interpretation of the rules evolve. In this light, our CRR/CRD 4 measures may differ from our earlier expectations, and as our competitors’ assumptions and estimates regard-ing such implementation may also vary, our CRR/CRD 4 measures may not be comparable with similarly la-beled measures used by our competitors.
Scope of Consolidation The following sections refer to our financial statements in accordance with International Financial Reporting Standards (“IFRS”). Consequently, the reporting is generally based on IFRS principles of valuation and consol-idation. However, in particular for Pillar 3 purposes, regulatory principles of consolidation are relevant which differ from those applied for our financial statements and are described in more detail in our Financial Report 2014. Where the regulatory relevant scope is used this is explicitly stated.
Overall Risk Assessment
Key risk categories for us include credit risk, market risk, operational risk (including legal risk), business risk (including tax and strategic risk), reputational risk, liquidity risk, model risk and compliance risk (MaRisk, i.e., minimum requirements for risk management). We manage the identification, assessment and mitigation of top and emerging risks through an internal governance process and the use of risk management tools and proc-esses. Our approach to identification and impact assessment aims to ensure that we mitigate the impact of these risks on our financial results, long term strategic goals and reputation.
As part of our regular risk and cross-risk analysis, sensitivities of the key portfolio risks are reviewed using a bottom-up risk assessment and through a top-down macro-economic and political scenario analysis. This two-pronged approach allows us to capture not only risks that have an impact across our risk inventories and busi-ness divisions but also those that are relevant only to specific portfolios.
Current portfolio-wide risks on which we continue to focus include: the potential for a re-escalation of the Euro-pean sovereign debt crisis, particularly given the renewed stress in Greece amid slow bailout negotiations and deposit flight from domestic banks, a potential slowdown in Asian growth, disruptive US monetary tightening and its impact in particular on Emerging Markets and the potential risk of a geopolitical shock including the ongoing tensions between Russia and Ukraine. These risks have been a consistent focus throughout recent quarters. In recent months we have also focused on the impact of lower oil prices on key producing countries and related industries. The assessment of the potential impacts of these risks is made through integration into our group-wide stress tests which assess our ability to absorb these events should they occur. The results of these tests showed that we currently have adequate capital and liquidity reserves to absorb the impact of these risks if they were to materialize in line with the tests’ parameters.
The first three months of 2015 continued to demonstrate global regulatory trends seen in 2014, which we view as likely to persist through the coming years. We are focused on identifying potential regulatory changes and assessing the possible impacts on our business model and processes.

Deutsche Bank Management Report 26 Interim Report as of March 31, 2015 Risk Report Risk Profile
Risk Profile
Our mix of various business activities results in diverse risk taking by our business divisions. We measure the key risks inherent in their respective business models through the undiversified Total Economic Capital metric, which mirrors each business division’s risk profile before taking into account cross-risk effects at the Group level.
Risk profile of our business divisions as measured by economic capital, risk weighted assets in comparison to performance metrics
Three months ended March 31, 2015
in € m. (unless stated otherwise)
Corporate Banking & Securities
Private & Business Clients
Global Transaction Banking
Deutsche Asset & Wealth Management
Non-Core Operations Unit
Consoli- dation & Adjustments Total
Total in %
Credit Risk 6,871 3,504 2,424 388 842 38 14,067 40 Market Risk 5,688 3,713 189 2,044 1,102 4,551 17,287 49 Operational Risk 5,746 543 604 1,173 399 0 8,464 24 Business Risk 2,581 0 4 0 528 0 3,113 9 Diversification Benefit
1 (4,910) (998) (440) (778) (456) (158) (7,740) (22)
Total EC 15,977 6,761 2,782 2,827 2,415 4,430 35,192 100
(in %) 45 19 8 8 7 13 100 N/M Income (loss) before income taxes 643 536 409 291 (381) (18) 1,479 N/M Pre-tax return on average active equity (in %)
2 8 13 23 16 (18) N/M 8 N/M Risk weighted assets
3 213,582 76,704 51,638 21,949 46,327 21,189 431,390 N/M N/M - Not meaningful 1 Diversification benefit across credit, market, operational and strategic risk (largest part of business risk)
2 Book equity allocation framework driven by risk-weighted assets and leverage exposure. See “Segments Information” on the consolidated financial statements for a description of how average active equity is allocated to the divisions.
3 Risk weighted assets are based upon CRR/CRD 4 fully-loaded.
Three months ended March 31, 2014
1
in € m. (unless stated otherwise)
Corporate Banking & Securities
Private & Business Clients
Global Transaction Banking
Deutsche Asset & Wealth Management
Non-Core Operations Unit
Consoli- dation & Adjustments Total
Total in %
Credit Risk 4,726 3,662 2,058 330 1,164 59 11,999 42 Market Risk 5,560 3,219 197 1,497 1,361 1,723 13,558 48 Operational Risk 2,402 769 81 585 1,304 0 5,141 18 Business Risk 2,162 0 5 1 676 0 2,843 10 Diversification Benefit
2 (2,632) (906) (170) (490) (898) 42 (5,054) (18)
Total EC 12,218 6,744 2,171 1,922 3,608 1,824 28,487 100
(in %) 43 24 8 7 13 6 100 N/M Income (loss) before income taxes 1,439 475 357 167 (541) (216) 1,680 N/M Pre-tax return on average active equity (in %)
3 27 13 27 11 (28) N/M 12 N/M Risk weighted assets
4 165,432 79,613 41,523 13,791 57,990 14,963 373,313 N/M N/M - Not meaningful 1 Amounts allocated to the business segments have been restated to reflect comparatives according to the structure as of March 31, 2015. 2 Diversification benefit across credit, market, operational and strategic risk (largest part of business risk)
3 Book equity allocation framework driven by risk-weighted assets and leverage exposure. See “Segments Information” on the consolidated financial statements for a description of how average active equity is allocated to the divisions.
4 Risk weighted assets are based upon CRR/CRD 4 fully-loaded.
Corporate Banking & Securities’ (CB&S) risk profile is dominated by its trading in support of origination, struc-turing and market making activities, which gives rise to credit risk and market risk. Further credit risks originate from exposures to corporates and financial institutions. Under CB&S’ current business model, the remainder is derived from operational risk and business risk, primarily from potential legal and earnings volatility risks, re-spectively. The share of the operational risk in CB&S’ risk profile has increased significantly over the last year reflecting higher loss profile in the industry as well as a change in the allocation methodology within the Group. CB&S income before income taxes decreased by € 796 million or 55 % in the first three months of 2015 com-pared to the first three months of 2014 driven by increased litigation expenses, higher infrastructure cost at-

Deutsche Bank Management Report 27 Interim Report as of March 31, 2015 Risk Report Risk Profile
tributable to regulatory program expenditure and control function build out, partially offset by strong revenues. Accordingly, CB&S pre-tax return on average active equity decreased from the first quarter 2014 by 19 per-centage points to 8 % in the first quarter 2015. This development was also driven by a higher average active equity allocation associated with our capital raise in May 2014 as well as an increase in risk-weighted assets.
Private & Business Clients’ (PBC) risk profile comprises of credit risk from retail and small and medium-sized enterprises (SMEs) lending as well as nontrading market risk from investment risk, modeling of client deposits and credit spread risk. While PBC’s overall risk profile stayed materially unchanged over the year, the reported income before income taxes increased by € 61 million, or 13 %, compared to the first quarter of 2014, benefit-ting from a positive operational business development. Higher average active equity allocation offset the in-crease in the reported income before income taxes, leading to pre-tax return on average active equity remaining materially unchanged.
Global Transaction Banking’s (GTB) revenues are generated from various products with different risk profiles. The vast majority of its risk relates to credit risk in the Trade Finance business, while other businesses attract low to no credit risk. The relatively low market risk mainly results from modeling of client deposits. Although GTB’s income before income taxes increased by € 53 million, or 15 %, in the first three months of 2015 com-pared to the first quarter 2014 due to record revenues as well as lower provision for credit losses, the pre-tax return on average active equity decreased by 4 percentage points to 23 %. This decrease was driven by a higher average active equity allocation associated with our capital raise in May 2014 and higher risk-weighted assets from business growth.
The main risk driver of Deutsche Asset & Wealth Management’s (Deutsche AWM) business are guarantees on investment funds, which we report as nontrading market risk. Otherwise Deutsche AWM’s advisory and com-mission focused business attracts primarily operational risk. Deutsche AWM’s return on average active equity increased by 5 percentage points from the first quarter 2014 to 16 % in the first quarter 2015, reflecting in-creased revenue from higher assets under management. The increased economic capital usage was mainly driven by a higher nontraded market risk for guaranteed funds as well as increased operational risk allocation.
The Non-Core Operations Unit (NCOU) portfolio includes activities that are non-core to the Bank’s future strat-egy; assets earmarked for de-risking; assets suitable for separation; assets with significant capital absorption but low returns; and assets exposed to legal risks. NCOU’s risk profile covers risks across the entire range of our operations comprising credit risks and also market and operational risks (including legal risks) targeted where possible for accelerated de-risking. The pre-tax return on average active equity benefited from the NCOU’s performance improvement and slightly higher capital allocation. Whilst the de-risking strategy was capital accretive, net income continues to be impacted by outflows related to legal and regulatory matters.
Consolidation & Adjustments mainly comprises non traded market risk for structural foreign exchange risk, pension risk and equity compensation risk. The increase in non traded market risk compared to the first quarter 2014 was mainly driven by a higher structural foreign exchange risk caused by U.S. dollar strengthening and a methodology change for equity compensation risk.

Deutsche Bank Management Report 28 Interim Report as of March 31, 2015 Risk Report Risk Management Executive Summary
Treatment of other Material Risks
Concerning the main key risks “Credit Risk”, “Market Risk”, “Operational Risk” and “Liquidity Risk” and their developments within the first quarter 2015, further details can be found in the specific sections of this Risk Report dedicated to the respective risks. With regard to the other material risks such as “Business Risk”, “Re-putational Risk”, “Model Risk” and “Compliance Risk”, information concerning their definition, identification and management is contained in applicable sections of our Financial Report 2014 (please refer especially to the dedicated sections “Risk Inventory” and “Risk Management Framework – Material Risks”). There are no mate-rial changes concerning the treatment, management and reporting of these risks in comparison to the explana-tions and descriptions disclosed therein. All risks assessed as material are covered by the Internal Capital Adequacy Assessment Process as described in the section “Internal Adequacy Process” of this report. Model-ing and measurement approaches for quantifying capital and demand are implemented across major risk classes. Non-standard risks (reputational risk, model risk, compliance risk) are implicitly covered in our eco-nomic capital framework, primarily within operational and strategic risk.
Risk Management Executive Summary
Credit Risk Summary — Global growth drivers have shifted in recent months with the Eurozone regaining some momentum on the
back of lower oil prices with the significant, QE-driven weakening of the Euro during the quarter expected to support further export growth. In contrast, macro data suggests that U.S. growth has slowed in Q1 alt-hough this is expected to be only temporary. Emerging Markets growth is now expected to slow moderate-ly in aggregate in 2015 with the majority of major economies seeing lower growth year-on-year. Key risks to the outlook include the potential for a re-escalation of the European sovereign debt crisis, the impact of US monetary tightening in particular on Emerging Markets and ongoing elevated geopolitical risks, most notably in Russia/Ukraine. Potential impacts of these events on the credit portfolio are being monitored closely and we currently expect no material credit losses as a result. Credit exposure to Russia based on a country of domicile principle is € 4.5 billion as of March 31, 2015 (December 31, 2014: € 4.8 billion) fo-cused on corporates in strategically important industry sectors. Credit exposure to Ukraine is relatively small at € 0.4 billion as of March 31, 2015 (December 31, 2014: € 0.4 billion).
— Our corporate credit portfolio is 72 % investment-grade rating at March 31, 2015, slightly improved com-pared to 71 % as at December 31, 2014. The corporate credit exposure increased by € 63.3 billion or 11.6 % during the first three months 2015 driven by foreign exchange changes and increases mostly to in-vestment-grade counterparties.
— Our consumer credit portfolio increased slightly from year-end 2014 to March 31, 2015 by € 0.7 billion or 0.4 %, driven by increases in our loan books across Poland, India and Germany. The exposures outside Germany were affected by material Euro foreign exchange changes. As of March 31, 2015, 68 % of our exposure related to the mortgage lending portfolio had a LTV ratio below or equal to 50 %.
— Provision for credit losses was € 218 million in the first quarter 2015, a decrease of € 28 million, or 12 %, compared to the same period 2014. This mainly resulted from lower provisions for IAS 39 reclassified as-sets in NCOU partly offset by an increase in CB&S due to higher provisions in our shipping portfolio.
— RWA for credit risk has increased by € 16.4 billion or 7 % to € 261 billion since December 31, 2014, largely driven by the impact from foreign exchange movements and the increase in business activity in CB&S, partly offset by reductions related to book quality improvements.
— The economic capital usage for credit risk increased to € 14.1 billion as of March 31, 2015, compared with € 12.9 billion at year-end 2014 reflecting higher exposures in CB&S and an increased economic capital usage for transfer risk.

Deutsche Bank Management Report 29 Interim Report as of March 31, 2015 Risk Report Risk Management Executive Summary
Market Risk Summary — The average value-at-risk of our trading units was € 49.6 million during the first three months 2015, com-
pared with € 51.6 million for 2014. The decrease was driven by an improvement in diversification and re-duced interest rate value-at-risk.
— RWA for market risk has increased by € 8.4 billion or 13 % to € 72.6 billion since December 31, 2014, largely driven by increased risk levels coming from the incremental risk charge and an increase in the mar-ket risk standardized approach for securitisation positions mainly due to the end of the transitional period granted by Article 337 (4) CRR and foreign exchange movement.
— Nontrading market risk economic capital usage increased by € 2.2 billion or 22 % to € 12.1 billion as of March 31, 2015. The increase was primarily driven by a methodology change for equity compensation risk, a higher structural foreign exchange risk due to the U.S. dollar strengthening and a higher investment risk economic capital.
— The economic capital usage for trading market risk totaled € 5.2 billion as of March 31, 2015, compared with € 5.0 billion at year-end 2014. The increase was primarily driven by the traded default risk component from the trading and fair value banking books.
Operational Risk Summary — The economic capital usage for operational risk increased to € 8.5 billion as of March 31, 2015, compared
with € 7.6 billion at year-end 2014. The increase was mainly driven by an increased operational risk loss profile of the industry as a whole. This is reflected in the external operational risk loss data that has given rise to the increased economic capital usage and which is largely due to the outflows related to litigation, investigations and regulatory enforcement actions.
— We continue to formally apply the economic capital safety margin to our AMA (advanced measurement approach) model, which we first implemented in 2011 to cover unforeseen legal risks. Risk sensitive model enhancements aimed to replace this safety margin were submitted to BaFin in the second quarter 2014. These enhancements will lead to a higher amount required for economic capital compared to this safety margin and management decided to recognize the increases arising from the model enhancements from the second quarter 2014.
— RWA for operational risk increased to € 75.5 billion as of March 31, 2015, compared with € 67.1 billion at year-end 2014. The increase of € 8.4 billion is caused by the increased operational risk loss profile of the industry as a whole.
Liquidity Risk Summary — Liquidity reserves amounted to € 203 billion as of March 31, 2015 (compared to € 184 billion as of Decem-
ber 31, 2014). We maintained a positive liquidity stress result as of March 31, 2015 (under the combined scenario).
— Capital markets issuance activities in the first three months of 2015 amounted to €16.9 billion as compared to a planned volume of € 30-35 billion for the full year 2015.
— 75 % of our overall funding came from the funding sources we categorize as the most stable comprising capital markets and equity, retail and transaction banking.

Deutsche Bank Management Report 30 Interim Report as of March 31, 2015 Risk Report Credit Risk
Capital Management Summary — The Common Equity Tier 1 capital ratio, calculated on the basis of CRR/CRD 4 (phase-in rate of 40 %),
was 13.8 % as of March 31, 2015, compared with 15.2 % at year-end 2014 (phase-in rate of 20 %). — CET 1 capital according to CRR/CRD 4 decreased by € 0.4 billion to € 59.7 billion as of March 31, 2015
compared with € 60.1 billion CET 1 capital as of December 31, 2014. The decrease in CET1 capital was driven by regulatory adjustments of € 4.1 billion mainly resulting from CET 1 deductions such as deduc-tions from intangible assets that are phased-in with 40 % in 2015 compared to 20 % in 2014. The de-crease in the first three months 2015 was partly offset by impacts from foreign currency translation within Accumulated other comprehensive income of € 3.7 billion.
— Additional Tier 1 (AT1) capital according to CRR/CRD 4 decreased by € 0.5 billion to € 3.3 billion as of March 31, 2015 compared with € 3.8 billion AT1 capital at year-and 2014.
— RWA according to CRR/CRD 4 increased by € 35 billion to € 432 billion as of March 31, 2015, compared with € 397 billion at year-end 2014. The RWA increase is mainly driven by the impact from foreign ex-change movements and secondly reflects the impact of business growth in credit and market risk as well as higher operational risk RWA given recognition of external losses.
— The internal capital adequacy ratio decreased to 166 % as of March 31, 2015, compared with 177 % as of December 31, 2014. The decrease was mainly driven by a higher economic capital requirement.
— The CRR/CRD 4 fully loaded Common Equity Tier 1 ratio decreased in the first three months from 11.7 % as of December 31, 2014 to 11.1 % as of March 31, 2015.
Balance Sheet Management Summary — As of March 31, 2015, our fully loaded CRR/CRD 4 leverage ratio was 3.4 % compared to 3.5 % as of
December 31, 2014, taking into account a fully loaded Tier 1 capital of € 52.5 billion over an applicable ex-posure measure of € 1,549 billion (€ 50.7 billion and € 1,445 billion as of December 31, 2014, respectively).
Credit Risk
Credit Exposure Classifications We classify our credit exposure under two broad headings: corporate credit exposure and consumer credit exposure.
— Our consumer credit exposure consists of our smaller-balance standardized homogeneous loans, primarily in Germany, Italy and Spain. It includes personal loans, residential and nonresidential mortgage loans, overdrafts and loans to self-employed and small business customers of our private and retail businesses.
— Our corporate credit exposure consists of all exposures not defined as consumer credit exposure.
Corporate Credit Exposure Main corporate credit exposure categories according to our internal creditworthiness categories of our counterparties
Mar 31, 2015
in € m. Probability of default
1 Loans
Irrevocable lending commitments
2 Contingent liabilities
OTC derivatives
3
Debt securities available for sale Total
iAAA–iAA 0.00–0.04 % 52,303 24,229 6,033 27,367 57,866 167,798 iA 0.04–0.11 % 49,666 44,022 18,027 19,731 3,669 135,115 iBBB 0.11–0.50 % 59,665 45,648 20,419 9,439 1,831 137,002 iBB 0.50–2.27 % 54,444 35,678 11,270 5,809 3,458 110,659 iB 2.27–10.22 % 20,992 18,456 5,117 2,123 99 46,788 iCCC and below 10.22–100 % 9,684 1,717 1,383 310 51 13,145
Total 246,754 169,750 62,249 64,779 66,975 610,506 1 Reflects the probability of default for a one year time horizon. 2 Includes irrevocable lending commitments related to consumer credit exposure of € 10.0 billion as of March 31, 2015. 3 Includes the effect of netting agreements and cash collateral received where applicable.

Deutsche Bank Management Report 31 Interim Report as of March 31, 2015 Risk Report Credit Risk
Dec 31, 2014
in € m. Probability of default
1 Loans
2
Irrevocable lending commitments
3 Contingent liabilities
OTC derivatives
4
Debt securities available for sale Total
iAAA–iAA 0.00–0.04 % 46,493 22,938 6,281 23,068 50,808 149,589 iA 0.04–0.11 % 44,799 39,336 17,696 9,469 3,371 114,670 iBBB 0.11–0.50 % 54,167 40,145 20,190 7,810 1,746 124,057 iBB 0.50–2.27 % 50,183 31,492 11,640 3,926 3,140 100,380 iB 2.27–10.22 % 19,359 18,924 4,929 2,253 17 45,482 iCCC and below 10.22–100 % 9,417 1,612 1,352 552 50 12,983
Total 224,418 154,446 62,087 47,078 59,132 547,161 1 Reflects the probability of default for a one year time horizon. 2 Includes impaired loans mainly in category iCCC and below amounting to € 5.6 billion as of December 31, 2014. 3 Includes irrevocable lending commitments related to consumer credit exposure of € 9.4 billion as of December 31, 2014. 4 Includes the effect of netting agreements and cash collateral received where applicable.
The above table shows an overall increase in our corporate credit exposure in the first three months 2015 of € 63.3 billion or 11.6 %. The increase in loans of € 22.3 billion was mainly attributable to the investment-grade rating bands. The increase in debt securities available for sale is almost entirely related to the top rating band. The quality of the corporate credit exposure before risk mitigation has slightly increased to 72 % of investment-grade rated exposures compared to 71 % as of December 31, 2014.
Consumer Credit Exposure In our consumer credit exposure we monitor consumer loan delinquencies in terms of loans that are 90 days or more past due and net credit costs, which are the annualized net provisions charged after recoveries.
Consumer Credit Exposure
Total exposure in € m.
90 days or more past due as a % of total exposure
Net credit costs as a % of total exposure
Mar 31, 2015 Dec 31, 2014
1 Mar 31, 2015 Dec 31, 2014
1 Mar 31, 2015 Dec 31, 2014
1
Consumer credit exposure Germany 147,822 147,647 1.12 1.15 0.21 0.22 Consumer and small business financing 19,649 19,553 4.12 4.01 1.08 1.12 Mortgage lending 128,174 128,094 0.66 0.71 0.08 0.08
Consumer credit exposure outside Germany 39,287 38,761 5.32 5.32 0.63 0.68 Consumer and small business financing 13,228 13,003 10.92 10.95 1.42 1.55 Mortgage lending 26,059 25,758 2.48 2.48 0.23 0.25
Total consumer credit exposure
2 187,109 186,408 2.00 2.02 0.30 0.32 1 Beginning 2015 we have refined our classification resulting in a reclassification of € 427 million of Small Business Financing into Mortgage lending (mainly loans relating to development
banks) in Germany and € 1.1 billion of Mortgage lending into Small Business Financing (mainly Commercial Real Estate) outside Germany. 2 Includes impaired loans amounting to € 4.4 billion as of March 31, 2015 and € 4.4 billion as of December 31, 2014.
The volume of our consumer credit exposure increased from year-end 2014 to March 31, 2015 by € 701 million, or 0.4 %, driven by our loan books in Poland, which increased by € 395 million, in India, which increased by € 213 million, and in Germany, which increased by € 175 million. The increase of the exposures in Poland and India were affected by material Euro foreign exchange rate changes.
The 90 days or more past due ratio of our consumer credit exposure marginally decreased from 2.02 % as per year-end 2014 to 2.00 % as of March 31, 2015.
The total net credit costs as a percentage of our consumer credit exposure decreased from 0.32 % as per year-end 2014 to 0.30 % as of March 31, 2015. This was driven by the further improved and stabilized envi-ronment in Germany and countries in Southern Europe in which we operate.

Deutsche Bank Management Report 32 Interim Report as of March 31, 2015 Risk Report Credit Risk
Consumer mortgage lending exposure grouped by loan-to-value ratio buckets1 Mar 31, 2015 Dec. 31, 2014
≤ 50 % 68 % 68 % > 50 ≤ 70 % 16 % 16 % > 70 ≤ 90 % 9 % 9 % > 90 ≤ 100 % 2 % 2 % > 100 ≤ 110 % 1 % 1 % > 110 ≤ 130 % 1 % 1 % > 130 % 2 % 1 % 1 When assigning the exposure to the corresponding LTV buckets, the exposure amounts are distributed according to their relative share of the underlying assessed
real estate value.
The LTV expresses the amount of exposure as a percentage of assessed value of real estate.
Our LTV ratios are calculated using the total lending exposure divided by the current assessed value of the respective real estate. These values are updated on a regular basis. The lending exposure from transactions that benefit from additional liquid collateral is reduced by the value of that collateral, whereas any prior charges increase the corresponding total exposure. The LTV calculation includes exposure which is secured by real estate collateral. Any mortgage lending exposure that is collateralized exclusively by any type of collateral other than real estate is not included in the LTV calculation.
As of March 31, 2015, 68 % of our exposure related to the mortgage lending portfolio had a LTV ratio below or equal to 50 % (68 % as of December 31, 2014).
Credit Risk Exposure to certain Eurozone Countries Certain eurozone countries are presented within the tables below due to concerns relating to sovereign risk. This heightened risk is driven by a number of factors impacting the associated sovereign including high public debt levels and/or large deficits, limited access to capital markets, proximity of debt repayment dates, poor economic fundamentals and outlook (including low gross domestic product growth, weak competitiveness, high unemployment and political uncertainty). Fundamentals have improved to some extent, with the growth outlook for these economies stabilizing, competitiveness improving and external imbalances (i.e., current account deficits) narrowing. This adjustment process has been supported by the ECB’s Outright Monetary Transactions (OMT) program and the European Stability Mechanism (ESM) which have provided a credible (if untested) backstop and helped to contain funding costs. Although a recent Advocate General Opinion stated that the OMT program should be valid under European law, the Court of Justice of the European Union is not expected to issue a final decision until the summer of 2015. The ECB’s Quantitative Easing (QE) program will also help to lower funding costs across the Eurozone. The effectiveness of these measures has so far limited the conta-gion to other Eurozone bond markets from the rising stress in Greece following Syriza’s election victory in January 2015 and subsequent uncertainty over the future of the bailout program.
For the presentation of our exposure to these eurozone countries we apply two general concepts as follows:
— In our “risk management view”, we consider the domicile of the group parent, thereby reflecting the one obligor principle. All facilities to a group of borrowers which are linked to each other (i.e., by one entity holding a majority of the voting rights or capital of another) are consolidated under one obligor. This group of borrowers is usually allocated to the country of domicile of the respective parent company. As an exam-ple, a loan to a counterparty in Spain is Spanish risk as per a domicile view but considered a German risk from a risk management perspective if the respective counterparty is linked to a parent company domiciled in Germany following the above-mentioned one obligor principle. In this risk management view we also consider derivative netting and present exposures net of hedges and collateral. The collateral valuations follow the same approach and principles as outlined separately in our Financial Report 2014. Also, in our risk management view we classify exposure to special purpose entities based on the domicile of the un-derlying assets as opposed to the domicile of the special purpose entities. Additional considerations apply for structured products. If, for example, a structured note is issued by a special purpose entity domiciled in Ireland, it will be considered an Irish risk in a “country of domicile” view, but if the underlying assets collat-

Deutsche Bank Management Report 33 Interim Report as of March 31, 2015 Risk Report Credit Risk
eralizing the structured note are German mortgage loans, then the exposure would be included as German risk in the “risk management” view.
— In our “country of domicile view” we aggregate credit risk exposures to counterparties by allocating them to the domicile of the primary counterparty, irrespective of any link to other counterparties, or in relation to credit default swaps underlying reference assets from, these eurozone countries. Hence we also include counterparties whose group parent is located outside of these countries and exposures to special purpose entities whose underlying assets are from entities domiciled in other countries.
Net credit risk exposure with certain eurozone countries – Risk Management View in € m. Mar 31, 2015 Dec 31, 2014
1
Greece 528 416 Ireland 2,206 1,398 Italy 14,586 14,920 Portugal 1,075 1,002 Spain 9,346 8,273
Total 27,741 26,009 1 Prior year figures were adjusted by € 0.8 billion exposure with Ireland and Italy to Securitization and Real Estate counterparties erroneously not included as at
December 31, 2014.
Net credit risk exposure is up € 1.7 billion since year-end 2014. This was mainly driven by increased securitisa-tion exposure in Ireland, as well as higher overnight placement with banks in Spain, partly offset by lower trad-ing positions in Italy. Greece exposure increased by € 0.1 billion, mostly from the U.S. dollar denominated Shipping portfolio driven by the significant U.S. dollar appreciation during the first quarter and reduction in collateral value from ship re-valuations.
Our above exposure is principally to highly diversified, low risk retail portfolios and small and medium enter-prises in Italy and Spain, as well as strong corporate and diversified mid-cap clients. Our financial institutions exposure is predominantly geared towards larger banks in Spain and Italy, typically collateralised. Sovereign exposure is at what we view as a manageable level absent more generalized contagion spreading after an adverse event such as a Greek exit from the euro.
The following tables, which are based on the “country of domicile” view, present our gross position, the in-cluded amount thereof of undrawn exposure and our net exposure to these eurozone countries. The gross exposure reflects our net credit risk exposure grossed up for net credit derivative protection purchased with underlying reference assets domiciled in one of these countries, guarantees received and collateral. Such collateral is particularly held with respect to our retail portfolio, but also for financial institutions predominantly based on derivative margining arrangements, as well as for corporates. In addition the amounts also reflect the allowance for credit losses. In some cases, our counterparties’ ability to draw undrawn commitments is limited by terms included in the specific contractual documentation. Net credit exposures are presented after effects of collateral held, guarantees received and further risk mitigation, including net notional amounts of credit deriva-tives for protection sold/(bought). The provided gross and net exposures to certain eurozone countries do not include credit derivative tranches and credit derivatives in relation to our correlation business which, by design, is structured to be credit risk neutral. Additionally the tranche and correlated nature of these positions do not allow a meaningful disaggregated notional presentation by country, e.g., as identical notional exposures repre-sent different levels of risk for different tranche levels.

Deutsche Bank Management Report 34 Interim Report as of March 31, 2015 Risk Report Credit Risk
Gross position, included undrawn exposure and net exposure to certain eurozone countries – Country of Domicile View Sovereign Financial Institutions Corporates Retail Other Total
in € m. Mar 31, 2015
Dec 31, 2014
Mar 31, 2015
Dec 31, 2014
Mar 31, 2015
Dec 31, 2014
Mar 31, 2015
Dec 31, 2014
Mar 31, 2015
Dec 31, 2014
Mar 31, 2015
1 Dec 31, 2014
Greece Gross 121 100 811 716 1,804 1,176 8 8 0 34 2,743 2,033
Undrawn 0 0 32 20 186 72 1 3 0 0 219 95Net 108 89 119 107 115 134 3 3 0 34 344 367
Ireland Gross 510 553 1,337 1,100 10,428 8,282 40 40 3,026
2 2,350
2 15,341 12,325Undrawn 0 0 40 48 3,181 2,257 1 1 439
2 476
2 3,661 2,783Net (64) (21) 587 524 7,163 5,154 5 5 3,006
2 2,350
2 10,697 8,012Italy
Gross 5,617 4,673 6,192 5,736 9,183 8,512 19,244 19,330 695 1,310 40,930 39,560Undrawn 0 0 1,096 952 3,206 3,064 211 199 25 28 4,538 4,242
Net 1,181 244 3,349 3,431 6,769 5,900 6,839 6,768 605 1,229 18,743 17,573Portugal
Gross 18 (5) 369 404 1,263 1,053 1,981 2,023 63 205 3,696 3,680Undrawn 0 0 89 37 272 122 13 31 0 0 374 191
Net 18 (76) 290 357 848 504 211 221 63 205 1,431 1,210Spain
Gross 670 696 3,000 2,465 9,859 9,345 10,572 10,585 591 840 24,692 23,931Undrawn 0 0 956 738 3,939 3,832 468 481 6 16 5,369 5,068
Net 469 275 2,403 2,084 7,211 6,834 2,007 1,894 495 792 12,585 11,879
Total gross 6,936 6,018 11,710 10,421 32,537 28,368 31,845 31,986 4,375 4,738 87,402 81,530Total undrawn 0 0 2,212 1,795 10,784 9,348 694 715 471 520 14,161 12,378
Total net
3 1,713 511 6,747 6,504 22,106 18,526 9,065 8,892 4,169 4,609 43,800 39,0411 Approximately 59 % of the overall exposure will mature within the next 5 years. 2 Other exposures to Ireland include exposures to counterparties where the domicile of the group parent is located outside of Ireland as well as exposures to special purpose entities whose
underlying assets are from entities domiciled in other countries. 3 Total net exposure excludes credit valuation reserves for derivatives amounting to € 200 million as of March 31, 2015 and € 300 million as of December 31, 2014.
Total net exposure to the above selected eurozone countries increased by € 4.8 billion in the first three months of 2015 mainly driven by increased corporate portfolios in Ireland, Italy, Portugal and Spain and increased sovereign portfolios in Italy partly offset by reduced exposure with other counterparties in Italy and Spain.
Aggregate net credit risk exposure to certain eurozone countries by type of financial instrument Mar 31, 2015
Financial assets carried at amortized cost
Financial assets measured at fair value
Financial instruments at fair value through profit or loss
in € m.
Loans before loan loss allowance
Loans after loan loss allowance Other
1
Financial assets available for sale
2 Derivatives Other Total
3
Greece 170 137 133 0 118 19 406 Ireland 3,474 3,444 2,811 456 1,404 2,533 10,648 Italy 10,967 9,900 4,041 866 4,434 3,360 22,601 Portugal 475 420 441 17 61 721 1,661 Spain 5,860 5,215 3,959 118 522 2,215 12,030
Total 20,946 19,117 11,384 1,458 6,538 8,849 47,346 1 Primarily includes contingent liabilities and undrawn lending commitments. 2 Excludes equities and other equity interests. 3 After loan loss allowances.

Deutsche Bank Management Report 35 Interim Report as of March 31, 2015 Risk Report Credit Risk
Dec 31, 2014
Financial assets carried at amortized cost
Financial assets measured at fair value
Financial instruments at fair value through profit or loss
in € m.
Loans before loan loss allowance
Loans after loan loss allowance Other
1
Financial assets available for sale
2 Derivatives Other Total
3
Greece 201 182 92 0 85 28 387 Ireland 2,101 2,068 2,707 481 843 1,728 7,827 Italy 10,785 9,775 3,791 672 4,071 3,085 21,393 Portugal 639 588 306 20 36 558 1,507 Spain 5,622 4,983 3,642 231 510 2,015 11,381
Total 19,348 17,595 10,537 1,404 5,545 7,414 42,496 1 Primarily includes contingent liabilities and undrawn lending commitments. 2 Excludes equities and other equity interests. 3 After loan loss allowances.
The above tables exclude credit derivative exposure, which is separately reported in the following table. For our credit derivative exposure with these eurozone countries we present the notional amounts for protection sold and protection bought on a gross level as well as the resulting net notional position and its fair value. For a more detailed description of our usage of credit derivatives to manage credit risk see the respective risk sections of our Financial Report 2014.
Credit derivative exposure with underlying assets domiciled in certain eurozone countries Mar 31, 2015 Dec 31, 2014
in € m. Protection sold
Protection bought
Net protection sold/(bought)
Net fair value
Protection sold
Protection bought
Net protection sold/(bought)
Net fair value
Greece 862 (924) (62) 0 901 (921) (20) 2 Ireland 3,991 (3,943) 49 (8) 4,344 (4,158) 186 4 Italy 41,266 (45,124) (3,858) 6 41,433 (45,253) (3,821) 156 Portugal 5,820 (6,050) (230) 0 5,876 (6,173) (297) 6 Spain 18,082 (17,527) 555 123 18,061 (17,563) 498 10
Total 70,021 (73,567) (3,546) 120 70,614 (74,068) (3,454) 177
Sovereign Credit Risk Exposure to certain eurozone countries The amounts below reflect a net “country of domicile view” of our sovereign exposure.
Sovereign credit risk exposure to certain eurozone Countries Mar 31, 2015 Dec 31, 2014
in € m.
Direct Sovereign exposure
1
Net Notional of CDS referencing sovereign debt
Net sovereign exposure
Memo Item: Net fair value of CDS referencing sovereign debt
2
Direct Sovereign exposure
1
Net Notional of CDS referencing sovereign debt
Net sovereign exposure
Memo Item: Net fair value of CDS referencing sovereign debt
2
Greece 121 (13) 108 0 100 (11) 89 1 Ireland (48) (16) (64) 0 (26) 4 (21) 2 Italy 5,549 (4,368) 1,181 0 4,600 (4,356) 244 133 Portugal (25) 43 18 0 (5) (71) (76) 2 Spain 662 (193) 469 6 688 (413) 275 1
Total 6,259 (4,546) 1,713 6 5,358 (4,848) 511 139 1 Includes sovereign debt classified as financial assets/liabilities at fair value through profit or loss, available for sale and loans carried at amortized cost. 2 The amounts reflect the net fair value in relation to default swaps referencing sovereign debt of the respective country representing the counterparty credit risk.
The increase of € 1.2 billion in net sovereign credit exposure compared with year-end 2014 mainly reflects movements from trading debt securities and derivative positions. The increase in our net sovereign exposure is mainly driven by significant increase in Italian sovereign exposures which primarily reflects exposure changes in trading debt securities and positive market values from derivatives, coupled with slight increase in Spanish sovereign exposures due to increase in net sold CDS protection for Spain.
The above represented direct sovereign exposure included the carrying value of loans held at amortized cost to sovereigns which, as of March 31, 2015, amounted to € 277 million for Italy and € 547 million for Spain and, as of December 31, 2014 amounted to € 279 million for Italy and € 580 million for Spain.

Deutsche Bank Management Report 36 Interim Report as of March 31, 2015 Risk Report Asset Quality
Asset Quality
This section describes the asset quality of our loans. All loans, where known information about possible credit problems of borrowers causes our management to have serious doubts as to the collectability of the borrower’s contractual obligations, are included in this section.
Overview of performing, renegotiated, past due and impaired loans by customer groups Mar 31, 2015 Dec 31, 2014
in € m. Corporate loans
Consumer loans Total
Corporate loans
Consumer loans Total
Loans neither past due, nor renegotiated or impaired 240,157 179,129 419,286 217,772 177,925 395,697 Past due loans, neither renegotiated nor impaired 1,259 3,111 4,370 1,307 3,652 4,959 Loans renegotiated, but not impaired 377 467 844 349 473 821 Impaired loans 4,961 4,402 9,363 4,990 4,358 9,348
Total 246,754 187,109 433,863 224,418 186,408 410,825
Impaired Loans Credit Risk Management regularly assesses at each balance sheet date whether there is objective evidence that a loan or group of loans is impaired. A loan or group of loans is impaired and impairment losses are incurred if:
— there is objective evidence of impairment as a result of a loss event that occurred after the initial recogni-tion of the asset and up to the balance sheet date (a “loss event”). When making our assessment we con-sider information on such events that is reasonably available up to the date the financial statements are authorized for issuance in line with the requirements of IAS 10;
— the loss event had an impact on the estimated future cash flows of the financial asset or the group of financial assets, and
— a reliable estimate of the loss amount can be made at each reporting date.
Credit Risk Management’s loss assessments are subject to regular review in collaboration with Finance. The results of this review are reported to and approved by an oversight committee comprised of Finance and Risk senior management.
Impairment Loss and Allowance for Loan Losses If there is evidence of impairment the impairment loss is generally calculated on the basis of discounted ex-pected cash flows using the original effective interest rate of the loan. If the terms of a loan are renegotiated or otherwise modified because of financial difficulties of the borrower without qualifying for a derecognition of the loan, the impairment loss is measured using the original effective interest rate before modification of terms. We reduce the carrying amount of the impaired loan by the use of an allowance account and recognize the amount of the loss in the consolidated statement of income as a component of the provision for credit losses. We re-cord increases to our allowance for loan losses as an increase of the provision for loan losses in our income statement. Charge-offs reduce our allowance while recoveries, if any, are credited to the allowance account. If we determine that we no longer require allowances which we have previously established, we decrease our allowance and record the amount as a reduction of the provision for loan losses in our income statement. When it is considered that there is no realistic prospect of recovery and all collateral has been realized or trans-ferred to us, the loan and any associated allowance for loan losses is charged off (i.e., the loan and the related allowance for loan losses are removed from the balance sheet).
We first assess whether objective evidence of impairment exists individually for loans that are individually sig-nificant. We then assess collectively for loans that are not individually significant and loans which are signifi-cant but for which there is no objective evidence of impairment under the individual assessment.

Deutsche Bank Management Report 37 Interim Report as of March 31, 2015 Risk Report Asset Quality
For further details regarding our accounting treatment relating to impairment loss and allowance for credit losses please refer to Note 1 “Significant Accounting Policies and Critical Accounting Estimates” of our Finan-cial Report 2014.
Overview of impaired loans, loan loss allowance and impaired loan coverage ratios by business divisions
Mar 31, 2015 Dec 31, 2014
2015 increase (decrease) from 2014
in € m. Impaired loans
Loan loss allowance
Impaired loan coverage ratio in %
Impaired loans
Loan loss allowance
Impaired loan coverage ratio in %
Impaired loans
Impaired loan coverage ratio in ppt
Corporate Banking & Securities 757 382 50 637 318 50 120 1 Private & Business Clients 4,291 2,528 59 4,269 2,486 58 22 1 Global Transaction Banking 1,554 989 64 1,574 995 63 (20) 0 Deutsche Asset & Wealth Management 66 37 56 66 33 50 0 6 Non-Core Operations Unit 2,695 1,378 51 2,803 1,380 49 (108) 2
Thereof: assets reclassified to loans and receivables according to IAS 39 904 486 54 986 518 53 (82) 1
Total 9,363 5,315 57 9,348 5,212 56 15 1
Impaired loans by industry sector
Mar 31, 2015 Dec. 31, 2014
in € m. Individually assessed
Collectively assessed Total
Individually assessed
Collectively assessed Total
Banks and insurance 1 0 1 0 0 0 Fund management activities 62 2 64 64 0 64 Manufacturing 548 230 778 525 232 757 Wholesale and retail trade 362 236 598 362 229 591 Households 402 3,335 3,737 451 3,299 3,750 Commercial real estate activities 1,658 314 1,972 1,733 314 2,047 Public sector 53 0 53 50 0 50 Other 1,875 285 2,160 1,806 284 2,090
Total 4,961 4,402 9,363 4,990 4,359 9,348
Impaired loans by region
Mar 31, 2015 Dec. 31, 2014
in € m. Individually assessed
Collectively assessed Total
Individually assessed
Collectively assessed Total
Germany 1,596 1,866 3,462 1,604 1,896 3,499 Western Europe (excluding Germany) 2,694 2,360 5,054 2,683 2,303 4,986 Eastern Europe 112 168 279 107 152 259 North America 360 2 362 423 2 425 Central and South America 1 0 1 2 0 3 Asia/Pacific 173 5 179 170 5 174 Africa 23 1 24 0 1 1 Other 2 0 2 1 0 1
Total 4,961 4,402 9,363 4,990 4,359 9,348
Development of Impaired Loans
Three months ended Mar 31, 2015 Full Year 2014
in € m. Individually assessed
Collectively assessed Total
Individually assessed
Collectively assessed Total
Balance, beginning of year 4,990 4,359 9,348 5,922 4,221 10,143
Classified as impaired during the year
1 238 649 887 2,112 2,181 4,293 Transferred to not impaired during the year
1 (266) (504) (770) (1,425) (1,182) (2,607) Charge-offs (113) (120) (233) (1,037) (613) (1,651) Disposals of impaired loans (52) 0 (52) (514) (254) (768) Exchange rate and other movements 164 18 182 (68) 6 (62)
Balance, end of period 4,961 4,402 9,363 4,990 4,359 9,348 1 Includes repayments.

Deutsche Bank Management Report 38 Interim Report as of March 31, 2015 Risk Report Asset Quality
Our impaired loans slightly increased in the first three months 2015 by € 15 million or 0.2 % to € 9.4 billion resulting from an increase of € 43 million for collectively assessed impaired loans driven by Postbank and partly offset by a reduction in individually assessed impaired loans driven by NCOU mainly due to the reduction in IAS 39 reclassified impaired assets.
The impaired loan coverage ratio (defined as total on-balance sheet allowances for all loans individually im-paired or collectively assessed divided by IFRS impaired loans (excluding collateral)) increased slightly from 56 % as of year-end 2014 to 57 % as of March 31, 2015.
Our impaired loans included € 904 million of loans reclassified to loans and receivables in accordance with IAS 39, which decreased by € 82 million or 8 % compared to prior year end, mainly due to charge offs and disposals overcompensating the increase from foreign exchange movements.
Movements in the Allowance for Credit Losses Our allowance for credit losses comprises of the allowance for loan losses and the allowance for off-balance sheet positions.
Development of allowance for credit losses Three months ended Mar 31, 2015
Allowance for Loan Losses Allowance for Off-Balance Sheet Positions
in € m. (unless stated otherwise)
Individually assessed
Collectively assessed Subtotal
Individually assessed
Collectively assessed Subtotal Total
Balance, beginning of year 2,364 2,849 5,212 85 141 226 5,439
Provision for credit losses 92 119 211 5 2 7 218 Thereof: (Gains)/Losses from disposal of impaired loans (7) 0 (7) 0 0 0 (7)
Net charge-offs: (103) (100) (202) 0 0 0 (202) Charge-offs (113) (120) (233) 0 0 0 (233) Recoveries 10 21 31 0 0 0 31
Other changes 70 24 94 3 13 15 109
Balance, end of period 2,423 2,892 5,315 93 156 249 5,564
Changes compared to prior year Provision for credit losses
In € m. (5) (25) (30) 0 2 2 (28) In % (5) (17) (13) (8) (5,465) 35 (12)
Net charge-offs In € m. 418 (17) 401 0 0 0 401 In % (80) 20 (67) 0 0 0 (67)
Allowance for credit losses as at March 31. 2015 amounted to € 5.6 billion compared to € 5.4 billion as at end of last year. This increase is predominantly a result of foreign exchange movements recorded in Other changes in the table above, while additional provisions were largely offset by charge offs.
Provision for credit losses decreased by € 28 million compared to the first quarter 2014, driven by a reduction in provision for loan losses of € 30 million. The reduction in provision for loan losses was driven by our collec-tively assessed loan portfolio reflecting the ongoing positive credit environment in Germany along with a stabi-lization in the Southern European credit markets. In our individually assessed loan portfolio, reductions in NCOU resulting from IAS 39 reclassified assets were almost offset by an increase in CB&S driven by our ship-ping portfolio.
The reduction in charge-offs of € 401 million compared to prior years’ first quarter is predominantly driven by Postbank and results from high prior year levels caused by a one off effect due to the the alignment of processes.

Deutsche Bank Management Report 39 Interim Report as of March 31, 2015 Risk Report Counterparty Credit Risk: Regulatory Assessment
Our allowance for loan losses for IAS 39 reclassified assets, which are reported in NCOU, amounted to € 487 million as of March 31, 2015, representing 9 % of our total allowance for loan losses, down 6 % from the level at the end of 2014 which amounted to € 518 million (10 % of total allowance for loan losses). This reduction was largely driven by net charge offs of € 61 million partly offset by foreign exchange as most IAS 39 reclassified assets are denominated in non-Euro currencies and additional provisions for loan losses of € 2 million.
Compared to the first quarter 2014, provision for loan losses for IAS 39 reclassified assets dropped by € 27 million and net charge-offs increased by € 53 million.
Three months ended Mar 31, 2014
Allowance for Loan Losses Allowance for Off-Balance Sheet Positions
in € m. (unless stated otherwise)
Individually assessed
Collectively assessed Subtotal
Individually assessed
Collectively assessed Subtotal Total
Balance, beginning of year 2,857 2,732 5,589 102 114 216 5,805
Provision for credit losses 97 144 241 6 0 5 246 Thereof: (Gains)/Losses from disposal of impaired loans (4) 0 (4) 0 0 0 (4)
Net charge-offs: (520) (83) (603) 0 0 0 (603) Charge-offs (528) (107) (634) 0 0 0 (634) Recoveries 7 24 31 0 0 0 31
Other changes (13) (5) (18) 0 0 0 (18)
Balance, end of period 2,420 2,788 5,208 107 114 221 5,429
Changes compared to prior year Provision for credit losses
In € m. (137) 33 (103) 3 (9) (5) (108) In % (59) 30 (30) 124 (100) (48) (30)
Net charge-offs In € m. (424) (28) (453) 0 0 0 (453) In % 440 52 300 0 0 0 300
Counterparty Credit Risk: Regulatory Assessment
This section provides details on our exposure at default (EAD) and RWA by regulatory defined exposure classes and model approaches, including our securitization positions. The tables presented for the current reporting and comparison period are based on the CRR/CRD 4 framework. Quantitative information presented follows the regulatory scope of consolidation.
We generally apply the advanced internal rating based approach (IRBA) for the majority of our advanced IRBA eligible credit portfolios to calculate the regulatory capital requirements according to the CRR/CRD 4 frame-work, based on respective approvals received from BaFin. The advanced IRBA is the most sophisticated ap-proach available under the regulatory framework for credit risk allowing us to make use of our internal rating methodologies as well as internal estimates of specific other risk parameters. Moreover, we apply the founda-tion IRBA for a portion of Postbank’s IRBA eligible credit portfolios, for which Postbank received respective BaFin approvals in recent years.
We have always met the regulatory minimum requirements with regard to the respective coverage ratio thresholds as calculated by EAD and RWA according to Section 11 SolvV. Nevertheless, because institutions are urged to apply the advanced IRBA as comprehensively as possible, we continue our efforts to further en-hance our respective coverage ratio. For a few remaining advanced IRBA eligible portfolios temporarily as-signed to the standardized approach, an implementation plan and approval schedule have been set up and agreed with the competent authorities, BaFin, Bundesbank and ECB.

Deutsche Bank Management Report 40 Interim Report as of March 31, 2015 Risk Report Counterparty Credit Risk: Regulatory Assessment
The BaFin approvals obtained as a result of the advanced IRBA audit processes for our counterparty credit exposures excluding Postbank allow the usage of 68 internally developed rating systems for regulatory capital calculation purposes. Postbank’s approvals, which exclude PB Capital Corporation, were obtained from the BaFin as a result of its IRBA audit processes for the counterparty credit exposures and allow the usage of 14 internally developed rating systems for regulatory capital calculation purposes.
The following table provides an overview of our credit risk exposure broken down by model approaches and business division.
The line item “Other” in Advanced IRBA reflects EAD from securitization positions in the banking book, specific equity positions and other non-credit obligation assets. Within the Standardized Approach, the line item “central governments and central banks” includes exposures to regional governments or local authorities, public sector entities, multilateral developments banks and international organizations. “Other” in the Standardized Approach includes EAD from exposures secured by mortgages on immovable property, exposures in default, items asso-ciated with particularly high risk, covered bonds, claims on institutions and corporates with a short-term credit assessment, collective investments undertakings (CIU), equity positions (grandfathered), securitization posi-tions in the banking book and other items.
EAD according to the model approaches applied to our credit risk portfolios Mar 31, 2015
in € m.
Corporate Banking & Securities
Private & Business Clients
Global Transaction Banking
Deutsche Asset & Wealth Management
Non-Core Operations Unit
Consolidation & Adjustments and Other Total
Credit Risk Advanced IRBA 351,452 230,221 120,219 56,428 19,321 8,555 786,195
Central governments and central banks 57,930 870 27,067 1,760 436 561 88,624 Institutions 46,536 9,721 10,995 1,002 1,453 337 70,044 Corporates 191,481 20,694 80,299 50,630 10,032 1,717 354,853 Retail 882 190,756 88 2,637 1,836 1 196,200 Other 54,622 8,180 1,769 399 5,565 5,938 76,475
Foundation IRBA 2,701 7,572 212 0 6 0 10,492 Central governments and central banks 0 0 0 0 0 0 0 Institutions 0 85 0 0 0 0 85 Corporates 2,701 7,488 212 0 6 0 10,407
Standardized Approach 111,890 32,195 15,669 3,972 13,276 21,793 198,795 Central governments or central banks 68,439 20,526 7,651 213 519 230 97,579 Institutions 35,436 2,166 104 21 33 171 37,930 Corporates 6,505 1,914 5,985 1,760 5,929 753 22,847 Retail 10 5,816 845 56 950 23 7,700 Other 1,500 1,773 1,084 1,921 5,845 20,617 32,740
Risk exposure amount for default funds contributions 1,585 57 1 0 2 0 1,645
Total 467,628 270,045 136,101 60,400 32,605 30,348 997,127

Deutsche Bank Management Report 41 Interim Report as of March 31, 2015 Risk Report Counterparty Credit Risk: Regulatory Assessment
Dec 31, 2014
in € m.
Corporate Banking & Securities
Private & Business Clients
Global Transaction Banking
Deutsche Asset & Wealth Management
Non-Core Operations Unit
Consolidation & Adjustments and Other Total
Credit Risk Advanced IRBA 298,982 225,016 115,780 50,954 20,890 8,248 719,868
Central governments and central banks 58,284 989 30,048 1,694 390 574 91,978 Institutions 41,988 7,651 10,662 1,000 1,497 297 63,095 Corporates 151,859 19,570 72,600 46,275 11,970 1,239 303,513 Retail 823 188,652 112 1,604 1,936 0 193,127 Other 46,028 8,154 2,359 380 5,097 6,138 68,156
Foundation IRBA 2,410 7,708 142 0 10 0 10,269 Central governments and central banks 0 0 0 0 0 0 0 Institutions 0 0 0 0 0 0 0 Corporates 2,410 7,708 142 0 10 0 10,269
Standardized Approach 84,565 31,721 15,734 3,767 8,702 26,572 171,060 Central governments or central banks 48,777 19,474 7,910 264 565 185 77,175 Institutions 29,195 2,973 98 20 32 173 32,491 Corporates 5,323 1,522 5,720 1,529 1,340 548 15,982 Retail 10 5,761 743 64 1,523 24 8,124 Other 1,260 1,990 1,264 1,891 5,243 25,641 37,288
Risk exposure amount for default funds contributions 1,531 62 1 0 2 0 1,595
Total 387,487 264,506 131,656 54,720 29,603 34,820 902,793
The overall increase in EAD levels in the first quarter is mainly driven by foreign exchange movements which are accountable for € 52.8 billion of the € 94.3 billion change. Furthermore we saw in the advanced IRBA an increase in EAD within the exposure class “corporate”, mainly resulting from growth in our core business.
The movements in EAD in the exposure class “central governments and central banks” in the Advanced IRBA approach mainly resulted from lower positions in interest earning deposits with central banks.
The increase in EAD in the exposure class “central governments and central banks” in the standardized ap-proach was primarily driven by higher reserve balances with central banks.
The decrease in EAD in the exposure class “Other” within the standardized approach is mainly attributable to our defined benefit pension fund assets.

Deutsche Bank Management Report 42 Interim Report as of March 31, 2015 Risk Report Counterparty Credit Risk: Regulatory Assessment
Internal Ratings and Probability of Defaults All internal ratings and scorings are based on a uniform master scale, which assigns each rating or scoring result to the default probability determined for that class.
Internal ratings and their PD ranges Internal rating PD range in %
1
iAAA > 0.00 ≤ 0.01 iAA+ > 0.01 ≤ 0.02 iAA > 0.02 ≤ 0.03 iAA– > 0.03 ≤ 0.04 iA+ > 0.04 ≤ 0.05 iA > 0.05 ≤ 0.07 iA– > 0.07 ≤ 0.11 iBBB+ > 0.11 ≤ 0.18 iBBB > 0.18 ≤ 0.30 iBBB– > 0.30 ≤ 0.50 iBB+ > 0.50 ≤ 0.83 iBB > 0.83 ≤ 1.37 iBB– > 1.37 ≤ 2.27 iB+ > 2.27 ≤ 3.75 iB > 3.75 ≤ 6.19 iB– > 6.19 ≤ 10.22 iCCC+ > 10.22 ≤ 16.87 iCCC > 16.87 ≤ 27.84 iCCC– > 27.84 ≤ 99.99 Default 100.00 1 Reflects the probability of default for a one year time horizon.
Advanced IRBA Exposure with Corporates The table below shows our advanced IRBA exposures with Corporates, including portfolios from Postbank. The presentation excludes counterparty credit risk exposures from derivatives and securities financing transac-tions (SFT). The exposures are distributed on our internal rating scale, showing also the probability of de-fault (PD) range for each grade. Our internal ratings correspond to the respective external Standard & Poor’s rating equivalents. The EAD net is presented in conjunction with exposures-weighted average PD and loss given default (LGD), the RWA and the average risk weight (RW). The information is shown after credit risk mitigation obtained in the form of financial, physical and other collateral as well as guarantees and credit de-rivatives. The effect of double default, to the extent applicable to exposures outside of Postbank is considered in the average risk weight. It implies that for a guaranteed exposure a loss only occurs if the primary obligor and the guarantor fail to meet their obligations at the same time.

Deutsche Bank Management Report 43 Interim Report as of March 31, 2015 Risk Report Counterparty Credit Risk: Regulatory Assessment
EAD net for Advanced IRBA credit exposures by PD grade with corporates (excluding derivatives and SFTs) in € m. (unless stated otherwise) Mar 31, 2015 Dec, 31 2014
Internal rating EAD net
Average PD in %
Average LGD in %
RWA Average RW in %
EL/EAD in % EAD net
Average PD in %
1 Average LGD in %
RWA Average RW in %
EL/EAD in %
iAAA 5,377 0.03 22.96 387 7.20 0.01 4,893 0.03 21.82 325 6.64 0.01 iAA+ 6,216 0.03 22.77 444 7.15 0.01 5,700 0.03 20.58 326 5.72 0.01 iAA 10,866 0.03 18.88 665 6.12 0.01 11,377 0.03 16.32 534 4.69 0.00 iAA– 13,406 0.04 31.99 1,421 10.60 0.01 12,583 0.04 33.75 1,405 11.17 0.01 iA+ 15,244 0.05 32.42 2,110 13.84 0.02 13,744 0.05 29.51 1,849 13.45 0.01 iA 21,552 0.07 31.76 3,652 16.94 0.02 20,367 0.07 31.06 3,363 16.51 0.02 iA– 22,352 0.09 35.88 5,343 23.91 0.03 20,146 0.09 35.14 4,756 23.61 0.03 iBBB+ 21,326 0.14 34.96 6,333 29.69 0.05 19,495 0.14 34.90 5,734 29.41 0.05 iBBB 24,193 0.23 30.70 7,949 32.86 0.07 21,891 0.23 30.95 7,238 33.06 0.07 iBBB– 21,644 0.39 31.80 8,935 41.28 0.12 20,057 0.39 31.70 8,730 43.53 0.12 iBB+ 16,021 0.64 31.47 8,087 50.47 0.19 13,892 0.64 29.84 6,752 48.60 0.18 iBB 15,628 1.08 27.32 8,859 56.69 0.29 13,993 1.08 26.46 7,647 54.65 0.27 iBB– 14,484 1.77 25.16 8,675 59.89 0.41 13,013 1.77 25.07 7,838 60.23 0.41 iB+ 9,561 2.92 19.87 5,822 60.89 0.56 8,157 2.92 19.93 4,942 60.59 0.56 iB 8,241 4.80 22.17 6,627 80.42 1.05 8,096 4.80 20.92 6,215 76.76 1.00 iB– 4,582 7.93 16.41 3,249 70.92 1.30 4,339 7.93 17.21 3,210 73.99 1.35 iCCC+ 3,151 14.60 12.08 1,861 59.07 1.63 1,382 12.99 20.65 1,420 102.72 2.69 iCCC 734 21.85 14.38 639 87.07 3.35 643 21.56 16.75 655 101.80 3.81 iCCC– 674 31.00 15.14 588 87.14 4.71 535 31.00 14.78 458 85.59 4.59
Total excluding default
235,252 1.11 29.15 81,645 34.71 0.22 214,302 0.99 28.65 73,397 34.25 0.21
Default 7,913 99.00 26.58 2,210 27.93 N/M 7,531 100.00 26.72 1,963 26.07 N/M
Total including default
243,165 4.30 29.07 83,855 34.48 0.22 221,832 4.36 28.58 75,360 33.97 0.21
N/M – Not meaningful 1 Higher average PD in % than defined for the internal rating scales iAAA and iAA+ results for Corporates exposure subject to a PD floor of 3 basis points.
The majority of these exposures are assigned to investment-grade customers. The exposures in the lowest rating class are predominantly collateralized.
EAD levels increased over the reporting period primarily driven by foreign exchange movements and to a lesser extent by growth mainly in CB&S and GTB.
Foundation IRBA Exposure with Corporates The table below shows our foundation IRBA exposures with corporates. It excludes counterparty credit risk exposures from derivatives and SFT. The exposure is distributed on our internal rating scale. The internal ratings correspond to the respective external Standard & Poor’s rating equivalents. The EAD net is presented in conjunction with risk-weighted assets calculated and the average RW. The information is shown after credit risk mitigation obtained in the form of financial, physical and other collateral as well as guarantees and credit derivatives.

Deutsche Bank Management Report 44 Interim Report as of March 31, 2015 Risk Report Securitization
EAD net for Foundation IRBA credit exposures by PD grade for corporates (excluding derivative and SFTs) in € m. (unless stated otherwise) Mar 31, 2015 Dec. 31, 2014
Internal rating EAD net Average PD in %
RWA Average RW in % EAD net
Average PD in %
RWA
Average RW in %
iAAA 0 0.00 0 0.00 0 0.00 0 0.00 iAA+ 0 0.00 0 0.00 0 0.00 0 0.00 iAA 1,857 0.03 188 10.14 1,767 0.03 180 10.20 iAA– 658 0.04 76 11.48 18 0.04 2 13.26 iA+ 0 0.00 0 0.00 0 0.00 0 0.00 iA 26 0.06 4 16.81 26 0.06 4 16.90 iA– 249 0.09 49 19.69 814 0.08 133 16.31 iBBB+ 511 0.15 122 23.92 540 0.15 121 22.32 iBBB 819 0.23 317 38.69 879 0.23 379 43.12 iBBB– 564 0.38 308 54.63 549 0.38 306 55.82 iBB+ 661 0.69 460 69.62 736 0.69 494 67.12 iBB 129 1.23 94 72.36 236 1.23 162 68.79 iBB– 61 2.06 37 60.73 35 2.06 28 78.64 iB+ 0 0.00 0 0.00 0 0.00 0 0.00 iB 24 3.78 17 71.03 32 3.78 17 54.16 iB– 28 7.26 40 144.09 28 7.26 32 113.90 iCCC+ 0 0.00 1 0.00 5 12.76 11 198.16 iCCC 57 18.00 145 252.47 62 18.00 156 250.41 iCCC– 0 0.00 0 0.00 0 0.00 0 0.00
Total excluding default 5,644 0.47 1,858 32.91 5,727 0.52 2,025 35.36
Default 52 100.00 0 0.23 165 100.00 0 0.11
Total including default 5,696 1.38 1,858 32.61 5,892 3.31 2,025 34.38
The slight decrease in RWA is mainly related to rating improvements in the Postbank Factoring portfolio.
Securitization
Overview of our Securitization Activities We engage in various business activities that use securitization structures. The main purposes are to provide investor clients with access to risk and returns related to specific portfolios of assets, to provide borrowing clients with access to funding and to manage our own credit risk exposure.
The amounts reported in the following tables provide details of our securitization exposures separately for the regulatory banking and trading book. The details of our trading book securitization positions subject to the market risk standardized approach (“MRSA”) are included in this section, while details of the trading book securitization positions covered under the comprehensive risk measure (“CRM”) are described in section “Trading Market Risk”.

Deutsche Bank Management Report 45 Interim Report as of March 31, 2015 Risk Report Securitization
Banking Book Securitization Exposure Banking Book Securitization Positions Retained or Purchased by Risk Weight Band
Mar 31, 2015 Dec 31, 2014
in € m. Exposure amount
Capital requirements IRBA
1
Capital requirements standardized approach
Exposure amount
Capital requirements IRBA
1
Capital requirements standardized approach
≤ 10 % 52,769 290 0 44,968 246 0 > 10 ≤ 20 % 3,999 35 9 4,170 37 9 > 20 ≤ 50 % 2,415 117 8 2,427 97 1 > 50 ≤ 100 % 2,440 108 33 2,313 124 53 > 100 ≤ 350 % 609 69 1 313 40 3 > 350 ≤ 650 % 156 51 0 160 51 0 > 650 < 1,250 % 408 264 0 299 202 0 1,250 % 654 289 27 424 266 29
Total securitization positions retained or purchased 63,451 1,224 78 55,074 1,064 95
1 After considering value adjustments according to Article 266 (1,2) CRR. Including capital requirements for maturity mismatch of synthetic securitizations by risk weight band defined as notional weighted average risk weight of the underlying pool.
Exposure subject to the ≤ 10 % risk weight band increased to € 52.8 billion mainly driven by new originator activities and foreign exchange rate effects. The overall banking book exposure increased by 15.2 % to € 63.5 billion, the capital requirements increased by 12.4 % to € 1.3 billion.
The largest portion for IRBA eligible banking book securitization exposures are treated according to the Supervisory Formula Approach (“SFA”). For the remaining IRBA eligible banking book exposures we use the Internal Assessment Approach (“IAA”) predominantly for our ABCP sponsor activity or the Ratings Based Ap-proach (“RBA”).
Banking Book Securitization Positions Retained or Purchased by Risk Weight Bands subject to the IRBA-Rating Based Approach (RBA)
Mar 31, 2015 Dec. 31, 2014
Exposure amount Capital requirements, IRBA-RBA
1 Exposure amount Capital requirements, IRBA-RBA
1
in € m. Securitization Re- Securitization Securitization
2 Re- Securitization Securitization
Re- Securitization Securitization
2 Re- Securitization
≤ 10 % 5,616 0 35 0 5,295 0 33 0 > 10 ≤ 20 % 2,316 0 24 0 2,056 0 21 0 > 20 ≤ 50 % 754 1,084 72 35 854 1,064 50 34 > 50 ≤ 100 % 1,790 27 99 1 1,487 29 120 1 > 100 ≤ 350 % 53 36 5 3 78 7 7 1 > 350 ≤ 650 % 53 19 17 6 58 0 19 0 > 650 < 1,250 % 262 17 144 11 154 16 85 9 1,250 % 332 294 212 76 342 46 244 19
Total securitization positions retained or purchased 11,176 1,477 608 132 10,324 1,162 579 64 1 After considering value adjustments according to Article 266 (1,2) CRR. 2 Including capital requirements for maturity mismatch of synthetic securitizations by risk weight band defined as notional weighted average risk weight of the underlying pool.
Exposures subject to the IRBA-RBA increased for securitization by € 1.2 billion mainly driven by foreign ex-change rate changes.

Deutsche Bank Management Report 46 Interim Report as of March 31, 2015 Risk Report Securitization
Banking Book Securitization Positions Retained or Purchased by Risk Weight Band subject to the IRBA-Internal Assess-ment Approach (IAA)
Mar 31, 2015 Dec. 31, 2014
Exposure amount Capital requirements, IRBA-IAA
1 Exposure amount Capital requirements, IRBA-IAA
1
in € m. Securitization Re- Securitization Securitization
Re- Securitization Securitization
Re- Securitization Securitization
Re- Securitization
≤ 10 % 809 0 5 0 996 0 7 0 > 10 ≤ 20 % 738 0 7 0 1,160 0 11 0 > 20 ≤ 50 % 90 34 3 1 245 33 5 1 > 50 ≤ 100 % 99 0 5 0 47 0 3 0 > 100 ≤ 350 % 117 0 25 0 166 0 28 0 > 350 ≤ 650 % 0 0 0 0 0 0 0 0 > 650 < 1,250 % 0 0 0 0 0 0 0 0 1,250 % 0 0 0 0 0 0 0 0
Total securitization positions retained or purchased 1,853 34 45 1 2,614 33 53 1 1 After considering value adjustments according to Article 266 (1,2) CRR.
The exposure reduction subject to the IRBA-Internal Assessment Approach (IAA) resulted primarily from a management decision to reduce the securitization book funded through ABCP conduits. The overall exposure decreased by 29 % to € 1.9 billion in the first quarter 2015, compared to € 2.6 billion as of December 31, 2014.
Banking Book Securitization Positions Retained or Purchased by Risk Weight Band subject to the IRBA-Supervisory For-mula Approach (SFA)
Mar 31, 2015 Dec. 31, 2014
Exposure amount Capital requirements, IRBA-SFA
1 Exposure amount Capital requirements, IRBA-SFA
1
in € m. Securitization Re- Securitization Securitization
Re- Securitization Securitization
Re- Securitization Securitization
Re- Securitization
≤ 10 % 46,344 0 249 0 38,676 0 206 0 > 10 ≤ 20 % 303 56 3 1 317 49 3 1 > 20 ≤ 50 % 246 0 7 0 217 0 7 0 > 50 ≤ 100 % 45 0 3 0 5 0 0 0 > 100 ≤ 350 % 394 0 36 0 36 0 5 0 > 350 ≤ 650 % 85 0 29 0 102 0 32 0 > 650 < 1,250 % 129 0 109 0 129 0 108 0 1,250 % 1 0 1 0 7 0 3 0
Total securitization positions retained or purchased 47,547 56 438 1 39,487 49 365 1 1 After considering value adjustments according to Article 266 (1,2) CRR.
Banking Book exposure subject to the IRBA-Supervisory Formula Approach (SFA) overall increased to € 47.6 billion in the first quarter 2015. This increase is mainly driven by Originator activities, securitization posi-tions which funding source changed from ABCP conduits formerly calculated under the IRBA-Internal Assess-ment Approach (IAA) and foreign exchange rate changes.
The Credit Risk Standardized Approach (“CRSA”) is used for securitization positions where the underlying portfolio predominantly concerns credit risk exposures, which would qualify for application of the CRSA if these exposures would be directly held by us.

Deutsche Bank Management Report 47 Interim Report as of March 31, 2015 Risk Report Securitization
Banking Book Securitization Positions Retained or Purchased by Risk Weight Band subject to the Credit Risk Standardized Approach (CRSA)
Mar 31, 2015 Dec. 31, 2014
Exposure amount Capital requirements, SA Exposure amount Capital requirements, SA
in € m. Securitization Re- Securitization Securitization
Re- Securitization Securitization
Re- Securitization Securitization
Re- Securitization
≤ 10 % 0 0 0 0 0 0 0 0 > 10 ≤ 20 % 585 0 9 0 588 0 9 0 > 20 ≤ 50 % 208 0 8 0 14 0 1 0 > 50 ≤ 100 % 480 0 33 0 745 0 53 0 > 100 ≤ 350 % 9 0 1 0 27 0 3 0 > 350 ≤ 650 % 0 0 0 0 0 0 0 0 > 650 < 1,250 % 0 0 0 0 0 0 0 0 1,250 % 20 7 20 7 23 6 23 6
Total securitization positions retained or purchased 1,302 7 71 7 1,398 6 89 6
Trading Book Securitization Exposure For trading book securitization positions not covered under the CRM, the capital requirement for specific mar-ket risk is calculated based on the MRSA. The MRSA risk weight calculation for trading book securitization positions is generally based on the same methodologies which apply to banking book securitization positions.
Trading Book Securitization Positions Retained or Purchased by Risk Weight Band subject to the Market Risk Standardized Approach (“MRSA”)
Mar 31, 2015 Dec. 31, 2014
Exposure amount Capital requirements, MRSA Exposure amount Capital requirements, MRSA
in € m. Securitization Re- Securitization Securitization
Re- Securitization Securitization
Re- Securitization Securitization
Re- Securitization
≤ 10 % 11,335 0 21 0 4,540 0 26 0 > 10 ≤ 20 % 5,924 0 57 0 4,568 0 51 0 > 20 ≤ 50 % 1,251 314 28 9 1,289 249 29 8 > 50 ≤ 100 % 869 89 44 5 582 100 35 6 > 100 ≤ 350 % 2,584 103 63 16 533 96 73 14 > 350 ≤ 650 % 650 56 63 15 174 36 63 13 > 650 < 1,250 % 607 18 50 8 81 18 45 11 1,250 % 4,081 288 1,246 284 1,008 302 1,008 302
Total securitization positions retained or purchased 27,300 869 1,572 336 12,774 801 1,329 353
The increase in trading book securitization positions since the last quarter was mainly driven by a regulatory change which results in a consideration of the sum of net long and net short capital charges in comparison to the maximum amount (Article 337 (4) CRR). Although the considered exposure more than doubled the capital requirements increased by 13.4 % only. On the one hand side this was due to low risk weighted positions (€ 6.8 billion increase in the ≤ 10 % risk weight band) and on the other hand due to synthetic securitization positions subject to an own funds requirements cap according to Article 335 CRR.

Deutsche Bank Management Report 48 Interim Report as of March 31, 2015 Risk Report Market Risk
Market Risk
Market Risk of Trading Units excluding Postbank The table below presents the value-at-risk metrics calculated with a 99 % confidence level and a one-day holding period for our trading units.
Value-at-Risk of our Trading Units by Risk Type
Total Diversification effect
Interest rate risk
Credit spread risk
Equity price risk
Foreign exchange risk
1 Commodity price risk
in € m. 2015 2014 2015 2014 2015 2014 2015 2014 2015 2014 2015 2014 2015 2014
Average
2 49.6 51.6 (40.7) (34.9) 20.4 25.1 35.6 31.2 15.7 14.8 17.6 13.2 0.9 2.2 Maximum
2 65.6 71.4 (46.6) (61.9) 22.7 42.8 40.3 38.9 23.2 24.6 25.0 21.2 2.0 10.2 Minimum
2 39.8 35.4 (31.8) (24.4) 18.2 15.7 29.6 25.9 9.2 9.9 11.4 6.9 0.5 0.7 Period-end
3 52.7 49.0 (37.5) (36.0) 21.5 18.1 32.8 29.6 18.4 15.5 16.7 20.5 0.8 1.3 1 Includes value-at-risk from gold and other precious metal positions. 2 Amounts show the bands within which the values fluctuated during the period January 1 to March 31, 2015 and the full year 2014, respectively. 3 Amounts for 2015 as of March 31, 2015 and for 2014 as of December 31, 2014.
The average value-at-risk for the first three months of 2015 decreased by € 2.0 million to € 49.6 million com-pared with the average for the full year 2014. Average interest rate value-at-risk decreased and there was an increase in the diversification effect following changes to the composition of the portfolio. This was partly offset by increases in average foreign exchange and credit spread value-at-risk due to increased market volatility. Additionally foreign exchange value at risk also increased due to an increase in U.S. dollar exposure on aver-age compared to the full year 2014.
During the first three months of 2015 our trading units achieved a positive actual income for 95 % of the trading days compared with 95 % in the full year 2014.
Regulatory Trading Market Risk Measures In trading market risk the comprehensive risk measure and market risk standardized approach were partially impacted by the introduction of the new CRR/CRD 4 framework which is detailed in the respective sections.
Stressed Value-at-Risk The following table shows the stressed value-at-risk (with a 99 % confidence level and a one-day holding period) for our trading units.
Stressed Value-at-Risk by Risk Type
Total Diversification effect
Interest rate risk
Credit spread risk
Equity price risk
Foreign exchange risk
1 Commodity price risk
in € m. 2015 2014 2015 2014 2015 2014 2015 2014 2015 2014 2015 2014 2015 2014
Average
2 108.6 109.6 (147.7) (125.4) 70.7 64.4 132.2 124.0 14.0 11.5 38.0 29.7 1.4 5.4 Maximum
2 135.1 161.1 (186.7) (168.0) 84.2 85.9 154.5 142.8 47.8 42.6 59.8 70.3 3.1 16.7 Minimum
2 82.4 81.6 (118.3) (102.3) 54.1 48.8 104.8 100.7 0.1 0.0 21.4 13.7 0.7 1.4 Period-end
3 109.7 120.7 (128.1) (139.3) 70.4 52.3 108.6 140.8 21.2 18.8 36.5 46.2 1.2 1.8 1 Includes value-at-risk from gold and other precious metal positions. 2 Amounts show the bands within which the values fluctuated during the period January 1 to March 31, 2015 and the full year 2014, respectively. 3 Amounts for 2015 as of March 31, 2015 and for 2014 as of December 31, 2014.

Deutsche Bank Management Report 49 Interim Report as of March 31, 2015 Risk Report Market Risk
The average stressed value-at-risk for the first three months of 2015 was € 108.6 million and decreased by € 1.0 million compared with the full year 2014. The reduction stemmed from an improvement in diversification due to changes in the composition of the portfolio, partly offset by increases coming from across asset classes. Most notably foreign exchange stressed value-at-risk has increased due to an increase in long U.S. dollar foreign exchange exposure, while credit spread stressed value-at-risk increased following an increase in long credit spread exposure on average over the first three months of 2015 compared to the full year 2014. The notable reduction in the period end stressed value-at-risk for credit spread risk was driven by an improvement to the correlations approach used to aggregate certain components within the credit spread value-at-risk
Incremental Risk Charge For regulatory reporting purposes, the incremental risk charge for the respective reporting dates represents the higher of the spot value at the reporting dates and the value of the preceding 12-week average calculation. The incremental risk charge presented for the reporting dates below is the spot value and the average, maximum and minimum values calculated for the 12-week period preceding these reporting dates.
Incremental Risk Charge of Trading Units (with a 99.9 % confidence level and one-year capital horizon)3
Total Fixed Income & Currencies
Structured Finance
Emerging Markets - Debt NCOU Other
in € m. 2015 2014 2015 2014 2015 2014 2015 2014 2015 2014 2015 2014
Average
1 1,391.4 811.9 920.1 532.8 269.9 152.2 241.3 164.1 (3.4) (3.6) (36.5) (33.5) Maximum
1 1,542.2 1,065.4 1,084.9 719.3 385.5 189.3 457.7 220.2 29.2 39.4 19.5 64.7 Minimum
1 1,131.4 647.9 732.3 381.8 188.7 106.3 181.2 119.5 (32.7) (25.8) (145.4) (88.0) Period-end
2 1,303.6 1,037.8 864.3 603.4 239.6 159.8 274.0 170.5 29.2 39.4 (103.5) 64.7
1 Amounts show the bands within which the values fluctuated during the 12-weeks preceding March 31, 2015 and December 31, 2014, respectively. 2 Amounts for 2015 as of March 31, 2015 and for 2014 as of December 31, 2014. 3 Business line breakdowns have been updated for 2015 reporting to better reflect the current business structure.
The incremental risk charge as at the end of the first three months of 2015 was € 1.3 billion and increased by € 266 million (26 %) compared with year end 2014. The 12-week average incremental risk charge for the first three months of 2015 was € 1.4 billion and thus € 579 million (71 %) higher compared with the average for the 12-week period ended December 31, 2014. The increase was driven by an increase in concentrated single name exposures primarily on sovereign entities, which particularly impacts the incremental risk charge.
Comprehensive Risk Measure For regulatory reporting purposes, the comprehensive risk measure for the respective reporting dates repre-sents the highest of the spot value at the reporting dates, their preceding 12-week average calculation, and the floor, where the floor is equal to 8 % of the equivalent capital charge under the securitization framework.
Comprehensive Risk Measure of Trading Units (with a 99.9 % confidence level and one-year capital horizon) in € m. 2015 2014
Average
1 221.9 246.9 Maximum
1 242.2 257.5 Minimum
1 213.1 223.0 Period-end
2 199.0 222.0 1 Regulatory Comprehensive Risk Measure calculated for the 12-week period ending March 31, 2015 and December 31, 2014. 2 Spot value of internal model Comprehensive Risk Measure at period end.

Deutsche Bank Management Report 50 Interim Report as of March 31, 2015 Risk Report Operational Risk
The comprehensive risk measure as at the end of the first three months of 2015 was € 199 million and decreased by € 23 million (10 %) compared with year end 2014. The 12-week average of our comprehensive risk measure for the first three months of 2015 was € 222 million and thus € 25 million (10 %) lower compared with the average for the 12-week period ended December 31, 2014. The reduction was due to continued de-risking on this portfolio.
Market Risk Standardized Approach As of March 31, 2015, the securitization positions, for which the specific interest rate risk is calculated using the market risk standardized approach, generated capital requirements of € 1,909 million corresponding to risk weighted-assets of € 23.9 billion. As of December 31, 2014 these positions generated capital requirements of € 1,682 million corresponding to risk weighted-assets of € 21.0 billion. The increase is primarily due to the end of the transitional period granted by Article 337 (4) CRR as the calculation is now based on the sum of the weighted net long positions and the sum of the weighted net short positions rather than the larger of the two sums. Additionally there has been an increase from foreign exchange movement with some offset coming from de-risking.
For nth-to-default credit default swaps the capital requirement increased to € 17 million corresponding to risk weighted-assets of € 216 million compared with € 1 million and € 19 million as of December 31, 2014 caused by the aforementioned regulatory change.
Additionally, the capital requirement for investment funds under the market risk standardized approach was € 89 million corresponding to risk weighted-assets of € 1,116 million as of March 31, 2015, compared with € 91 million and € 1,139 million as of December 31, 2014.
The capital requirement for longevity risk under the market risk standardized approach was € 32 million corre-sponding to risk weighted-assets of € 398 million as of March 31 2015, compared with € 26 million and € 326 million as of December 31, 2014.
Market Risk of Trading Book at Postbank The value-at-risk of Postbank’s trading book calculated with a 99 % confidence level and a one-day holding period amounted to zero as of March 31, 2015 and at year end 2014. Postbank’s current trading strategy does not allow any new trading activities with regard to the trading book. Therefore, Postbank’s trading book did not contain any positions as of March 31, 2015 and at year-end 2014. Nevertheless, Postbank will remain classi-fied as a trading book institution.
Operational Risk
In the first three months of 2015 our operational risk losses continued to be driven by legal operational risk losses including legal provisions. For a description of our current legal and regulatory proceedings, please see Section “Other Contingencies” of this Interim Report. Our non-legal operational risk losses continued to be lower than for the first three months of 2014. The outlook for the rest of year remains cautious, due to the legal and regulatory environment that we believe will continue to affect our business. Our operational risk manage-ment fosters a forward looking risk management with regard to monitoring of potential profits and losses, fo-cusing on trend analyses based upon available losses and key risk indicator data.

Deutsche Bank Management Report 51 Interim Report as of March 31, 2015 Risk Report Operational Risk
Economic Capital Usage for Operational Risk by Business Division
2015 increase (decrease) from 2014
in € m. (unless stated otherwise) Mar 31, 2015 Dec 31, 2014 in € m. in %
Corporate Banking & Securities 5,746 3,569 2,177 61 Private & Business Clients 543 1,088 (545) (50) Global Transaction Banking 604 150 454 303 Deutsche Asset & Wealth Management 1,173 722 451 62 Non-Core Operations Unit 399 2,070 (1,671) (81)
Total economic capital usage for operational risk 8,464 7,598 866 11
The economic capital usage for operational risk as of March 31, 2015 was € 8.5 billion, € 0.9 billion or 11 % higher compared to year-end 2014. This is mainly driven by external data, primarily US related settle-ments, used in our capital model and reflects an increased operational risk loss profile in the industry. Besides the overall increase of the economic capital, the quarter over quarter changes for the business divisions are due to a change in the allocation methodology. In particular the capital allocation methodology used for the Non-Core Operations Unit (NCOU) was adjusted to be based on assets. The new allocation replaces the more complex but less precise former allocation and as we believe better reflects the decreasing residual risk in a wind-down business.
Operational Risk Framework Development The AMA (advanced measurement approach) model is subject to continuous validation and enhancement, as we attempt to adequately reflect our risk profile. As part of the continuous enhancement and validation of our model we submitted model changes to BaFin and are awaiting approval from the joint supervisory team (BaFin and ECB). These model changes include an improved validation and recalibration methodology for insurance parameters, changes to the modeling of the loss frequency as well as an enhanced scoring mechanism for the self assessment results in our AMA model.
Further, we have submitted an additional model change request to BaFin to replace the € 1 billion economic capital safety margin, which we have continuously applied since its implementation in 2011. This model change, which adds increased forward looking aspects to the AMA model, will result in higher economic capital even after we remove the safety margin. This change will make our model more risk sensitive by including reasona-bly possible litigation losses in our “Relevant Loss Data” set. Reasonably possible litigation losses may result from ongoing and new legal matters which are reviewed quarterly and are based on the judgment provided by our Legal Department.
While our dialogue with the joint supervisory team on these model enhancements is on-going, management has decided to recognize the impact of these model changes in the second quarter 2014 wherever they will lead to an increase in the capital requirement over the models that have previously been approved by BaFin.
In the first quarter 2015 the joint supervisory team allowed us to use an enhanced divisional capital allocation methodology featuring division specific severity distributions for the Core Divisions and improved allocation to the Non-Core Operations Unit. We believe the major benefits from using this methodology are an improved focus on divisional standalone risk profiles and a significant reduction of cross-divisional effects. In addition, we have transitioned from using a complex allocation not fully reflecting the winding down of the NCOU business to a new NCOU allocation based on assets. Moreover the allocation of the € 1 billion economic capital safety margin moving RWA from Core to non-Core is no longer considered appropriate and has been removed. The changes have already been implemented and are reflected in the results of the first quarter 2015.

Deutsche Bank Management Report 52 Interim Report as of March 31, 2015 Risk Report Liquidity Risk
Liquidity Risk
Composition of our external funding sources in euro billion and as a percentage of our total external funding sources in € bn. (unless stated otherwise) Mar 31, 2015 Dec 31, 2014
Capital Markets and Equity 227 23 % 214 23 % Retail 308 31 % 301 33 % Transaction Banking 207 21 % 184 20 % Other Customers
1 77 8 % 74 8 % Unsecured Wholesale 62 6 % 55 6 % Secured Funding and Shorts 103 10 % 81 9 % Financing Vehicles
2 11 1 % 12 1 %
Total external funding 996 100 % 919 100 % 1 Other Customers includes fiduciary, self-funding structures (e.g. X-markets) and margin/prime brokerage cash balances (shown on a net basis). 2 Includes ABCP conduits. Reference: To reconcile to the total balance sheet, add derivatives & settlement balances € 803 billion (€ 660 billion), netting effect for margin & prime brokerage cash balances (shown on a net basis) € 98 billion (€ 75 billion), and other non-funding liabilities € 59 billion (€ 54 billion) for March 31, 2015, and December 31, 2014, respectively.
The increase of € 23 billion in transaction banking and of € 22 billion in secured funding and shorts reflect in-creasing business activity in comparison to low year-end levels. The higher amount of capital markets and equity by € 14 billion during the first quarter of 2015 reflects higher funding activities and current net income. Increased deposits from AWM clients were reflected in the € 8 billion increase in the retail business. Foreign exchange effects contributed to the increase across most funding sources.
During the first quarter of 2015, we raised € 16.9 billion out of a total 2015 funding plan of up to € 30-35 billion equating to a completion rate of 52 %, 27 percentage points ahead of the pro-rata equivalent (percentages refer to the midpoint of the funding plan). The average spread during the first three months of the year 2015 over the relevant floating index (e.g. Libor) was 49 bps, with an average tenor of 5.7 years. The most signifi-cant transactions over this period were a € 1.25 billion Tier 2 benchmark issued in February 2015 and a US $ 1.5 billion Tier 2 benchmark issued in March 2015 both with a tenor of 10 years. For the remainder of the year we intend to source the rest of our requirements through a variety of channels, including issuance tar-geted at retail investors, private placements with institutional investors and further public benchmark issuances.
Regular stress test analyses aim to ensure that we always hold sufficient cash and liquid assets to close a potential funding gap which could open under a combined scenario comprising idiosyncratic and market re-lated stress. For this purpose we hold liquidity reserves which comprise available cash and cash equivalents, highly liquid securities (includes government, government guaranteed and agency securities) as well as other unencumbered central bank eligible assets. The volume of the liquidity reserves is a function of the expected stress result, both at an aggregate level as well as at an individual currency level. To the extent we receive incremental short-term wholesale liabilities which attract a high stress roll-off, we largely keep the proceeds of such liabilities in cash or highly liquid securities as a stress mitigant. As such, the total volume of liquidity reserves will fluctuate according to the level of short-term wholesale liabilities held, although this has no mate-rial impact on our overall liquidity position under stress. Liquidity reserves include only assets that are freely transferable within the group, or can be applied against local entity stress outflows. These reserves are held across major currencies and key locations in which the bank is active. The vast majority of our liquidity reserves are centrally held at our parent level or at our foreign branches. Size and composition are subject to regular senior management review. The haircuts applied reflect our assumption of the actual liquidity value that could be obtained, primarily through secured funding, and take into account the experience observed in secured funding markets at times of stress.

Deutsche Bank Management Report 53 Interim Report as of March 31, 2015 Risk Report Capital Management
Composition of our liquidity reserves by parent company (including branches) and subsidiaries Mar 31, 2015 Dec 31, 2014
in € bn. Carrying Value Liquidity Value Carrying Value Liquidity Value
Available cash and cash equivalents (held primarily at central banks) 80 80 65 65 Parent (incl. foreign branches) 70 70 54 54 Subsidiaries 10 10 11 11
Highly liquid securities (includes government, government guaranteed and agency securities) 106 99 103 96
Parent (incl. foreign branches) 80 75 81 75 Subsidiaries 26 24 23 20
Other unencumbered central bank eligible securities 17 12 16 11 Parent (incl. foreign branches) 15 11 14 10 Subsidiaries 2 1 2 1
Total liquidity reserves 203 190 184 171 Parent (incl. foreign branches) 164 155 149 139 Subsidiaries 38 35 35 32
Our liquidity reserves increased by € 19 billion or 10 % during the first three months of 2015 in comparison to year-end 2014.
Capital Management
The 2014 Annual General Meeting granted our Management Board the authority to buy back up to 101.9 million shares before the end of April 2019. Thereof 51.0 million shares can be purchased by using derivatives. These authorizations replaced the authorizations of the 2013 Annual General Meeting. We have received approval from the BaFin for the execution of these authorizations as required under new CRR/CRD 4 rules. During the period from the 2014 Annual General Meeting until March 31, 2015, we purchased 25.6 million shares. The shares purchased were used for equity compensation purposes in the same period so that the number of shares held in Treasury from buybacks was 0.2 million as of March 31, 2015.
Since the 2014 Annual General meeting, the authorized capital available to the Management Board is € 257 million (100 million shares). The conditional capital now stands at € 486 million (190 million shares). Moreover, the 2014 Annual General meeting authorized the issuance of participatory notes for the purpose of Additional Tier 1 capital.

Deutsche Bank Management Report 54 Interim Report as of March 31, 2015 Risk Report Regulatory Capital
Our legacy Hybrid Tier 1 capital instruments (substantially all noncumulative trust preferred securities) are no longer fully recognized under fully loaded CRR/CRD 4 rules mainly because they have no write-down or equity conversion feature. However, they are to a large extent recognized as Additional Tier 1 capital under CRR/CRD 4 transitional provisions, and can still be partially recognized as Tier 2 capital under the fully loaded CRR/CRD 4 rules. During the transitional phase-out period the maximum recognizable amount of Additional Tier 1 instruments from Basel 2.5 compliant issuances as of December 31, 2012 will be reduced at the begin-ning of each financial year by 10 % or € 1.3 billion, through 2022. For March 31, 2015, this resulted in eligible Additional Tier 1 instruments of € 12.1 billion (i.e. € 4.7 billion newly issued AT1 Notes plus € 7.4 billion of leg-acy Hybrid Tier 1 instruments recognizable during the transition period). Seven Hybrid Tier 1 capital instru-ments with a notional of € 4.0 billion and an eligible equivalent amount of € 3.7 billion have been called since year-end 2014. € 6.0 billion of the legacy Hybrid Tier 1 instruments can still be recognized as Tier 2 capital under the fully loaded CRR/CRD 4 rules.
On February 17, 2015, we issued new fixed rate subordinated Tier 2 notes with an aggregate amount of € 1.25 billion. The notes pay a coupon of 2.75 %, have a denomination of € 1,000 and are due February 17, 2025. They were issued in transactions outside of the United States not subject to the registration requirements of the Securities Act of 1933, as amended, and were not offered or sold in the United States.
The total of our Tier 2 capital instruments as of March 31, 2015 recognized during the transition period under CRR/CRD 4 was € 5.6 billion. As of March 31 2015, there are no further legacy Hybrid Tier 1 instruments that are counted as Tier 2 capital. The gross notional value of the Tier 2 capital instruments was € 7.5 billion. No Tier 2 capital instruments have been called since year-end 2014.
Regulatory Capital
Starting January 1, 2014, the calculation of our regulatory capital incorporates the capital requirements follow-ing the “Regulation (EU) No 575/2013 on prudential requirements for credit institutions and investment firms” (Capital Requirements Regulation or “CRR”), and the “Directive 2013/36/EU on access to the activity of credit institutions and the prudential supervision of credit institutions and investment firms” (Capital Requirements Directive 4 or “CRD 4”) as implemented into German law. The information in this section as well as in the sec-tion “Development of risk-weighted Assets” is based on the regulatory principles of consolidation.
Under the CRR/CRD 4 transitional rules, capital instruments no longer eligible are phased-out while the new rules on regulatory adjustments are phased-in. These provisions are allowed in order to ease the transition for banks to the fully loaded capital rules. The fully loaded CRR/CRD 4 metrics do not take these transitional rules into account, (i.e. all capital instruments no longer eligible are excluded and all new regulatory adjustments are applied). Therefore when referring to the results according to the transitional rules we use the term “CRR/CRD 4”. When referring to our results according to the full application of the final envisaged framework (and thus without consideration of applicable transitional methodology), we use the term “CRR/CRD 4 fully loaded”. At the same time, CRR/CRD 4 left in place unchanged transitional rules that had been adopted in earlier capital adequacy frameworks through Basel 2.5 regarding the risk weighting of certain categories of assets, e.g the rule permitting the grandfathering of equity investments at a risk-weight of 100 %. In this case, our CRR/CRD 4 methodology assumes that the impact of the expiration of these transitional rules will be miti-gated through sales of the underlying assets or other measures prior to the expiration of the grandfathering provisions at the end of 2017.

Deutsche Bank Management Report 55 Interim Report as of March 31, 2015 Risk Report Regulatory Capital
Minimum capital requirements and additional capital buffers The minimum capital requirements of CET 1 capital applicable to the Group increased from 4 % of risk-weighted assets (RWA) in 2014 to 4.5 % of RWA from 2015 onwards.
In March 2015, Deutsche Bank was designated as a global systemically important institution (G-SII) by the German Federal Financial Supervisory Authority (BaFin) in agreement with the Deutsche Bundesbank resulting in an additional requirement of 2 % CET 1 capital of RWA fully effective from 2019 onwards. This is in line with the Financial Stability Board (FSB) assessment of systemic importance based on the indicators as published in 2014. The additional buffer requirement will be phased in starting 2016.
In addition, pursuant to the Supervisory Review and Evaluation Process (SREP), the ECB may impose capital requirements on individual banks which are more stringent than statutory requirements. On February 20, 2015, the ECB notified us that we are required to maintain a CET 1 ratio of at least 10 % (on a phase-in basis) at all times.
Further information about minimum capital requirements and additional capital buffers applicable to us can be found in our Financial Report 2014.
Overview of Regulatory Capital, RWA and Capital Ratios Mar 31, 2015 Dec 31, 2014
in € m. CRR/CRD 4 fully-loaded CRR/CRD 4
CRR/CRD 4 fully-loaded
CRR/CRD 4
Common Equity Tier 1 capital before regulatory adjustments 69,585 69,944 65,750 66,175 Total regulatory adjustments to Common Equity Tier 1 (CET 1) capital (21,742) (10,216) (19,674) (6,072) Common Equity Tier 1 (CET 1) capital 47,843 59,728 46,076 60,103
Additional Tier 1 (AT1) capital before regulatory adjustments 4,676 12,071 4,676 14,696 Total regulatory adjustments to Additional Tier 1 (AT1) capital (11) (8,816) (57) (10,902) Additional Tier 1 (AT1) capital 4,665 3,255 4,619 3,794
Tier 1 capital (T1 = CET 1 + AT1) 52,507 62,983 50,695 63,898
Tier 2 (T2) capital before regulatory adjustments 11,178 5,675 12,412 4,891 Total regulatory adjustments to Tier 2 (T2) capital (27) (491) (36) (496) Tier 2 (T2) capital 11,151 5,184 12,376 4,395
Total capital (TC = T1 + T2) 63,658 68,167 63,072 68,293
Total risk-weighted assets 431,390 432,142 393,969 396,648
Capital ratios Common Equity Tier 1 capital ratio (as a percentage of risk-weighted assets) 11.1 13.8 11.7 15.2 Tier 1 capital ratio (as a percentage of risk-weighted assets) 12.2 14.6 12.9 16.1 Total capital ratio (as a percentage of risk-weighted assets) 14.8 15.8 16.0 17.2

Deutsche Bank Management Report 56 Interim Report as of March 31, 2015 Risk Report Regulatory Capital
Reconciliation of Consolidated Balance Sheet according to IFRS to regulatory Balance Sheet (unaudited) Mar 31, 2015 Dec. 31, 2014
in € m. Financial Balance Sheet
Decon- solidation/ Consolidation of entities
Regulatory Balance Sheet
Financial Balance Sheet
Decon- solidation/ Consolidation of entities
Regulatory Balance Sheet
Refe- rences
1
Assets: Cash and due from banks 21,645 (140) 21,504 20,055 (246) 19,809 Interest-earning deposits with banks 70,659 (1,737) 68,923 63,518 (1,358) 62,160 Central bank funds sold and securities purchased under resale agreements 23,393 0 23,393 17,796 0 17,796 Securities borrowed 34,515 (7) 34,508 25,834 (11) 25,823 Financial assets at fair value through profit or loss
Trading assets 212,185 (6,624) 205,561 195,681 (7,846) 187,835 Positive market values from derivative financial instruments 746,084 495 746,579 629,958 421 630,379 Financial assets designated at fair value through profit or loss 125,810 (14,118) 111,691 117,285 (12,490) 104,795
Total financial assets at fair value through profit or loss 1,084,079 (20,248) 1,063,831 942,924 (19,915) 923,009 Financial assets available for sale 72,336 146 72,482 64,297 434 64,731 Equity method investments 4,916 (247) 4,669 4,143 (218) 3,925 h
thereof: Goodwill 486 0 486 430 0 430 eLoans 428,548 (2,860) 425,687 405,612 (3,348) 402,264 Property and equipment 2,914 (192) 2,722 2,909 (193) 2,716 Goodwill and other intangible assets 15,802 (1,770) 14,032 14,951 (1,817) 13,134 eOther assets 187,558 (1,383) 186,176 137,980 (1,027) 136,953
thereof: Defined benefit pension fund assets 1,065 0 1,065 961 0 961 gIncome tax assets
2 9,100 (67) 9,033 8,684 (131) 8,553 f
Total assets 1,955,465 (28,504) 1,926,961 1,708,703 (27,832) 1,680,872
Liabilities and equity: Deposits 572,921 5,648 578,569 532,931 4,823 537,754 Central bank funds purchased and securities sold under repurchase agreements 17,078 0 17,078 10,887 0 10,887 Securities loaned 2,816 (7) 2,809 2,339 (10) 2,329 Financial liabilities at fair value through profit or loss
Trading liabilities 54,231 (134) 54,097 41,843 (200) 41,643 Negative market values from derivative financial instruments 724,120 886 725,006 610,202 603 610,805 Financial liabilities designated at fair value through profit or loss 41,340 (2,530) 38,810 37,131 (2,315) 34,816 Investment contract liabilities 9,654 (9,654) 0 8,523 (8,523) 0
Total financial liabilities at fair value through profit or loss 829,345 (11,432) 817,913 697,699 (10,435) 687,264 Other short-term borrowings 39,260 (6,839) 32,421 42,931 (8,780) 34,151 Other liabilities 238,723 (13,690) 225,033 183,823 (12,628) 171,195 Provisions 8,824 (85) 8,738 6,677 (81) 6,596 Income tax liabilities
2 3,068 (499) 2,569 2,783 (483) 2,300 Long-term debt 157,519 (206) 157,314 144,837 772 145,609
thereof: Subordinated long-term debt
3 7,226 0 7,226 6,392 0 6,392 j, kTrust preferred securities
3 7,979 394 8,373 10,573 516 11,089 j, kObligation to purchase common shares 0 0 0 0 0 0 Total liabilities 1,877,533 (26,717) 1,850,816 1,635,481 (26,308) 1,609,173
Common shares, no par value, nominal value of € 2.56 3,531 0 3,531 3,531 0 3,531 aAdditional paid-in capital 33,607 (4) 33,603 33,626 (5) 33,621 aRetained earnings 29,863 (1,234) 28,629 29,279 (1,107) 28,171 bCommon shares in treasury, at cost (12) 0 (12) (8) 0 (8) aEquity classified as obligation to purchase common shares 0 0 0 0 0 0 aAccumulated other comprehensive income, net of tax 5,989 (430) 5,560 1,923 (306) 1,617 cTotal shareholders’ equity 72,979 (1,668) 71,311 68,351 (1,419) 66,932
Additional equity components 4,665 0 4,665 4,619 0 4,619 iNoncontrolling interests 288 (119) 169 253 (105) 148 d
Total equity 77,932 (1,787) 76,145 73,223 (1,523) 71,699
Total liabilities and equity 1,955,465 (28,504) 1,926,961 1,708,703 (27,832) 1,680,872 1 References provide the mapping of regulatory balance sheet items used to calculate regulatory capital as reflected in the column “References” in “Transitional template for Regulatory
Capital, RWA and Capital Ratios (unaudited)”. Where applicable, more detailed information are provided in the respective reference footnote section. 2 Income tax assets and income tax liabilities comprise both deferred and current taxes. 3 Eligible Additional Tier 1 and Tier 2 instruments are reflected in these balance sheet positions with their values according to IFRS.

Deutsche Bank Management Report 57 Interim Report as of March 31, 2015 Risk Report Regulatory Capital
Transitional template for Regulatory Capital, RWA and Capital Ratios (unaudited) Mar 31, 2015 Dec 31, 2014
in € m. CRR/CRD 4 fully-loaded CRR/CRD 4
CRR/CRD 4 fully-loaded
CRR/CRD 4 Refe- rences
1
Common Equity Tier 1 (CET 1) capital: instruments and reserves Capital instruments and the related share premium accounts 37,122 37,122 37,144 37,144 a
Thereof: Ordinary shares
2 37,122 37,122 37,144 37,144 aRetained earnings 28,086 28,086 26,509 26,509 bAccumulated other comprehensive income (loss), net of tax 5,560 5,817 1,617 1,923 cFunds for general banking risk 0 0 0 0 Amount of qualifying items referred to in Art. 484 (3) CRR and the related share premium accounts subject to phase out from CET 1 N/M 0 N/M 0 Public sector capital injections grandfathered until January 1, 2018 N/M N/M N/M N/M Noncontrolling Interests (amount allowed in consolidated CET 1) 0 102 0 118 dIndependently reviewed interim profits net of any foreseeable charge or dividend
3 (1,182) (1,182) 481 481 b
Common Equity Tier 1 capital before regulatory adjustments 69,585 69,944 65,750 66,175
Common Equity Tier 1 capital: regulatory adjustments
Additional value adjustments (negative amount)
4 0 0 0 0 Intangible assets (net of related tax liabilities) (negative amount) (13,900) (5,560) (12,979) (2,596) eDeferred tax assets that rely on future profitability excluding those arising from temporary diffe- rences (net of related tax liabilities where the conditions in Art. 38 (3) CRR are met) (negative amount) (2,854) (1,142) (2,620) (524) fFair value reserves related to gains or losses on cash flow hedges (188) (188) (181) (181) Negative amounts resulting from the calculation of expected loss amounts (743) (304) (712) (147) Any increase in equity that results from securitized assets (negative amount) (49) (49) 0 0 Gains or losses on liabilities designated at fair value resulting from changes in own credit standing
5 (494) (245) (544) (210) Defined benefit pension fund assets (negative amount) (1,065) (426) (961) (192) gDirect, indirect and synthetic holdings by an institution of own CET 1 instruments (negative amount)
6 (60) (24) (54) (11) Direct, indirect and synthetic holdings of the CET 1 instruments of financial sector entities where those entities have reciprocal cross holdings with the institution designed to inflate artificially the own funds of the institution (negative amount) 0 0 0 0 Direct, indirect and synthetic holdings by the institution of the CET 1 instruments of financial sector entities where the institution does not have a significant investment in those entities (amount above the 10 % threshold and net of eligible short positions) (negative amount)
7 0 0 0 0 Direct, indirect and synthetic holdings by the institution of the CET 1 instruments of financial sector entities where the institution has a significant investment in those entities (amount above 10 % threshold and net of eligible short positions) (negative amount) 0 0 0 0 Exposure amount of the following items which qualify for a Risk Weight of 1250 %, where the institution opts for the deduction alternative 0 0 0 0
Thereof: Qualifying holdings outside the financial sector (negative amount) 0 0 0 0 Securitization positions (negative amount) 0 0 0 0 Free deliveries (negative amount) 0 0 0 0
Deferred tax assets arising from temporary differences (amount above 10 % threshold, net of related tax liabilities where the conditions in Art. 38 (3) CRR are met) (negative amount) (9) (3) (78) (16) fAmount exceeding the 15 % threshold (negative amount) (2,031) (690) (1,199) (202)
Thereof: Direct, indirect and synthetic holdings by the institution of the CET 1 instruments of financial sector entities where the institution has a significant investment in those entities (931) (316) (499) (84) hDeferred tax assets arising from temporary differences (1,100) (374) (700) (118) f
Losses for the current financial year (negative amount) 0 0 0 0 Regulatory adjustments applied to CET 1 capital in respect of amounts subject to pre-CRR treatment: N/M 0 N/M 0 Regulatory adjustments relating to unrealized gains and losses pursuant to Art. 467 and 468 CRR N/M (1,236) N/M (1,648) Amount to be deducted from or added to CET 1 capital with regard to additional filters and deductions required pre CRR
8 (348) (348) (345) (345) Qualifying AT1 deductions that exceed the AT1 capital of the institution (negative amount) 0 0 0 0 Other regulatory adjustments 0 0 0 0
Total regulatory adjustments to Common Equity Tier 1 (CET 1) capital (21,742) (10,216) (19,674) (6,072)
Common Equity Tier 1 (CET 1) capital 47,843 59,728 46,076 60,103

Deutsche Bank Management Report 58 Interim Report as of March 31, 2015 Risk Report Regulatory Capital
Mar 31, 2015 Dec 31, 2014
in € m. CRR/CRD 4 fully-loaded CRR/CRD 4
CRR/CRD 4 fully-loaded
CRR/CRD 4 Refe- rences
1
Additional Tier 1 (AT1) capital: instruments Capital instruments and the related share premium accounts 4,676 4,676 4,676 4,676 i
Thereof: Classified as equity under applicable accounting standards 4,676 4,676 4,676 4,676 iClassified as liabilities under applicable accounting standards 0 0 0 0
Amount of qualifying items referred to in Art. 484 (4) CRR and the related share premium accounts subject to phase out from AT1 N/M 7,395 N/M 10,021 jPublic sector capital injections grandfathered until January 1, 2018 N/M N/M N/M N/M Tier 1 capital included in consolidated AT1 capital issued by subsidiaries and held by third parties 0 0 0 0
Thereof: instruments issued by subsidiaries subject to phase out N/M 0 N/M 0
Additional Tier 1 (AT1) capital before regulatory adjustments 4,676 12,071 4,676 14,696
Additional Tier 1 (AT1) capital: regulatory adjustments
Direct, indirect and synthetic holdings by an institution of own AT1 instruments (negative amount) (11) (11) (57) (57) iDirect, indirect and synthetic holdings of the AT1 instruments of financial sector entities where those entities have reciprocal cross holdings with the institution designed to inflate artificially the own funds of the institution (negative amount) 0 0 0 0 Direct, indirect and synthetic holdings of the AT1 instruments of financial sector entities where the institution does not have a significant investment in those entities (amount above the 10 % threshold and net of eligible short positions) (negative amount)
7 0 0 0 0 Direct, indirect and synthetic holdings by the institution of the AT1 instruments of financial sector entities where the institution has a significant investment in those entities (amount above the 10 % threshold net of eligible short positions) (negative amount) 0 0 0 0 Regulatory adjustments applied to AT1 capital in respect of amounts subject to pre-CRR treatmentand transitional treatments subject to phase out as prescribed in CRR (i.e., residual amounts) N/M 0 N/M 0 Residual amounts deducted from AT1 capital with regard to deduction from CET 1 capital during the transitional period pursuant to Art. 472 CRR N/M (8,805) N/M (10,845)
Thereof: Intangible assets N/M (8,340) N/M (10,383) eShortfall of provisions to expected losses N/M (228) N/M (294) Direct, indirect and synthetic holdings by the institution of the CET 1 instruments of financial sector entities where the institution has a significant investment in those entities N/M (237) N/M (168)
Residual amounts deducted from AT1 capital with regard to deduction from Tier 2 (T2) capital during the transitional period pursuant to Art. 475 CRR N/M 0 N/M 0 Amount to be deducted from or added to AT1 capital with regard to additional filters and deductions required pre CRR N/M 0 N/M 0 Qualifying T2 deductions that exceed the T2 capital of the institution (negative amount) 0 0 0 0
Total regulatory adjustments to Additional Tier 1 (AT1) capital (11) (8,816) (57) (10,902)
Additional Tier 1 (AT1) capital 4,665 3,255 4,619 3,794
Tier 1 capital (T1 = CET 1 + AT1) 52,507 62,983 50,695 63,898
Tier 2 (T2) capital: instruments and provisions
Capital instruments and the related share premium accounts
9 10,319 4,346 11,505 2,942 kAmount of qualifying items referred to in Art. 484 (5) CRR and the related share premium accounts subject to phase out from T2 N/M 247 N/M 721 kPublic sector capital injections grandfathered until January 1, 2018 N/M N/M N/M N/M Qualifying own funds instruments included in consolidated T2 capital issued by subsidiaries and held by third parties 858 1,082 908 1,228 k
Thereof: instruments issued by subsidiaries subject to phase out N/M 0 N/M 0 Credit risk adjustments 0 0 0 0
Tier 2 (T2) capital before regulatory adjustments 11,178 5,675 12,412 4,891
Tier 2 (T2) capital: regulatory adjustments
Direct, indirect and synthetic holdings by an institution of own T2 instruments and subordinated loans (negative amount) (27) (26) (36) (34) kDirect, indirect and synthetic holdings of the T2 instruments and subordinated loans of financial sector entities where those entities have reciprocal cross holdings with the institution designed to inflate artificially the own funds of the institution (negative amount) 0 0 0 0

Deutsche Bank Management Report 59 Interim Report as of March 31, 2015 Risk Report Regulatory Capital
Mar 31, 2015 Dec 31, 2014
in € m. CRR/CRD 4 fully-loaded CRR/CRD 4
CRR/CRD 4 fully-loaded
CRR/CRD 4 Refe- rences
1
Direct, indirect and synthetic holdings of the T2 instruments and subordinated loans of financial sector entities where the institution does not have a significant investment in those entities (amount above 10 % threshold and net of eligible short positions) (negative amount)
7 0 0 0 0
Thereof: New holdings not subject to transitional arrangements N/M N/M N/M N/M Holdings existing before January 1, 2013 and subject to transitional arrangements N/M N/M N/M N/M
Direct, indirect and synthetic holdings by the institution of the T2 instruments and subordinated loans of financial sector entities where the institution has a significant investment in those entities(net of eligible short positions) (negative amount) 0 0 0
0
Regulatory adjustments applied to Tier 2 in respect of amounts subject to pre-CRR treatment and transitional treatments subject to phase out as prescribed in CRR (i.e., residual amounts) N/M 0 N/M 0 Residual amounts deducted from Tier 2 capital with regard to deduction from Common Equity Tier 1 capital during the transitional period pursuant to Art. 472 CRR N/M (465) N/M (462)
Thereof: Shortfall of provisions to expected losses N/M (228) N/M (294) Direct, indirect and synthetic holdings by the institution of the CET 1 instruments of financial sector entities where the institution has a significant investment in those entities N/M (237) N/M (168)
Residual amounts deducted from Tier 2 capital with regard to deduction from Additional Tier 1 capital during the transitional period pursuant to Art. 475 CRR N/M 0 N/M 0
Thereof: Reciprocal cross holdings in AT1 instruments N/M 0 N/M 0 Direct holdings of nonsignificant investments in the capital of other financial sector entities N/M 0 N/M 0
Amount to be deducted from or added to Additional Tier 2 capital with regard to additional filters and deductions required pre-CRR 0 0 0 0
Total regulatory adjustments to Tier 2 (T2) capital (27) (491) (36) (496)
Tier 2 (T2) capital 11,151 5,184 12,376 4,395
Total capital (TC = T1 + T2) 63,658 68,167 63,072 68,293
Risk-weighted assets in respect of amounts subject to pre-CRR treatment and transitional treatments subject to phase out as prescribed in CRR (i.e., residual amounts)
10 N/M 0 N/M 0 Thereof: Items not deducted from CET 1 (CRR residual amounts) N/M 0 N/M 0 Items not deducted from AT1 items (CRR residual amounts) N/M 0 N/M 0 Items not deducted from T2 items (CRR residual amounts) N/M 0 N/M 0
Thereof: Indirect and synthetic holdings of own T2 instruments N/M 0 N/M 0 Indirect and synthetic holdings of nonsignificant investments in the capital of other financial sector entities N/M 0 N/M 0 Indirect and synthetic holdings of significant investments in the capital of other financial sector entities N/M 0 N/M 0
Total risk-weighted assets 431,390 432,142 393,969 396,648 Thereof: Credit Risk (including Settlement Risk) 259,799 260,552 241,475 244,155 Credit Valuation Adjustment (CVA) 23,470 23,470 21,203 21,203 Market Risk 72,603 72,603 64,209 64,209 Operational Risk 75,517 75,517 67,082 67,082
Capital ratios and buffers Common Equity Tier 1 capital ratio (as a percentage of risk-weighted assets) 11.1 13.8 11.7 15.2 Tier 1 capital ratio (as a percentage of risk-weighted assets) 12.2 14.6 12.9 16.1 Total capital ratio (as a percentage of risk-weighted assets) 14.8 15.8 16.0 17.2 Institution specific buffer requirement (CET 1 requirement in accordance with Art. 92 (1) (a) CRRplus capital conservation and countercyclical buffer requirements, plus systemic risk buffer, plus the systemically important institution buffer (G-SII or O-SII buffer), expressed as a percentage of risk-weighted assets) 9.0 4.5 9.0
4.0
Thereof: Capital conservation buffer requirement 2.5 0.0 2.5 0.0 Countercyclical buffer requirement
11 N/M N/M N/M N/M Systemic risk buffer requirement 0.0 0.0 0.0 0.0 Global Systemically Important Institution (G-SII) or Other Systemically Important Institution (O-SII) buffer
12 2.0 0.0 2.0 0.0 Common Equity Tier 1 capital available to meet buffers (as a percentage of risk-weighted assets)
13 6.2 7.8 6.9 9.2

Deutsche Bank Management Report 60 Interim Report as of March 31, 2015 Risk Report Regulatory Capital
Mar 31, 2015 Dec 31, 2014
in € m. CRR/CRD 4 fully-loaded CRR/CRD 4
CRR/CRD 4 fully-loaded
CRR/CRD 4 Refe- rences
1
Amounts below the thresholds for deduction (before risk weighting) Direct, indirect and synthetic holdings of the capital of financial sector entities where the institution does not have a significant investment in those entities (amount below 10 % threshold and net of eligible short positions)
7 2,981 2,981 3,148 3,148 Direct, indirect and synthetic holdings by the institution of the CET 1 instruments of financial sector entities where the institution has a significant investment in those entities (amount below 10 % threshold and net of eligible short positions) 3,289 3,429 2,877 2,956 Deferred tax assets arising from temporary differences (amount below 10 % threshold, net of related tax liability where the conditions in Art. 38 (3) CRR are met) 3,888 4,053 4,035 4,146
Applicable caps on the inclusion of provisions in Tier 2 capital Credit risk adjustments included in T2 in respect of exposures subject to standardized approach (prior to the application of the cap) 0 0 0 0 Cap on inclusion of credit risk adjustments in T2 under standardized approach 443 443 454 454 Credit risk adjustments included in T2 in respect of exposures subject to internal ratings-based approach (prior to the application of the cap) 0 0 0 0 Cap for inclusion of credit risk adjustments in T2 under internal ratings-based approach 1,082 1,082 991 991
Capital instruments subject to phase-out arrangements Current cap on CET 1 instruments subject to phase-out arrangements N/M 0 N/M 0 Amount excluded from CET 1 due to cap (excess over cap after redemptions and maturities) N/M 0 N/M 0 Current cap on AT1 instruments subject to phase-out arrangements N/M 8,768 N/M 10,021 Amount excluded from AT1 due to cap (excess over cap after redemptions and maturities) N/M 0 N/M 446 Current cap on T2 instruments subject to phase-out arrangements N/M 2,363 N/M 2,701 Amount excluded from T2 due to cap (excess over cap after redemptions and maturities) N/M 0 N/M 0
N/M – Not meaningful 1 References provide the mapping of regulatory balance sheet items used to calculate regulatory capital as reflected in the column “References” in “Reconciliation of Consolidated Balance
Sheet according to IFRS to regulatory Balance Sheet (unaudited)”. Where applicable, more detailed information are provided in the respective reference footnote section. 2 Based on EBA list as referred to in Article 26 (3) CRR. 3 Reflects the ECB decision (EU) (2015/4) from February 4, 2015 on recognition of interim or year-end profits in CET 1 capital. 4 The Regulatory Technical Standard issued by the EBA has not yet been adopted and published by the European Commission. Deutsche Bank currently estimates the amount of the
additional value adjustments arising in case of a future application of the new standard to range between € 1.5 and € 2.0 billion before consideration of offset in shortfall of provisions to expected loss.
5 Gains and losses on liabilities of the institution that are valued at fair value that result from changes in the own credit standing of the institution according to Article 33 (1) (b) CRR as well as all fair value gains and losses arising from the institution’s own credit risk related to derivative liabilities according to Article 33 (1) (c) CRR.
6 Excludes holdings that are already considered in the accounting base of Common Equity. 7 Based on our current interpretation no deduction amount expected. 8 Prudential filter for fund for home loans and savings protection (“Fonds zur bauspartechnischen Absicherung”). 9 Amortization is taken into account. 10 Excludes risk-weighted assets for positions in the trading book which are subject to phase out as prescribed in CRR (i.e. CRR residual amounts) as attributed risk-weighted assets are
calculated on a portfolio basis. 11 Countercyclical buffer rates not yet available. 12 G-SII buffer officially required by BaFin in March 2015 and phased-in starting 2016. 13 Calculated as the CET 1 capital less any CET 1 items used to meet Tier 1 and Total capital requirements. a Common shares, additional paid-in capital and common shares in treasury reflect regulatory eligible CET 1 capital instruments. b The position retained earnings in the regulatory balance sheet includes net income attributable to Deutsche Bank Shareholders, net of tax, of € 544 million as of March 31, 2015
(€ 1,663 million as of December 31, 2014). This item is excluded from the position retained earnings in the transitional template for regulatory capital and shown separately along with accrual for dividend and AT1 coupons of € 1,726 million as of March 31, 2015 (€ 1,182 million as of December 31, 2014) in the position independently reviewed interim profits net of any foreseeable change or dividend.
c Difference to regulatory balance sheet position driven by prudential filters for unrealized gains and losses. d Phase-out of noncontrolling interests at a rate of 60 % in 2015 (80 % in 2014). e Regulatory applicable amount is Goodwill and other intangible assets of € 14,032 million as of March 31, 2015 (€ 13,134 million as of December 31, 2014) plus Goodwill from equity
method investments of € 486 million as of March 31, 2015 (€ 430 million as of December 31, 2014) as per regulatory balance sheet reduced by deferred tax liabilities on other intangibles of € 618 million as of March 31, 2015 (€ 585 million as of December 31, 2014). Total CET1 deduction amount is phased-in at a rate of 40 % in 2015 (2014: 20 %). Residual amount is deducted from AT1 capital.
f Differences to balance sheet position mainly driven by adjustments as set out in Article 38 (2) to (5) CRR (e.g. regulatory offsetting requirements). g Phase-in at a rate of 40 % in 2015 (20 % in 2014). h Hua Xia Bank Company Limited as major part of the position equity method investments and the major part of significant holdings of the CET 1 instruments of financial sector entities,
subject to threshold deductions. CET 1 deduction amount is phased-in at a rate of 40 %. Residual amount is deducted from AT1 capital. i Additional equity components reflects regulatory eligible AT1 capital instruments. j Difference to regulatory balance sheet driven by regulatory adjustments as set out in Articles 51 to 61 CRR (e.g. current cap on AT1 instruments subject to phase-out arrangements). k Difference to regulatory balance sheet driven by regulatory adjustments as set out in Articles 62 to 71 CRR (e.g. maturity deduction, noncontrolling interests).

Deutsche Bank Management Report 61 Interim Report as of March 31, 2015 Risk Report Regulatory Capital
Reconciliation of shareholders’ equity to regulatory capital Mar 31, 2015 Dec 31, 2014
in € m. CRR/CRD 4 CRR/CRD 4
Total shareholders’ equity per accounting balance sheet 72,979 68,351 Deconsolidation / Consolidation of entities (1,668) (1,419)
Thereof: Additional paid-in capital (4) (5) Retained earnings (1,234) (1,107) Accumulated other comprehensive income, net of tax (430) (306)
Total shareholders’ equity per regulatory balance sheet 71,311 66,932 Noncontrolling interest based on transitional rules 102 118 Accrual for dividend and AT1 coupons (1,726) (1,182) Reversal of deconsolidation/consolidation of accumulated other comprehensive income, net of tax, during transitional period 258 306 Common Equity Tier 1 (CET 1) capital before regulatory adjustments 69,944 66,175 Prudential filters (1,718) (2,039)
Thereof: Additional value adjustments 0 0 Any increase in equity that results from securitized assets (49) 0 Fair value reserves related to gains or losses on cash flow hedges and gains or losses on liabilities designated at fair value resulting from changes in own credit standing (433) (391) Regulatory adjustments relating to unrealized gains and losses pursuant to Art. 467 and 468 CRR (1,236) (1,648)
Regulatory adjustments (8,498) (4,032) Thereof: Intangible assets (net of related tax liabilities) (5,560) (2,596) Deferred tax assets that rely on future profitability (1,519) (657) Shortfall of provisions to expected loss (304) (147) Defined benefit pension fund assets (426) (192) Direct, indirect and synthetic holdings by the institution of the CET 1 instruments of financial sector entities where the institution has a significant investment in those entities (316) (84) Securitization positions not included in risk-weighted assets 0 0 Other
1 (372) (356) Common Equity Tier 1 capital 59,728 60,103 Additional Tier 1 capital 3,255 3,794 Additional Tier 1 Notes (AT1 Notes) 4,665 4,619
Per balance sheet 4,665 4,619 Deconsolidation/Consolidation of entities 0 0 Regulatory adjustments to balance sheet position 0 0
Hybrid capital securities 7,378 10,002 Per balance sheet 7,979 10,573 Deconsolidation/Consolidation of entities 394 516 Regulatory adjustments to balance sheet position (995) (1,087)
Thereof: Amount excluded from Additional Tier 1 due to cap 0 (446) Other (995) (640)
Other regulatory adjustments 17 19 Deductions from Additional Tier 1 capital (8,805) (10,845) Tier 1 capital 62,983 63,898
Tier 2 capital 5,184 4,395 Subordinated debt 5,358 4,120
Per balance sheet 7,226 6,392 Deconsolidation/Consolidation of entities 0 0 Regulatory adjustments to balance sheet position (1,868) (2,272)
Thereof: Amortization according to Art. 64 CRR (1,636) (2,101) Other (231) (171)
Other regulatory adjustments 291 737 Thereof: Inclusion of amount excluded from Additional Tier 1 due to cap 0 446 Other 291 291
Deductions from Tier 2 capital (465) (462) Total capital 68,167 68,293
N/M – Not meaningful 1 Mainly relates to prudential filter for fund for home loans and savings protection (“Fonds zur bauspartechnischen Absicherung”).

Deutsche Bank Management Report 62 Interim Report as of March 31, 2015 Risk Report Regulatory Capital
Development of Risk-weighted Assets The table below provide an overview of RWA broken down by model approach and business division. They include the aggregated effects of the segmental reallocation of infrastructure related positions if applicable as well as reallocations between the segments.
For the current reporting date and the comparison period the amounts presented are based on the CRR/CRD 4 framework according to the transitional rules.
Within credit risk, the line item “Other” in advanced IRBA reflects RWA from securitization positions in the bank-ing book, specific equity positions and other non-credit obligation assets. Within the Standardized Approach, the majority of the line item “Other” includes RWA from our pension fund assets with the remainder being RWAs from banking book securitizations as well as exposures assigned to the further exposure classes apart from central governments or central banks, institutions, corporates and retail.
Risk-weighted Assets by Model Approach and Business Division Mar 31, 2015
in € m.
Corporate Banking & Securities
Private & Business Clients
Global Transaction Banking
Deutsche Asset & Wealth Management
Non-Core Operations Unit
Consolidation & Adjustments and Other Total
Credit Risk 95,088 71,347 46,053 8,061 18,861 21,132 260,542 Segmental reallocation (2,395) 520 3,693 325 73 (2,217) 0 Advanced IRBA 88,861 60,536 35,621 4,510 12,847 14,705 217,081
Central Governments and Central Banks 4,451 49 941 0 84 205 5,730 Institutions 9,741 1,541 3,318 103 642 173 15,517 Corporates 63,672 10,294 31,022 3,220 4,561 1,737 114,506 Retail 123 37,843 24 133 736 0 38,860 Other 10,874 10,809 317 1,054 6,825 12,591 42,469
Foundation IRBA 2,360 3,140 168 0 1 0 5,669 Central Governments and Central Banks 0 0 0 0 0 0 0 Institutions 0 37 0 0 0 0 37 Corporates 2,360 3,103 168 0 1 0 5,631
Standardized Approach 4,964 7,063 6,570 3,226 5,938 8,643 36,404 Central Governments or Central Banks 4 62 24 3 0 0 93 Institutions 717 81 29 5 3 35 870 Corporates 2,823 1,697 4,856 1,186 1,053 753 12,367 Retail 7 4,170 497 38 712 17 5,442 Other 1,413 1,053 1,163 1,995 4,169 7,839 17,632
Risk exposure amount for default funds contributions 1,297 87 1 0 2 0 1,388
Settlement Risk 9 0 0 0 0 1 10 Credit Valuation Adjustment (CVA) 16,988 757 9 887 4,359 470 23,470
Internal Model Approach 16,973 722 9 878 4,359 0 22,941 Standardized Approach 15 35 0 9 0 470 529
Market Risk 50,257 45 196 2,552 19,554 0 72,603 Internal Model Approach 35,996 0 196 1,326 9,348 0 46,866 Standardized Approach 14,261 45 0 1,226 10,205 0 25,737
Operational Risk1 51,271 4,842 5,385 10,463 3,557 0 75,517 Advanced measurement approach 51,271 4,842 5,385 10,463 3,557 0 75,517
Total 213,613 76,990 51,643 21,963 46,331 21,603 432,142 1 The quarter over quarter changes for the business divisions are due to a change in the allocation methodology.

Deutsche Bank Management Report 63 Interim Report as of March 31, 2015 Risk Report Regulatory Capital
Dec 31, 2014
in € m.
Corporate Banking & Securities
Private & Business Clients
Global Transaction Banking
Deutsche Asset & Wealth Management
Non-Core Operations Unit
Consolidation & Adjustments and Other Total
Credit Risk 83,548 69,584 41,740 7,310 19,280 22,666 244,128 Segmental reallocation (2,200) 520 3,327 330 94 (2,071) 0 Advanced IRBA 77,263 58,786 31,763 3,910 13,062 14,638 199,422
Central Governments and Central Banks 3,948 124 1,020 0 74 218 5,385 Institutions 8,359 1,538 3,103 73 623 171 13,869 Corporates 55,678 9,938 26,916 2,740 5,062 1,199 101,533 Retail 121 37,852 30 91 773 0 38,867 Other 9,157 9,334 694 1,006 6,529 13,049 39,769
Foundation IRBA 2,079 3,303 107 0 1 0 5,491 Central Governments and Central Banks 0 0 0 0 0 0 0 Institutions 0 0 0 0 0 0 0 Corporates 2,079 3,303 107 0 1 0 5,490
Standardized Approach 4,804 6,884 6,542 3,070 6,122 10,099 37,522 Central Governments or Central Banks 21 63 27 3 0 0 114 Institutions 593 124 51 4 3 35 810 Corporates 2,841 1,401 4,747 1,111 1,075 584 11,759 Retail 7 4,064 422 45 1,141 18 5,697 Other 1,341 1,232 1,296 1,908 3,903 9,462 19,142
Risk exposure amount for default funds contributions 1,601 90 1 0 1 0 1,693
Settlement Risk 25 0 0 0 0 1 27 Credit Valuation Adjustment (CVA) 16,024 445 7 445 4,019 262 21,203
Internal Model Approach 15,953 417 7 443 3,953 1 20,774 Standardized Approach 71 28 0 2 66 261 428
Market Risk 44,469 92 199 2,483 16,967 0 64,209 Internal Model Approach 31,439 0 199 1,339 8,625 0 41,602 Standardized Approach 13,029 92 0 1,144 8,342 0 22,607
Operational Risk 31,512 9,605 1,321 6,368 18,275 0 67,082 Advanced measurement approach 31,512 9,605 1,321 6,368 18,275 0 67,082
Total 175,578 79,725 43,268 16,607 58,541 22,929 396,648
The development of RWA in the first three months of 2015 was mainly impacted by movements in foreign ex-change levels. The increase in operational RWA is driven by external losses being included in the model calcu-lation. Higher RWA is in both, credit and market risk RWA, primarily due to increased business volume and a methodology change in market risk RWA calculation.
The tables below provide an analysis of key drivers for risk-weighted asset movements observed for credit, market, operational risk and the Credit Valuation Adjustment in the reporting period.
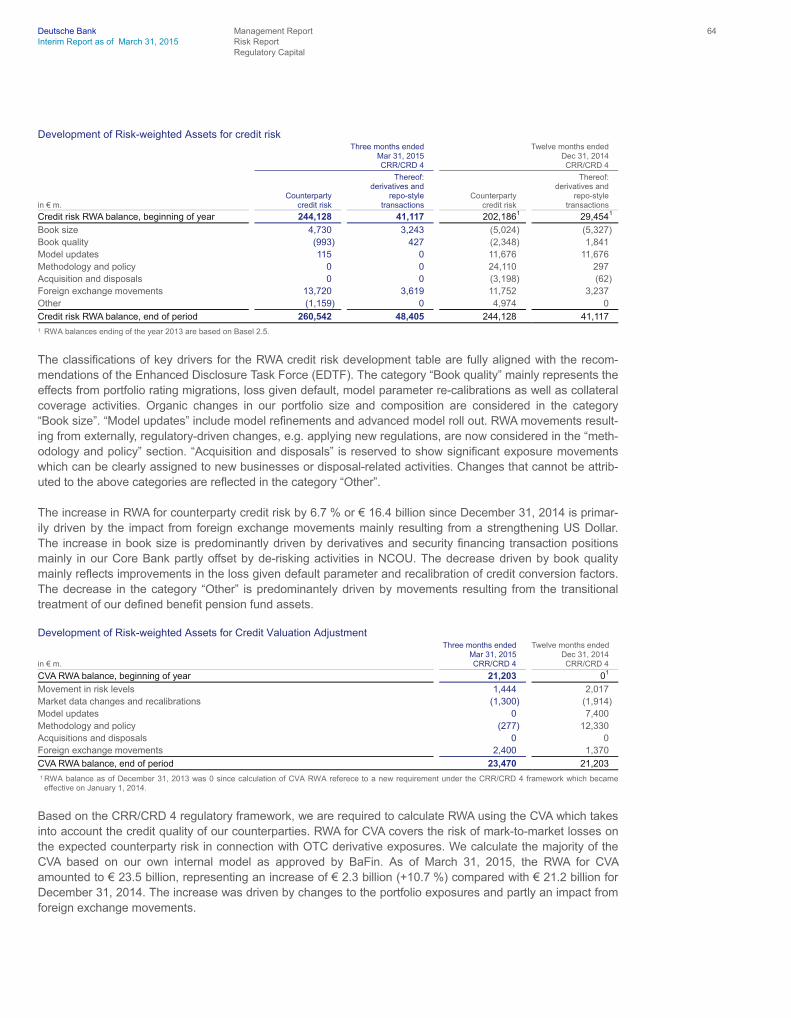
Deutsche Bank Management Report 64 Interim Report as of March 31, 2015 Risk Report Regulatory Capital
Development of Risk-weighted Assets for credit risk
Three months ended Mar 31, 2015 CRR/CRD 4
Twelve months ended Dec 31, 2014 CRR/CRD 4
in € m. Counterparty
credit risk
Thereof: derivatives and repo-style transactions
Counterparty credit risk
Thereof: derivatives and repo-style transactions
Credit risk RWA balance, beginning of year 244,128 41,117 202,186
1 29,454
1
Book size 4,730 3,243 (5,024) (5,327) Book quality (993) 427 (2,348) 1,841 Model updates 115 0 11,676 11,676 Methodology and policy 0 0 24,110 297 Acquisition and disposals 0 0 (3,198) (62) Foreign exchange movements 13,720 3,619 11,752 3,237 Other (1,159) 0 4,974 0
Credit risk RWA balance, end of period 260,542 48,405 244,128 41,117 1 RWA balances ending of the year 2013 are based on Basel 2.5.
The classifications of key drivers for the RWA credit risk development table are fully aligned with the recom-mendations of the Enhanced Disclosure Task Force (EDTF). The category “Book quality” mainly represents the effects from portfolio rating migrations, loss given default, model parameter re-calibrations as well as collateral coverage activities. Organic changes in our portfolio size and composition are considered in the category “Book size”. “Model updates” include model refinements and advanced model roll out. RWA movements result-ing from externally, regulatory-driven changes, e.g. applying new regulations, are now considered in the “meth-odology and policy” section. “Acquisition and disposals” is reserved to show significant exposure movements which can be clearly assigned to new businesses or disposal-related activities. Changes that cannot be attrib-uted to the above categories are reflected in the category “Other”.
The increase in RWA for counterparty credit risk by 6.7 % or € 16.4 billion since December 31, 2014 is primar-ily driven by the impact from foreign exchange movements mainly resulting from a strengthening US Dollar. The increase in book size is predominantly driven by derivatives and security financing transaction positions mainly in our Core Bank partly offset by de-risking activities in NCOU. The decrease driven by book quality mainly reflects improvements in the loss given default parameter and recalibration of credit conversion factors. The decrease in the category “Other” is predominantely driven by movements resulting from the transitional treatment of our defined benefit pension fund assets.
Development of Risk-weighted Assets for Credit Valuation Adjustment
in € m.
Three months ended Mar 31, 2015 CRR/CRD 4
Twelve months ended Dec 31, 2014 CRR/CRD 4
CVA RWA balance, beginning of year 21,203 01
Movement in risk levels 1,444 2,017 Market data changes and recalibrations (1,300) (1,914) Model updates 0 7,400 Methodology and policy (277) 12,330 Acquisitions and disposals 0 0 Foreign exchange movements 2,400 1,370
CVA RWA balance, end of period 23,470 21,203
1 RWA balance as of December 31, 2013 was 0 since calculation of CVA RWA referece to a new requirement under the CRR/CRD 4 framework which became effective on January 1, 2014.
Based on the CRR/CRD 4 regulatory framework, we are required to calculate RWA using the CVA which takes into account the credit quality of our counterparties. RWA for CVA covers the risk of mark-to-market losses on the expected counterparty risk in connection with OTC derivative exposures. We calculate the majority of the CVA based on our own internal model as approved by BaFin. As of March 31, 2015, the RWA for CVA amounted to € 23.5 billion, representing an increase of € 2.3 billion (+10.7 %) compared with € 21.2 billion for December 31, 2014. The increase was driven by changes to the portfolio exposures and partly an impact from foreign exchange movements.
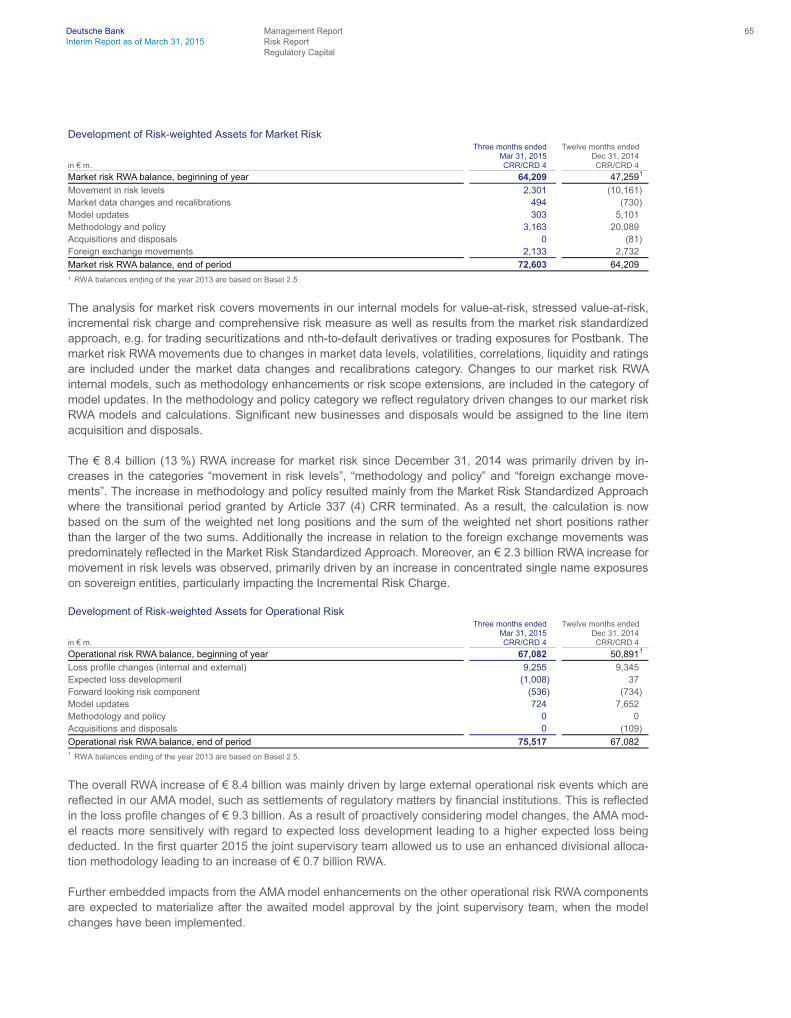
Deutsche Bank Management Report 65 Interim Report as of March 31, 2015 Risk Report Regulatory Capital
Development of Risk-weighted Assets for Market Risk
in € m.
Three months ended Mar 31, 2015 CRR/CRD 4
Twelve months ended Dec 31, 2014 CRR/CRD 4
Market risk RWA balance, beginning of year 64,209 47,259
1
Movement in risk levels 2,301 (10,161) Market data changes and recalibrations 494 (730) Model updates 303 5,101 Methodology and policy 3,163 20,089 Acquisitions and disposals 0 (81) Foreign exchange movements 2,133 2,732
Market risk RWA balance, end of period 72,603 64,209 1 RWA balances ending of the year 2013 are based on Basel 2.5.
The analysis for market risk covers movements in our internal models for value-at-risk, stressed value-at-risk, incremental risk charge and comprehensive risk measure as well as results from the market risk standardized approach, e.g. for trading securitizations and nth-to-default derivatives or trading exposures for Postbank. The market risk RWA movements due to changes in market data levels, volatilities, correlations, liquidity and ratings are included under the market data changes and recalibrations category. Changes to our market risk RWA internal models, such as methodology enhancements or risk scope extensions, are included in the category of model updates. In the methodology and policy category we reflect regulatory driven changes to our market risk RWA models and calculations. Significant new businesses and disposals would be assigned to the line item acquisition and disposals.
The € 8.4 billion (13 %) RWA increase for market risk since December 31, 2014 was primarily driven by in-creases in the categories “movement in risk levels”, “methodology and policy” and “foreign exchange move-ments”. The increase in methodology and policy resulted mainly from the Market Risk Standardized Approach where the transitional period granted by Article 337 (4) CRR terminated. As a result, the calculation is now based on the sum of the weighted net long positions and the sum of the weighted net short positions rather than the larger of the two sums. Additionally the increase in relation to the foreign exchange movements was predominately reflected in the Market Risk Standardized Approach. Moreover, an € 2.3 billion RWA increase for movement in risk levels was observed, primarily driven by an increase in concentrated single name exposures on sovereign entities, particularly impacting the Incremental Risk Charge.
Development of Risk-weighted Assets for Operational Risk
in € m.
Three months ended Mar 31, 2015 CRR/CRD 4
Twelve months ended Dec 31, 2014 CRR/CRD 4
Operational risk RWA balance, beginning of year 67,082 50,891
1
Loss profile changes (internal and external) 9,255 9,345 Expected loss development (1,008) 37 Forward looking risk component (536) (734) Model updates 724 7,652 Methodology and policy 0 0 Acquisitions and disposals 0 (109)
Operational risk RWA balance, end of period 75,517 67,082 1 RWA balances ending of the year 2013 are based on Basel 2.5.
The overall RWA increase of € 8.4 billion was mainly driven by large external operational risk events which are reflected in our AMA model, such as settlements of regulatory matters by financial institutions. This is reflected in the loss profile changes of € 9.3 billion. As a result of proactively considering model changes, the AMA mod-el reacts more sensitively with regard to expected loss development leading to a higher expected loss being deducted. In the first quarter 2015 the joint supervisory team allowed us to use an enhanced divisional alloca-tion methodology leading to an increase of € 0.7 billion RWA.
Further embedded impacts from the AMA model enhancements on the other operational risk RWA components are expected to materialize after the awaited model approval by the joint supervisory team, when the model changes have been implemented.

Deutsche Bank Management Report 66 Interim Report as of March 31, 2015 Risk Report Balance Sheet Management
Balance Sheet Management
We manage our balance sheet on a Group level and, where applicable, locally in each region. In the allocation of financial resources we favour business portfolios with the highest positive impact on our profitability and shareholder value. We monitor and analyze balance sheet developments and track certain market-observed balance sheet ratios. Based on this we trigger discussion and management action by the Capital and Risk Committee. Following the publication of the CRR/CRD 4 framework on June 27, 2013, we established a lever-age ratio calculation according to that framework. Our calculation of the leverage exposure measure considers a delegated act which was adopted by the European Commission on October 10, 2014 and published in the Official Journal of the European Union on January 17, 2015.
Leverage Ratio according to CRR/CRD 4 framework (fully loaded) The CRR/CRD 4 framework introduced a non-risk based leverage ratio that is intended to act as a supplemen-tary measure to the risk based capital requirements. Its objectives are to constrain the build-up of leverage in the banking sector, helping avoid destabilizing deleveraging processes which can damage the broader finan-cial system and the economy, and to reinforce the risk based requirements with a simple, non-risk based “backstop” measure.
To harmonize the disclosure of the leverage ratio and its components, Article 451 (2) CRR contains a mandate for the European Banking Authority (EBA) to develop draft implementing technical standards (ITS) based on the Basel Committee publication of the framework and disclosure requirements for the Basel 3 leverage ratio. Against this background, the draft ITS on disclosure of the leverage ratio published on June 5, 2014 contains uniform templates for the disclosure of the leverage ratio and its components. As described above a delegated act was finally adopted by the European Commission and we expect that the draft ITS on disclosure of the leverage ratio will be modified accordingly. Still pending final ITS templates we have adjusted the draft tem-plates to reflect the changes under the delegated act in the meantime.
The following tables show leverage ratio exposures based on the applicable CRR/CRD 4 rules:
Summary reconciliation of accounting assets and leverage ratio exposures in € bn. Mar 31, 2015 Dec. 31, 2014
Total assets as per published financial statements 1,955 1,709
Adjustment for entities which are consolidated for accounting purposes but are outside the scope of regulatory consolidation (29) (28) Adjustments for derivative financial instruments (383) (276) Adjustments for securities financing transactions 20 16 Adjustment for off-balance sheet items (i.e. conversion to credit equivalent amounts of off-balance sheet exposures) 134 127 Other adjustments (149) (103)
Leverage ratio exposure 1,549 1,445

Deutsche Bank Management Report 67 Interim Report as of March 31, 2015 Risk Report Balance Sheet Management
Leverage ratio common disclosure in € bn. (unless stated otherwise) Mar 31,2015 Dec 31, 2014
Derivative exposures:
Replacement cost associated with derivatives transactions after netting of cash variation margin received 83 72 Add-on amounts for PFE associated with derivatives transactions 227 221 Credit default swaps notional 58 65
Total derivative exposures 368 358
Securities financing transaction exposures:
SFT Gross 166 138 SFT Add-on for counterparty credit risk 14 14
Total securities financing transaction exposures 180 152
Off-balance sheet exposures:
Off-balance sheet items with a 10 % CCF 4 4 Off-balance sheet items with a 20 % CCF 13 10 Off-balance sheet items with a 50 % CCF 71 69 Off-balance sheet items with a 100 % CCF 46 44
Total off-balance sheet exposures 134 127
Other Assets 888 827
Asset amounts deducted in determining Tier 1 capital fully-loaded (21) (19)
Capital and Total Exposures:
Tier 1 capital fully-loaded 52.5 50.7
Total Exposures 1,549 1,445
CRR/CRD 4 fully-loaded Leverage Ratio - using a CRR/CRD 4 fully-loaded definition of Tier 1 capital (in %) 3.4 3.5 Breakdown of on-balance sheet exposures (excluding derivatives and SFTs) in € bn. Mar 31, 2015 Dec. 31, 2014
Total on-balance sheet exposures (excluding derivatives and SFTs) 888 827 Thereof: Trading book exposures 283 245 Banking book exposures 606 582
Thereof: Covered bonds 5 5 Exposures treated as sovereigns 161 147 Exposures to regional governments, MDB, international organizations and PSE not treated as sovereigns 3 2 Institutions 22 19 Secured by mortgages of immovable properties 161 159 Retail exposures 36 35 Corporate exposures 189 170 Exposures in default 10 11 Other exposures (e.g. equity, securitizations, and other non-credit obligation assets) after netting ofcash variation margin paid 19 33
As of March 31, 2015, our fully loaded CRR/CRD 4 leverage ratio was 3.4 % compared to 3.5 % as of De-cember 31, 2014, taking into account as of March 31, 2015 a fully loaded Tier 1 capital of € 52.5 billion over an applicable exposure measure of € 1,549 billion (€ 50.7 billion and € 1,445 billion as of December 31, 2014, respectively).

Deutsche Bank Management Report 68 Interim Report as of March 31, 2015 Risk Report Overall Risk Position
In the first three months of the year our leverage ratio exposure increased by € 104 billion taking into account currency effects of € 101 billion. The € 3 billion increase excluding the aforementioned currency effects mainly reflects increases in securities financing transaction, cash and deposits with banks and loans of € 31 billion which were partly offset by de-leveraging of € 15 billion in our NCOU and decreases of € 13 billion in deriva-tives, off-balance sheet exposure and remaining assets.
Our leverage ratio calculated as the ratio of total assets under IFRS to total equity under IFRS was 25 as of March 31, 2015 compared to 23 as of December 31, 2014.
For main drivers of the Tier 1 capital development please refer to section Liquidity and Capital Resources in this report.
Overall Risk Position
The table below shows our overall risk position as measured by the economic capital usage calculated for credit, market, operational and business risk for the dates specified. To determine our overall (nonregulatory) risk position, we generally consider diversification benefits across risk types.
Overall risk position as measured by economic capital usage by risk type
2015 increase (decrease) from 2014
in € m. (unless stated otherwise) Mar 31, 2015 Dec 31, 2014 in € m. in %
Credit risk 14,067 12,885 1,182 9 Market risk 17,287 14,852 2,435 16
Trading market risk 5,176 4,955 221 4 Nontrading market risk 12,111 9,898 2,213 22
Operational risk 8,464 7,598 866 11 Business risk 3,113 3,084 29 1 Diversification benefit
1 (7,740) (6,554) (1,186) 18
Total economic capital usage 35,192 31,866 3,326 10 1 Diversification benefit across credit, market, operational and strategic risk (largest part of business risk)
As of March 31, 2015, our economic capital usage amounted to € 35.2 billion, which was € 3.3 billion, or 10 %, above the € 31.9 billion economic capital usage as of December 31, 2014.
The economic capital usage for credit risk increased to € 14.1 billion as of March 31, 2015, € 1.2 billion or 9 % higher compared to year-end 2014. This increase is mainly driven by higher exposures in CB&S and an in-creased economic capital usage for transfer risk.
The economic capital usage for trading market risk increased to € 5.2 billion as of March 31, 2015, compared with € 5.0 billion at year-end 2014. The increase is due to a higher economic capital usage for the traded de-fault risk component. The nontrading market risk economic capital usage increased by € 2.2 billion or 22 %, mainly driven by a methodology change for equity compensation risk, a higher structural foreign exchange risk due to the U.S. dollar strengthening and a higher investment risk economic capital.
The operational risk economic capital usage totaled € 8.5 billion as of March 31, 2015, which is € 866 million or 11 % higher than the € 7.6 billion economic capital usage as of December 31, 2014. The increase was mainly driven by an increased operational risk loss profile of the industry as a whole.

Deutsche Bank Management Report 69 Interim Report as of March 31, 2015 Risk Report Internal Capital Adequacy
Our business risk economic capital methodology captures strategic risk, which also implicitly includes elements of non standard risks including refinancing and reputational risk, and a tax risk component. The business risk increased slightly by 29 million to € 3.1 billion as of March 31, 2015. The increase is due to a higher economic capital usage for the tax risk component.
The inter-risk diversification effect of the economic capital usage across credit, market, operational and strate-gic risk increased by € 1.2 billion, or 18 %, as of March 31, 2015, mainly reflecting a methodology update in the first quarter 2015 and the increase in economic capital usage before diversification.
Internal Capital Adequacy
As the primary measure of our Internal Capital Adequacy Assessment Process (ICAAP) we assess our internal capital adequacy based on our “gone concern approach” as the ratio of our total capital supply divided by our total capital demand as shown in the table below. Our capital supply definition is aligned with the CRR/CRD 4 capital framework.
Internal Capital Adequacy in € m. (unless stated otherwise) Mar 31, 2015 Dec 31, 2014
Capital Supply Shareholders’ Equity 72,979 68,351 Fair value gains on own debt and debt valuation adjustments, subject to own credit risk
1 (494) (544) Defined benefit pension fund assets
2 (1,065) (961) Deferred Tax Assets (7,278) (6,865) Fair Value adjustments for financial assets reclassified to loans
3 0 0 Noncontrolling Interests
4 0 0 Hybrid Tier 1 capital instruments 12,871 16,158 Tier 2 capital instruments 7,466 6,620
Capital Supply 84,479 82,759
Capital Demand Economic Capital Requirement 35,192 31,866 Intangible Assets 15,802 14,951
Capital Demand 50,993 46,817
Internal Capital Adequacy Ratio in % 166 177 1 Includes deduction of fair value gains on own credit-effect relating to own liabilities designated under the fair value option as well as the debt valuation
adjustments. 2 Reported as net assets (assets minus liabilities) of a defined pension fund, i.e. applicable for overfunded pension plans. 3 Includes fair value adjustments for assets reclassified in accordance with IAS 39 and for banking book assets where no matched funding is available. A positive
adjustment is not considered. 4 Includes noncontrolling interest up to the economic capital requirement for each subsidiary.
A ratio of more than 100 % signifies that the total capital supply is sufficient to cover the capital demand deter-mined by the risk positions. This ratio was 166 % as of March 31, 2015, compared with 177 % as of Decem-ber 31, 2014. The change of the ratio was driven by an increase in capital demand. Shareholders’ equity increased by € 4.6 billion mainly driven by an increase in accumulated other comprehensive income due to the movements of foreign currency rates. Hybrid Tier 1 capital instruments decreased by € 3.3 billion mainly driven by called capital instruments. Tier 2 capital instruments increased by € 846 million mainly due to the issuance of new instruments. The increase in capital demand was driven by higher economic capital requirement as explained in the section “Overall Risk Position” and an increase in intangible assets by € 851 million.
The above capital adequacy measures apply to the consolidated Group as a whole (including Postbank) and form an integral part of our Risk and Capital Management framework.

Deutsche Bank Confirmations 70Interim Report as of March 31, 2015 Review Report
Review Report
To Deutsche Bank Aktiengesellschaft, Frankfurt am Main
We have reviewed the condensed interim consolidated financial statements of Deutsche Bank Aktiengesell-schaft, Frankfurt am Main - comprising the statement of income, statement of comprehensive income, balance sheet, statement of changes in equity, statement of cash flows and selected explanatory notes - together with the interim group management report of Deutsche Bank Aktiengesellschaft, Frankfurt am Main, for the period from January 1 to March 31, 2015 that are part of the quarterly financial report according to § 37x Abs. 3 WpHG („Wertpapierhandelsgesetz“: „German Securities Trading Act”). The preparation of the condensed in-terim consolidated financial statements in accordance with those IFRS applicable to interim financial reporting as adopted by the EU, and in accordance with the IFRS for interim financial reporting as issued by the Interna-tional Accounting Standards Board (IASB), and of the interim group management report in accordance with the requirements of the WpHG applicable to interim group management reports, is the responsibility of Deutsche Bank Aktiengesellschaft’s management. Our responsibility is to issue a report on the condensed interim con-solidated financial statements and on the interim group management report based on our review.
We performed our review of the condensed interim consolidated financial statements and the interim group management report in accordance with the German generally accepted standards for the review of financial statements promulgated by the Institut der Wirtschaftsprüfer (IDW). Those standards require that we plan and perform the review so that we can preclude through critical evaluation, with a certain level of assurance, that the condensed interim consolidated financial statements have not been prepared, in material respects, in ac-cordance with the IFRS applicable to interim financial reporting as adopted by the EU, and in accordance with the IFRS for interim financial reporting as issued by the IASB, and that the interim group management report has not been prepared, in material respects, in accordance with the requirements of the WpHG applicable to interim group management reports. A review is limited primarily to inquiries of company employees and ana-lytical assessments and therefore does not provide the assurance attainable in a financial statement audit. Since, in accordance with our engagement, we have not performed a financial statement audit, we cannot issue an auditor’s report.
Based on our review, no matters have come to our attention that cause us to presume that the condensed interim consolidated financial statements have not been prepared, in material respects, in accordance with the IFRS applicable to interim financial reporting as adopted by the EU, and in accordance with the IFRS for in-terim financial reporting as issued by the IASB, or that the interim group management report has not been prepared, in material respects, in accordance with the requirements of the WpHG applicable to interim group management reports.
KPMG AG Wirtschaftsprüfungsgesellschaft
Frankfurt am Main (Germany), April 25, 2015
Pukropski Wirtschaftsprüfer
Beier Wirtschaftsprüfer

Deutsche Bank Consolidated Financial Statements 71 Interim Report as of March 31, 2015 Consolidated Statement of Income (unaudited)
Consolidated Statement of Income (unaudited)
Income Statement
Three months ended
in € m. Mar 31, 2015 Mar 31, 2014
Interest and similar income 6,457 6,246 Interest expense 2,247 2,871 Net interest income 4,210 3,375
Provision for credit losses 218 246 Net interest income after provision for credit losses 3,992 3,129
Commissions and fee income 2,914 3,038 Net gains (losses) on financial assets/liabilities at fair value through profit or loss 2,495 1,616 Net gains (losses) on financial assets available for sale 185 73 Net income (loss) from equity method investments 201 154 Other income 370 136 Total noninterest income 6,166 5,018
Compensation and benefits 3,433 3,349 General and administrative expenses 5,069 3,010 Policyholder benefits and claims 153 52 Impairment of intangible assets 0 0 Restructuring activities 23 56 Total noninterest expenses 8,678 6,466
Income before income taxes 1,479 1,680
Income tax expense 920 577
Net income 559 1,103
Net income attributable to noncontrolling interests 16 20 Net income attributable to Deutsche Bank shareholders 544 1,083
Earnings per Common Share
Three months ended
Mar 31, 2015 Mar 31, 2014
Earnings per common share:
1 Basic € 0.39 € 1.01 Diluted € 0.38 € 0.98
Number of shares in million:
1 Denominator for basic earnings per share – weighted-average shares outstanding 1,384.7 1,073.3 Denominator for diluted earnings per share – adjusted weighted-average shares after assumed conversions
1,417.4 1,104.3
1 The number of average basic and diluted shares outstanding has been adjusted for all periods before June 2014 in order to reflect the effect of the bonus component of subscription rights issued in June 2014 in connection with the capital increase.

Deutsche Bank Consolidated Financial Statements 72 Interim Report as of March 31, 2015 Consolidated Statement of Comprehensive Income (unaudited)
Consolidated Statement of Comprehensive Income (unaudited) Three months ended
in € m. Mar 31, 2015 Mar 31, 2014
Net income recognized in the income statement 559 1,103
Other comprehensive income
Items that will not be reclassified to profit or loss Remeasurement gains (losses) related to defined benefit plans, before tax (188) 28
Total of income tax related to items that will not be reclassified to profit or loss 229 87 Items that are or may be reclassified to profit or loss
Financial assets available for sale Unrealized net gains (losses) arising during the period, before tax 703 313 Realized net (gains) losses arising during the period (reclassified to profit or loss), before tax (177) (59)
Derivatives hedging variability of cash flows Unrealized net gains (losses) arising during the period, before tax (4) (14) Realized net (gains) losses arising during the period (reclassified to profit or loss), before tax 5 7
Assets classified as held for sale Unrealized net gains (losses) arising during the period, before tax 0 0 Realized net (gains) losses arising during the period (reclassified to profit or loss), before tax 0 1
Foreign currency translation Unrealized net gains (losses) arising during the period, before tax 3,642 (128) Realized net (gains) losses arising during the period (reclassified to profit or loss), before tax 0 (3)
Equity Method Investments Net gains (losses) arising during the period 4 3
Total of income tax related to items that are or may be reclassified to profit or loss (79) (77) Other comprehensive income, net of tax 4,135 158
Total comprehensive income, net of tax 4,695 1,262
Attributable to: Noncontrolling interests 44 21 Deutsche Bank shareholders 4,651 1,241

Deutsche Bank Consolidated Financial Statements 73 Interim Report as of March 31, 2015 Consolidated Balance Sheet (unaudited)
Consolidated Balance Sheet (unaudited)
Assets in € m. Mar 31, 2015 Dec 31, 2014
Cash and due from banks 21,645 20,055 Interest-earning deposits with banks 70,659 63,518 Central bank funds sold and securities purchased under resale agreements 23,393 17,796 Securities borrowed 34,515 25,834 Financial assets at fair value through profit or loss
Trading assets 212,185 195,681 Positive market values from derivative financial instruments 746,084 629,958 Financial assets designated at fair value through profit or loss 125,810 117,285
Total financial assets at fair value through profit or loss 1,084,079 942,924 Financial assets available for sale 72,336 64,297 Equity method investments 4,916 4,143 Loans 428,548 405,612 Property and equipment 2,914 2,909 Goodwill and other intangible assets 15,802 14,951 Other assets 187,558 137,980 Income tax assets
1 9,100 8,684
Total assets 1,955,465 1,708,703
Liabilities and Equity in € m. Mar 31, 2015 Dec 31, 2014
Deposits 572,921 532,931 Central bank funds purchased and securities sold under repurchase agreements 17,078 10,887 Securities loaned 2,816 2,339 Financial liabilities at fair value through profit or loss
Trading liabilities 54,231 41,843 Negative market values from derivative financial instruments 724,120 610,202 Financial liabilities designated at fair value through profit or loss 41,340 37,131 Investment contract liabilities 9,654 8,523
Total financial liabilities at fair value through profit or loss 829,345 697,699 Other short-term borrowings 39,260 42,931 Other liabilities 238,723 183,823 Provisions
2 8,824 6,677 Income tax liabilities
1 3,068 2,783 Long-term debt 157,519 144,837 Trust preferred securities 7,979 10,573 Obligation to purchase common shares 0 0 Total liabilities 1,877,533 1,635,481
Common shares, no par value, nominal value of € 2.56 3,531 3,531 Additional paid-in capital 33,607 33,626 Retained earnings 29,863 29,279 Common shares in treasury, at cost (12) (8) Equity classified as obligation to purchase common shares 0 0 Accumulated other comprehensive income (loss), net of tax
3 5,989 1,923 Total shareholders’ equity 72,979 68,351
Additional equity components
4 4,665 4,619 Noncontrolling interests 288 253
Total equity 77,932 73,223
Total liabilities and equity 1,955,465 1,708,703 1 Income tax assets and income tax liabilities comprise both deferred and current taxes. 2 Included are operational/litigation provisions of € 5.3 billion and € 3.6 billion as of March 31, 2015 and December 31, 2014, respectively. 3 Excluding remeasurement effects related to defined benefit plans, net of tax. 4 Includes Additional Tier 1 Notes, which constitute unsecured and subordinated notes of Deutsche Bank and are classified as equity in accordance with IFRS.

Deutsche Bank Consolidated Financial Statements 74 Interim Report as of March 31, 2015 Consolidated Statement of Changes in Equity (unaudited)
Consolidated Statement of Changes in Equity (unaudited)
in € m.
Common shares (no par value)
Additional paid-in capital
Retained earnings
Common shares in treasury, at cost
Equity classified as obligation to purchase common shares
Unrealized net gains (losses) on financial assets available for sale, net of applicable tax and other
1
Balance as of December 31, 2013 2,610 26,204 28,376 (13) 0 303
Total comprehensive income, net of tax
2 0 0 1,083 0 0 178 Common shares issued 0 0 0 0 0 0 Cash dividends paid 0 0 0 0 0 0 Remeasurement gains (losses) related to defined benefit plans, net of tax 0 0 115 0 0 0 Net change in share awards in the reporting period 0 (189) 0 0 0 0 Treasury shares distributed under share-based compensation plans 0 0 0 394 0 0 Tax benefits related to share-based compensation plans 0 (18) 0 0 0 0 Additions to Equity classified as obligation to purchase common shares 0 0 0 0 0 0 Deductions from Equity classified as obligation to purchase common shares 0 0 0 0 0 0 Option premiums and other effects from options on common shares 0 (47) 0 0 0 0 Purchases of treasury shares 0 0 0 (3,542) 0 0 Sale of treasury shares 0 0 0 3,153 0 0 Net gains (losses) on treasury shares sold 0 (3) 0 0 0 0 Other 0 46 0 0 0 0
Balance as of March 31, 2014 2,610 25,993 29,574 (9) 0 481
Balance as of December 31, 2014 3,531 33,626 29,279 (8) 0 1,675
Total comprehensive income, net of tax
2 0 0 544 0 0 412 Common shares issued 0 0 0 0 0 0 Cash dividends paid 0 0 0 0 0 0 Remeasurement gains (losses) related to defined benefit plans, net of tax 0 0 41 0 0 0 Net change in share awards in the reporting period 0 (36) 0 0 0 0 Treasury shares distributed under share-based compensation plans 0 0 0 234 0 0 Tax benefits related to share-based compensation plans 0 22 0 0 0 0 Additions to Equity classified as obligation to purchase common shares 0 0 0 0 0 0 Deductions from Equity classified as obligation to purchase common shares 0 0 0 0 0 0 Option premiums and other effects from options on common shares 0 (34) 0 0 0 0 Purchases of treasury shares 0 0 0 (2,641) 0 0 Sale of treasury shares 0 0 0 2,403 0 0 Net gains (losses) on treasury shares sold 0 1 0 0 0 0 Other 0 28 0 0 0 0
Balance as of March 31, 2015 3,531 33,607 29,863 (12) 0 2,086 1 Excluding unrealized net gains (losses) from equity method investments. 2 Excluding remeasurement gains (losses) related to defined benefit plans, net of tax.

Deutsche Bank Consolidated Financial Statements 75 Interim Report as of March 31, 2015 Consolidated Statement of Changes in Equity (unaudited)
Unrealized net gains (losses) on derivatives hedging variability of cash flows, net of tax
1
Unrealized net gains (losses) on assets classified as held for sale, net of tax
Foreign currency translation, net of tax
1
Unrealized net gains (losses) from equity method investments
Accumulated other comprehensive income (loss), net of tax
2
Total shareholders’ equity
Additional equity components
3 Noncontrolling interests Total equity
(101) 2 (2,713) 53 (2,457) 54,719 0 247 54,966 (5) 1 (134) 3 43 1,126 0 21 1,147 0 0 0 0 0 0 0 0 0 0 0 0 0 0 0 0 0 0
0 0 0 0 0 115 0 0 115 0 0 0 0 0 (189) 0 0 (189)
0 0 0 0 0 394 0 0 394 0 0 0 0 0 (18) 0 0 (18)
0 0 0 0 0 0 0 0 0
0 0 0 0 0 0 0 0 0
0 0 0 0 0 (47) 0 0 (47) 0 0 0 0 0 (3,542) 0 0 (3,542) 0 0 0 0 0 3,153 0 0 3,153 0 0 0 0 0 (3) 0 0 (3) 0 0 0 0 0 46 0 (5) 42
(107) 3 (2,847) 56 (2,415) 55,753 0 264 56,017
79 0 151 18 1,923 68,351 4,619 253 73,223 0 0 3,650 4 4,066 4,610 0 44 4,654 0 0 0 0 0 0 0 0 0 0 0 0 0 0 0 0 0 0
0 0 0 0 0 41 0 0 41 0 0 0 0 0 (36) 0 0 (36)
0 0 0 0 0 234 0 0 234 0 0 0 0 0 22 0 0 22
0 0 0 0 0 0 0 0 0
0 0 0 0 0 0 0 0 0
0 0 0 0 0 (34) 0 0 (34) 0 0 0 0 0 (2,641) 0 0 (2,641) 0 0 0 0 0 2,403 0 0 2,403 0 0 0 0 0 1 0 0 1 0 0 0 0 0 28 46
4 (9) 65
79 0 3,802 22 5,989 72,979 4,665 288 77,932 3 Includes Additional Tier 1 Notes, which constitute unsecured and subordinated notes of Deutsche Bank and are classified as equity in accordance with IFRS. 4 Includes net proceeds from purchase and sale of additional equity components.

Deutsche Bank Consolidated Financial Statements 76 Interim Report as of March 31, 2015 Consolidated Statement of Cash Flows (unaudited)
Consolidated Statement of Cash Flows (unaudited)
Three months ended in € m. Mar 31, 2015 Mar 31, 2014 Net income 559 1,103 Cash flows from operating activities: Adjustments to reconcile net income to net cash provided by (used in) operating activities:
Provision for credit losses 218 246 Restructuring activities 23 56 Gain on sale of financial assets available for sale, equity method investments, and other (209) (101) Deferred income taxes, net 506 332 Impairment, depreciation and other amortization, and accretion 124 708 Share of net income (loss) from equity method investments (199) (154)
Income adjusted for noncash charges, credits and other items 1,022 2,190 Adjustments for net change in operating assets and liabilities:
Interest-earning time deposits with banks 7,234 (4,459) Central bank funds sold, securities purchased under resale agreements, securities borrowed (12,369) (4,856) Financial assets designated at fair value through profit or loss (4,673) 4,640 Loans (16,155) (3,769) Other assets (45,208) (61,961) Deposits 33,399 (11,516) Financial liabilities designated at fair value through profit or loss and investment contract liabilities
1 4,085 5,169 Central bank funds purchased, securities sold under repurchase agreements and securities loaned 5,891 508 Other short-term borrowings (4,649) (4,701) Other liabilities 48,515 54,158 Senior long-term debt
2 11,657 1,077 Trading assets and liabilities, positive and negative market values from derivative financial instruments, net (1,563) 20,972 Other, net (8,178) (1,280)
Net cash provided by (used in) operating activities 19,008 3,828 Cash flows from investing activities: Proceeds from:
Sale of financial assets available for sale 3,280 3,331 Maturities of financial assets available for sale 1,643 3,168 Sale of equity method investments 6 4 Sale of property and equipment 2 4
Purchase of: Financial assets available for sale (9,100) (9,157) Equity method investments (45) (42) Property and equipment (97) (112)
Net cash received in (paid for) business combinations/divestitures 0 333 Other, net (277) (163) Net cash provided by (used in) investing activities (4,588) (2,634) Cash flows from financing activities: Issuances of subordinated long-term debt 1,460 4 Repayments and extinguishments of subordinated long-term debt (855) (1,364) Issuances of trust preferred securities 393 48 Repayments and extinguishments of trust preferred securities (4,040) (1,582) Common shares issued 0 0 Purchases of treasury shares (2,641) (3,542) Sale of treasury shares 2,405 3,139 Net proceeds from Additional Equity Components
3 46 0 Dividends paid to noncontrolling interests 0 0 Net change in noncontrolling interests (9) 16 Cash dividends paid 0 0 Net cash provided by (used in) financing activities (3,241) (3,281) Net effect of exchange rate changes on cash and cash equivalents 2,561 110 Net increase (decrease) in cash and cash equivalents 13,740 (9,633) Cash and cash equivalents at beginning of period 51,960 56,041 Cash and cash equivalents at end of period 65,699 46,407 Net cash provided by (used in) operating activities include
Income taxes paid, net 222 12 Interest paid 2,457 3,403 Interest and dividends received 6,406 6,496
Cash and cash equivalents comprise Cash and due from banks 21,645 16,433 Interest-earning demand deposits with banks (not included: time deposits of € 26,605 million as of March 31, 2015, and € 43,719 million as of March 31, 2014) 44,055 29,973
Total 65,700 46,406
1 Included are senior long-term debt issuances of € 2,560 million and € 2,923 million and repayments and extinguishments of € 2,620 million and € 2,809 million through March 31, 2015 and March 31, 2014, respectively.
2 Included are issuances of € 25,269 million and € 10,894 million and repayments and extinguishments of € 18,399 million and € 10,525 million through March 31, 2015 and March 31, 2014, respectively.
3 Includes net proceeds from repurchase and sale of Additional Equity Components.

Deutsche Bank Consolidated Financial Statements 77 Interim Report as of March 31, 2015 Basis of Preparation (unaudited) Earnings per Common Share
Basis of Preparation (unaudited)
The accompanying condensed consolidated interim financial statements, which include Deutsche Bank AG and its subsidiaries (collectively the “Group”), are stated in euros, the presentation currency of the Group. They are presented in accordance with the requirements of IAS 34, “Interim Financial Reporting”, and have been prepared in accordance with International Financial Reporting Standards (“IFRS”) as issued by the Interna-tional Accounting Standards Board (“IASB”) and endorsed by the European Union (“EU”). The Group’s applica-tion of IFRS results in no differences between IFRS as issued by the IASB and IFRS as endorsed by the EU.
Some IFRS disclosures incorporated in the Management Report are an integral part of the consolidated interim financial statements. These include the Segmental Results of Operations of the Segmental Information note which is presented in the Operating and Financial Review: Segmental Results of the Management Report. The presentation of this information is in compliance with IAS 34 and IFRS 8, “Operating Segments”.
Deutsche Bank’s condensed consolidated interim financial statements are unaudited and include supplemen-tary disclosures on segment information, income statement, balance sheet and other financial information. They should be read in conjunction with the audited consolidated financial statements of Deutsche Bank for 2014, for which the same accounting policies and critical accounting estimates have been applied with the exception of the newly adopted accounting pronouncements outlined in section “Impact of Changes in Accounting Principles”.
The preparation of financial statements under IFRS requires management to make estimates and assumptions for certain categories of assets and liabilities.
These estimates and assumptions affect the reported amounts of assets and liabilities and disclosure of con-tingent assets and liabilities at the balance sheet date, and the reported amounts of revenue and expenses during the reporting period. Actual results could differ from management’s estimates and the results reported should not be regarded as necessarily indicative of results that may be expected for the entire year.

Deutsche Bank Consolidated Financial Statements 78 Interim Report as of March 31, 2015 Impact of Changes in Accounting Principles (unaudited) New Accounting Pronouncements
Impact of Changes in Accounting Principles (unaudited)
Recently Adopted Accounting Pronouncements
The following are those accounting pronouncements which are relevant to the Group and which have been applied in the preparation of these condensed consolidated interim financial statements.
Improvements to IFRS 2010-2012 and 2011-2013 Cycles On January 1, 2015, the Group adopted amendments to multiple IFRS standards, which resulted from the IASB’s annual improvement projects for the 2010-2012 and 2011-2013 cycles. They comprise amendments that result in accounting changes for presentation, recognition or measurement purposes as well as terminol-ogy or editorial amendments related to a variety of individual IFRS standards. The amendments did not have a material impact on the Group’s consolidated financial statements.
New Accounting Pronouncements
IFRS 9 Classification and Measurement, Impairment and Hedge Accounting In July 2014, the IASB issued IFRS 9, which replaces IAS 39, “Financial Instruments: Recognition and Meas-urement”. IFRS 9 introduces new requirements for how an entity should classify and measure financial assets, requires changes to the reporting of ‘own credit’ with respect to issued debt liabilities that are designated at fair value, replaces the current rules for impairment of financial assets and amends the requirements for hedge accounting.
Classification and Measurement of financial assets and liabilities IFRS 9 requires that an entity’s business model and a financial instrument’s contractual cash flows will deter-mine its classification and measurement in the financial statements. Upon initial recognition each financial asset will be classified as either fair value through profit or loss (‘FVTPL’), amortized cost, or fair value through Other Comprehensive Income (‘FVOCI’). As these requirements are different than the assessments under the existing IAS 39 rules, some differences to the classification and measurement of financial assets under IAS 39 are expected.
The classification and measurement of financial liabilities remain largely unchanged under IFRS 9 from current requirements. However, where issued debt liabilities are designated at fair value, the fair value movements attributable to an entity’s own credit risk will be recognized in Other Comprehensive Income rather than in the Statement of Income under IFRS 9.
Impairment of financial assets The impairment rules under IFRS 9 will apply to financial assets that are measured at amortized cost or FVOCI, and off balance sheet lending commitments such as loan commitments and financial guarantees. Impairment will move from a model whereby credit losses are recognized when a ‘trigger’ event occurs under IAS 39 to an expected loss model, where provisions are taken upon initial recognition of the financial asset (or the date that the Group becomes a party to the loan commitment or financial guarantee) based on expectations of potential credit losses at that time.

Deutsche Bank Consolidated Financial Statements 79 Interim Report as of March 31, 2015 Impact of Changes in Accounting Principles (unaudited) New Accounting Pronouncements
The allowance for credit losses provided for on initial recognition will be based on a 12 month expected credit loss basis. Subsequently, at each reporting date, the Group must make an assessment on whether the credit risk of the instrument has increased significantly, in which case, the allowance must reflect the expected credit loss of the financial asset over its lifetime (‘lifetime expected losses’). As a result of the changes to the impair-ment rules, IFRS 9 will result in an increase in subjectivity as allowances will be based on forward-looking, probability-weighted information that is continuously monitored and updated over the life of the financial asset. This is in contrast to impairment recognition under IAS 39 which requires the occurrence of one or more loss events before an allowance is recorded. IFRS 9 is expected to result in an increase in the overall level of im-pairment allowances, due to the requirement to record an allowance equal to 12 month expected credit losses on those instruments whose credit risk has not significantly increased since initial recognition and the likelihood that there will be a larger population of financial assets to which lifetime expected losses applies as compared to the population of financial assets for which loss events have already occurred under IAS 39.
Hedge accounting IFRS 9 also incorporates new hedge accounting rules that intend to align hedge accounting with risk manage-ment practices. Generally, some restrictions under current rules have been removed and a greater variety of hedging instruments and hedged items become available for hedge accounting.
IFRS 9 is effective for annual periods beginning on or after January 1, 2018. The Group is currently assessing the impact of IFRS 9. The standard has yet to be endorsed by the EU.
IFRS 15 Revenue from Contracts with Customers In May 2014, the IASB issued IFRS 15, “Revenue from Contracts with Customers”, which specifies how and when revenue is recognized, but does not impact income recognition related to financial instruments in scope of IFRS 9/IAS 39. IFRS 15 replaces several other IFRS standards and interpretations that currently govern revenue recognition under IFRS and provides a single, principles-based five-step model to be applied to all contracts with customers. The standard also requires entities to provide users of financial statements with more informative and relevant disclosures. IFRS 15 will be effective for annual periods beginning on or after Janu-ary 1, 2017. The Group is currently assessing the impact of IFRS 15. The standard has yet to be endorsed by the EU.
Improvements to IFRS 2012-2014 Cycles In September 2014, the IASB issued amendments to multiple IFRS standards, which resulted from the IASB’s annual improvement project for the 2012-2014 cycles. This comprises amendments that result in accounting changes for presentation, recognition or measurement purposes as well as terminology or editorial amend-ments related to a variety of individual IFRS standards. The amendments will be effective for annual periods beginning on or after January 1, 2016, with early adoption permitted. The Group is currently assessing the impact that the amendments will have on the Group’s consolidated financial statements. The amendments have yet to be endorsed by the EU.
IAS 1 In December 2014, the IASB issued amendments to IAS 1 “Presentation of Financial Statements” as part of an initiative to improve presentation and disclosure in financial reports. These amendments clarify that the princi-ple of materiality is applicable to the whole of the financial statements, professional judgment should be applied in determining disclosures and that inclusion of immaterial data can reduce the effectiveness of disclosures. The amendments will be effective for annual periods beginning on or after January 1, 2016 with early adoption permitted. The amendments to IAS 1 will only have a disclosure impact on the Group. These amendments have yet to be endorsed by the EU.

Deutsche Bank Consolidated Financial Statements 80 Interim Report as of March 31, 2015 Segment Information (unaudited) Segmental Results of Operations
Segment Information (unaudited)
The following segment information has been prepared in accordance with the “management approach”, which requires presentation of the segments on the basis of the internal management reports of the entity which are regularly reviewed by the chief operating decision maker, which is the Deutsche Bank Management Board, in order to allocate resources to a segment and to assess its financial performance.
Starting first quarter 2014, net interest income as a component of net revenue, income (loss) before income taxes and related ratios is presented on a fully taxable-equivalent basis for U.S. tax-exempt securities for CB&S. This enables management to measure performance of taxable and tax-exempt securities on a compa-rable basis. This change in presentation resulted in an increase in CB&S net interest income of € 25.8 million for first quarter 2015 (€ 8.0 million for first quarter 2014). This increase is offset in Group Consolidated figures through a reversal in C&A. The tax rate used in determining the fully taxable-equivalent net interest income in respect of the majority of the US tax-exempt securities is 35 %. US tax-exempt securities held by NCOU are not being presented on a fully taxable-equivalent basis due to differing approaches in the management of core and non-core activities.
From the first quarter 2015 certain revenue and cost items, including bank levies, previously reported in C&A are allocated to the corporate divisions. Bank levies will be allocated over the course of the year. The tax rate applied in calculating post tax return on average active equity for the business divisions has also been updated. Prior year comparative figures have been adjusted to reflect these changes.
Business Segments
The Group’s segment reporting follows the organizational structure as reflected in its internal management reporting systems, which are the basis for assessing the financial performance of the business segments and for allocating resources to the business segments. Generally, restatements due to minor changes in the organ-izational structure were implemented in the presentation of prior period comparables if they were considered in the Group’s management reporting systems.
During the first quarter 2015, the Group has made the following capital expenditures or divestitures:
The Group announced that it has reached an agreement to sell the Fairview Container Terminal in Port of Prince Rupert, Canada, which is a segment of Maher Terminals. Under the transaction, DP World, a Dubai-based marine terminal operator, has agreed to acquire 100 % of the Fairview Container Terminal for € 424 million (CAD 580 million). The transaction is subject to regulatory approvals. Maher Terminals is a legacy asset held within the Non-Core Operations Unit.
Allocation of Average Active Equity
The total amount of average active equity allocated is determined based on the higher of the Group’s overall economic risk exposure or regulatory capital demand. Starting 2015, the Group refined its allocation of average active equity to the business segments to reflect the communicated capital and leverage targets. Under the new methodology, the internal demand for regulatory capital is based on a Common Equity Tier 1 target ratio of 10 % and on a CRD 4 leverage target ratio of 3.5 % both at a Group level and assuming full implementation of CRR/CRD 4 rules. If the Group exceeds the Common Equity Tier 1 target ratio and the CRD 4 leverage target ratio, excess average equity is assigned to C&A. Prior year comparative figures have been adjusted to reflect these changes.
Segmental Results of Operations
For the results of the business segments, including the reconciliation to the consolidated results of operations under IFRS, please see “Management Report: Operating and Financial Review: Results of Operations: Seg-ment Results of Operations” of this Interim Report.

Deutsche Bank Consolidated Financial Statements 81 Interim Report as of March 31, 2015 Information on the Consolidated Income Statement (unaudited) Pensions and Other Post-Employment Benefits
Information on the Consolidated Income Statement (unaudited)
Net Interest Income and Net Gains (Losses) on Financial Assets/Liabilities at Fair Value through Profit or Loss
Three months ended
in € m. Mar 31, 2015 Mar 31, 2014
Net interest income 4,210 3,375 Trading income
1 2,338 1,699 Net gains (losses) on financial assets/liabilities designated at fair value through profit or loss
2 157 (83) Total net gains (losses) on financial assets/liabilities at fair value through profit or loss 2,495 1,616
Total net interest income and net gains (losses) on financial assets/liabilities at fair value through profit or loss 6,705 4,991
Sales & Trading (equity) 838 604 Sales & Trading (debt and other products) 2,676 2,052
Total Sales & Trading 3,514 2,655 Loan products 166 145 Remaining products
3 235 (60) Corporate Banking & Securities 3,915 2,740 Private & Business Clients 1,521 1,533 Global Transaction Banking
4 546 556 Deutsche Asset & Wealth Management 942 332 Non-Core Operations Unit (211) (234) Consolidation & Adjustments (8) 64
Total net interest income and net gains (losses) on financial assets/liabilities at fair value through profit or loss
6,705 4,991 1 Trading income includes gains and losses from derivatives held for trading and from derivatives not qualifying for hedge accounting. 2 Includes gains of € 5 million and of € 1 million from securitization structures for the three months ended March 31, 2015 and March 31, 2014 respectively. Fair
value movements on related instruments of € (1) million and of € 28 million for the three months ended March 31, 2015 and March 31, 2014, respectively, are reported within trading income. Both are reported under Sales & Trading (debt and other products). The total of these gains and losses represents the Group’s share of the losses in these consolidated securitization structures.
3 Includes the net interest spread on loans as well as the fair value changes of credit default swaps and loans designated at fair value through profit or loss. 4 Includes net interest income and net gains (losses) on financial assets/liabilities at fair value through profit or loss on origination, advisory and other products.
Commissions and Fee Income
Three months ended
in € m. Mar 31, 2015 Mar 31, 2014
Commissions and fees from fiduciary activities 1,059 873 Commissions, brokers’ fees, mark-ups on securities underwriting and other securities activities 734 971 Fees for other customer services 1,122 1,195
Total commissions and fee income 2,914 3,038
Pensions and Other Post-Employment Benefits
Three months ended
in € m. Mar 31, 2015 Mar 31, 2014
Service cost 83 67 Net interest cost (income) (1) 0 Total expenses defined benefit plans 82 67
Total expenses for defined contribution plans 114 108
Total expenses for post-employment benefits 196 175
Employer contributions to mandatory German social security pension plan 61 62

Deutsche Bank Consolidated Financial Statements 82 Interim Report as of March 31, 2015 Information on the Consolidated Income Statement (unaudited) Restructuring
The Group expects to pay approximately € 265 million in regular contributions to its retirement benefit plans in 2015. It is not expected that any plan assets will be returned to the Group during the year ending December 31, 2015.
Discount rate to determine defined benefit obligation in % Mar 31, 2015 Dec 31, 2014
Germany 1.4 2.0 UK 3.5 3.7 U.S. 3.7 3.9
General and Administrative Expenses
Three months ended
in € m. Mar 31, 2015 Mar 31, 2014
IT costs 865 804 Occupancy, furniture and equipment expenses 463 551 Professional service fees
1 520 466 Communication and data services
1 203 175 Travel and representation expenses
1 100 109 Banking and transaction charges
1 135 168 Marketing expenses 68 63 Consolidated investments 105 200 Other expenses
1,2 2,610 473
Total general and administrative expenses 5,069 3,010 1 Prior period comparatives have been restated in order to reflect changes in the Group’s cost reporting. 2 Includes litigation-related expenses of € 1,544 million and € 0 million for the three months ended March 31, 2015 and March 31, 2014 as well as bank levy of
€ 561 million and € 34 million for the three months ended March 31, 2015 and March 31, 2014
Restructuring
Restructuring forms part of the Group’s Operational Excellence (OpEx) program. Restructuring expense is comprised of termination benefits, additional expenses covering the acceleration of deferred compensation awards not yet amortized due to the discontinuation of employment and contract termination costs related to real estate.
Net restructuring expense by division Three months ended
in € m. Mar 31, 2015 Mar 31, 2014
Corporate Banking & Securities (22) (44) Private & Business Clients (1) (3) Global Transaction Banking 0 (2) Deutsche Asset & Wealth Management 0 (4) Non-Core Operations Unit 0 (2) Infrastructure/ Regional Management 0 0 Consolidation & Adjustments 0 0
Total Net Restructuring Charges (23) (56)

Deutsche Bank Consolidated Financial Statements 83 Interim Report as of March 31, 2015 Information on the Consolidated Income Statement (unaudited) Effective Tax Rate
Net restructuring expense by type Three months ended
in € m. Mar 31, 2015 Mar 31, 2014
Restructuring - Staff related (23) (56) thereof: Termination Payments (18) (45) Retention Acceleration (5) (10) Social Security (1) 0
Restructuring - Non Staff related
1 0 (1)
Total net restructuring Charges (23) (56) 1 Contract costs, mainly related to real estate and technology.
Provisions for restructuring amounted to € 95 million and € 120 million as of March 31, 2015 and De- cember 31, 2014, respectively. The majority of the current provisions for restructuring are expected to be utilized during 2015.
During the three months ended March 31, 2015, 217 full-time equivalent staff were reduced through restructu-ring. These reductions were identified within:
Three months ended
Mar 31, 2015
Corporate Banking & Securities 59 Private & Business Clients 55 Global Transaction Banking 3 Deutsche Asset & Wealth Management 23 Non-Core Operations Unit 0 Infrastructure/Regional Management 77
Total full-time equivalent staff 217
Effective Tax Rate
Income tax expense in the first quarter 2015 was € 920 million versus € 577 million in the comparative period. The effective tax rate in the current quarter of 62 % was mainly impacted by non tax deductible litigation-related charges. The effective tax rate in the first quarter 2014 was 34 %.

Deutsche Bank Consolidated Financial Statements 84 Interim Report as of March 31, 2015 Information on the Consolidated Balance Sheet (unaudited) Financial Assets Available for Sale
Information on the Consolidated Balance Sheet (unaudited)
Financial Assets/Liabilities at Fair Value through Profit or Loss
in € m. Mar 31, 2015 Dec 31, 2014
Financial assets classified as held for trading:
Trading assets: Trading securities 193,983 177,639 Other trading assets
1 18,202 18,041 Total trading assets 212,185 195,681 Positive market values from derivative financial instruments 746,084 629,958
Total financial assets classified as held for trading 958,269 825,639
Financial assets designated at fair value through profit or loss: Securities purchased under resale agreements 68,481 60,473 Securities borrowed 17,880 20,404 Loans 15,820 15,331 Other financial assets designated at fair value through profit or loss 23,629 21,078
Total financial assets designated at fair value through profit or loss 125,810 117,285
Total financial assets at fair value through profit or loss 1,084,079 942,924 1 Includes traded loans of € 16.3 billion and € 16.7 billion at March 31, 2015 and December 31, 2014, respectively.
in € m. Mar 31, 2015 Dec 31, 2014
Financial liabilities classified as held for trading:
Trading liabilities: Trading securities 53,009 41,112 Other trading liabilities 1,222 731
Total trading liabilities 54,231 41,843 Negative market values from derivative financial instruments 724,120 610,202
Total financial liabilities classified as held for trading 778,351 652,045
Financial liabilities designated at fair value through profit or loss: Securities sold under repurchase agreements 23,892 21,053 Loan commitments 68 99 Long-term debt 10,656 9,919 Other financial liabilities designated at fair value through profit or loss 6,725 6,061
Total financial liabilities designated at fair value through profit or loss 41,340 37,131
Investment contract liabilities
1 9,654 8,523
Total financial liabilities at fair value through profit or loss 829,345 697,699 1 These are investment contracts where the policy terms and conditions result in their redemption values equaling fair values.
Financial Assets Available for Sale
in € m. Mar 31, 2015 Dec 31, 2014
Debt securities 66,975 59,132 Equity securities 1,285 1,283 Other equity interests 1,025 976 Loans 3,051 2,906
Total financial assets available for sale 72,336 64,297
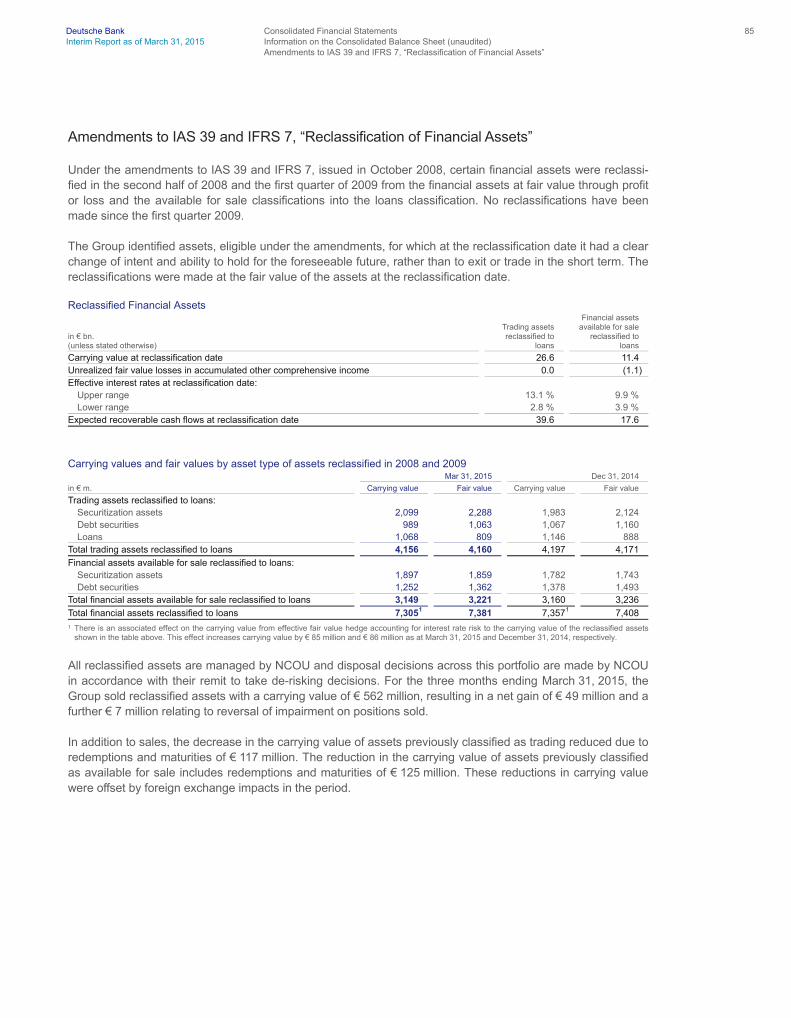
Deutsche Bank Consolidated Financial Statements 85 Interim Report as of March 31, 2015 Information on the Consolidated Balance Sheet (unaudited) Amendments to IAS 39 and IFRS 7, “Reclassification of Financial Assets”
Amendments to IAS 39 and IFRS 7, “Reclassification of Financial Assets”
Under the amendments to IAS 39 and IFRS 7, issued in October 2008, certain financial assets were reclassi-fied in the second half of 2008 and the first quarter of 2009 from the financial assets at fair value through profit or loss and the available for sale classifications into the loans classification. No reclassifications have been made since the first quarter 2009.
The Group identified assets, eligible under the amendments, for which at the reclassification date it had a clear change of intent and ability to hold for the foreseeable future, rather than to exit or trade in the short term. The reclassifications were made at the fair value of the assets at the reclassification date.
Reclassified Financial Assets
in € bn. (unless stated otherwise)
Trading assets reclassified to loans
Financial assets available for sale reclassified to loans
Carrying value at reclassification date 26.6 11.4 Unrealized fair value losses in accumulated other comprehensive income 0.0 (1.1) Effective interest rates at reclassification date:
Upper range 13.1 % 9.9 % Lower range 2.8 % 3.9 %
Expected recoverable cash flows at reclassification date 39.6 17.6
Carrying values and fair values by asset type of assets reclassified in 2008 and 2009 Mar 31, 2015
Dec 31, 2014
in € m. Carrying value Fair value Carrying value Fair value
Trading assets reclassified to loans: Securitization assets 2,099 2,288 1,983 2,124 Debt securities 989 1,063 1,067 1,160 Loans 1,068 809 1,146 888
Total trading assets reclassified to loans 4,156 4,160 4,197 4,171
Financial assets available for sale reclassified to loans: Securitization assets 1,897 1,859 1,782 1,743 Debt securities 1,252 1,362 1,378 1,493
Total financial assets available for sale reclassified to loans 3,149 3,221 3,160 3,236
Total financial assets reclassified to loans 7,305
1 7,381 7,357
1 7,408 1 There is an associated effect on the carrying value from effective fair value hedge accounting for interest rate risk to the carrying value of the reclassified assets
shown in the table above. This effect increases carrying value by € 85 million and € 86 million as at March 31, 2015 and December 31, 2014, respectively.
All reclassified assets are managed by NCOU and disposal decisions across this portfolio are made by NCOU in accordance with their remit to take de-risking decisions. For the three months ending March 31, 2015, the Group sold reclassified assets with a carrying value of € 562 million, resulting in a net gain of € 49 million and a further € 7 million relating to reversal of impairment on positions sold.
In addition to sales, the decrease in the carrying value of assets previously classified as trading reduced due to redemptions and maturities of € 117 million. The reduction in the carrying value of assets previously classified as available for sale includes redemptions and maturities of € 125 million. These reductions in carrying value were offset by foreign exchange impacts in the period.
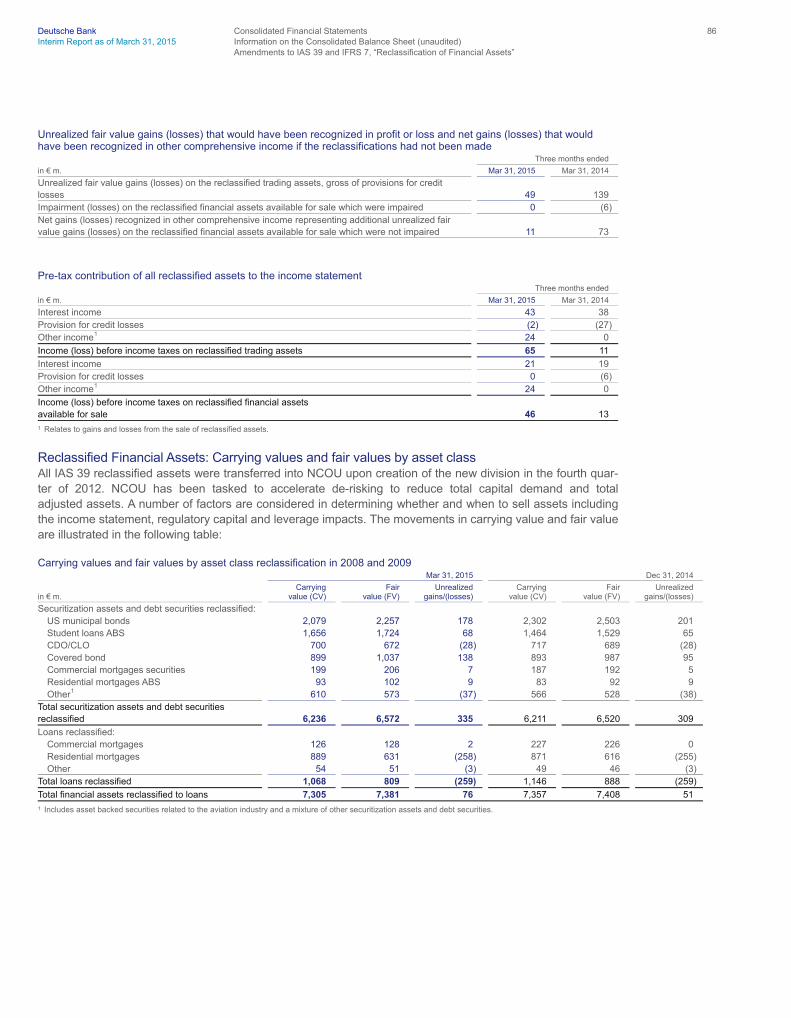
Deutsche Bank Consolidated Financial Statements 86 Interim Report as of March 31, 2015 Information on the Consolidated Balance Sheet (unaudited) Amendments to IAS 39 and IFRS 7, “Reclassification of Financial Assets”
Unrealized fair value gains (losses) that would have been recognized in profit or loss and net gains (losses) that would have been recognized in other comprehensive income if the reclassifications had not been made Three months ended
in € m. Mar 31, 2015 Mar 31, 2014
Unrealized fair value gains (losses) on the reclassified trading assets, gross of provisions for credit losses 49 139 Impairment (losses) on the reclassified financial assets available for sale which were impaired 0 (6) Net gains (losses) recognized in other comprehensive income representing additional unrealized fair value gains (losses) on the reclassified financial assets available for sale which were not impaired
11 73
Pre-tax contribution of all reclassified assets to the income statement Three months ended
in € m. Mar 31, 2015 Mar 31, 2014
Interest income 43 38 Provision for credit losses (2) (27) Other income
1 24 0
Income (loss) before income taxes on reclassified trading assets 65 11
Interest income 21 19 Provision for credit losses 0 (6) Other income
1 24 0
Income (loss) before income taxes on reclassified financial assets available for sale 46 13 1 Relates to gains and losses from the sale of reclassified assets.
Reclassified Financial Assets: Carrying values and fair values by asset class All IAS 39 reclassified assets were transferred into NCOU upon creation of the new division in the fourth quar-ter of 2012. NCOU has been tasked to accelerate de-risking to reduce total capital demand and total adjusted assets. A number of factors are considered in determining whether and when to sell assets including the income statement, regulatory capital and leverage impacts. The movements in carrying value and fair value are illustrated in the following table:
Carrying values and fair values by asset class reclassification in 2008 and 2009 Mar 31, 2015 Dec 31, 2014
in € m. Carrying value (CV)
Fair value (FV)
Unrealized gains/(losses)
Carrying value (CV)
Fair value (FV)
Unrealized gains/(losses)
Securitization assets and debt securities reclassified: US municipal bonds 2,079 2,257 178 2,302 2,503 201 Student loans ABS 1,656 1,724 68 1,464 1,529 65 CDO/CLO 700 672 (28) 717 689 (28) Covered bond 899 1,037 138 893 987 95 Commercial mortgages securities 199 206 7 187 192 5 Residential mortgages ABS 93 102 9 83 92 9 Other
1 610 573 (37) 566 528 (38) Total securitization assets and debt securities reclassified 6,236 6,572 335 6,211 6,520 309
Loans reclassified: Commercial mortgages 126 128 2 227 226 0 Residential mortgages 889 631 (258) 871 616 (255) Other 54 51 (3) 49 46 (3)
Total loans reclassified 1,068 809 (259) 1,146 888 (259)
Total financial assets reclassified to loans 7,305 7,381 76 7,357 7,408 51 1 Includes asset backed securities related to the aviation industry and a mixture of other securitization assets and debt securities.

Deutsche Bank Consolidated Financial Statements 87 Interim Report as of March 31, 2015 Information on the Consolidated Balance Sheet (unaudited) Financial Instruments carried at Fair Value
Financial Instruments carried at Fair Value
Fair Value Hierarchy The financial instruments carried at fair value have been categorized under the three levels of the IFRS fair value hierarchy as follows:
Level 1 – Instruments valued using quoted prices in active markets are instruments where the fair value can be determined directly from prices which are quoted in active, liquid markets and where the instrument observed in the market is representative of that being priced in the Group’s inventory.
These include: government bonds, exchange-traded derivatives and equity securities traded on active, liquid exchanges.
Level 2 – Instruments valued with valuation techniques using observable market data are instruments where the fair value can be determined by reference to similar instruments trading in active markets, or where a tech-nique is used to derive the valuation but where all inputs to that technique are observable.
These include: many OTC derivatives; many investment-grade listed credit bonds; some CDS; many collateral-ized debt obligations (CDO); and many less-liquid equities.
Level 3 – Instruments valued using valuation techniques using market data which is not directly observable are instruments where the fair value cannot be determined directly by reference to market-observable information, and some other pricing technique must be employed. Instruments classified in this category have an element which is unobservable and which has a significant impact on the fair value.
These include: more-complex OTC derivatives; distressed debt; highly-structured bonds; illiquid asset-backed securities (ABS); illiquid CDO’s (cash and synthetic); monoline exposures; some private equity placements; many commercial real estate (CRE) loans; illiquid loans; and some municipal bonds.

Deutsche Bank Consolidated Financial Statements 88 Interim Report as of March 31, 2015 Information on the Consolidated Balance Sheet (unaudited) Financial Instruments carried at Fair Value
Carrying value of the financial instruments held at fair value1
Mar 31, 2015 Dec 31, 2014
in € m.
Quoted prices in active market (Level 1)
Valuation technique observable parameters (Level 2)
Valuation technique unobservable parameters (Level 3)
Quoted prices in active market (Level 1)
Valuation technique observable parameters (Level 2)
Valuation technique unobservable parameters (Level 3)
Financial assets held at fair value: Trading assets 88,074 110,563 13,548 82,020 100,505 13,155
Trading securities 87,529 97,376 9,078 81,789 86,894 8,957 Other trading assets 544 13,188 4,470 232 13,611 4,198
Positive market values from derivative financial instruments 8,498 726,430 11,155 5,439 614,960 9,559 Financial assets designated at fair value through profit or loss 10,061 110,452 5,297 8,826 104,307 4,152 Financial assets available for sale 42,098 25,621 4,616 36,272 23,597 4,427 Other financial assets at fair value 0 4,823
2 0 0 4,335
2 0
Total financial assets held at fair value 148,731 977,890 34,616 132,558 847,705 31,294
Financial liabilities held at fair value:
Trading liabilities 38,349 15,765 117 25,290 16,510 43 Trading securities 38,317 14,575 117 25,244 15,826 43 Other trading liabilities 32 1,190 0 46 685 0
Negative market values from derivative financial instruments 8,796 708,214 7,110 5,890 597,759 6,553 Financial liabilities designated at fair value through profit or loss 0 38,585 2,755 2 34,763 2,366 Investment contract liabilities
3 0 9,654 0 0 8,523 0 Other financial liabilities at fair value 0 8,396
2 (498)
4 0 5,561
2 (552)
4
Total financial liabilities held at fair value 47,146 780,614 9,484 31,181 663,117 8,410 1 Amounts in this table are generally presented on a gross basis, in line with the Group’s accounting policy regarding offsetting of financial instruments, as described in Note 1 “Significant
Accounting Policies and Critical Accounting Estimates” of the Financial Report 2014. 2 Predominantly relates to derivatives qualifying for hedge accounting. 3 These are investment contracts where the policy terms and conditions result in their redemption value equaling fair value. See Note 41 “Insurance and Investment Contracts” of the
Financial Report 2014 for more detail on these contracts. 4 Relates to derivatives which are embedded in contracts where the host contract is held at amortized cost but for which the embedded derivative is separated. The separated embedded
derivatives may have a positive or a negative fair value but have been presented in this table to be consistent with the classification of the host contract. The separated embedded derivatives are held at fair value on a recurring basis and have been split between the fair value hierarchy classifications.
There have been no significant transfers of instruments between level 1 and level 2 of the fair value hierarchy.
Valuation Techniques The following is an explanation of the valuation techniques used in establishing the fair value of the different types of financial instruments that the Group trades.
Sovereign, Quasi-sovereign and Corporate Debt and Equity Securities – Where there are no recent transac-tions then fair value may be determined from the last market price adjusted for all changes in risks and infor-mation since that date. Where a close proxy instrument is quoted in an active market then fair value is determined by adjusting the proxy value for differences in the risk profile of the instruments. Where close prox-ies are not available then fair value is estimated using more complex modeling techniques. These techniques include discounted cash flow models using current market rates for credit, interest, liquidity and other risks. For equity securities modeling techniques may also include those based on earnings multiples.
Mortgage- and Other Asset-Backed Securities (MBS/ABS) include residential and commercial MBS and other ABS including CDOs. ABS have specific characteristics as they have different underlying assets and the issu-ing entities have different capital structures. The complexity increases further where the underlying assets are themselves ABS, as is the case with many of the CDO instruments.
Where no reliable external pricing is available, ABS are valued, where applicable, using either relative value analysis which is performed based on similar transactions observable in the market, or industry standard valuation models incorporating available observable inputs. The industry standard external models calculate principal and interest payments for a given deal based on assumptions that can be independently price tested.

Deutsche Bank Consolidated Financial Statements 89 Interim Report as of March 31, 2015 Information on the Consolidated Balance Sheet (unaudited) Financial Instruments carried at Fair Value
The inputs include prepayment speeds, loss assumptions (timing and severity) and a discount rate (spread, yield or discount margin). These inputs/assumptions are derived from actual transactions, external market research and market indices where appropriate.
Loans – For certain loans fair value may be determined from the market price on a recently occurring transac-tion adjusted for all changes in risks and information since that transaction date. Where there are no recent market transactions then broker quotes, consensus pricing, proxy instruments or discounted cash flow models are used to determine fair value. Discounted cash flow models incorporate parameter inputs for credit risk, interest rate risk, foreign exchange risk, loss given default estimates and amounts utilized given default, as appropriate. Credit risk, loss given default and utilization given default parameters are determined using infor-mation from the loan or CDS markets, where available and appropriate.
Leveraged loans can have transaction-specific characteristics which can limit the relevance of market-observed transactions. Where similar transactions exist for which observable quotes are available from exter-nal pricing services then this information is used with appropriate adjustments to reflect the transaction differ-ences. When no similar transactions exist, a discounted cash flow valuation technique is used with credit spreads derived from the appropriate leveraged loan index, incorporating the industry classification, subordina-tion of the loan, and any other relevant information on the loan and loan counterparty.
Over-The-Counter Derivative Financial Instruments – Market standard transactions in liquid trading markets, such as interest rate swaps, foreign exchange forward and option contracts in G7 currencies, and equity swap and option contracts on listed securities or indices are valued using market standard models and quoted pa-rameter inputs. Parameter inputs are obtained from pricing services, consensus pricing services and recently occurring transactions in active markets wherever possible.
More complex instruments are modeled using more sophisticated modeling techniques specific for the instru-ment and are calibrated to available market prices. Where the model output value does not calibrate to a rele-vant market reference then valuation adjustments are made to the model output value to adjust for any difference. In less active markets, data is obtained from less frequent market transactions, broker quotes and through extrapolation and interpolation techniques. Where observable prices or inputs are not available, man-agement judgment is required to determine fair values by assessing other relevant sources of information such as historical data, fundamental analysis of the economics of the transaction and proxy information from similar transactions.
Financial Liabilities Designated at Fair Value through Profit or Loss under the Fair Value Option – The fair value of financial liabilities designated at fair value through profit or loss under the fair value option incorporates all market risk factors including a measure of the Group’s credit risk relevant for that financial liability. The financial liabilities include structured note issuances, structured deposits, and other structured securities issued by con-solidated vehicles, which may not be quoted in an active market. The fair value of these financial liabilities is determined by discounting the contractual cash flows using the relevant credit-adjusted yield curve. The market risk parameters are valued consistently to similar instruments held as assets, for example, any derivatives embedded within the structured notes are valued using the same methodology discussed in the “Over-The-Counter Derivative Financial Instruments” section above.
Where the financial liabilities designated at fair value through profit or loss under the fair value option are col-lateralized, such as securities loaned and securities sold under repurchase agreements, the credit enhance-ment is factored into the fair valuation of the liability.
Investment Contract Liabilities – Assets which are linked to the investment contract liabilities are owned by the Group. The investment contract obliges the Group to use these assets to settle these liabilities. Therefore, the fair value of investment contract liabilities is determined by the fair value of the underlying assets (i.e., amount payable on surrender of the policies).

Deutsche Bank Consolidated Financial Statements 90 Interim Report as of March 31, 2015 Information on the Consolidated Balance Sheet (unaudited) Financial Instruments carried at Fair Value
Analysis of Financial Instruments with Fair Value Derived from Valuation Techniques Containing Significant Unobservable Parameters (Level 3) Some of the instruments in level 3 of the fair value hierarchy have identical or similar offsetting exposures to the unobservable input. However, according to IFRS they are required to be presented as gross assets and liabilities.
Trading Securities – Certain illiquid emerging market corporate bonds and illiquid highly structured corporate bonds are included in this level of the hierarchy. In addition, some of the holdings of notes issued by securitiza-tion entities, commercial and residential MBS, collateralized debt obligation securities and other ABS are re-ported here. The increase in the quarter was mainly due to a combination of mark-to-market gains and transfers between levels 2 and 3 due to changes in the observability of input parameters used to value these instruments.
Positive and Negative Market Values from Derivative Instruments categorized in this level of the fair value hierarchy are valued based on one or more significant unobservable parameters. The unobservable parame-ters may include certain correlations, certain longer-term volatilities, certain prepayment rates, credit spreads and other transaction-specific parameters.
Level 3 derivatives include customized CDO derivatives in which the underlying reference pool of corporate assets is not closely comparable to regularly market-traded indices; certain tranched index credit derivatives; certain options where the volatility is unobservable; certain basket options in which the correlations between the referenced underlying assets are unobservable; longer-term interest rate option derivatives; multi-currency foreign exchange derivatives; and certain credit default swaps for which the credit spread is not observable.
The increase in the quarter was mainly due to a combination of mark-to-market gains and transfers between levels 2 and 3 due to changes in the observability of input parameters used to value these instruments.
Other Trading Instruments classified in level 3 of the fair value hierarchy mainly consist of traded loans valued using valuation models based on one or more significant unobservable parameters. Level 3 loans comprise illiquid leveraged loans and illiquid residential and commercial mortgage loans. The increase in the quarter was primarily due to purchases and mark-to-market gains on the instruments.
Financial Assets/Liabilities designated at Fair Value through Profit or Loss – Certain corporate loans and struc-tured liabilities which were designated at fair value through profit or loss under the fair value option are catego-rized in this level of the fair value hierarchy. The corporate loans are valued using valuation techniques which incorporate observable credit spreads, recovery rates and unobservable utilization parameters. Revolving loan facilities are reported in the third level of the hierarchy because the utilization in the event of the default pa-rameter is significant and unobservable.
In addition, certain hybrid debt issuances designated at fair value through profit or loss containing embedded derivatives are valued based on significant unobservable parameters. These unobservable parameters include single stock volatility correlations. The increase in assets during the period is primarily due to new issuances and mark-to-market gains on the instruments. For liabilities, the increase was driven by a combination of mark-to-market gains and transfers between levels 2 and 3 due to changes in the observability of input parameters used to value these instruments.
Financial Assets Available for Sale include non-performing loan portfolios where there is no trading intent and unlisted equity instruments where there is no close proxy and the market is very illiquid. The increase in assets during the period was primarily due to purchases and mark-to-market gains on the instruments.
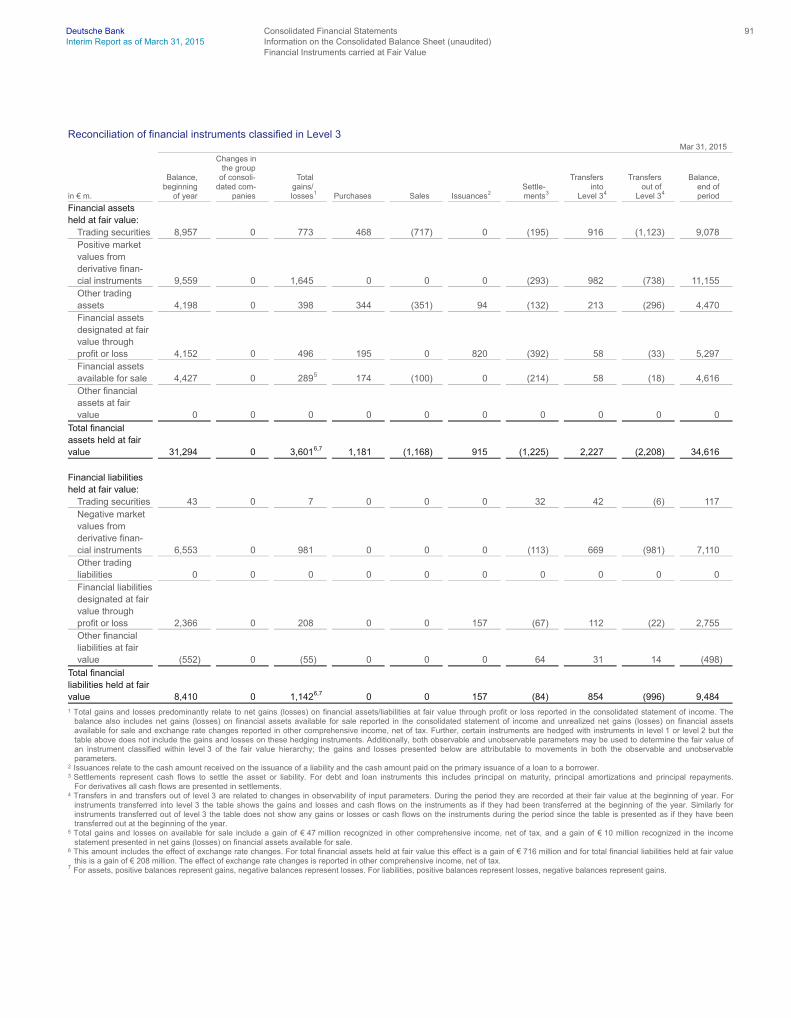
Deutsche Bank Consolidated Financial Statements 91 Interim Report as of March 31, 2015 Information on the Consolidated Balance Sheet (unaudited) Financial Instruments carried at Fair Value
Reconciliation of financial instruments classified in Level 3 Mar 31, 2015
in € m.
Balance, beginning of year
Changes in the group of consoli- dated com- panies
Total gains/ losses
1 Purchases Sales Issuances
2 Settle- ments
3
Transfers into Level 3
4
Transfers out of Level 3
4
Balance, end of period
Financial assets held at fair value:
Trading securities 8,957 0 773 468 (717) 0 (195) 916 (1,123) 9,078 Positive market values from derivative finan- cial instruments 9,559 0 1,645 0 0 0 (293) 982 (738) 11,155 Other trading assets 4,198 0 398 344 (351) 94 (132) 213 (296) 4,470 Financial assets designated at fair value through profit or loss 4,152 0 496 195 0 820 (392) 58 (33) 5,297 Financial assets available for sale 4,427 0 289
5 174 (100) 0 (214) 58 (18) 4,616 Other financial assets at fair value 0 0 0 0 0 0 0 0 0 0
Total financial assets held at fair value 31,294 0 3,601
6,7 1,181 (1,168) 915 (1,225) 2,227 (2,208) 34,616
Financial liabilities held at fair value:
Trading securities 43 0 7 0 0 0 32 42 (6) 117 Negative market values from derivative finan- cial instruments 6,553 0 981 0 0 0 (113) 669 (981) 7,110 Other trading liabilities 0 0 0 0 0 0 0 0 0 0 Financial liabilities designated at fair value through profit or loss 2,366 0 208 0 0 157 (67) 112 (22) 2,755 Other financial liabilities at fair value (552) 0 (55) 0 0 0 64 31 14 (498)
Total financial liabilities held at fair value 8,410 0 1,142
6,7 0 0 157 (84) 854 (996) 9,484 1 Total gains and losses predominantly relate to net gains (losses) on financial assets/liabilities at fair value through profit or loss reported in the consolidated statement of income. The
balance also includes net gains (losses) on financial assets available for sale reported in the consolidated statement of income and unrealized net gains (losses) on financial assets available for sale and exchange rate changes reported in other comprehensive income, net of tax. Further, certain instruments are hedged with instruments in level 1 or level 2 but the table above does not include the gains and losses on these hedging instruments. Additionally, both observable and unobservable parameters may be used to determine the fair value of an instrument classified within level 3 of the fair value hierarchy; the gains and losses presented below are attributable to movements in both the observable and unobservable parameters.
2 Issuances relate to the cash amount received on the issuance of a liability and the cash amount paid on the primary issuance of a loan to a borrower. 3 Settlements represent cash flows to settle the asset or liability. For debt and loan instruments this includes principal on maturity, principal amortizations and principal repayments.
For derivatives all cash flows are presented in settlements. 4 Transfers in and transfers out of level 3 are related to changes in observability of input parameters. During the period they are recorded at their fair value at the beginning of year. For
instruments transferred into level 3 the table shows the gains and losses and cash flows on the instruments as if they had been transferred at the beginning of the year. Similarly for instruments transferred out of level 3 the table does not show any gains or losses or cash flows on the instruments during the period since the table is presented as if they have been transferred out at the beginning of the year.
5 Total gains and losses on available for sale include a gain of € 47 million recognized in other comprehensive income, net of tax, and a gain of € 10 million recognized in the income statement presented in net gains (losses) on financial assets available for sale.
6 This amount includes the effect of exchange rate changes. For total financial assets held at fair value this effect is a gain of € 716 million and for total financial liabilities held at fair value this is a gain of € 208 million. The effect of exchange rate changes is reported in other comprehensive income, net of tax.
7 For assets, positive balances represent gains, negative balances represent losses. For liabilities, positive balances represent losses, negative balances represent gains.

Deutsche Bank Consolidated Financial Statements 92 Interim Report as of March 31, 2015 Information on the Consolidated Balance Sheet (unaudited) Financial Instruments carried at Fair Value
Mar 31, 2014
in € m.
Balance, beginning of year
Changes in the group of consoli- dated com- panies
Total gains/ losses
1 Purchases Sales Issuances
2 Settle- ments
3
Transfers into Level 3
4
Transfers out of Level 3
4
Balance, end of period
Financial assets held at fair value:
Trading securities 6,960 0 123 360 (783) 0 (146) 1,225 (1,224) 6,514 Positive market values from derivative finan- cial instruments 10,556 0 (314) 0 0 0 (210) 1,031 (786) 10,277 Other trading assets 5,065 0 (16) 637 (720) 306 (70) 286 (639) 4,847 Financial assets designated at fair value through profit or loss 3,123 0 24 61 (9) 379 (431) 166 (76) 3,236 Financial assets available for sale 3,329 0 (56)
5 93 (59) 0 (221) 148 (50) 3,183 Other financial assets at fair value
6 1 (1) 0 0 0 0 0 0 0 0
Total financial assets held at fair value 29,033 (1) (240)
7,8 1,150 (1,572) 685 (1,078) 2,856 (2,775) 28,058
Financial liabilities held at fair value:
Trading securities 24 0 0 0 0 0 0 0 (2) 22 Negative market values from derivative finan- cial instruments 8,321 0 (221) 0 0 0 (123) 571 (1,030) 7,517 Other trading liabilities 0 0 0 0 0 0 0 0 0 1 Financial liabilities designated at fair value through profit or loss 1,442 0 (102) 0 0 57 56 663 (51) 2,065 Other financial liabilities at fair value (247) 0 8 0 0 0 (5) 0 191 (53)
Total financial liabilities held at fair value 9,539 0 (315)
7,8 0 0 57 (71) 1,234 (892) 9,552 1 Total gains and losses predominantly relate to net gains (losses) on financial assets/liabilities at fair value through profit or loss reported in the consolidated statement of income. The
balance also includes net gains (losses) on financial assets available for sale reported in the consolidated statement of income and unrealized net gains (losses) on financial assets available for sale and exchange rate changes reported in other comprehensive income, net of tax. Further, certain instruments are hedged with instruments in level 1 or level 2 but the table above does not include the gains and losses on these hedging instruments. Additionally, both observable and unobservable parameters may be used to determine the fair value of an instrument classified within level 3 of the fair value hierarchy; the gains and losses presented below are attributable to movements in both the observable and unobservable parameters.
2 Issuances relate to the cash amount received on the issuance of a liability and the cash amount paid on the primary issuance of a loan to a borrower. 3 Settlements represent cash flows to settle the asset or liability. For debt and loan instruments this includes principal on maturity, principal amortizations and principal repayments.
For derivatives all cash flows are presented in settlements. 4 Transfers in and transfers out of level 3 are related to changes in observability of input parameters. During the period they are recorded at their fair value at the beginning of year. For
instruments transferred into level 3 the table shows the gains and losses and cash flows on the instruments as if they had been transferred at the beginning of the year. Similarly for instruments transferred out of level 3 the table does not show any gains or losses or cash flows on the instruments during the period since the table is presented as if they have been transferred out at the beginning of the year.
5 Total gains and losses on available for sale include a gain of € 10 million recognized in other comprehensive income, net of tax, and a gain of € 1 million recognized in the income statement presented in net gains (losses) on financial assets available for sale.
6 Represents assets held for sale related to BHF-BANK. 7 This amount includes the effect of exchange rate changes. For total financial assets held at fair value this effect is a gain of € 26 million and for total financial liabilities held at fair value this
is a gain of € 3 million. The effect of exchange rate changes is reported in other comprehensive income, net of tax. 8 For assets, positive balances represent gains, negative balances represent losses. For liabilities, positive balances represent losses, negative balances represent gains.

Deutsche Bank Consolidated Financial Statements 93 Interim Report as of March 31, 2015 Information on the Consolidated Balance Sheet (unaudited) Financial Instruments carried at Fair Value
Sensitivity Analysis of Unobservable Parameters Where the value of financial instruments is dependent on unobservable parameter inputs, the precise level for these parameters at the balance sheet date might be drawn from a range of reasonably possible alternatives. In preparing the financial statements, appropriate levels for these unobservable input parameters are chosen so that they are consistent with prevailing market evidence and in line with the Group’s approach to valuation control detailed above. Were the Group to have marked the financial instruments concerned using parameter values drawn from the extremes of the ranges of reasonably possible alternatives then as of March 31, 2015 it could have increased fair value by as much as € 3.4 billion or decreased fair value by as much as € 3.0 billion. As of December 31, 2014 it could have increased fair value by as much as € 3.3 billion or decreased fair value by as much as € 2.9 billion. In estimating these impacts, the Group either re-valued certain financial instru-ments using reasonably possible alternative parameter values, or used an approach based on its valuation adjustment methodology for bid-offer spread valuation adjustments. Bid-offer spread valuation adjustments reflect the amount that must be paid in order to close out a holding in an instrument or component risk and as such they reflect factors such as market illiquidity and uncertainty.
This disclosure is intended to illustrate the potential impact of the relative uncertainty in the fair value of finan-cial instruments for which valuation is dependent on unobservable input parameters. However, it is unlikely in practice that all unobservable parameters would be simultaneously at the extremes of their ranges of reasona-bly possible alternatives. Hence, the estimates disclosed above are likely to be greater than the true uncer-tainty in fair value at the balance sheet date. Furthermore, the disclosure is neither predictive nor indicative of future movements in fair value.
For many of the financial instruments considered here, in particular derivatives, unobservable input parameters represent only a subset of the parameters required to price the financial instrument, the remainder being ob-servable. Hence for these instruments the overall impact of moving the unobservable input parameters to the extremes of their ranges might be relatively small compared with the total fair value of the financial instrument. For other instruments, fair value is determined based on the price of the entire instrument, for example, by adjusting the fair value of a reasonable proxy instrument. In addition, all financial instruments are already car-ried at fair values which are inclusive of valuation adjustments for the cost to close out that instrument and hence already factor in uncertainty as it reflects itself in market pricing. Any negative impact of uncertainty calculated within this disclosure, then, will be over and above that already included in the fair value contained in the financial statements.
Breakdown of the sensitivity analysis by type of instrument1
Mar 31, 2015 Dec 31, 2014
in € m.
Positive fair value movement from using reasonable possible alternatives
Negative fair value movement from using reasonable possible alternatives
Positive fair value movement from using reasonable possible alternatives
Negative fair value movement from using reasonable possible alternatives
Securities: Debt securities 795 721 833 725
Commercial mortgage-backed securities 30 23 57 47 Mortgage and other asset-backed securities 260 253 235 229 Sovereign and quasi sovereign debt obligations 53 53 63 37 Corporate debt securities and other debt obligations 451 392 478 412
Equity securities 124 214 124 224 Derivatives:
Credit 452 543 432 457 Equity 152 107 157 115 Interest related 396 207 392 184 Foreign exchange 6 6 4 2 Other 61 55 75 74
Loans: Loans 1,291 1,107 1,175 988 Loan commitments 5 5 6 5
Other 72 67 79 79
Total 3,355 3,032 3,277 2,854 1 Where the exposure to an unobservable parameter is offset across different instruments then only the net impact is disclosed in the table.

Deutsche Bank Consolidated Financial Statements 94 Interim Report as of March 31, 2015 Information on the Consolidated Balance Sheet (unaudited) Financial Instruments carried at Fair Value
Quantitative Information about the Sensitivity of Significant Unobservable Inputs The behavior of the unobservable parameters on Level 3 fair value measurement is not necessarily independ-ent, and dynamic relationships often exist between the other unobservable parameters and the observable parameters. Such relationships, where material to the fair value of a given instrument, are explicitly captured via correlation parameters, or are otherwise controlled via pricing models or valuation techniques. Frequently, where a valuation technique utilizes more than one input, the choice of a certain input will bound the range of possible values for other inputs. In addition, broader market factors (such as interest rates, equity, credit or commodity indices or foreign exchange rates) can also have effects.
The range of values shown below represents the highest and lowest inputs used to value the significant expo-sures within Level 3. The diversity of financial instruments that make up the disclosure is significant and there-fore the ranges of certain parameters can be large. For example, the range of credit spreads on mortgage backed securities represents performing, more liquid positions with lower spreads then the less liquid, non-performing positions which will have higher credit spreads. As Level 3 contains the less liquid fair value instru-ments, the wide ranges of parameters seen is to be expected, as there is a high degree of pricing differentia-tion within each exposure type to capture the relevant market dynamics. There follows a brief description of each of the principle parameter types, along with a commentary on significant interrelationships between them.
Credit Parameters are used to assess the creditworthiness of an exposure, by enabling the probability of de-fault and resulting losses of a default to be represented. The credit spread is the primary reflection of creditwor-thiness, and represents the premium or yield return above the benchmark reference instrument (typically LIBOR, or relevant Treasury Instrument, depending upon the asset being assessed), that a bond holder would require to allow for the credit quality difference between that entity and the reference benchmark. Higher credit spreads will indicate lower credit quality, and lead to a lower value for a given bond, or other loan-asset that is to be repaid to the Bank by the borrower. Recovery Rates represent an estimate of the amount a lender would receive in the case of a default of a loan, or a bond holder would receive in the case of default of the bond. Higher recovery rates will give a higher valuation for a given bond position, if other parameters are held con-stant. Constant Default Rate (CDR) and Constant Prepayment Rate (CPR) allow more complex loan and debt assets to be assessed, as these parameters estimate the ongoing defaults arising on scheduled repayments and coupons, or whether the borrower is making additional (usually voluntary) prepayments. These parameters are particularly relevant when forming a fair value opinion for mortgage or other types of lending, where re-payments are delivered by the borrower through time, or where the borrower may pre-pay the loan (seen for example in some residential mortgages). Higher CDR will lead to lower valuation of a given loan or mortgage as the lender will ultimately receive less cash.
Interest rates, credit spreads, inflation rates, foreign exchange rates and equity prices are referenced in some option instruments, or other complex derivatives, where the payoff a holder of the derivative will receive is dependent upon the behavior of these underlying references through time. Volatility parameters describe key attributes of option behavior by enabling the variability of returns of the underlying instrument to be assessed. This volatility is a measure of probability, with higher volatilities denoting higher probabilities of a particular outcome occurring. The underlying references (interest rates, credit spreads etc.) have an effect on the valua-tion of options, by describing the size of the return that can be expected from the option. Therefore the value of a given option is dependent upon the value of the underlying instrument, and the volatility of that instrument, representing the size of the payoff, and the probability of that payoff occurring. Where volatilities are high, the option holder will see a higher option value as there is greater probability of positive returns. A higher option value will also occur where the payoff described by the option is significant.
Correlations are used to describe influential relationships between underlying references where a derivative or other instrument has more than one underlying reference. Behind some of these relationships, for example commodity correlation and interest rate-foreign exchange correlations, typically lie macroeconomic factors such as the impact of global demand on groups of commodities, or the pricing parity effect of interest rates on foreign exchange rates. More specific relationships can exist between credit references or equity stocks in the case of credit derivatives and equity basket derivatives, for example. Credit correlations are used to estimate

Deutsche Bank Consolidated Financial Statements 95 Interim Report as of March 31, 2015 Information on the Consolidated Balance Sheet (unaudited) Financial Instruments carried at Fair Value
the relationship between the credit performance of a range of credit names, and stock correlations are used to estimate the relationship between the returns of a range of equities. A derivative with a correlation exposure will be either long- or short-correlation. A high correlation suggests a strong relationship between the underlying references is in force, and this will lead to an increase in value of a long-correlation derivative. Negative corre-lations suggest that the relationship between underlying references is opposing, i.e., an increase in price of one underlying reference will lead to a reduction in the price of the other.
An EBITDA (‘earnings before interest, tax, depreciation and amortization’) multiple approach can be used in the valuation of less liquid securities. Under this approach the enterprise value (‘EV’) of an entity can be esti-mated via identifying the ratio of the EV to EBITDA of a comparable observable entity and applying this ratio to the EBITDA of the entity for which a valuation is being estimated. Under this approach a liquidity adjustment is often applied due to the difference in liquidity between the generally listed comparable used and the company under valuation. A higher EV/EBITDA multiple will result in a higher fair value.
Financial instruments classified in Level 3 and quantitative information about unobservable inputs Mar 31, 2015
Fair value in € m.
(unless stated otherwise) Assets Liabilities Valuation technique(s)
1
Significant unobservable
input(s) (Level 3) Range
Financial instruments held at fair value – held for trading, designated at fair value and available-for-sale:
Mortgage- and other asset-backed securities
Commercial mortgage-backed securities 219 0 Price based Price 0 % 107 %
Discounted cash flow Credit spread (bps) 155 2,730 Mortgage- and other asset-backed securities 2,380 0 Price based Price 0 % 184 %
Discounted cash flow Credit spread (bps) 63 1,659 Recovery rate 0 % 83 % Constant default rate 0 % 16 % Constant prepayment rate 0 % 20 %
Total mortgage- and other asset-backed securities 2,599 0
Debt securities and other debt obligations 5,978 1,487 Price based Price 0 % 345 % Held for trading 5,545 117 Discounted cash flow Credit spread (bps) 9 2,115
Sovereign and quasi sovereign obligations 812 Corporate debt securities and other debt obligations 4,734
Available-for-sale 433 Designated at fair value 0 1,370
Equity securities 1,885 0 Market approach Price per net asset value 40 % 100 %
Held for trading 933 0
Enterprise value/EBITDA (multiple) 1 18
Designated at fair value 33 Available-for-sale 919 Discounted cash flow Weighted average cost capital 8 % 13 %
Loans 12,071 0 Price based Price 0 % 138 % Held for trading 4,415 0 Discounted cash flow Credit spread (bps) 40 3,040 Designated at fair value 4,700 Constant default rate 1 % 21 % Available-for-sale 2,956 Recovery rate 0 % 67 %
Loan commitments 0 67 Discounted cash flow Credit spread (bps) 3 900 Recovery rate 20 % 75 %
Loan pricing model Utilization 0 % 100 % Other financial instruments 928
2 1,318
3 Discounted cash flow IRR 2 % 24 %
Total financial instruments held at fair value 23,461 2,872
1 Valuation technique(s) and subsequently the significant unobservable input(s) relate to the respective total position. 2 Other financial assets include € 55 million of other trading assets, € 564 million of other financial assets designated at fair value and € 309 million other financial assets available for sale. 3 Other financial liabilities include € 1.2 billion of securities sold under repurchase agreements designated at fair value and € 116 million of other financial liabilities designated at fair value.

Deutsche Bank Consolidated Financial Statements 96 Interim Report as of March 31, 2015 Information on the Consolidated Balance Sheet (unaudited) Financial Instruments carried at Fair Value
Dec 31, 2014
Fair value in € m.
(unless stated otherwise) Assets Liabilities Valuation technique(s)
1
Significant unobservable
input(s) (Level 3) Range
Financial instruments held at fair value – held for trading, designated at fair value and available-for-sale:
Mortgage- and other asset-backed securities
Commercial mortgage-backed securities 342 0 Price based Price 0 % 106 %
Discounted cash flow Credit spread (bps) 246 1,375 Mortgage- and other asset-backed securities 2,342 0 Price based Price 0 % 184 %
Discounted cash flow Credit spread (bps) 72 1,648 Recovery rate 0 % 97 % Constant default rate 0 % 13 % Constant prepayment rate 0 % 22 %
Total mortgage- and other asset-backed securities 2,684 0
Debt securities and other debt obligations 5,936 1,202 Price based Price 0 % 286 % Held for trading 5,477 43 Discounted cash flow Credit spread (bps) 32 1,629
Sovereign and quasi sovereign obligations 835 Corporate debt securities and other debt obligations 4,643
Available-for-sale 459 Designated at fair value 0 1,159
Equity securities 1,719 0 Market approach Price per net asset value 49 % 100 %
Held for trading 795 0
Enterprise value/EBITDA (multiple) 1 18
Designated at fair value 29 Available-for-sale 895 Discounted cash flow Weighted average cost capital 6 % 13 %
Loans 10,648 0 Price based Price 0 % 137 % Held for trading 4,148 0 Discounted cash flow Credit spread (bps) 95 3,040 Designated at fair value 3,719 Constant default rate 2 % 21 % Available-for-sale 2,781 Recovery rate 0 % 67 %
Loan commitments 0 87 Discounted cash flow Credit spread (bps) 115 1,000 Recovery rate 20 % 80 %
Loan pricing model Utilization 0 % 100 % Other financial instruments 748
2 1,121
3 Discounted cash flow IRR 2 % 24 %
Total financial instruments held at fair value 21,735 2,409
1 Valuation technique(s) and subsequently the significant unobservable input(s) relate to the respective total position. 2 Other financial assets include € 50 million of other trading assets, € 405 million of other financial assets designated at fair value, € 293 million other financial assets available. 3 Other financial liabilities include € 1 billion of securities sold under repurchase agreements designated at fair value and € 104 million of other financial liabilities designated at fair value.

Deutsche Bank Consolidated Financial Statements 97 Interim Report as of March 31, 2015 Information on the Consolidated Balance Sheet (unaudited) Financial Instruments carried at Fair Value
Mar 31, 2015
Fair value
in € m.
(unless stated otherwise) Assets Liabilities Valuation technique(s)
Significant unobservable
input(s) (Level 3) Range
Financial instruments held at fair value: Market values from derivative financial instruments:
Interest rate derivatives 4,035 2,505 Discounted cash flow Swap rate (bps) 4 2,242 Inflation swap rate (1) % 7 % 0 0 Constant default rate 1 % 27 % 0 0 Constant prepayment rate 2 % 18 % Option pricing model Inflation volatility 0 % 8 % Interest rate volatility 10 % 176 % IR - IR correlation (2) % 100 % Hybrid correlation (70) % 95 %
Credit derivatives 4,297 2,068 Discounted cash flow Credit spread (bps) 2 15,048 Recovery rate 0 % 100 %
Correlation pricing model Credit correlation 0 % 95 %
Equity derivatives 1,289 1,189 Option pricing model Stock volatility 9 % 93 % Index volatility 12 % 78 % Index - index correlation (4) % 98 % Stock - stock correlation 9 % 97 %
FX derivatives 391 426 Option pricing model Volatility 1 % 28 % Other derivatives 1,142 424
1 Discounted cash flow Credit spread (bps) 350 1,500 Option pricing model Index volatility 5 % 98 % Commodity correlation (30) % 90 %
Total market values from derivative financial instruments 11,155 6,612
1 Includes derivatives which are embedded in contracts where the host contract is held at amortized cost but for which the embedded derivative is separated.
Dec 31, 2014
Fair value
in € m.
(unless stated otherwise) Assets Liabilities Valuation technique(s)
Significant unobservable
input(s) (Level 3) Range
Financial instruments held at fair value: Market values from derivative financial instruments:
Interest rate derivatives 3,324 2,211 Discounted cash flow Swap rate (bps) 42 2,418 Inflation swap rate (1) % 8 % 0 0 Constant default rate 2 % 27 % 0 0 Constant prepayment rate 2 % 21 % Option pricing model Inflation volatility 0 % 8 % Interest rate volatility 1 % 101 % IR - IR correlation (2) % 100 % Hybrid correlation (70) % 95 %
Credit derivatives 3,586 1,921 Discounted cash flow Credit spread (bps) 155 9,480 Recovery rate 0 % 100 %
Correlation pricing model Credit correlation 13 % 96 %
Equity derivatives 1,118 1,258 Option pricing model Stock volatility 8 % 84 % Index volatility 8 % 99 % Index - index correlation 48 % 98 % Stock - stock correlation 9 % 95 %
FX derivatives 264 242 Option pricing model Volatility 6 % 26 % Other derivatives 1,267 368
1 Discounted cash flow Credit spread (bps) 44 1,500 Option pricing model Index volatility 7 % 138 % Commodity correlation (30) % 60 %
Total market values from derivative financial instruments 9,559 6,001
1 Includes derivatives which are embedded in contracts where the host contract is held at amortized cost but for which the embedded derivative is separated.
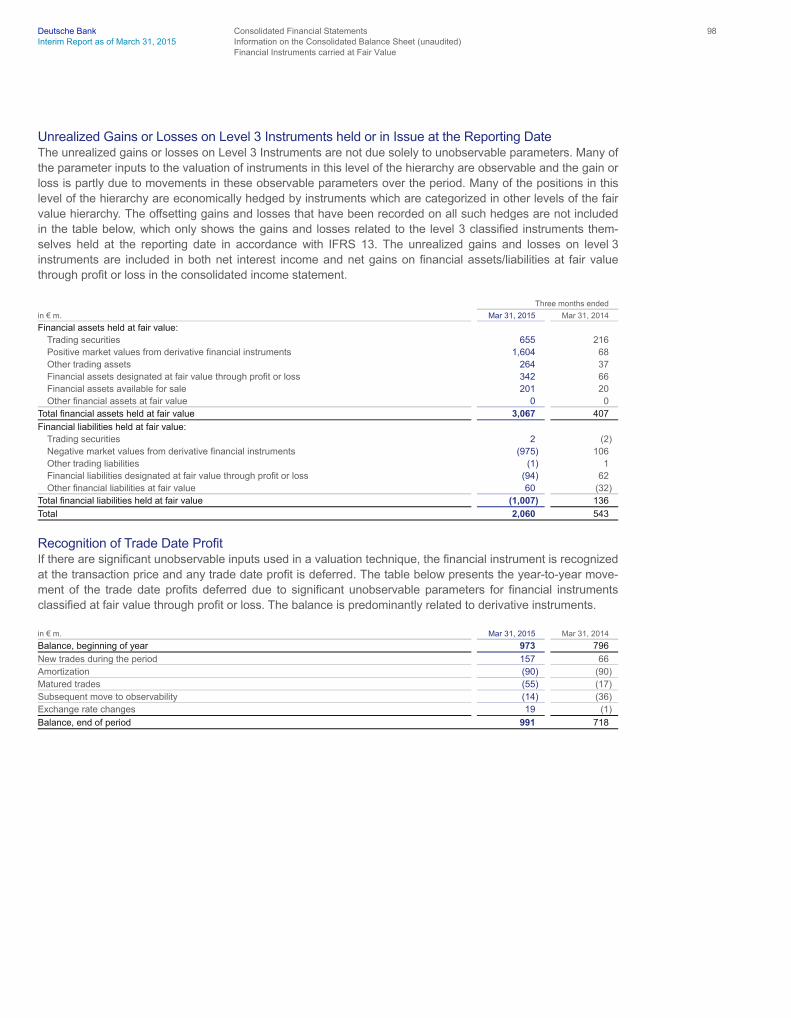
Deutsche Bank Consolidated Financial Statements 98 Interim Report as of March 31, 2015 Information on the Consolidated Balance Sheet (unaudited) Financial Instruments carried at Fair Value
Unrealized Gains or Losses on Level 3 Instruments held or in Issue at the Reporting Date The unrealized gains or losses on Level 3 Instruments are not due solely to unobservable parameters. Many of the parameter inputs to the valuation of instruments in this level of the hierarchy are observable and the gain or loss is partly due to movements in these observable parameters over the period. Many of the positions in this level of the hierarchy are economically hedged by instruments which are categorized in other levels of the fair value hierarchy. The offsetting gains and losses that have been recorded on all such hedges are not included in the table below, which only shows the gains and losses related to the level 3 classified instruments them-selves held at the reporting date in accordance with IFRS 13. The unrealized gains and losses on level 3 instruments are included in both net interest income and net gains on financial assets/liabilities at fair value through profit or loss in the consolidated income statement.
Three months ended
in € m. Mar 31, 2015 Mar 31, 2014
Financial assets held at fair value: Trading securities 655 216 Positive market values from derivative financial instruments 1,604 68 Other trading assets 264 37 Financial assets designated at fair value through profit or loss 342 66 Financial assets available for sale 201 20 Other financial assets at fair value 0 0
Total financial assets held at fair value 3,067 407
Financial liabilities held at fair value: Trading securities 2 (2) Negative market values from derivative financial instruments (975) 106 Other trading liabilities (1) 1 Financial liabilities designated at fair value through profit or loss (94) 62 Other financial liabilities at fair value 60 (32)
Total financial liabilities held at fair value (1,007) 136
Total 2,060 543
Recognition of Trade Date Profit If there are significant unobservable inputs used in a valuation technique, the financial instrument is recognized at the transaction price and any trade date profit is deferred. The table below presents the year-to-year move-ment of the trade date profits deferred due to significant unobservable parameters for financial instruments classified at fair value through profit or loss. The balance is predominantly related to derivative instruments.
in € m. Mar 31, 2015 Mar 31, 2014
Balance, beginning of year 973 796
New trades during the period 157 66 Amortization (90) (90) Matured trades (55) (17) Subsequent move to observability (14) (36) Exchange rate changes 19 (1)
Balance, end of period 991 718

Deutsche Bank Consolidated Financial Statements 99 Interim Report as of March 31, 2015 Information on the Consolidated Balance Sheet (unaudited) Offsetting Financial Assets and Financial Liabilities
Fair Value of Financial Instruments not carried at Fair Value
This section should be read in conjunction with Note 15 “Fair Value of Financial Instruments not carried at Fair Value” of the Group’s Financial Report 2014.
The valuation techniques used to establish fair value for the Group’s financial instruments which are not carried at fair value in the balance sheet are consistent with those outlined in Note 14 “Financial Instruments carried at Fair Value” of the Group’s Financial Report 2014. As described in section “Amendments to IAS 39 and IFRS 7, ‘Reclassification of Financial Assets’”, the Group reclassified certain eligible assets from the trading and available for sale classifications to loans. The Group continues to apply the relevant valuation techniques set out in Note 14 “Financial Instruments carried at Fair Value” of the Group’s Financial Report 2014 to the reclassified assets.
Other financial instruments not carried at fair value are not managed on a fair value basis, for example, retail loans and deposits and credit facilities extended to corporate clients. For these instruments fair values are calculated for disclosure purposes only and do not impact the balance sheet or income statement. Additionally, since the instruments generally do not trade there is significant management judgment required to determine these fair values.
Estimated fair value of financial instruments not carried at fair value on the balance sheet1
Mar 31, 2015 Dec 31, 2014
in € m. Carrying value Fair value Carrying value Fair value
Financial assets: Cash and due from banks 21,645 21,645 20,055 20,055 Interest-earning deposits with banks 70,659 70,659 63,518 63,518 Central bank funds sold and securities purchased under resale agreements 23,393 23,393 17,796 17,796 Securities borrowed 34,515 34,515 25,834 25,834 Loans 428,548 434,530 405,612 410,769 Other financial assets 171,828 171,817 120,838 120,827
Financial liabilities:
Deposits 572,921 572,590 532,931 532,581 Central bank funds purchased and securities sold under repurchase agreements 17,078 17,078 10,887 10,887 Securities loaned 2,816 2,816 2,339 2,339 Other short-term borrowings 39,260 39,246 42,931 42,929 Other financial liabilities 210,362 210,362 159,930 159,930 Long-term debt 157,519 159,100 144,837 146,215 Trust preferred securities 7,979 9,425 10,573 12,251
1 Amounts generally presented on a gross basis, in line with the Group’s accounting policy regarding offsetting of financial instruments as described in Note 1 “Significant Accounting Policies and Critical Accounting Estimates” of the Group’s Financial Report 2014.
Offsetting Financial Assets and Financial Liabilities
The Group is eligible to present certain financial assets and financial liabilities on a net basis on the balance sheet pursuant to criteria described in Note 1 “Significant Accounting Policies and Critical Accounting Esti-mates: Offsetting Financial Instruments” of the Group’s Financial Report 2014.
The following tables provide information on the impact of offsetting on the consolidated balance sheet, as well as the financial impact of netting for instruments subject to an enforceable master netting arrangement or simi-lar agreement as well as available cash and financial instrument collateral.

Deutsche Bank Consolidated Financial Statements 100 Interim Report as of March 31, 2015 Information on the Consolidated Balance Sheet (unaudited) Offsetting Financial Assets and Financial Liabilities
Assets Mar 31, 2015
Amounts not set off on the balance sheet
in € m.
Gross amounts of financial assets
Gross amounts set off on the balance sheet
Net amounts of financial assets pre- sented on the balance sheet
Impact of Master Netting Agreements
Cash collateral
Financial instrument collateral
1 Net amount
Central bank funds sold and securities purchased under resale agreements (enforceable) 25,510 (6,825) 18,685 0 0 (18,649) 36 Central bank funds sold and securities purchased under resale agreements (non-enforceable) 4,709 0 4,709 0 0 (4,159) 550 Securities borrowed (enforceable) 15,213 0 15,213 0 0 (14,649) 564 Securities borrowed (non-enforceable) 19,302 0 19,302 0 0 (18,587) 715 Financial assets at fair value through profit or loss
Trading assets 212,647 (461) 212,185 0 (11) (302) 211,872 Positive market values from derivative financial instruments (enforceable) 939,140 (223,958) 715,182 (603,485) (75,048) (15,322) 21,327 Positive market values from derivative financial instruments (non-enforceable) 30,902 0 30,902 0 0 0 30,902 Financial assets designated at fair value through profit or loss (enforceable) 108,084 (41,358) 66,726 (5,047) (1,759) (50,775) 9,145 Financial assets designated at fair value through profit or loss (non-enforceable) 59,084 0 59,084 0 0 (35,216) 23,868
Total financial assets at fair value through profit or loss 1,349,856 (265,777) 1,084,079 (608,531) (76,819) (101,614) 297,114 Loans 428,613 (65) 428,548 0 (17,306) (50,177) 361,064 Other assets 213,648 (26,089) 187,558 (83,080) (183) (8) 104,286
Thereof: Positive market values from derivatives qualifying for hedge accounting (enforceable) 10,565 (5,672) 4,893 (4,217) 0 0 676
Remaining assets not subject to netting 197,372 0 197,372 0 (573) (460) 196,339
Total assets 2,254,222 (298,757) 1,955,465 (691,612) (94,882) (208,304) 960,668 1 Excludes real estate and other non-financial instrument collateral.
Liabilities Mar 31, 2015
Amounts not set off on the balance sheet
in € m.
Gross amounts of financial liabilities
Gross amounts set off on the balance sheet
Net amounts of financial liabilities pre- sented on the balance sheet
Impact of Master Netting Agreements
Cash collateral
Financial instrument collateral Net amount
Deposit 572,987 (65) 572,921 0 0 0 572,921 Central bank funds purchased and securities sold under repurchase agreements (enforceable) 9,598 (6,825) 2,773 0 0 (2,773) 0 Central bank funds purchased and securities sold under repurchase agreements (non-enforceable) 14,305 0 14,305 0 0 (1,804) 12,501 Securities loaned (enforceable) 2,062 0 2,062 0 0 (2,062) 0 Securities loaned (non-enforceable) 754 0 754 0 0 (223) 531 Financial liabilities at fair value through profit or loss
Trading liabilities 55,214 (983) 54,231 0 0 0 54,231 Negative market values from derivative financial instruments (enforceable) 913,117 (224,418) 688,699 (599,465) (78,863) (10,371) 0 Negative market values from derivative financial instruments (non-enforceable) 35,421 0 35,421 0 0 (8,305) 27,116 Financial liabilities designated at fair value through profit or loss (enforceable) 59,401 (40,377) 19,024 (2,998) 0 (16,026) 0 Financial liabilities designated at fair value through profit or loss (non-enforceable) 31,970 0 31,970 0 (12,214) (5,693) 14,063
Total financial liabilities at fair value through profit or loss 1,095,123 (265,777) 829,345 (602,462) (91,077) (40,395) 95,410 Other liabilities 264,812 (26,089) 238,723 (91,523) 0 0 147,200
Thereof: Negative market values from derivatives qualifying for hedge accounting (enforceable) 13,909 (5,672) 8,237 (8,237) 0 0 0
Remaining liabilities not subject to netting 216,650 0 216,650 0 0 0 216,650
Total liabilities 2,176,291 (298,757) 1,877,533 (693,986) (91,077) (47,257) 1,045,214

Deutsche Bank Consolidated Financial Statements 101 Interim Report as of March 31, 2015 Information on the Consolidated Balance Sheet (unaudited) Offsetting Financial Assets and Financial Liabilities
Assets Dec 31, 2014
Amounts not set off on the balance sheet
in € m.
Gross amounts of financial assets
Gross amounts set off on the balance sheet
Net amounts of financial assets pre- sented on the balance sheet
Impact of Master Netting Agreements
Cash collateral
Financial instrument collateral
1 Net amount
Central bank funds sold and securities purchased under resale agreements (enforceable) 17,051 (2,419) 14,632 0 0 (14,602) 29 Central bank funds sold and securities purchased under resale agreements (non-enforceable) 3,164 0 3,164 0 0 (2,386) 779 Securities borrowed (enforceable) 11,891 0 11,891 0 0 (11,406) 485 Securities borrowed (non-enforceable) 13,943 0 13,943 0 0 (13,294) 649 Financial assets at fair value through profit or loss
Trading assets 196,157 (476) 195,681 0 (11) (1,049) 194,621 Positive market values from derivative financial instruments (enforceable) 823,578 (217,158) 606,421 (519,590) (61,518) (15,330) 9,982 Positive market values from derivative financial instruments (non-enforceable) 23,537 0 23,537 0 0 0 23,537 Financial assets designated at fair value through profit or loss (enforceable) 101,845 (37,075) 64,770 (2,782) (1,924) (50,245) 9,819 Financial assets designated at fair value through profit or loss (non-enforceable) 52,516 0 52,516 0 0 (31,358) 21,158
Total financial assets at fair value through profit or loss 1,197,633 (254,708) 942,924 (522,373) (63,453) (97,982) 259,117 Loans 405,673 (61) 405,612 0 (16,259) (46,112) 343,242 Other assets 157,771 (19,792) 137,980 (67,009) (239) (13) 70,720
Thereof: Positive market values from derivatives qualifying for hedge accounting (enforceable) 10,723 (6,320) 4,403 (3,837) 0 0 566
Remaining assets not subject to netting 178,557 0 178,557 0 (874) (451) 177,231
Total assets 1,985,683 (276,980) 1,708,703 (589,381) (80,825) (186,246) 852,252 1 Excludes real estate and other non-financial instrument collateral.

Deutsche Bank Consolidated Financial Statements 102 Interim Report as of March 31, 2015 Information on the Consolidated Balance Sheet (unaudited) Offsetting Financial Assets and Financial Liabilities
Liabilities Dec 31, 2014
Amounts not set off on the balance sheet
in € m.
Gross amounts of financial liabilities
Gross amounts set off on the balance sheet
Net amounts of financial liabilities pre- sented on the balance sheet
Impact of Master Netting Agreements
Cash collateral
Financial instrument collateral Net amount
Deposit 532,992 (61) 532,931 0 0 0 532,931 Central bank funds purchased and securities sold under repurchase agreements (enforceable) 5,673 (2,419) 3,254 0 0 (2,966) 288 Central bank funds purchased and securities sold under repurchase agreements (non-enforceable) 7,633 0 7,633 0 0 (2,278) 5,356 Securities loaned (enforceable) 1,791 0 1,791 0 0 (1,614) 177 Securities loaned (non-enforceable) 549 0 549 0 0 (209) 339 Financial liabilities at fair value through profit or loss
Trading liabilities 42,960 (1,117) 41,843 0 0 0 41,843 Negative market values from derivative financial instruments (enforceable) 803,073 (217,597) 585,475 (518,364) (63,172) (3,939) 0 Negative market values from derivative financial instruments (non-enforceable) 24,726 0 24,726 0 0 (11,996) 12,731 Financial liabilities designated at fair value through profit or loss (enforceable) 52,517 (35,994) 16,523 (2,782) 0 (13,741) 0 Financial liabilities designated at fair value through profit or loss (non-enforceable) 29,132
1 0 29,132
1 0 (3,130) (5,718) 20,283
1 Total financial liabilities at fair value through profit or loss 952,408
1 (254,708) 697,699
1 (521,146) (66,302) (35,394) 74,856
1 Other liabilities 203,614
1 (19,792) 183,823
1 (71,645) 0 0 112,178
1 Thereof: Negative market values from derivatives qualifying for hedge accounting (enforceable) 11,383 (6,320) 5,063 (5,063) 0 0 0
Remaining liabilities not subject to netting 207,801 0 207,801 0 0 0 207,801
Total liabilities 1,912,461 (276,980) 1,635,481 (592,791) (66,302) (42,460) 933,927 1 Numbers were restated by moving € 67 billion from Financial liabilities at fair value through profit and loss (non-enforceable) to Other liabilities.
The column “Gross amounts set off on the balance sheet” discloses the amounts offset in accordance with all the criteria described in Note 1 “Significant Accounting Policies and Critical Accounting Estimates: Offsetting Financial Instruments” of the Group’s Financial Report 2014.
The column “Impact of Master Netting Agreements” discloses the amounts that are subject to master netting agreements but were not offset because they did not meet the net settlement/simultaneous settlement criteria; or because the rights of off-setting are conditional upon the default of the counterparty only. The amounts pre-sented for other assets and other liabilities include cash margin receivables and payables respectively.
The columns “Cash collateral” and “Financial instrument collateral” disclose the cash and financial instrument collateral amounts received or pledged in relation to the total amounts of assets and liabilities, including those that were not offset.
Non-enforceable master netting agreements refer to contracts executed in jurisdictions where the rights of set off may not be upheld under the local bankruptcy laws.
The cash collateral received against the positive market values of derivatives and the cash collateral pledged towards the negative mark-to-market values of derivatives are booked within the “Other liabilities” and “Other assets” balances respectively.
The Cash and Financial instrument collateral amounts disclosed reflect their fair values. The rights of set off relating to the cash and financial instrument collateral are conditional upon the default of the counterparty.

Deutsche Bank Consolidated Financial Statements 103 Interim Report as of March 31, 2015 Information on the Consolidated Balance Sheet (unaudited) Other Assets and Other Liabilities
Allowance for Credit Losses
Three months ended Mar 31, 2015
Allowance for Loan Losses Allowance for Off-Balance Sheet Positions
in € m. (unless stated otherwise)
Individually assessed
Collectively assessed Subtotal
Individually assessed
Collectively assessed Subtotal Total
Balance, beginning of year 2,364 2,849 5,212 85 141 226 5,439
Provision for credit losses 92 119 211 5 2 7 218 Thereof: (Gains)/Losses from disposal of impaired loans (7) 0 (7) 0 0 0 (7)
Net charge-offs: (103) (100) (202) 0 0 0 (202) Charge-offs (113) (120) (233) 0 0 0 (233) Recoveries 10 21 31 0 0 0 31
Other changes 70 24 94 3 13 15 109
Balance, end of period 2,423 2,892 5,315 93 156 249 5,564
Changes compared to prior year Provision for credit losses
In € m. (5) (25) (30) 0 2 2 (28) In % (5) (17) (13) (8) (5,465) 35 (12)
Net charge-offs In € m. 418 (17) 401 0 0 0 401 In % (80) 20 (67) 0 0 0 (67)
Three months ended Mar 31, 2014
Allowance for Loan Losses Allowance for Off-Balance Sheet Positions
in € m. (unless stated otherwise)
Individually assessed
Collectively assessed Subtotal
Individually assessed
Collectively assessed Subtotal Total
Balance, beginning of year 2,857 2,732 5,589 102 114 216 5,805
Provision for credit losses 97 144 241 6 0 5 246 Thereof: (Gains)/Losses from disposal of impaired loans (4) 0 (4) 0 0 0 (4)
Net charge-offs: (520) (83) (603) 0 0 0 (603) Charge-offs (528) (107) (634) 0 0 0 (634) Recoveries 7 24 31 0 0 0 31
Other changes (13) (5) (18) 0 0 0 (18)
Balance, end of period 2,420 2,788 5,208 107 114 221 5,429
Changes compared to prior year Provision for credit losses
In € m. (137) 33 (103) 3 (9) (5) (108) In % (59) 30 (30) 124 (100) (48) (30)
Net charge-offs In € m. (424) (28) (453) 0 0 0 (453) In % 440 52 300 0 0 0 300
Other Assets and Other Liabilities
Other Assets in € m. Mar 31, 2015 Dec 31, 2014
Brokerage and securities related receivables Cash/margin receivables 82,337 65,096 Receivables from prime brokerage 15,143 10,785 Pending securities transactions past settlement date 7,636 4,741 Receivables from unsettled regular way trades 60,402 34,432
Total brokerage and securities related receivables 165,518 115,054 Accrued interest receivable 2,904 2,791 Assets held for sale 546 180 Other 18,591 19,955
Total other assets 187,558 137,980

Deutsche Bank Consolidated Financial Statements 104 Interim Report as of March 31, 2015 Information on the Consolidated Balance Sheet (unaudited) Shares Issued and Outstanding
Other Liabilities in € m. Mar 31, 2015 Dec 31, 2014
Brokerage and securities related payables Cash/margin payables 90,530 70,558 Payables from prime brokerage 38,126 33,985 Pending securities transactions past settlement date 6,088 3,473 Payables from unsettled regular way trades 58,273 35,195
Total brokerage and securities related payables 193,016 143,210 Accrued interest payable 2,776 2,953 Liabilities held for sale 15 0 Other 42,916 37,659
Total other liabilities 238,723 183,823
Long-Term Debt
in € m. Mar 31, 2015 Dec 31, 2014
Senior debt: Bonds and notes
Fixed rate 92,581 84,795 Floating rate 38,876 34,651
Subordinated debt: Bonds and notes
Fixed rate 3,298 2,689 Floating rate 2,582 2,358
Other 20,183 20,344
Total long-term debt 157,519 144,837
Shares Issued and Outstanding
in million Mar 31, 2015 Dec 31, 2014
Shares issued 1,379.3 1,379.3 Shares in treasury 0.5 0.3
Thereof: Buyback 0.2 0.1 Other 0.3 0.2
Shares outstanding 1,378.8 1,379.0

Deutsche Bank Consolidated Financial Statements 105 Interim Report as of March 31, 2015 Other Financial Information (unaudited) Other Contingencies
Other Financial Information (unaudited)
Credit related Commitments and Contingent Liabilities
In the normal course of business the Group regularly enters into irrevocable lending commitments, including fronting commitments as well as contingent liabilities consisting of financial and performance guarantees, standby letters of credit and indemnity agreements on behalf of its customers. Under these contracts the Group is required to perform under an obligation agreement or to make payments to the beneficiary based on third party’s failure to meet its obligations. For these instruments it is not known to the Group in detail if, when and to what extent claims will be made. In the event that the Group has to pay out cash in respect of its fronting commitments, the Group would immediately seek reimbursement from the other syndicate lenders. The Group considers all the above instruments in monitoring the credit exposure and may require collateral to mitigate inherent credit risk. If the credit risk monitoring provides sufficient perception about a loss from an expected claim, a provision is established and recorded on the balance sheet.
The following table shows the Group’s irrevocable lending commitments and lending related contingent liabili-ties without considering collateral or provisions. It shows the maximum potential utilization of the Group in case all these liabilities entered into must be fulfilled. The table therefore does not show the expected future cash flows from these liabilities as many of them will expire without being drawn and arising claims will be honored by the customers or can be recovered from proceeds of arranged collateral.
in € m. Mar 31, 2015 Dec 31, 2014
Irrevocable lending commitments 169,750 154,446 Contingent liabilities 62,248 62,087
Total 231,999 216,533
Other Contingencies
Litigation The Group operates in a legal and regulatory environment that exposes it to significant litigation risks. As a result, the Group is involved in litigation, arbitration and regulatory proceedings and investigations in Germany and in a number of jurisdictions outside Germany, including the United States, arising in the ordinary course of business. The legal and regulatory claims for which the Group has taken material provisions or for which there are material contingent liabilities that are more than remote are described below; similar matters are grouped together and some matters consist of a number of claims. These and other matters have the potential to result in the imposition of significant financial and other consequences for the Bank. The estimated loss in respect of each, where such an estimate can be made, has not been disclosed for individual matters because the Group has concluded that such disclosure can be expected to seriously prejudice their outcome. Note 29 “Provisions” of the Group’s Financial Report 2014 describes how the Group estimates provisions and expected losses in respect of its contingent liabilities, and the uncertainties and limitations inherent in such process. For these and other matters that may have a significant impact on the Group and for which an estimate can be made, the Group currently estimates that, as of March 31, 2015, the aggregate future loss of which the possibility is more than remote but less than probable is approximately € 3.2 billion (December 31, 2014: € 2.0 billion). This figure includes contingent liabilities on matters where the Group’s potential liability is joint and several and where the Group expects any such liability to be paid by a third party.

Deutsche Bank Consolidated Financial Statements 106 Interim Report as of March 31, 2015 Other Financial Information (unaudited) Other Contingencies
The Group may settle litigation or regulatory proceedings prior to a final judgment or determination of liability. It may do so to avoid the cost, management efforts or negative business, regulatory or reputational conse-quences of continuing to contest liability, even when the Group believes it has valid defenses to liability. It may also do so when the potential consequences of failing to prevail would be disproportionate to the costs of set-tlement. Furthermore, the Group may, for similar reasons, reimburse counterparties for their losses even in situations where it does not believe that it is legally compelled to do so.
Current Individual Proceedings Credit Default Swap Antitrust Matters. On July 1, 2013, the European Commission (EC) issued a Statement of Objections (the “SO”) against Deutsche Bank, Markit Group Limited (Markit), the International Swaps and Derivatives Association, Inc. (ISDA), and twelve other banks alleging anti-competitive conduct under Article 101 of the Treaty on the Functioning of the European Union (TFEU) and Article 53 of the European Economic Area Agreement (the “EEA Agreement”). The SO sets forth preliminary conclusions of the EC that (i) attempts by certain entities to engage in exchange trading of unfunded credit derivatives were foreclosed by improper collective action in the period from 2006 through 2009, and (ii) the conduct of Markit, ISDA, Deutsche Bank and the twelve other banks constituted a single and continuous infringement of Article 101 of the TFEU and Article 53 of the EEA Agreement. If the EC finally concludes that infringement occurred, it may seek to impose fines and other remedial measures on Deutsche Bank, Markit, ISDA and the twelve other banks. Deutsche Bank filed a response contesting the EC’s preliminary conclusions in January 2014. Deutsche Bank and other SO addressees presented orally the key elements of their responses at an oral hearing in May 2014. Following the oral hearing, the EC announced its intention to carry out a further investigation of the facts.
Antitrust Litigation regarding Credit Default Swaps. A multi-district civil class action is currently pending in the United States District Court for the Southern District of New York against Deutsche Bank and numerous other credit default swap (CDS) dealer banks, as well as Markit and ISDA. Plaintiffs filed a second consolidated amended class action complaint on April 11, 2014 alleging that the banks conspired with Markit and ISDA to prevent the establishment of exchange-traded CDS, with the effect of raising prices for over-the-counter CDS transactions. Plaintiffs seek to represent a class of individuals and entities located in the United States or abroad who, during a period from January 1, 2008 through December 31, 2013, directly purchased CDS from or directly sold CDS to the dealer defendants in the United States. Defendants moved to dismiss the second consolidated amended class action complaint on May 23, 2014. On September 4, 2014, the court granted in part and denied in part the motion to dismiss. Discovery on plaintiffs’ remaining claims is ongoing.
Credit Correlation. Certain regulatory authorities are investigating Deutsche Bank’s bespoke credit correlation trading book and certain risks within that book, during the credit crisis. Issues being examined include the methodology used to value positions in the book as well as the robustness of controls governing the applica-tion of valuation methodologies. Deutsche Bank has been in discussions with the SEC staff regarding the reso-lution of its investigation in this matter. There can be no assurance that such a resolution will be achieved.
Dole Food Company. DBSI and Deutsche Bank AG, New York Branch (“DBNY”) have been named as co-defendants in a class action pending in Delaware Court of Chancery that was brought by former shareholders of Dole Food Company, Inc. (“Dole”). Plaintiffs allege that defendant David H. Murdock and certain members of Dole’s board and management (who are also named as defendants) breached their fiduciary duties, and that DBSI and DBNY aided and abetted in those breaches, in connection with Mr. Murdock's privatization of Dole, which closed on November 1, 2013 (the “Transaction”). Plaintiffs claim approximately U.S.$ 642 million in damages and are also seeking an award of interest, disgorgement of any gains by DBSI and DBNY arising out of the Transaction, and costs and disbursements. Trial in this matter commenced on February 23, 2015 and concluded on March 9, 2015. Post-trial briefing in this matter will close on May 29, 2015, and post-trial argu-ment is scheduled for June 18, 2015. DBSI and DBNY are parties to customary indemnity agreements from Dole (and certain of its affiliates) in connection with the Transaction, and DBSI and DBNY have notified Dole (and its relevant affiliates) that they are seeking indemnity.
Deutsche Bank Consolidated Financial Statements 107 Interim Report as of March 31, 2015 Other Financial Information (unaudited) Other Contingencies
Esch Funds Litigation. Sal. Oppenheim jr. & Cie. AG & Co. KGaA (“Sal. Oppenheim”) was prior to its acquisi-tion by Deutsche Bank in 2010 involved in the marketing and financing of participations in closed end real estate funds. These funds were structured as Civil Law Partnerships under German law. Usually, Josef Esch Fonds-Project GmbH performed the planning and project development. Sal. Oppenheim held an indirect inter-est in this company via a joint-venture. In relation to this business a number of civil claims have been filed against Sal. Oppenheim. Some but not all of these claims are also directed against former managing partners of Sal. Oppenheim and other individuals. The claims brought against Sal. Oppenheim relate to investments of originally approximately € 1.1 billion. The investors are seeking to unwind their fund participation and to be indemnified against potential losses and debt related to the investment. The claims are based in part on an alleged failure of Sal. Oppenheim to provide adequate information on related risks and other material aspects important for the investors’ decision. Based on the facts of the individual cases, some courts decided in favor and some against Sal. Oppenheim. Appeals are pending.
FX Investigations and Litigations. Deutsche Bank has received requests for information from certain regulatory and law enforcement agencies globally who are investigating trading, and various other aspects, of the foreign exchange market. The Bank is cooperating with these investigations. Relatedly, Deutsche Bank is conducting its own internal global review of foreign exchange trading and other aspects of its foreign exchange business. In connection with this review, the Bank has taken, and will continue to take, disciplinary action with regards to individuals if merited. Deutsche Bank has also been named as a defendant in four putative class actions – two involving non-U.S. plaintiffs and two involving U.S. plaintiffs -- brought in the United States District Court for the Southern District of New York alleging antitrust claims relating to the alleged manipulation of foreign exchange rates. On January 28, 2015, the federal judge overseeing the class actions granted the motion to dismiss with prejudice in the two actions involving non-U.S. plaintiffs while denying the motion to dismiss in the one action involving U.S. plaintiffs then pending. A non-U.S. plaintiff has appealed the dismissal of his complaint to the U.S. Court of Appeals for the Second Circuit.
High Frequency Trading/Dark Pool Trading. Deutsche Bank has received requests for information from certain regulatory authorities related to high frequency trading and the operation of Deutsche Bank's alternative trading system (“ATS” or “Dark Pool”), SuperX. The Bank is cooperating with these requests. Deutsche Bank was initially named as a defendant in putative class action complaints alleging violations of U.S. securities laws related to high frequency trading, but in their consolidated amended complaint filed September 2, 2014, the plaintiffs did not include Deutsche Bank as a defendant.
Interbank Offered Rates Matters. Deutsche Bank has received subpoenas and requests for information from various regulatory and law enforcement agencies in Europe, North America and Asia/Pacific in connection with industry-wide investigations concerning the setting of London Interbank Offered Rate (LIBOR), Euro Interbank Offered Rate (EURIBOR), Tokyo Interbank Offered Rate (TIBOR) and other interbank offered rates. Deutsche Bank is cooperating with these investigations.
As previously reported, Deutsche Bank reached a settlement with the European Commission on December 4, 2013 as part of a collective settlement to resolve the European Commission’s investigations in relation to anti-competitive conduct in the trading of Euro interest rate derivatives and Yen interest rate derivatives. Under the terms of the settlement agreement, Deutsche Bank agreed to pay € 725 million in total.
On April 23, 2015, Deutsche Bank entered into separate settlements with the U.S. Department of Justice (DOJ), the U.S. Commodity Futures Trading Commission (CFTC), the U.K. Financial Conduct Authority (FCA), and the New York State Department of Financial Services (NYSDFS) to resolve investigations into misconduct con-cerning the setting of LIBOR, EURIBOR, and TIBOR. Under the terms of these agreements, Deutsche Bank agreed to pay penalties of U.S.$ 2.175 billion to the DOJ, CFTC and NYSDFS and GBP 226.8 million to the FCA. The agreements also contained provisions requiring various undertakings with respect to Deutsche Bank’s benchmark rate submissions in the future, as well as provisions requiring the appointment of an inde-pendent corporate monitor. Deutsche Bank was also required to take further disciplinary action against certain employees who were working at the Bank at the time of the agreements.

Deutsche Bank Consolidated Financial Statements 108 Interim Report as of March 31, 2015 Other Financial Information (unaudited) Other Contingencies
As part of the resolution with the DOJ, Deutsche Bank entered into a Deferred Prosecution Agreement with a three-year term pursuant to which it agreed (among other things) to the filing of a two-count criminal Informa-tion in the United States District Court for the District of Connecticut charging Deutsche Bank with one count of wire fraud and one count of price-fixing, in violation of the Sherman Act. As part of the agreement, DB Group Services (UK) Ltd. (an indirectly held, wholly-owned subsidiary of Deutsche Bank) entered into a Plea Agree-ment with the DOJ, pursuant to which the company pled guilty to a one-count criminal Information filed in the same court and charging the company with wire fraud. Deutsche Bank submitted an Offer of Settlement to the CFTC, which was accepted in order to resolve an Order Instituting Proceedings Pursuant to Sections 6(c) and 6(d) of the Commodity Exchange Act, Making Findings, and Imposing Remedial Sanctions. The FCA issued a Final Notice in connection with the resolution of its investigation, and the NYSDFS and Deutsche Bank entered into a Consent Order Under New York Banking Law §§ 44 and 44-a.
Other regulatory investigations of Deutsche Bank concerning the setting of various interbank offered rates remain ongoing, and Deutsche Bank remains exposed to further regulatory action and to civil litigation.
A number of civil actions, including putative class actions, are pending in the U.S. District Court for the South-ern District of New York (SDNY) against Deutsche Bank and numerous other banks. All but two of these ac-tions were filed on behalf of parties who allege that they held or transacted in U.S. dollar LIBOR-based derivatives or other financial instruments and sustained losses as a result of purported manipulation relating to the setting of U.S. dollar LIBOR.
With two exceptions, all of the civil actions pending in the SDNY concerning U.S. dollar LIBOR are being coor-dinated as part of a multidistrict litigation (U.S. dollar LIBOR MDL). In March 2013 and June 2014, the court granted in part and denied in part motions to dismiss addressed to certain of the initially-filed complaints. The court permitted certain Commodity Exchange Act (CEA) claims and state law contract and unjust enrichment claims to proceed, while dismissing certain CEA claims as time-barred and dismissing all of plaintiffs’ federal and state law antitrust claims and claims asserted under the Racketeer Influenced and Corrupt Organizations Act (RICO).
A group of plaintiffs in the U.S. dollar LIBOR MDL who have had their federal antitrust claims dismissed, or who were permitted by the District Court to pursue interlocutory appeals, are pursuing appeals to the U.S. Court of Appeals for the Second Circuit. The Second Circuit granted a motion by defendants to consolidate these ap-peals. (The Second Circuit has denied a request by a separate group of plaintiffs to reinstate their appeal, which was initially dismissed by the Second Circuit as untimely in 2013. That group of plaintiffs has now filed a new notice of appeal, which defendants have moved to dismiss.)
Various plaintiffs proceeding in their individual capacities have filed amended complaints, the parties have briefed motions to dismiss, and the court held oral argument on those motions. Plaintiffs representing putative classes of homeowners and lenders have also filed amended complaints, and the parties have briefed motions to dismiss. The Bank has also filed a motion to dismiss a complaint for lack of personal jurisdiction filed by a putative class of plaintiffs who allegedly transacted in exchange-traded financial instruments referencing U.S. dollar LIBOR. This motion has been fully briefed.
The court in an additional action concerning U.S. dollar LIBOR that was independently pending in the SDNY has granted defendants’ motions to dismiss. The court granted the plaintiff in that action leave to seek to amend its complaint in order to attempt to cure defects with respect to its allegations concerning antitrust injury by June 1, 2015.
Finally, a new civil action concerning U.S. dollar LIBOR was filed on April 16, 2015 and has not yet been as-signed to a judge. The Bank has also been named as a defendant in a civil action pending in the Central Dis-trict of California concerning U.S. dollar LIBOR. The court has granted the Bank’s motion to dismiss and has dismissed the claims asserted against the other defendants in the case as well. The plaintiff is currently pursu-ing an appeal to the Ninth Circuit.

Deutsche Bank Consolidated Financial Statements 109 Interim Report as of March 31, 2015 Other Financial Information (unaudited) Other Contingencies
A putative class action was filed against Deutsche Bank and other banks concerning the alleged manipulation of Yen LIBOR and Euroyen TIBOR. On March 28, 2014, the SDNY court granted defendants’ motions to dis-miss claims asserted under U.S. federal antitrust laws and for unjust enrichment, but denied defendants’ mo-tions as to certain claims asserted under the CEA. On March 31, 2015, the court denied motions to dismiss for lack of personal jurisdiction filed by foreign defendants (including the Bank) that have branch offices in New York and that did not enter into stipulations with the plaintiff specifically addressing defendants’ right to make those motions. On April 15, 2015, defendants (including the Bank) filed a motion requesting that the court re-consider its decision or, in the alternative, allow an immediate interlocutory appeal from its decision to the Sec-ond Circuit. Also on March 31, 2015, the court denied in part and granted in part a motion by the plaintiff to amend his complaint. As is relevant to the Bank, the court denied plaintiff’s requests to assert RICO claims and to add two new named plaintiffs that allegedly transacted in Yen currency futures and forwards. The court has granted the plaintiff leave to move to amend his complaint to add a third new named plaintiff that allegedly transacted in Yen currency forwards with several defendants, including the Bank, and to assert state law con-tract and unjust enrichment claims on this new plaintiff’s behalf. In addition, the court recently confirmed that a stay on discovery will remain in place until May 15, 2015, at which time discovery issues will be referred to a magistrate judge for further proceedings.
Deutsche Bank is also a defendant in a putative class action concerning the alleged manipulation of EURIBOR. The court granted a motion to stay discovery through May 12, 2015. Defendants’ time to respond to the com-plaint has been stayed pending amendments to the complaint. Claims for damages in these cases have been asserted under various legal theories, including violations of the CEA, federal and state antitrust laws, RICO, and other federal and state laws.
Kaupthing CLN Claims. In June 2012, Kaupthing hf, an Icelandic stock corporation, (acting through its winding-up committee) issued Icelandic law clawback claims for approximately € 509 million (plus interest) against Deutsche Bank in both Iceland and England. The claims relate to leveraged credit linked notes (“CLNs”), refer-encing Kaupthing, issued by Deutsche Bank to two British Virgin Island special purpose vehicles (“SPVs”) in 2008. The SPVs were ultimately owned by high net worth individuals. Kaupthing claims to have funded the SPVs and alleges that Deutsche Bank was or should have been aware that Kaupthing itself was economically exposed in the transactions. Kaupthing claims that the transactions are voidable by Kaupthing on a number of alternative grounds, including the ground that the transactions were improper because one of the alleged pur-poses of the transactions was to allow Kaupthing to influence the market in its own CDS (credit default swap) spreads and thereby its listed bonds. Additionally, in November 2012, an English law claim (with allegations similar to those featured in the Icelandic law claims) was commenced by Kaupthing against Deutsche Bank in London. Deutsche Bank filed its defense in the Icelandic proceedings in late February 2013 and continues to defend the claims. In February 2014, both proceedings in England were stayed pending final determination of the Icelandic proceedings. Additionally, in December 2014, the SPVs and their joint liquidators served Deutsche Bank with substantively similar claims arising out of the CLN transactions against Deutsche Bank and other defendants in England. The SPVs’ claims are not expected to increase Deutsche Bank’s overall potential liability in respect of the CLN transactions beyond the amount already claimed by Kaupthing.
Kirch. The public prosecutor’s office in Munich has conducted and is currently conducting criminal investiga-tions in connection with the Kirch case with regard to former Management Board members as well as the cur-rent Management Board members Juergen Fitschen and Dr. Stephan Leithner. The Kirch case involved several civil proceedings between Deutsche Bank AG and Dr. Leo Kirch as well as media companies controlled by him. The key issue was whether an interview given by Dr. Rolf Breuer, then Spokesman of Deutsche Bank’s Management Board, in 2002 with Bloomberg television, during which Dr. Breuer commented on Dr. Kirch’s (and his companies’) inability to obtain financing, caused the insolvency of the Kirch companies. In February 2014, Deutsche Bank and the Kirch heirs reached a comprehensive settlement, which has ended all legal disputes between them.

Deutsche Bank Consolidated Financial Statements 110 Interim Report as of March 31, 2015 Other Financial Information (unaudited) Other Contingencies
The investigation involving current Management Board member Juergen Fitschen and several former Man-agement Board members has been concluded. At the beginning of August 2014, an indictment was filed with the District Court of Munich against Mr. Fitschen and such former Management Board members. The public prosecutor has applied for the court to order Deutsche Bank’s secondary participation in the proceedings in regard to a potential regulatory offence pursuant to Section 30 of the German Regulatory Offences Act. The indictment was served to the former Management Board members, Mr. Fitschen and Deutsche Bank AG in September 2014. On March 2, 2015, the District Court of Munich admitted the indictment and opened the trial against all accused. The court also ordered the secondary participation of Deutsche Bank AG. Trial will start on April 28, 2015 and court dates are currently scheduled until end of September 2015, generally one day per week.
The investigation involving current Management Board member Dr. Stephan Leithner is ongoing.
The allegations of the public prosecutors are that the two current Management Board members failed to cor-rect in a timely manner factual statements made by Deutsche Bank’s litigation counsel in submissions filed in a civil case between Kirch and Deutsche Bank AG before the Munich Higher Regional Court and the Federal Court of Justice, after allegedly having become aware that such statements were not correct. Under German law, a party in a civil litigation is under a statutory duty to make sure all factual statements made by it in court are accurate. The investigation of Dr. Leithner and the indictment of Mr. Fitschen are based on the allegation that (unlike the other current Management Board members of the Bank) they had special knowledge or re-sponsibility in relation to the Kirch case. The indictment regarding former Management Board members is based on the allegation that such former Management Board members gave incorrect testimony to the Munich Higher Regional Court.
The Supervisory Board and the Management Board of the Bank have obtained opinions from an international law firm and a retired president of one of the leading courts of appeal in Germany to the effect that there is no basis for the accusation of criminal wrongdoing made by the public prosecutors against Mr. Fitschen and Dr. Leithner. Deutsche Bank is fully cooperating with the Munich public prosecutor’s office.
KOSPI Index Unwind Matters. Following the decline of the Korea Composite Stock Price Index 200 (“KOSPI 200”) in the closing auction on November 11, 2010 by approximately 2.7 %, the Korean Financial Supervisory Service (“FSS”) commenced an investigation and expressed concerns that the fall in the KOSPI 200 was at-tributable to a sale by Deutsche Bank of a basket of stocks, worth approximately € 1.6 billion, that was held as part of an index arbitrage position on the KOSPI 200. On February 23, 2011, the Korean Financial Services Commission, which oversees the work of the FSS, reviewed the FSS’ findings and recommendations and resolved to take the following actions: (i) to file a criminal complaint to the Korean Prosecutor’s Office for al-leged market manipulation against five employees of the Deutsche Bank group and Deutsche Bank’s subsidi-ary Deutsche Securities Korea Co. (DSK) for vicarious liability; and (ii) to impose a suspension of six months, commencing April 1, 2011 and ending September 30, 2011, of DSK’s business for proprietary trading of cash equities and listed derivatives and DMA (direct market access) cash equities trading, and the requirement that DSK suspend the employment of one named employee for six months. There was an exemption to the busi-ness suspension which permitted DSK to continue acting as liquidity provider for existing derivatives linked securities. On August 19, 2011, the Korean Prosecutor’s Office announced its decision to indict DSK and four employees of the Deutsche Bank group on charges of spot/futures linked market manipulation. The criminal trial commenced in January 2012. A verdict in respect of DSK and one of the four indicted employees may be delivered during 2015. In addition, a number of civil actions have been filed in Korean courts against Deutsche Bank and DSK by certain parties who allege they incurred losses as a consequence of the fall in the KOSPI 200 on November 11, 2010. The claimants are seeking damages with an aggregate claim amount of approxi-mately € 250 million (at present exchange rates) plus interest and costs. These litigations are at various stages of proceedings, with verdicts in some actions possible during 2015.

Deutsche Bank Consolidated Financial Statements 111 Interim Report as of March 31, 2015 Other Financial Information (unaudited) Other Contingencies
Mortgage-Related and Asset-Backed Securities Matters and Investigation. Deutsche Bank, along with certain affiliates (collectively referred in these paragraphs to as “Deutsche Bank”), have received subpoenas and re-quests for information from certain regulators and government entities, including members of the Residential Mortgage-Backed Securities Working Group of the U.S. Financial Fraud Enforcement Task Force, concerning its activities regarding the origination, purchase, securitization, sale and/or trading of mortgage loans, residen-tial mortgage-backed securities (RMBS), commercial mortgage-backed securities (CMBS), collateralized debt obligations, other asset-backed securities and credit derivatives. Deutsche Bank is cooperating fully in re-sponse to those subpoenas and requests for information.
Deutsche Bank has been named as a defendant in a civil action brought by the Commonwealth of Virginia asserting claims for fraud and breach of the Virginia Fraud Against Taxpayers Act as a result of purchases by the Virginia Retirement System (VRS) of RMBS issued or underwritten by Deutsche Bank. Deutsche Bank is one of thirteen financial institutions named as defendants. The complaint alleges damages of U.S.$ 1.15 billion in the aggregate against all defendants but does not specify the damages sought from each defendant. The action was originally filed under seal by a private party and was unsealed on September 16, 2014, after the Attorney General for Virginia decided to intervene in the action. The case is in the early stages, and Deutsche Bank is contesting VRS’s assertion that the Virginia state court can exercise personal jurisdiction over it.
Deutsche Bank has been named as defendant in numerous other civil litigations in connection with its various roles, including issuer or underwriter, in offerings of RMBS and other asset-backed securities. These cases, described below, include putative class action suits, actions by individual purchasers of securities and actions by trustees on behalf of RMBS trusts. Although the allegations vary by lawsuit, these cases generally allege that the RMBS offering documents contained material misrepresentations and omissions, including with regard to the underwriting standards pursuant to which the underlying mortgage loans were issued, or assert that various representations or warranties relating to the loans were breached at the time of origination.
Deutsche Bank is a defendant in putative class actions relating to its role, along with other financial institutions, as underwriter of RMBS issued by IndyMac MBS, Inc. On September 8, 2014, Deutsche Bank, certain other financial institution defendants and lead plaintiffs executed a stipulation to settle the action. On September 30, 2014, the court issued an order certifying the class for settlement and approving notice to the class. On Febru-ary 23, 2015, the court issued an order approving the settlement and dismissing the action. Under the settle-ment, all settling defendants paid a total of U.S.$ 340 million. Deutsche Bank’s portion of the settlement is not material to it. On March 25, 2015, Pacific Investment Management Company, LLC (PIMCO) filed a notice of appeal of the court’s February 23, 2015 order. PIMCO had previously filed an objection to the settlement for the limited purpose of seeking an order clarifying or otherwise narrowing the scope of the release provided in the settlement agreement, which objection was overruled by the court.
Deutsche Bank is a defendant in a putative class action relating to its role, along with other financial institutions, as underwriter of RMBS issued by Novastar Mortgage Corporation. On February 4, 2015, the court issued an order vacating its prior decision that had dismissed five of six RMBS offerings from the case. The court ordered the plaintiffs to amend the operative complaint to include the previously dismissed offerings. Discovery in the action, which had been stayed while the plaintiffs’ motion had been pending, will now resume.
On December 18, 2013, the United States District Court for the Southern District of New York dismissed the claims against Deutsche Bank in a putative class action relating to RMBS issued by Residential Accredit Loans, Inc. and its affiliates.
Deutsche Bank is a defendant in various non-class action lawsuits and arbitrations by alleged purchasers of, and counterparties involved in transactions relating to, RMBS, and their affiliates, including Aozora Bank, Ltd., Commerzbank AG, the Federal Deposit Insurance Corporation (as conservator for Colonial Bank, Franklin Bank S.S.B., Guaranty Bank, Citizens National Bank and Strategic Capital Bank), the Federal Home Loan Bank of Boston, the Federal Home Loan Bank of San Francisco, the Federal Home Loan Bank of Seattle, HSBC Bank USA, National Association (as trustee for certain RMBS trusts), Knights of Columbus, Mass Mu-

Deutsche Bank Consolidated Financial Statements 112 Interim Report as of March 31, 2015 Other Financial Information (unaudited) Other Contingencies
tual Life Insurance Company, Phoenix Light SF Limited (as purported assignee of claims of special purpose vehicles created and/or managed by WestLB AG), Royal Park Investments (as purported assignee of claims of a special-purpose vehicle created to acquire certain assets of Fortis Bank), Sealink Funding Ltd. (as purported assignee of claims of special purpose vehicles created and/or managed by Sachsen Landesbank and its sub-sidiaries), Texas County & District Retirement System and The Charles Schwab Corporation.
On December 18, 2014, a stipulation was filed dismissing with prejudice claims brought against Deutsche Bank by Mass Mutual Life Insurance Company relating to offerings issued by entities affiliated with Country-wide. Deutsche Bank’s understanding is that the dismissal with respect to these offerings was pursuant to a confidential settlement agreement to which Deutsche Bank was not a party. Deutsche Bank remains a defen-dant in separate litigation brought by Mass Mutual Life Insurance Company relating to certificates not issued by entities affiliated with Countrywide.
On January 14, 2015, the court granted Deutsche Bank’s motion to dismiss the action brought against it by Aozora Bank, Ltd., relating to a collateralized debt obligation identified as Blue Edge ABS CDO Ltd. On Febru-ary 17, 2015, Aozora Bank, Ltd. filed a motion to reargue, or, in the alternative, to file an amended complaint. Deutsche Bank has opposed the motion. Deutsche Bank also is a defendant, along with UBS AG and affiliates, in an action brought by Aozora Bank relating to a collateralized debt obligation identified as Brooklyn Struc-tured Finance CDO, Ltd., in which a motion to dismiss currently is pending before the court.
On January 22, 2015, pursuant to a confidential settlement agreement with Deutsche Bank dated January 14, 2015, the Federal Home Loan Bank of San Francisco dismissed with prejudice claims that it had filed against Deutsche Bank relating to seven RMBS offerings. On January 26, 2015, pursuant to a confidential agreement between the Federal Home Loan Bank of San Francisco and Countrywide, the Federal Home Loan Bank of San Francisco entered an order dismissing with prejudice claims brought against Deutsche Bank by the Fed-eral Home Loan Bank of San Francisco relating to 15 offerings issued by entities affiliated with Countrywide. Deutsche Bank’s understanding is that the dismissal with respect to these 15 offerings was pursuant to a con-fidential settlement agreement to which Deutsche Bank was not a party. Deutsche Bank remains a defendant in the case with respect to one RMBS offering and two offerings described as resecuritizations of RMBS certifi-cates. The case is in discovery.
Deutsche Bank and Monarch Alternative Capital LP and certain of its advisory clients and managed invest-ments vehicles (Monarch) reached an agreement on December 18, 2014 to propose a settlement agreement to HSBC Bank USA, National Association (HSBC) to resolve litigation relating to three RMBS trusts. Pursuant to the agreement with Monarch, Monarch requested that HSBC conduct a vote of certificateholders for each of the trusts with respect to the approval or rejection of the proposed settlements. HSBC has notified the relevant certificateholders of the proposed settlement agreements and that it is currently undertaking a review of the proposed agreements and intends to issue future notices to certificateholders regarding the proposed agree-ments shortly. The court has stayed the litigations pending the outcome of the proposed settlements. In the event one or more of the settlements are completed, a substantial portion of the settlement funds paid by Deutsche Bank would be reimbursed by a non-party to the litigation. The net economic impact of the settle-ments is not material to Deutsche Bank.
In the actions against Deutsche Bank solely as an underwriter of other issuers’ RMBS offerings, Deutsche Bank has contractual rights to indemnification from the issuers, but those indemnity rights may in whole or in part prove effectively unenforceable where the issuers are now or may in the future be in bankruptcy or other-wise defunct.
Deutsche Bank has entered into agreements with certain entities that have threatened to assert claims against Deutsche Bank in connection with various RMBS offerings and other related products to toll the relevant stat-utes of limitations. It is possible that these potential claims may have a material impact on Deutsche Bank. In addition, Deutsche Bank has entered into settlement agreements with some of these entities, the financial terms of which are not material to Deutsche Bank.

Deutsche Bank Consolidated Financial Statements 113 Interim Report as of March 31, 2015 Other Financial Information (unaudited) Other Contingencies
Deutsche Bank National Trust Company (“DBNTC”) and Deutsche Bank Trust Company Americas (“DBTCA”) have been sued by investors in civil litigation concerning their roles as trustees of certain RMBS trusts. On June 18, 2014, a group of investors including BlackRock and PIMCO filed a civil action against DBNTC and DBTCA in New York State Supreme Court purportedly on behalf of and for the benefit of 544 private-label RMBS trusts asserting claims for alleged violations of the Trust Indenture Act of 1939 (TIA), breach of contract, breach of fiduciary duty and negligence based on DBNTC and DBTCA’s alleged failure to perform their duties as trustees for the trusts. Plaintiffs later dismissed their state court complaint and refiled an amended complaint in the U.S. District Court for the Southern District of New York (SDNY). On June 18, 2014, Royal Park Invest-ments SA/NV filed a purported class action on behalf of investors in 10 RMBS trusts against DBNTC in the SDNY asserting claims for alleged violations of the TIA, breach of contract and breach of trust based on DBNTC’s alleged failure to perform its duties as trustee for the trusts. DBNTC has moved to dismiss the com-plaint. On November 7, 2014, the National Credit Union Administration Board, as an investor in 121 RMBS trusts, filed a lawsuit in the SDNY, alleging violations of the TIA and the New York Streit Act for DBNTC’s al-leged failure to perform certain purported statutory and contractual duties; on March 5, 2015, plaintiff filed an amended complaint with respect to 97 trusts and adding claims for breach of contract, breach of fiduciary duty, and negligence. On December 23, 2014, certain CDOs that hold RMBS certificates issued by 21 RMBS trusts filed a complaint in the SDNY against DBNTC as trustee of the trusts, asserting claims for violation of the TIA and the Streit Act, breach of contract, breach of fiduciary duty and negligence, based on DBNTC’s alleged failure to perform its duties as trustee for the trusts. On March 24, 2015, six insurance companies including Western & Southern Life Insurance filed suit in Ohio state court against DBNTC and HSBC, in their capacity as RMBS trustees of 18 trusts (12 of which are administered by DBTNC), asserting claims for violation of the TIA and the Streit Act, breach of contract, breach of fiduciary duty, and negligence, based on DBNTC’s and HSBC’s alleged failure to perform their duties as trustees for the trusts.
Precious Metals Investigations and Litigations. Deutsche Bank has received requests for information from certain regulatory and law enforcement authorities who are investigating trading, and various other aspects of, precious metals. The Bank is cooperating with these investigations. Relatedly, Deutsche Bank has been con-ducting its own internal review of precious metals trading and other aspects of its precious metals business. Deutsche Bank is also named as a defendant in several putative class action complaints pending in the United States District Court for the Southern District of New York alleging violations of U.S. antitrust law and the U.S. Commodity Exchange Act related to the alleged manipulation of gold and silver prices through participation in the Gold and Silver Fixes.
Referral Hiring Practices Investigations. Certain regulators are investigating, among other things, Deutsche Bank’s compliance with the Foreign Corrupt Practices Act and other laws with respect to the Bank’s hiring practices related to candidates referred by clients, potential clients and government officials, and its engage-ment of consultants in the Asia/Pacific region. Deutsche Bank is responding to and continuing to cooperate with these investigations.
U.S. Embargoes-Related Matters. Deutsche Bank has received requests for information from certain regulatory and law enforcement agencies concerning its historical processing of U.S. dollar payment orders through U.S. financial institutions for parties from countries subject to U.S. embargo laws. These agencies are investigating whether such processing complied with U.S. federal and state laws. In 2006, Deutsche Bank voluntarily de-cided that it would not engage in new U.S. dollar business with counterparties in Iran, Sudan, North Korea and Cuba and with certain Syrian banks, and to exit existing U.S. dollar business with such counterparties to the extent legally possible. In 2007, Deutsche Bank decided that it would not engage in any new business, in any currency, with counterparties in Iran, Syria, Sudan and North Korea and to exit existing business, in any cur-rency, with such counterparties to the extent legally possible; it also decided to limit its non-U.S. dollar business with counterparties in Cuba. Deutsche Bank is providing information to and otherwise cooperating with the investigating agencies.

Deutsche Bank Consolidated Financial Statements 114 Interim Report as of March 31, 2015 Other Financial Information (unaudited) Related Party Transactions
Mortgage Repurchase Demands From 2005 through 2008, as part of Deutsche Bank’s U.S. residential mortgage loan business, Deutsche Bank sold approximately U.S.$ 84 billion of private label securities and U.S.$ 71 billion of loans through whole loan sales. Deutsche Bank has been presented with demands to repurchase loans from or to indemnify purchasers, investors or financial insurers with respect to losses allegedly caused by material breaches of representations and warranties. Deutsche Bank’s general practice is to process valid repurchase demands that are presented in compliance with contractual rights.
As of March 31, 2015, Deutsche Bank has approximately U.S.$ 4.8 billion of mortgage repurchase demands outstanding and not subject to agreements to rescind (based on original principal balance of the loans). These demands consist primarily of demands made in respect of private label securitizations by the trustees or ser-vicers thereof. Against these outstanding demands, Deutsche Bank recorded provisions of U.S.$ 808 million (€ 752 million) as of March 31, 2015. Deutsche Bank is the beneficiary of indemnity agreements from the origi-nators or sellers of certain of the mortgage loans subject to these demands, with respect to which Deutsche Bank has recognized receivables of U.S.$ 359 million (€ 334 million) as of March 31, 2015. The net provisions against these demands following deduction of such receivables were U.S.$ 449 million (€ 418 million) as of March 31, 2015.
As of March 31, 2015, Deutsche Bank has completed repurchases, obtained agreements to rescind or other-wise settled claims on loans with an original principal balance of approximately U.S.$ 5.3 billion. In connection with those repurchases, agreements and settlements, Deutsche Bank has obtained releases for potential claims on approximately U.S.$ 72.9 billion of loans sold by Deutsche Bank as described above.
Deutsche Bank has entered into agreements with certain entities that have threatened to assert mortgage loan repurchase demands against Deutsche Bank to toll the relevant statutes of limitations. It is possible that these potential demands may have a material impact on Deutsche Bank.
Deutsche Bank anticipates that additional mortgage repurchase demands may be made in respect of mort-gage loans that it has sold, but cannot reliably estimate their timing or amount, which can be influenced by, among other things, court decisions on when the statute of limitations on breaches of representations and warranties accrues including in an appeal pending before the New York Court of Appeal with respect to a resi-dential mortgage-backed security issued by Deutsche Bank.
Related Party Transactions
Transactions with related parties are made in the ordinary course of business and on substantially the same terms, including interest rates and collateral, as those prevailing for comparable transactions with other parties.
Transactions with Key Management Personnel Key management personnel are those persons having authority and responsibility for planning, directing and controlling the activities of Deutsche Bank Group, directly or indirectly. The Group considers the members of the Management Board as currently mandated and the Supervisory Board of the parent company to constitute key management personnel for purposes of IAS 24. Among the Group’s transactions with key management personnel as of March 31, 2015, were loans and commitments of € 5 million and deposits of € 21 million. As of December 31, 2014, there were loans and commitments of € 3 million and deposits of € 16 million among the Group’s transactions with key management personnel. In addition, the Group provides banking services, such as payment and account services as well as investment advice, to key management personnel and their close family members.

Deutsche Bank Consolidated Financial Statements 115 Interim Report as of March 31, 2015 Other Financial Information (unaudited) Related Party Transactions
Transactions with Subsidiaries, Associates and Joint Ventures Transactions between Deutsche Bank AG and its subsidiaries meet the definition of related party transactions. If these transactions are eliminated on consolidation, they are not disclosed as related party transactions. Transactions between the Group and its associated companies and joint ventures and their respective subsidi-aries also qualify as related party transactions.
Loans issued and guarantees granted Associated companies and
other related parties
in € m. Mar 31, 2015 Dec 31, 2014
Loans outstanding, beginning of period 321 357
Loans issued during the period 182 596 Loan repayments during the period 170 657 Changes in the group of consolidated companies 0 (1) Exchange rate changes/other 28 27
Loans outstanding, end of period
1 361 321
Other credit risk related transactions: Allowance for loan losses 3 5 Provision for loan losses 0 0 Guarantees and commitments 225 45 1 Loans past due were € 3 million as of March 31, 2015 and € 3 million as of December 31, 2014. For the above loans, the Group held collateral of € 131 million and
€ 70 million as of March 31, 2015 and December 31, 2014, respectively.
Deposits received Associated companies and
other related parties
in € m. Mar 31, 2015 Dec 31, 2014
Deposits, beginning of period 128 167
Deposits received during the period 345 245 Deposits repaid during the period 359 244 Changes in the group of consolidated companies 0 (43) Exchange rate changes/other 4 4
Deposits, end of period 119 128
Other Transactions Trading assets and positive market values from derivative financial transactions with associated companies amounted to € 123 million as of March 31, 2015, and € 87 million as of December 31, 2014. Trading liabilities and negative market values from derivative financial transactions with associated companies were € 2 million as of March 31, 2015, and € 0 million as of December 31, 2014.
Transactions with Pension Plans The Group has business relationships with a number of its pension plans pursuant to which it provides financial services to these plans, including investment management. Pension funds may hold or trade Deutsche Bank AG shares or securities. As of March 31, 2015, transactions with these plans were not material for the Group.

Deutsche Bank Consolidated Financial Statements 116 Interim Report as of March 31, 2015 Other Financial Information (unaudited) Events after the Reporting Period
Non-Current Assets and Disposal Groups Held for Sale
Within the balance sheet, non-current assets and disposal groups held for sale are reported in Other assets and Other liabilities. This note provides further explanation on the nature and the financial impact of the non-current assets and disposal groups held for sale as of March 31, 2015.
Non-Current Assets and Disposal Groups Held for Sale at the Reporting Date Total assets held for sale amounted to € 546 million as of March 31, 2015 (December 31, 2014: € 180 million) and the disposal groups included liabilities of € 15 million (December 31, 2014: € 0 million).
In the first quarter 2015, the Group classified its investment in the Fairview Container Terminal in Port of Prince Rupert, Canada, which is a segment of Maher Terminals, a multi-user container terminal operator, as a dis-posal group held for sale within the Corporate Division Non-Core Operations Unit. Under the designated dis-posal transaction, DP World, a Dubai-based marine terminal operator, has agreed to acquire 100 % of the Fairview Container Terminal for a consideration of € 424 million (CAD 580 million). The transaction is subject to regulatory approvals and is expected to close within one year. Its classification as a disposal group held for sale did not result in an impairment loss.
As of March 31, 2015 and December 31, 2014, there were no unrealized net gains relating to non-current assets and disposal groups classified as held for sale recognized directly in accumulated other comprehensive income (loss).
Events after the Reporting Period
On April 22, 2015 Deutsche Bank signed an agreement to purchase additional Postbank shares. With this transaction Deutsche Bank’s share in Postbank increases to approximately 97 %. The transaction will result in a net loss of approximately € 93 million in the second quarter of 2015.

Deutsche Bank Other Information (unaudited) 117 Interim Report as of March 31, 2015 Non-GAAP Financial Measures Pre-Tax and Post-Tax Return on Average Active Equity
Other Information (unaudited)
Non-GAAP Financial Measures
This document and other documents the Group has published or may publish contain non-GAAP financial measures. Non-GAAP financial measures are measures of the Group’s historical or future performance, finan-cial position or cash flows that contain adjustments that exclude or include amounts that are included or excluded, as the case may be, from the most directly comparable measure calculated and presented in accor-dance with IFRS in the Group’s financial statements.
Fully loaded CRR/CRD 4 Leverage Ratio As part of its balance sheet management, the Group uses a fully loaded CRR/CRD 4 leverage ratio, which is Tier 1 capital on a fully loaded basis as a percentage of the CRR/CRD 4 exposure measure (which is derived by applying adjustments to IFRS total assets). Such non-GAAP financial measure is described in “Manage-ment Report: Risk Report: Balance Sheet Management”.
Pre-Tax and Post-Tax Return on Average Active Equity The pre-tax return on average active equity non-GAAP financial measure is based on IBIT attributable to Deutsche Bank shareholders, as a percentage of the Group’s average active equity, both as defined below.
The post-tax return on both average shareholders’ equity and average active equity at the Group level reflects the reported effective tax rate for the Group, which was 62 % for the three months ended March 31, 2015 and 34 % for the prior year’s quarter. For the post-tax return on average active equity of the segments, the applied tax rate was 35 % for the three months ended March 31, 2015, and 35 % for the three months ended March 31, 2014.
IBIT attributable to Deutsche Bank Shareholders: The IBIT attributable to Deutsche Bank shareholders non-GAAP financial measure is based on income (loss) before income taxes as follows:
Three months ended
in € m. Mar 31, 2015 Mar 31, 2014
Income (loss) before income taxes (IBIT) 1,479 1,680 Less income (loss) before income taxes attributable to noncontrolling interests (16) (20)
IBIT attributable to Deutsche Bank shareholders 1,464 1,660
Average Active Equity: The Group calculates active equity to make comparisons to its competitors easier and refers to active equity in several ratios. However, active equity is not a measure provided for in IFRS and the Group’s ratios based on average active equity should not be compared to other companies’ ratios without considering differences in the calculations. The Group adjusts the average shareholders’ equity for average dividends, for which a proposal is accrued on a quarterly basis and which are paid after the approval at the Annual General Meeting each year.
Three months ended
in € m. Mar 31, 2015 Mar 31, 2014
Average shareholders’ equity 71,153 55,348
1
Average dividend accruals (1,164) (860)
Average active equity 69,990 54,488 1 Average shareholders’ equity was restated by € (6) million.

Deutsche Bank Other Information (unaudited) 118 Interim Report as of March 31, 2015 Non-GAAP Financial Measures Book Value and Tangible Book Value per Basic Share Outstanding
Pre-tax and post-tax returns on average active equity are presented below. For comparison, also presented are the pre-tax and post-tax returns on average shareholders’ equity, which are defined as IBIT and net income, respectively, attributable to Deutsche Bank shareholders, as a percentage of average shareholders’ equity.
Three months ended
in % Mar 31, 2015 Mar 31, 2014
Pre-tax return on average shareholders’ equity 8.2 12.0 Pre-tax return on average active equity 8.4 12.2 Post-tax return on average shareholders’ equity 3.1 7.8 Post-tax return on average active equity 3.1 8.0 Post-tax return on average tangible shareholders' equity Post-tax return on average tangible shareholders' equity is calculated as net income (loss) attributable to Deutsche Bank shareholders as a percentage of average tangible shareholders' equity. Net income (loss) attributable to Deutsche Bank shareholders is defined as net income (loss) excluding post-tax income (loss) attributable to noncontrolling interests. Tangible shareholders' equity is the shareholders’ equity per balance sheet excluding goodwill and other intangible assets.
Three months ended
in € m. (unless stated otherwise) Mar 31, 2015 Mar 31, 2014
Average shareholders’ equity
1 71,153 55,348 Average goodwill and other intangible assets (15,462) (13,963) Average tangible shareholders’ equity 55,691 41,385 Net income (loss)
2 559 1,103 Net income attributable to noncontrolling interests (16) (20) Net income attributable to Deutsche Bank shareholders 544 1,083 Post-tax return on average tangible shareholders’ equity (in %) 3.9 10.5 1 Average tangible shareholders’ equity is calculated as last four months average of tangible shareholders’ equity. 2 For the Group, calculation is based on an effective tax rate of 62 % for three months ended March 31, 2015 and 34 % for three months ended March 31, 2014.
Book Value and Tangible Book Value per Basic Share Outstanding Book value per basic share and tangible book value per basic share are non-GAAP financial measures that are used and relied upon by investors and industry analysts as capital adequacy metrics. Book value per basic share represents the Bank’s total shareholders’ equity divided by the number of basic shares outstanding at period-end. Tangible book value represents the Bank’s total shareholders’ equity less goodwill and other intan-gible assets. Tangible book value per basic share is computed by dividing tangible book value by period-end basic shares outstanding.
Tangible Book Value in € m. Mar 31, 2015 Dec 31, 2014
Total shareholders’ equity (Book value) 72,979 68,351
Goodwill and other intangible assets (15,802) (14,951)
Tangible shareholders’ equity (Tangible book value) 57,177 53,400

Deutsche Bank Other Information (unaudited) 119 Interim Report as of March 31, 2015 Non-GAAP Financial Measures Valuation Adjustments
Basic Shares Outstanding in million (unless stated otherwise)
Mar 31, 2015
Dec 31, 2014
Number of shares issued 1,379.3 1,379.3 Treasury shares (0.5) (0.3) Vested share awards 6.9 6.8
Basic shares outstanding 1,385.7 1,385.8
Book value per basic share outstanding in € 52.67 49.32
Tangible book value per basic share outstanding in € 41.26 38.53
Cost-income ratio (adjusted) and Post-tax return on average active equity (adjusted) Deutsche Bank reports at a Group level cost-income ratio (adjusted) and post-tax return on average active equity (adjusted), both of which are non-GAAP financial measures. Post-tax return on average active equity (adjusted) is also reported for the CB&S Corporate Division.
Cost-income ratio (adjusted) is calculated by dividing adjusted cost base (described below) by net reve-nues (reported).
Post-tax return on average active equity (adjusted) is calculated by dividing net income attributable to Deutsche Bank shareholders (adjusted) (described below) by average active equity (described above).
Adjusted cost base is a non-GAAP financial measure most directly comparable to the IFRS financial measure noninterest expenses. Adjusted cost base is calculated by adjusting noninterest expenses under IFRS for (i) the costs-to-achieve (CtA) of the Group’s Operational Excellence (OpEx) program, (ii) other severances, (iii) policyholder benefits and claims, (iv) litigation expenses, (v) impairment of goodwill and other intangible assets and (vi) other divisional-specific cost items.
IBIT attributable to Deutsche Bank shareholders (adjusted) is a non-GAAP financial measure most directly comparable to the IFRS financial measure income before income taxes (IBIT). It is calculated by adjusting IBIT attributable to Deutsche Bank shareholders (which, as described above, is itself a non-GAAP financial meas-ure based on income before income taxes (IBIT) under IFRS) for (i) CRR/CRD 4 CVA (mark-to-market move-ments on related hedges), DVA and FVA, (ii) OpEx CtA, (iii) other severances, (iv) litigation expenses and (v) impairment of goodwill and other intangible assets.
Net income attributable to Deutsche Bank shareholders (adjusted) is a non-GAAP financial measure most directly comparable to the IFRS financial measure net income. It is calculated by adjusting IBIT attributable to Deutsche Bank shareholders (adjusted) for the income tax expense (benefit) impact for the period.
Valuation Adjustments The reconciliation for determining adjusted Group and CB&S IBIT and Net Income identifies the Credit Valua-tion Adjustment (CVA), the Debt Valuation Adjustment (DVA) and the Funding Valuation Adjustment (FVA) as adjusting items.
As described in Note 14 ‘Financial Instruments Carried at Fair Value’ of the Group’s Financial Report 2014, CVA is applied to derivative positions and is determined by assessing the potential credit exposure to a given counterparty. The calculation of CVA takes into account any collateral held, the effect of netting agreements, expected loss given default and the credit risk, based on available market information, including credit default swap spreads.

Deutsche Bank Other Information (unaudited) 120 Interim Report as of March 31, 2015 Non-GAAP Financial Measures Valuation Adjustments
CVA under the CRR/CRD 4 capital rules increases the Group’s Risk Weighted Asset (RWAs). The Group has sought to mitigate these CVA RWA through hedging with credit derivatives. These regulatory hedges are addi-tional to those entered into to hedge CVA exposures under IFRS hedge accounting rules, and accordingly, result in mark-to-market movements in profit and loss that are reported as a revenue item. These CVA regula-tory hedge-related movements are identified in the reconciling items in the calculation of adjusted IBIT and net income as “CVA”.
DVA incorporates the impact of the Group’s own credit risk in the fair valuing of financial liabilities, including derivative contracts. Profit and loss movements resulting from DVA are identified in the reconciling items in the calculation of adjusted IBIT and net income as “DVA”.
FVA is applied to derivative positions that are not wholly collateralized. It reflects the market implied funding costs on both assets and liabilities and has the effect of incorporating the present value of funding costs into the fair value of derivative positions that are not wholly collateralized. Profit and loss movements resulting from FVA are identified in the reconciling items in the calculation of adjusted IBIT and net income as “FVA”.
The Group believes that the presentation of these measures excluding the impact of these items provides a more meaningful depiction of the underlying fundamentals of its businesses impacted by such items.
Reconciliation of the movement of reported to adjusted parameters Three months ended
in € m. Mar 31, 2015 Mar 31, 2014
(unless stated otherwise) CB&S Group CB&S Group
Net revenues (reported) 4,654 10,376 4,042 8,392 Valuation Adjustments (CVA/DVA/FVA)
1 (226) (298) 3 (101) Net revenues (adjusted) 4,880 10,674 4,039 8,493
Noninterest expenses (reported) (3,959) (8,678) (2,566) (6,466)
Cost-to-Achieve
2 (70) (208) (111) (310) Other Severance (24) (44) (12) (27) Policyholder benefits and claims 0 (153) 0 (52) Litigation (1,161) (1,544) 18 0 Impairment of Goodwill & Intangibles 0 0 0 0 Other disclosed cost specific items (11) (31) 0 (85) Adjusted cost base (2,693) (6,699) (2,462) (5,992)
Income (loss) before income taxes (reported) 643 1,479 1,439 1,680
Income (loss) before income taxes attributable to noncontrolling interests
3 0 (16) 0 (20)
IBIT attributable to Deutsche Bank shareholders 643 1,464 1,439 1,660
Valuation Adjustments (CVA/DVA/FVA)
1 (226) (298) 3 (101) Cost-to-Achieve
2 (70) (208) (111) (310) Other Severance (24) (44) (12) (27) Litigation (1,161) (1,544) 18 0 Impairment of Goodwill & Intangibles 0 0 0 0 IBIT attributable to Deutsche Bank shareholders (adjusted) 2,124 3,558 1,540 2,097
Cost/income ratio (reported) 84 % 77 %
Cost/income ratio (adjusted) 65 % 71 %
Average Active Equity (three month ended) 30,595 69,990 20,937 54,488
Post-tax return on average active equity based on net income (loss) (reported)
4 5 % 3 % 18 % 8 %
Post-tax return on average active equity based on net income (loss) (adjusted)
4,5 18 % 13 % 19 % 10 % 1 CRR/CRD 4 Credit Valuation Adjustment (CVA), Debt Valuation Adjustment (DVA), Funding Valuation Adjustment (FVA). 2 Includes CtA related to Postbank, Investment and OpEx. 3 Within income before income taxes of the Segments, noncontrolling interests are reflected as expenses. 4 Based on net income (loss) attributable to Deutsche Bank shareholders. 5 For the Group, calculation is based on an adjusted tax rate of 35 % for three months ended March 31, 2015 and 34 % for three months ended March 31, 2014. For
CB&S calculation is based on an adjusted tax rate of 34 % for three months ended March 31, 2015 and 34 % for three months ended March 31, 2014.
Deutsche Bank Impressum 121 Interim Report as of March 31, 2015
Deutsche Bank Aktiengesellschaft Taunusanlage 12 60262 Frankfurt am Main Germany Telephone: +49 69 9 10-00 [email protected] Investor Relations: +49 69 9 10-3 80 80 [email protected] The Interim Report on the Internet: www.db.com/1Q2015
Publication Published on April 27, 2015.
Cautionary statement regarding forward-looking statements
This report contains forward-looking statements. Forward-looking statements are statements that are not historical facts; they include statements about our beliefs and expectations and the assumptions underlying them. These statements are based on plans, estimates and projections as they are currently available to the management of Deutsche Bank. Forward-looking statements therefore speak only as of the date they are made, and we undertake no obligation to update publicly any of them in light of new information or future events.
By their very nature, forward-looking statements involve risks and uncertainties. A number of im-portant factors could therefore cause actual results to differ materially from those contained in any forward-looking statement. Such factors include the conditions in the financial markets in Germany, in Europe, in the United States and elsewhere from which we derive a substantial portion of our revenues and in which we hold a substantial portion of our assets, the development of asset prices and market volatility, potential defaults of borrowers or trading counterparties, the implementation of our strategic initiatives, the reliability of our risk management policies, procedures and methods, and other risks referenced in our filings with the U.S. Securities and Exchange Commission. Such factors are described in detail in our SEC Form 20-F of March 20, 2015 under the heading “Risk Factors”.
Impressum

The cover photo shows Jonathan Mariner, Chief Investment Officer, Major League Baseball, New York.More information on our annual reporting and statements made by representatives of our stakeholders can be found under www.db.com/14.
May 21, 2015Annual General Meeting in the Festhalle Frankfurt am Main (Exhibition Center)
May 22, 2015Dividend payment
July 30, 2015Interim Report as of June 30, 2015
October 28, 2015Interim Report as of September 30, 2015
2015 Financial Calendar
January 28, 2016Preliminary results for the 2015 financial year
March 15, 2016Annual Report 2015 and Form 20-F
April 28, 2016Interim Report as of March 31, 2016
May 19, 2016Annual General Meeting in the Festhalle Frankfurt am Main (Exhibition Center)
May 20, 2016Dividend payment
July 28, 2016Interim Report as of June 30, 2016
October 27, 2016Interim Report as of September 30, 2016
2016 Financial Calendar