Interim Presentation Second Quarter 2014€¦ · • Record company working interest (CWI) ......
20
Second Quarter 2014 Interim Presentation
Transcript of Interim Presentation Second Quarter 2014€¦ · • Record company working interest (CWI) ......
Second Quarter 2014 Interim Presentation

Operational Review
Interim Presentation 2014 - Second Quarter 2
Bijan Mossavar-Rahmani, Executive Chairman
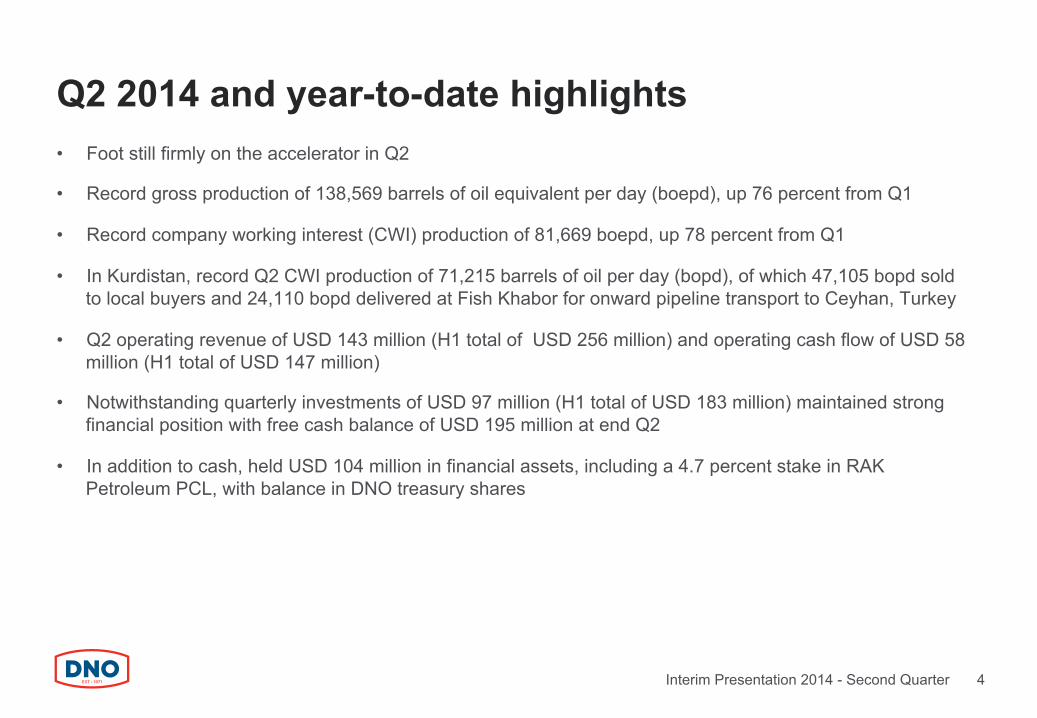
Q2 2014 and year-to-date highlights • Foot still firmly on the accelerator in Q2
• Record gross production of 138,569 barrels of oil equivalent per day (boepd), up 76 percent from Q1
• Record company working interest (CWI) production of 81,669 boepd, up 78 percent from Q1
• In Kurdistan, record Q2 CWI production of 71,215 barrels of oil per day (bopd), of which 47,105 bopd sold to local buyers and 24,110 bopd delivered at Fish Khabor for onward pipeline transport to Ceyhan, Turkey
• Q2 operating revenue of USD 143 million (H1 total of USD 256 million) and operating cash flow of USD 58 million (H1 total of USD 147 million)
• Notwithstanding quarterly investments of USD 97 million (H1 total of USD 183 million) maintained strong financial position with free cash balance of USD 195 million at end Q2
• In addition to cash, held USD 104 million in financial assets, including a 4.7 percent stake in RAK Petroleum PCL, with balance in DNO treasury shares
Interim Presentation 2014 - Second Quarter 4

CWI production
Interim Presentation 2014 - Second Quarter 5
4,537 10,661
7,006
15,690
24,527 27,807
47,105
9,226
27,960 12,776
7,835
24,110
5,745 10,736
7,597
7,691
7,749 6,720
4,999 4,143 3,907
2,505
2,764
21,512 17,381
39,965 38,354 39,170
45,744
81,669
,0
10,000
20,000
30,000
40,000
50,000
60,000
70,000
80,000
90,000
2009 2010 2011 2012 2013 Q1 2014 Q2 2014
Kurdistan local sales Oman Yemen Kurdistan volumes delivered at Fish Khabor for transport to Ceyhan
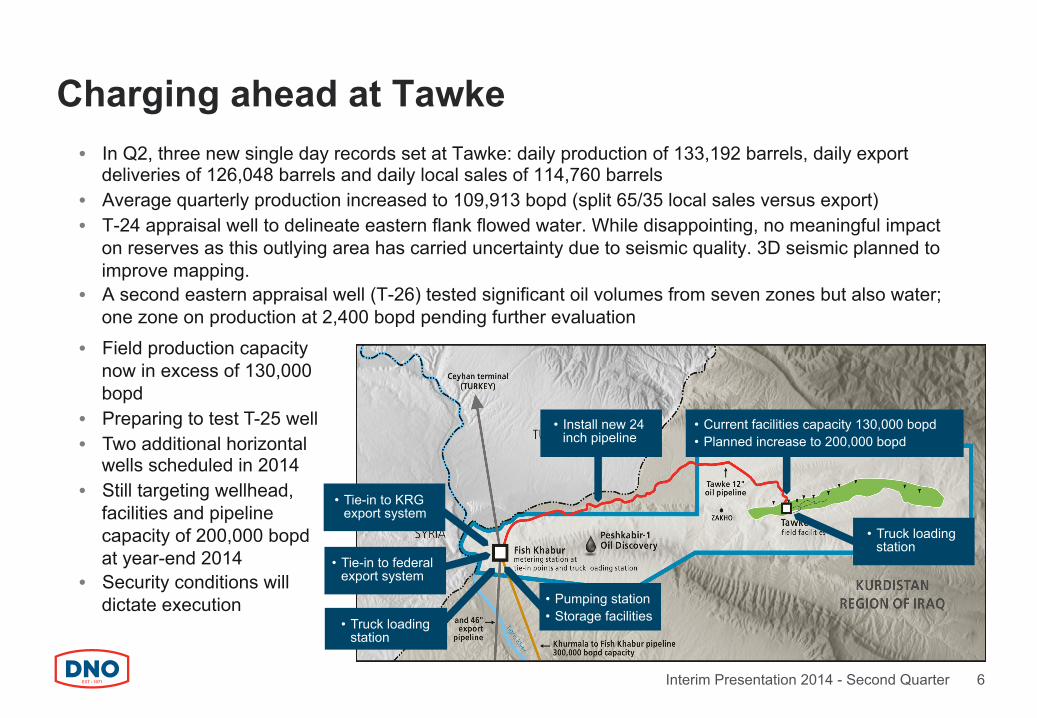
Charging ahead at Tawke • In Q2, three new single day records set at Tawke: daily production of 133,192 barrels, daily export
deliveries of 126,048 barrels and daily local sales of 114,760 barrels • Average quarterly production increased to 109,913 bopd (split 65/35 local sales versus export) • T-24 appraisal well to delineate eastern flank flowed water. While disappointing, no meaningful impact
on reserves as this outlying area has carried uncertainty due to seismic quality. 3D seismic planned to improve mapping.
• A second eastern appraisal well (T-26) tested significant oil volumes from seven zones but also water; one zone on production at 2,400 bopd pending further evaluation
Interim Presentation 2014 - Second Quarter 6
• Truck loading station
• Tie-in to KRG export system
• Field production capacity now in excess of 130,000 bopd
• Preparing to test T-25 well • Two additional horizontal
wells scheduled in 2014 • Still targeting wellhead,
facilities and pipeline capacity of 200,000 bopd at year-end 2014
• Security conditions will dictate execution
• Tie-in to federal export system
• Install new 24 inch pipeline
• Current facilities capacity 130,000 bopd • Planned increase to 200,000 bopd
• Truck loading station
• Pumping station • Storage facilities

Dohuk license • Sales of gas from the Summail field to the Dohuk power
plant commenced in late May and currently average 40 mmcf/d from first well
• Second well suspended for further evaluation and stimulation
• Third Summail well drilled and preparing to test • Summail production rates and pressure levels running
below plan; reviewing possible changes to field development plan
Erbil license • Continuing development of Benenan and Bastora heavy
oil fields • Completed testing of Benenan-3 well in Jurassic Najmeh
formation and commenced initial sales • Benenan-4 well tests confirm material in-place volumes
and moveable Najmeh oil deeper than in other Benenan wells
Dohuk and Erbil update
Interim Presentation 2014 - Second Quarter 7

Oman Block 8 • West Bukha-5 well returned to service following
extensive workover and tested 2,600 bopd and 10 mmcf/d of gas, increasing Block 8 deliveries to around 10,000 bopd and 45 mmcf/d
• New development well planned in 2015
Oman Block 36 • Work program established for new 18,000 sq km
exploration license, including data reprocessing, new seismic acquisition and three well exploration program beginning Q2 2015
Oman and UAE
Interim Presentation 2014 - Second Quarter 8
Producing block Appraisal/development block Exploration block
UAE RAK Onshore • Farm down completed to Edison, commenced data reprocessing and preparing new seismic
campaign in 2015
UAE RAK Offshore • Artificial lift study in process for Wasia reservoir in the Saleh field

Yemen and Tunisia Yemen • Labor union strike ended after ten days, minor
production effect • Q2 CWI production averaged 2,764 bopd • Civil unrest continues to delay drilling and
development activity
Interim Presentation 2014 - Second Quarter 9
Producing block Appraisal/development block Exploration block
Tunisia Sfax offshore permit • Renewed exploration phase with two commitment
wells to be drilled in 2015 • Sfax 3D seismic campaign to launch in Q3 • Secured rig to drill Jawhara-3 well in Q4

Drilling activity overview
10
Country Well name DNO interest Q2 Q3 Q4 Q1 Q2 Tawke-24 55.00 %
Tawke-26 55.00 %
Tawke-25 55.00 %
Tawke-28 55.00 %
Tawke-27 55.00 %
Summail-2 40.00 %
Hawler-1S/T 40.00 %
Tasour-28 38.95 %
Yaalen-4S2 40.00 %
Nabrajah-18S/S2 40.00 %
Country Well name DNO interest Gross unrisked MMboe Q2 Q3 Q4 Q1 Q2
Peshkabir-2 55.00 % 225
Tawke - 31 Jurassic 55.00 % 150
Peshkabir-1 S/T 55.00 % -
Meshga-2 38.95 % 7
Gabdain-3 18.00 % 55
Meshga-3 38.95 % -
Oman Block 36 1, 2 and 3 75.00 % 100
Tunisia Jawhara-3 87.50 % 30
Total 567
Kurdistan
Yemen
2014 2015
Kurdistan
Production and development drilling schedule
Yemen
Exploration and appraisal drilling schedule 2014 2015
Exploration well Appraisal well Production / development well

Expanding a successful MENA franchise DNO present in MENA since 1998 • MENA offers significant oil and gas potential • Notwithstanding the challenges of operating in a region in ongoing turmoil • Staying ahead of our competition – and ahead of the opportunities • Unique portfolio of 20 exploration, development and production assets in six countries • DNO ranks fourth in market capitalization among European listed E&P companies but number
two in 2P reserves
Monetizing existing assets • Maintaining lead position in Kurdistan in 2P reserves, production and export infrastructure • Production from seven fields in Oman and Yemen contributes about a quarter to a third of overall
oil and gas revenues
And continuing to build a platform for future growth • Developing significant heavy oil discoveries in Kurdistan • Early stage exploration in new block in Oman • Initiating exploration and appraisal drilling in Tunisia • Rationalizing and diversifying portfolio through farm-ins and farm-outs • Actively pursuing new business in current and new countries of operations
Interim Presentation 2014 - Second Quarter 11

Continuing commitment to Kurdistan • This past quarter marked the 10th anniversary of DNO’s entry into Kurdistan • First Western exploration and production company in the region when security conditions were
challenging like today, albeit different in scope and source • Moreover, the oil industry services sector was undeveloped and DNO resorted to importing its own drilling
rigs and even a small refinery to produce diesel for field operations • So DNO better positioned to adapt to recent developments on the ground • Responded to the recent crisis by enhancing security protocols, retaining key operational staff and
reinforcing management team with resources from Oslo and Dubai • Operations at Tawke field have continued without interruption and Tawke expansion program on track
though recognize timing of some projects across our three Kurdistan blocks likely impacted by developments beyond our control
• A number of services companies, equipment suppliers, drillers and other contractors have evacuated personnel and suspended Kurdistan operations
• Shifting to work even more closely with local companies • Also, closely monitoring developments on export of Kurdistan oil to international markets and have
received green light from the Kurdistan Regional Government to pursue independent exports
Interim Presentation 2014 - Second Quarter 12

Financial Review
Interim Presentation 2014 - Second Quarter 13
Haakon Sandborg, CFO

Interim Presentation 2014 - Second Quarter 14
Financial results – key figures
Netback (USD Million) Revenues (USD Million) Operating profit (USD Million)
* Includes value of treasury shares at market price and RAK Petroleum PCL shares at fair value
• Q2 revenues up 27 percent on increased production
• Increase in netback to USD 101 million in Q2
• YTD financial results do not include contribution of value from Tawke oil exports
0
20
40
60
80
100
120
140
Q2 13 Q3 13 Q4 13 Q1 14 Q2 14
131 135 134
113
143
0
20
40
60
80
100
120
140
Q2 13 Q3 13 Q4 13 Q1 14 Q2 14
74 77 80
60
101
-‐120
-‐100
-‐80
-‐60
-‐40
-‐20
0
20
40
60
80
Q2 13 Q3 13 Q4 13 Q1 14 Q2 14
63 64
-106
30
55

Q2 2014 revenue and gross profit distribution
Interim Presentation 2014 - Second Quarter 15
Oman: 3.7
Yemen: 4.4
Kurdistan: 59.9
Revenues – USD Million
Oman: 24
Yemen: 17
Kurdistan: 103
Gross Profit – USD Million

Financial Summary
Highlights
• YTD sales increase on higher local sales from Tawke
• YTD lifting cost stable, but DD&A up on higher production volumes
Interim Presentation 2014 - Second Quarter 16
USD Million Q2 2014 Q1 2014 Q2 2013 YTD 2014 YTD 2013
Sales 143.4 112.8 130.9 256.2 234.2
Cost of goods sold -78.9 -71.1 -57.0 -150.0 -106.8
Gross profit 64.5 41.8 74.0 106.2 127.3
Expensed exploration -4.0 -5.3 -2.4 -9.3 -4.3
Admin/other -5.9 -6.7 -8.6 -12.7 -13.0
Profit/(loss) from operating act. 54.6 29.7 62.9 84.2 110.0
Net finance -7.9 -3.5 -2.8 -11.5 -6.0
Profit/(loss) before income tax 46.6 26.2 60.1 72.8 104.0
Income tax expense -2.2 -2.5 -12.1 -4.7 -25.8
Net profit/(loss) 44.4 23.7 48.0 68.1 78.1

• Capex and capitalized exploration increased to USD 97 million in Q2, mainly for capacity expansion and development in Kurdistan
• YTD capex and capitalized exploration USD 183 million
• Active exploration, appraisal and development program continues in 2H14
Increasing investments in line with plan
17 Interim Presentation 2014 - Second Quarter
-‐10
0
10
20
30
40
50
60
70
80
90
100
110
Q2 2013 Q3 2013 Q4 2013 Q1 2014 Q2 2014
USD
mill
ion
Kurdistan Oman Yemen UAE Tunisia Other
Capex and capitalized exploration

Interim Presentation 2014 - Second Quarter 18
Q2 cash flow movements • Q2 cash flow from operations reduced by build-up in working capital
• Capital expenditures in the quarter still mainly funded by cash flow
-‐50
0
50
100
150
200
250
300
350
Cash at start period
Cash generated from operaHons
Income taxes Interest Net expenditures Purchase of financial assets
Cash at end period
242.2
71.7 -9.5 -4.8
-97.2 -7.8 195.1

Interim Presentation 2014 - Second Quarter 19
Robust capital structure
Financial assets* (USD Million) Cash deposits (USD Million) Equity ratio (percent)
0
50
100
150
200
250
300
Q2 13 Q3 13 Q4 13 Q1 14 Q2 14
273 262
266
242
195
0
20
40
60
80
100
120
140
160
180
200
Q2 13 Q3 13 Q4 13 Q1 14 Q2 14
24 29
63
95 104
0%
10%
20%
30%
40%
50%
60%
Q2 13 Q3 13 Q4 13 Q1 14 Q2 14
58% 60%
57% 57% 59%
* Includes value of treasury shares at market price and RAK Petroleum PCL shares at fair value
• Maintained strong balance sheet with low leverage
• Capacity to execute work program and capitalize on new opportunities

Important notice This presentation (the “Presentation”) has been prepared and delivered by DNO International ASA (“DNO” or the “Company”). The Presentation and its contents is strictly confidential and may not be reproduced or redistributed, in whole or in part, to any other person than the intended recipient. The Presentation is prepared for discussion purposes only. It does not constitute, and should not be construed as, any offer or invitation or recommendation to buy or sell any of the securities mentioned or described herein.
The Presentation contains certain forward-looking statements relating to the business, financial performance and results of the Company and/or industry and markets in which it operates. Forward-looking statements concern future circumstances and results and other statements that are not historical facts, sometimes identified by the words “believes”, “expects”, “predicts”, “intends”, “projects”, “plans”, “estimates”, “aims”, “foresees”, “anticipates”, “targets”, and similar expressions. Any forward-looking statements and other information contained in this Presentation, including assumptions, opinions and views of the Company or cited from third party sources are solely opinions and forecasts based on the current expectations, estimates and projections of the Company or assumptions based on information currently available to the Company, which are subject to risks, uncertainties and other factors that may cause actual events to differ materially from any anticipated development. Neither the Company, nor any of its subsidiary undertakings or any such person’s officers or employees provides any assurance that the assumptions underlying such forward-looking information and statements. are free from errors nor does any of them accept any responsibility for the future accuracy of the opinions expressed in this Presentation or the actual occurrence of the forecasted developments. The Company assumes no obligation, except as required by law, to update any forward-looking statements or to conform these forward-looking statements to our actual results.
Any investment involves risks, and several factors could cause the actual results, performance or achievements of the Company as described herein to be materially different from any future results, performance or achievements that may be expressed or implied by statements and information in this Presentation, including, among others, risks or uncertainties associated with the Company’s business, segments, development, growth management, financing, market acceptance and relations with customers. More generally an investment will involve risks related to general economic and business conditions, changes in domestic and foreign laws and regulations, taxes, changes in competition and pricing environments, fluctuations in currency exchange rates and interest rates and other factors. Should one or more of such risks or uncertainties materialise, or should underlying assumptions prove incorrect, actual results may vary materially from those described in this Presentation.
This Presentation has not been reviewed or registered with any public authority, stock exchange or regulated market place. The distribution of this Presentation and any offering, subscription, purchase or sale of securities issued by the Company in certain jurisdictions is restricted by law, including (but not limited to) USA, Canada, Japan, Australia and Hong Kong. Persons into whose possession this Presentation may come are required to inform themselves about and to comply with all applicable laws and regulations in force in any jurisdiction in or from which it invests or receives or possesses this Presentation and must obtain any consent, approval or permission required under the laws and regulations in force in such jurisdiction. The shares of the Company have not and will not be registered under the U.S. Securities Act or any state securities laws, and may not, except pursuant to an applicable exemption, be offered or sold within the United States, or to the account or benefit of U.S. Persons.
By receiving this Presentation you acknowledge that you will be solely responsible for your own assessment of the market and the market position of the Company and the relevant securities and that you will conduct your own analysis and be solely responsible for forming your own view of the potential future performance of any relevant investments. This Presentation contains information which has been sourced from third parties believed to be reliable, but without independent verification. Neither DNO nor its advisors makes any undertaking, representation or warranty (express or implied) as to the accuracy or completeness of the information (whether written or oral and whether or not included in this Presentation) concerning the matters described herein. Neither DNO nor any of its advisors accepts any liability whatsoever as to any errors, omissions or misstatements contained herein and, accordingly, neither DNO or its advisers, nor any of their parent or subsidiary undertakings or any such person’s affiliates, officers, employees, accepts any liability whatsoever arising directly or indirectly from the use of this Presentation or the information included herein.
The Presentation speaks and reflects prevailing conditions and views as of 8 May 2014. It may be subject to corrections and change at any time without notice. DNO does not intend to, and neither the delivery of this Presentation nor any further discussions of the Company with any recipient shall, under any circumstances, not create any implication that the Company assumes any obligation to update or correct the information herein, nor any implication that there has been no change in the affairs of the Company since such date.
Interim Presentation 2014 - Second Quarter 20


![Rudi Cilibrasi CWI CWI and University of Amsterdam · 2008-02-01 · arXiv:cs/0312044v2 [cs.CV] 9 Apr 2004 Clustering by Compression Rudi Cilibrasi∗ CWI Paul Vitanyi† CWI and](https://static.fdocuments.net/doc/165x107/5e70e6e6eee2db04ee355a74/rudi-cilibrasi-cwi-cwi-and-university-of-amsterdam-2008-02-01-arxivcs0312044v2.jpg)