Interim Optimization Module: CDMA Optimization Principles.
64
Interim Optimization Module: CDMA Optimization Principles 7 8 9 1 3 2 1 3 2 4 5 6 7 8 9 7 8 9 1 3 2 6 4 6 10 11
-
Upload
alban-thompson -
Category
Documents
-
view
226 -
download
0
Transcript of Interim Optimization Module: CDMA Optimization Principles.
Interim Optimization Module:
CDMA Optimization Principles
7
8
9
1
3
2
1
3
24
5
6
7
8
9
7
8
9
1
3
2
6
4
6
10
11
Optimization Chapter Objectives• Preparatory knowledge
• Recognize key CDMA system parameters and their typical settings, ranges, effects of adjustment
• Understand the basic nature of CDMA messaging to facilitate optimization activities
• Recognize the CDMA messages sent on the various CDMA forward and reverse channels
• Consider a limited selection of optimization tools and techniques currently in use, including their basic structure, features, and typical applications
• Review certain key system problems, their root causes, and effects of specific parameter and configuration changes on them

Cellular System Performance Criteria - Voice Quality
• There are three categories for specifying cellular system performance criteria– voice quality given by MOS-parameter (Mean Opinion Score)– service quality presented by the following parameters
• RF coverage in terms of percentage of area, time, and subscribers • grade of service (GOS) in terms of blockage probability• dropped call rate (DCR) in terms of probability of a dropped call
– special services
1
Performance criteria
Voice quality Service quality Special features
Mean Opinion ScoreMOS
5432
(Excellent)(Good)
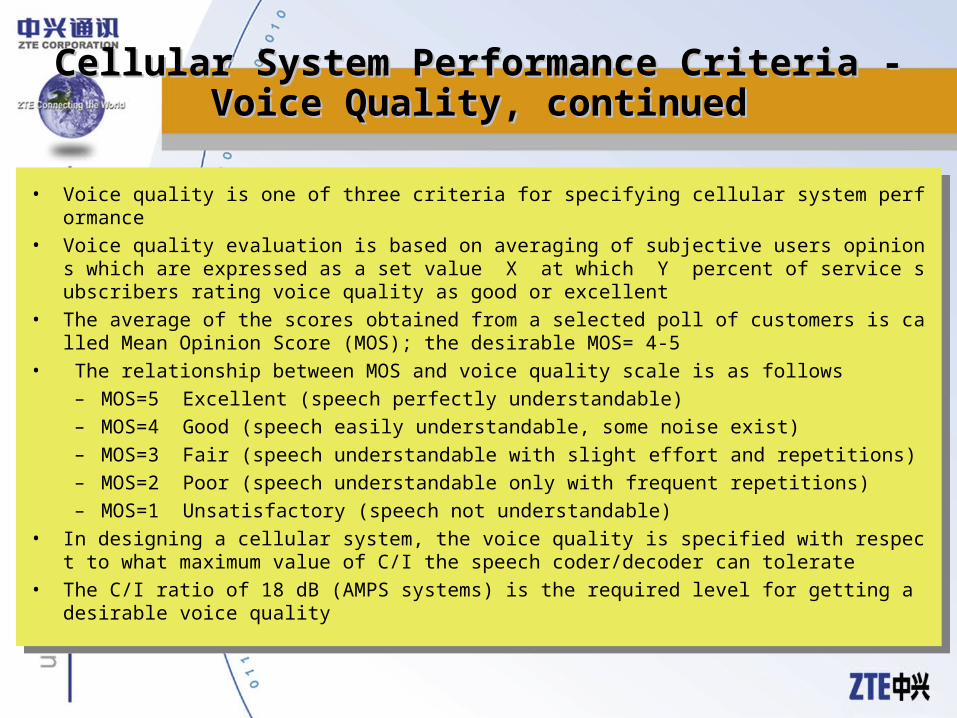
• Voice quality is one of three criteria for specifying cellular system performance
• Voice quality evaluation is based on averaging of subjective users opinions which are expressed as a set value X at which Y percent of service subscribers rating voice quality as good or excellent
• The average of the scores obtained from a selected poll of customers is called Mean Opinion Score (MOS); the desirable MOS= 4-5
• The relationship between MOS and voice quality scale is as follows
– MOS=5 Excellent (speech perfectly understandable)
– MOS=4 Good (speech easily understandable, some noise exist)
– MOS=3 Fair (speech understandable with slight effort and repetitions)
– MOS=2 Poor (speech understandable only with frequent repetitions)
– MOS=1 Unsatisfactory (speech not understandable)
• In designing a cellular system, the voice quality is specified with respect to what maximum value of C/I the speech coder/decoder can tolerate
• The C/I ratio of 18 dB (AMPS systems) is the required level for getting a desirable voice quality
Cellular System Performance Criteria - Voice Cellular System Performance Criteria - Voice Quality, continuedQuality, continued

Cellular System Performance Criteria - RF CoverageCellular System Performance Criteria - RF Coverage
• In cellular systems with irregular terrain, it is not practical to engineer the system to equally cover 100% of service area because of
– it will require increased transmit power and other techniques to illuminate weak spots with sufficient field strength
– it will cause complications with interference control
Performance criteria
Voice quality Special featuresService quality
RF coverage
Grade of Service
Dropped Call Rate

• Cellular system designers usually state the following objectives in terms of percentage of area and customers depending on terrain configuration
– to cover 90 percent of flat terrain area providing MOS between 4 and 5 for 75 percent of users
– to cover 75 percent of hilly terrain area providing MOS between 4 and 5 for 90 percent of users
• A cellular system operator can set lower percentage values for a low-performance and low-cost start-up system configuration
• In some sources, the coverage objective is defined in terms of percentages of area and time - 90 percent of the service area covered for 90 percent of the time
• In planning cell coverage, RF engineer should provide field strength coverage over densely populated areas and exclude the zones of uninhabited swamps, wilderness and terrain
• Typically, suburban area coverage is engineered to a mean RSS of -93 dBm which corresponds to the FCC 39-dBuV/m contour
• Coverage in rural areas is usually engineered to a mean RSS of -100 dBm which corresponds to the FCC 32-dBuV/m contour
• Handheld coverage in urban areas is usually engineered to a mean RSS of -78 dBm which corresponds to the 54-dBuV/m contour
Cellular System Performance Criteria - RF Cellular System Performance Criteria - RF Coverage, continuedCoverage, continued
Cellular System Performance Criteria - Grade Of Cellular System Performance Criteria - Grade Of Service (GOS)Service (GOS)
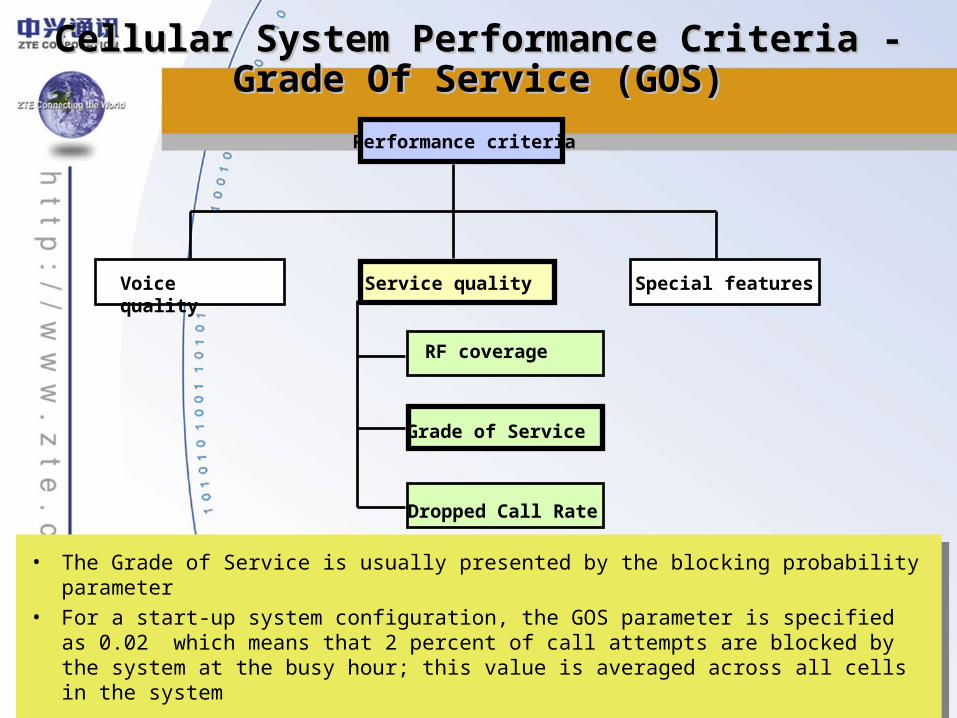
• The Grade of Service is usually presented by the blocking probability parameter
• For a start-up system configuration, the GOS parameter is specified as 0.02 which means that 2 percent of call attempts are blocked by the system at the busy hour; this value is averaged across all cells in the system
Performance criteria
Voice quality Special featuresService quality
RF coverage
Grade of Service
Dropped Call Rate
• Actual blocking probability depends on such factors as traffic distribution, cell site locations, number of radios at each cell and system parameters setting
• Actual blocking probability at each cell may fluctuate during day time and can be affected by weather and traffic conditions
• To decrease the blocking probability at a busy?cell near freeway or near entertainment place requires a good engineering of system resources
• High actual blocking probability at particular cell(s) shows that traffic load balancing is required; this is the most complex task of system optimization because it involves cell acquisition, antenna pointing and handoff thresholds
Cellular System Performance Criteria - Grade Of Cellular System Performance Criteria - Grade Of Service (GOS), continuedService (GOS), continued

Cellular System Performance Criteria - Dropped Cellular System Performance Criteria - Dropped Call Rate (DCR)Call Rate (DCR)
• The dropped call is defined as an established call which leaves the system before it is normally terminated
• The Dropped Call Rate (DCR) parameter represents what percentage of all established calls is dropped during a specified time period
• The DCR and voice quality are inversely proportional and high DCR may indicate coverage, handoff, or channels accessibility problems
Performance criteria
Voice quality Special featuresService quality
RF coverage
Grade of Service
Dropped Call Rate
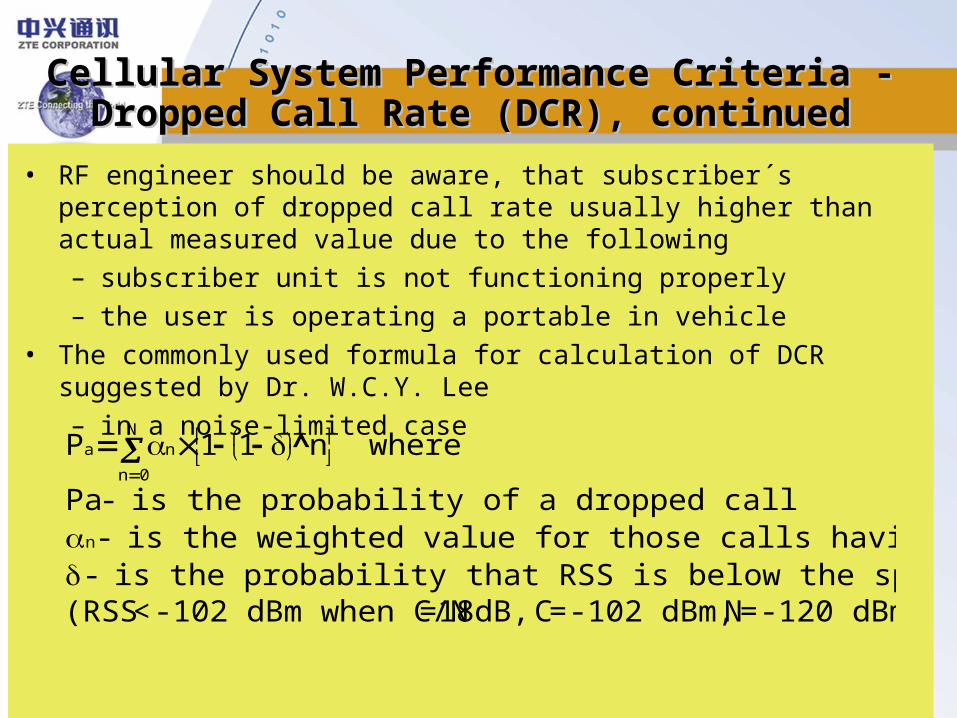
• RF engineer should be aware, that subscriber´s perception of dropped call rate usually higher than actual measured value due to the following
– subscriber unit is not functioning properly
– the user is operating a portable in vehicle
• The commonly used formula for calculation of DCR suggested by Dr. W.C.Y. Lee
– in a noise-limited case
Cellular System Performance Criteria - Dropped Cellular System Performance Criteria - Dropped Call Rate (DCR), continuedCall Rate (DCR), continued
Pa n1 1
n
n0
N
where
Pa- is the probability of a dropped calln- is the weighted value for those calls having n handoffs- is the probability that RSS is below the specified threshold(RSS<-102 dBm when C/N=18dB, C=-102 dBm, N=-120 dBm)
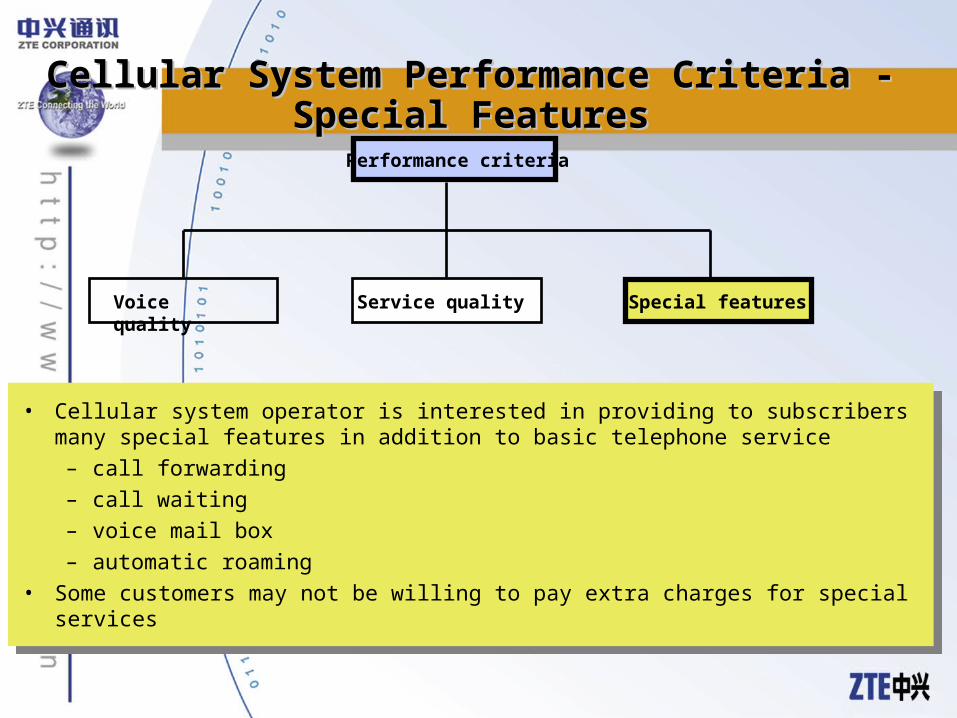
Cellular System Performance Criteria - Special Cellular System Performance Criteria - Special FeaturesFeatures
• Cellular system operator is interested in providing to subscribers many special features in addition to basic telephone service
– call forwarding
– call waiting
– voice mail box
– automatic roaming
• Some customers may not be willing to pay extra charges for special services
• Cellular system operator is interested in providing to subscribers many special features in addition to basic telephone service
– call forwarding
– call waiting
– voice mail box
– automatic roaming
• Some customers may not be willing to pay extra charges for special services
Performance criteria
Voice quality Service quality Special features

Cellular System Performance Evaluation - Metrics Set
• Almost all cellular systems have dedicated resources and procedures for system performance evaluation• Various measurement data logs (for instance, established calls, dropped calls, completed hand-offs, bloc
ked call attempts etc.) are reported to the switch for collecting, processing, and generating of performance metrics
• RF engineer should be familiar with system performance metrics and be able to use them for system performance optimization (system parameters tuning)
Cellular SystemOperation
System Performance Analysis
SystemOptimization
Performance MetricsSystem Parameters
Measurement Data
System Design
Networking Design
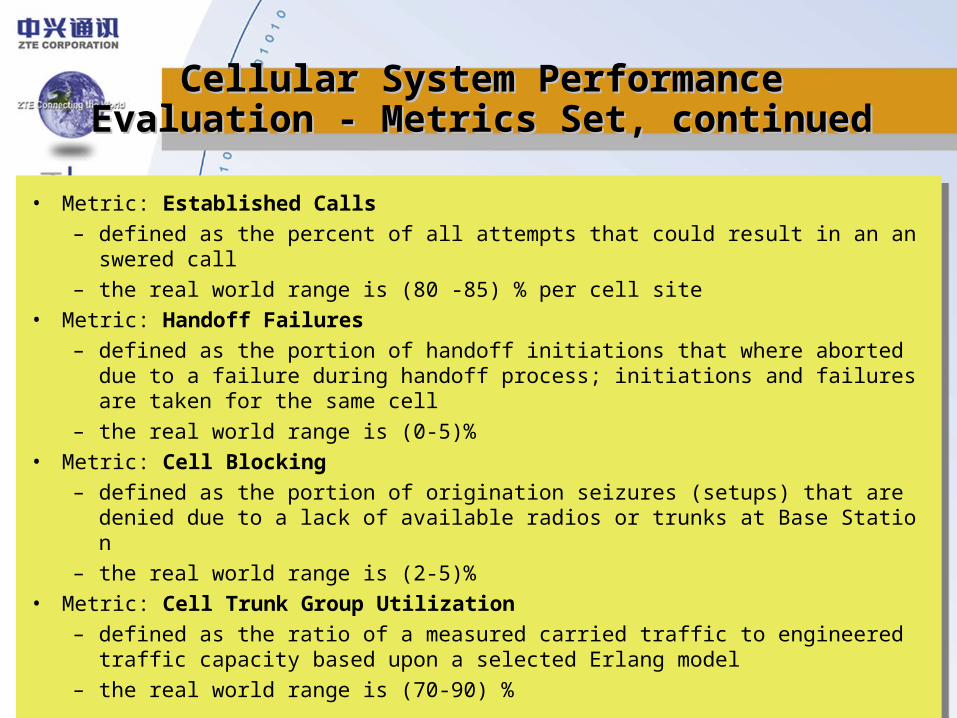
• Metric: Established Calls
– defined as the percent of all attempts that could result in an answered call
– the real world range is (80 -85) % per cell site
• Metric: Handoff Failures
– defined as the portion of handoff initiations that where aborted due to a failure during handoff process; initiations and failures are taken for the same cell
– the real world range is (0-5)%
• Metric: Cell Blocking
– defined as the portion of origination seizures (setups) that are denied due to a lack of available radios or trunks at Base Station
– the real world range is (2-5)%
• Metric: Cell Trunk Group Utilization
– defined as the ratio of a measured carried traffic to engineered traffic capacity based upon a selected Erlang model
– the real world range is (70-90) %
Cellular System Performance Evaluation - Cellular System Performance Evaluation - Metrics Set, continuedMetrics Set, continued
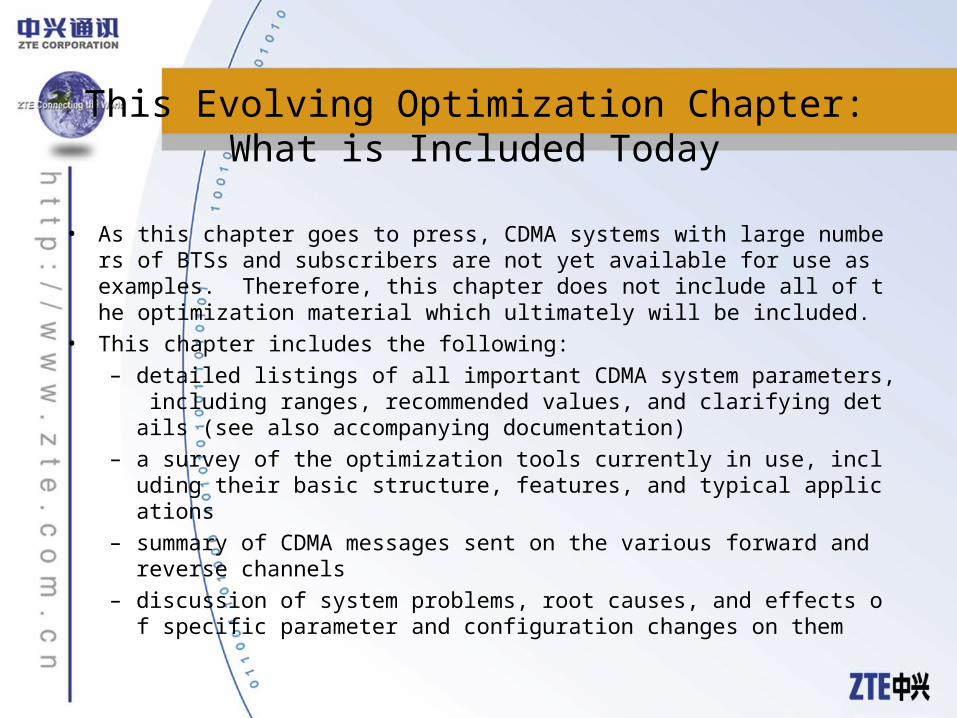
This Evolving Optimization Chapter:What is Included Today
• As this chapter goes to press, CDMA systems with large numbers of BTSs and subscribers are not yet available for use as examples. Therefore, this chapter does not include all of the optimization material which ultimately will be included.
• This chapter includes the following:
– detailed listings of all important CDMA system parameters, including ranges, recommended values, and clarifying details (see also accompanying documentation)
– a survey of the optimization tools currently in use, including their basic structure, features, and typical applications
– summary of CDMA messages sent on the various forward and reverse channels
– discussion of system problems, root causes, and effects of specific parameter and configuration changes on them

This Evolving Optimization Chapter:What is Not Available Yet
• Forthcoming revisions of this chapter will include the following, as they become available:
– peg count examples from live systems
– actual file and screen captures from live optimization tools
– actual OM examples of system problems showing effects of specific parameter and configuration changes
– MTX parameter details
• Overviews of the functions and features of commercial optimization tools from SAFCO, Grayson, and any others which become available
• Registration, hard-handoff, call/handoff blocking parameters are not yet addressed in this document.
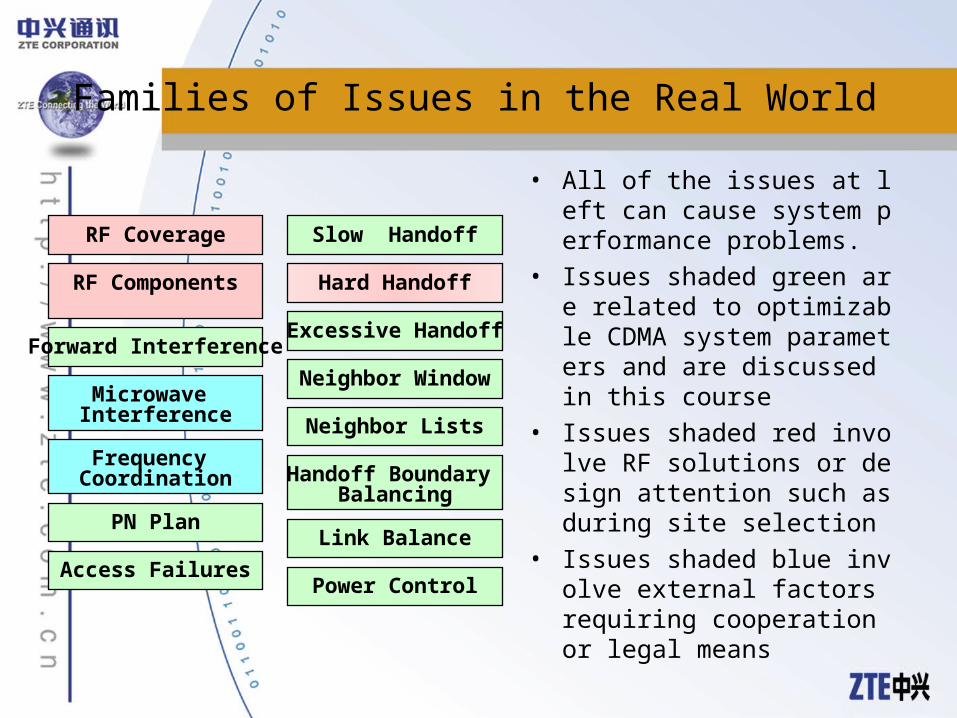
Families of Issues in the Real World
• All of the issues at left can cause system performance problems.
• Issues shaded green are related to optimizable CDMA system parameters and are discussed in this course
• Issues shaded red involve RF solutions or design attention such as during site selection
• Issues shaded blue involve external factors requiring cooperation or legal means
RF Coverage
Forward Interference
Slow Handoff
Power ControlAccess Failures
Neighbor Window
Excessive Handoff
Neighbor Lists
Link Balance
Handoff Boundary Balancing
Frequency Coordination
RF Components Hard Handoff
PN Plan
Microwave Interference

Optimization Phases
• The RF optimization process progresses in stages as a network evolves:
• Before Commercial In-Service:
– System/cluster shakedown/de-bugging
– Dropped call rate.
– Access success rate
– Search window settings
– Neighbor lists
– RF coverage/handoff control
– Hard handoff success rate
– The system/cluster may be operated on a simulated load for these tests

Optimization Phases (continued)
• At Beginning of Commercial Service
– Dropped call rate
– Access success rate
– Hard handoff success rate
– Capacity
• During Growth and System Expansion
– Introduction of new sites
– Dropped call rate
– Access success rate
– RF coverage/handoff control
– Hard handoff success rate
– Capacity

Pre-Conditions for Optimization
• To be ready for optimization, the system must already have reached a basic threshold of airworthiness. The following steps should already be complete before serious optimization begins:
– BTSs calibrated
– Network stable: all required sectors on the air and able to carry calls
– BSC support is functional: selector logging, parameter changes, enabling/disabling OCNS, wilting/blossoming sectors
– area maps available
– site database exists in Planet (or other propagation prediction tool)
– vehicles and analytical tools are available
– PN plan has been developed and applied
– first cut?neighbor lists have been developed and datafilled
– conflicting spectrum users have been cleared

Typical Optimization Sequence
• Prior to Commercial Launch:
– datafill audit
– shakedown
– set simulated load
• 1st full drive tests
– dropped call analysis using analysis tools (cdmastat, dropseek)
– failed access analysis
– spot check drives to recreate problems and validate changes
– srch_win_a (mje analysis), srch_win_n/r (TA messages)
– automated neighbor list audit
– RF coverage (best server, n-way, TXpower)
– drive benchmark route several times
– per-site stats to pinpoint problems (TXGA, FER)
– baseline for performance/trend analysis (sum files)
• Make changes, 2nd full drive, performance/trend analysis

Exit Criteria: When to stop Optimizing?
• Optimization is an ongoing process which is reapplied at intervals through the entire service life of a system.
• However, specific optimization sequences are normally performed to reach definable goals. Typical objectives are:
– Achieving a target dropped call rate.
– Achieving a target access success rate.
– Achieving coverage over a specified geographical area.
• The results of optimization are recorded and ongoing system performance is tracked against the optimized results. When performance or circumstances warrant, major optimization activities are resumed.
The Core Philosophy of Optimization
• Identify problems and troublesome performance issues
• Measure how often and how severely they occur
• Observe their actual occurrence
– capture the messaging on both forward and reverse links
– capture the parameters
– capture the locations where they occurred
– capture any other relevant circumstances
• Analyze your observations to determine causes
• Vary parameters and configuration seeking improvement
• Observe again and Benchmark the results
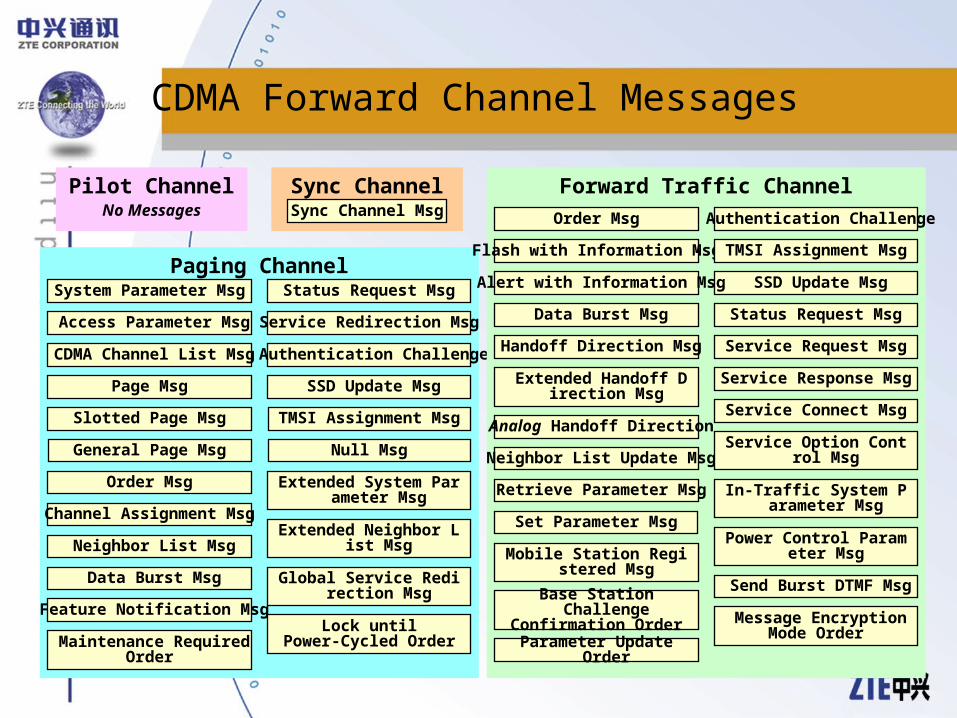
CDMA Forward Channel Messages
Sync ChannelSync Channel Msg
Pilot ChannelNo Messages
Paging ChannelSystem Parameter Msg
Access Parameter Msg
Neighbor List Msg
CDMA Channel List Msg
Slotted Page Msg
Page Msg
Order Msg
Channel Assignment Msg
Data Burst Msg
Authentication Challenge
SSD Update Msg
Feature Notification Msg
Extended System Parameter Msg
Extended Neighbor List Msg
Status Request Msg
Service Redirection Msg
General Page Msg
Global Service Redirection Msg
TMSI Assignment Msg
Null Msg
Lock untilPower-Cycled Order Maintenance Required
Order
Forward Traffic Channel
Set Parameter Msg
Neighbor List Update Msg
Flash with Information Msg
In-Traffic System Parameter Msg
Order Msg
Data Burst Msg
Authentication Challenge
SSD Update Msg
Service Option Control Msg
Status Request Msg
Power Control Parameter Msg
TMSI Assignment Msg
Alert with Information Msg
Handoff Direction Msg
Analog Handoff Direction
Send Burst DTMF Msg
Retrieve Parameter Msg
Mobile Station Registered Msg
Extended Handoff Direction Msg
Service Request Msg
Service Response Msg
Service Connect Msg
Base Station ChallengeConfirmation Order
Parameter Update Order
Message EncryptionMode Order
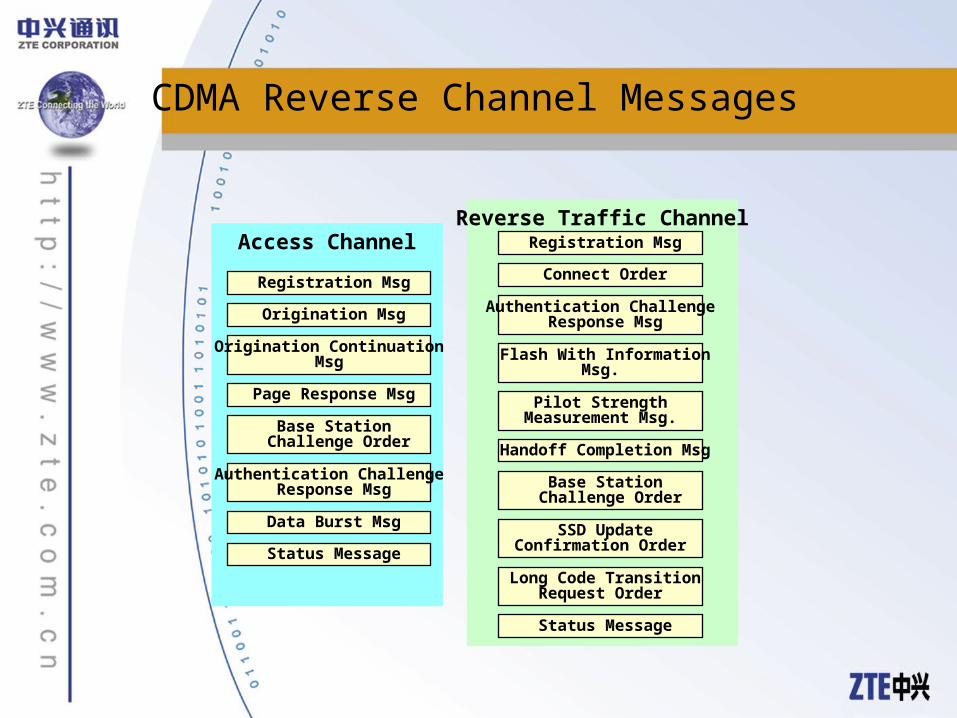
CDMA Reverse Channel Messages
Access Channel
Base Station Challenge Order
Origination Msg
Origination Continuation Msg
Page Response Msg
Registration Msg
Authentication Challenge Response Msg
Data Burst Msg
Status Message
Reverse Traffic Channel
Base Station Challenge Order
Connect Order
Flash With InformationMsg.
Pilot Strength Measurement Msg.
Handoff Completion Msg
Authentication Challenge Response Msg
Registration Msg
SSD UpdateConfirmation Order
Long Code TransitionRequest Order
Status Message
Initial Datafill
• Initial Datafill Values
• Since a significant portion of an optimization effort is devoted to system parameters, every effort should be made to begin with a datafill that incorporates the experiences gained from multiple systems.
• The datafill given in the following slides is typical of current systems and can serve as a reliable starting point for an optimization effort in a new system. 800/1900 MHz. parameters should be adjusted appropriately.
• BTS Calibration-Related Datafill
• Many of the datafill values are outputs from the BTS calibration process (e.g. TXAttenNormal). Ensure that these are present in the datafill before optimization begins.
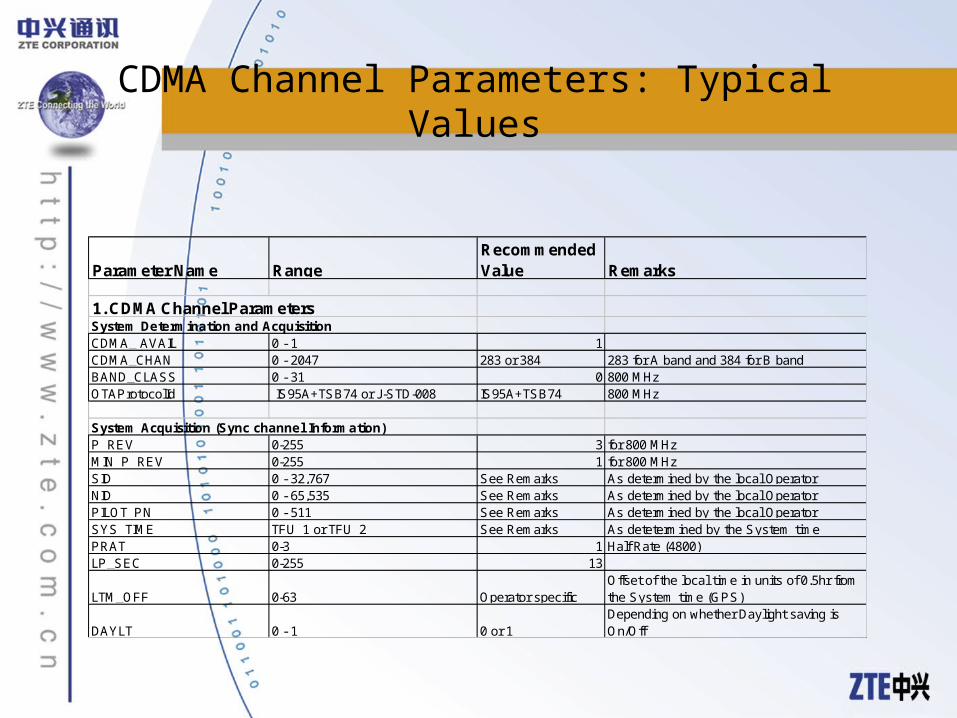
CDMA Channel Parameters: Typical Values
Parameter Name RangeRecommendedValue Remarks
1. CDMA Channel ParametersSystem Determination and AcquisitionCDMA_ AVAIL 0 - 1 1CDMA_CHAN 0 - 2047 283 or 384 283 for A band and 384 for B bandBAND_CLASS 0 - 31 0 800 MHzOTAProtocolId IS95A+TSB74 or J-STD-008 IS95A+TSB74 800 MHz
System Acquisition (Sync channel Information)P_REV 0-255 3 for 800 MHzMIN_P_REV 0-255 1 for 800 MHzSID 0 - 32,767 See Remarks As determined by the local OperatorNID 0 - 65,535 See Remarks As determined by the local OperatorPILOT_PN 0 - 511 See Remarks As determined by the local OperatorSYS_TIME TFU_1 or TFU_2 See Remarks As detetermined by the System timePRAT 0-3 1 Half Rate (4800)LP_SEC 0-255 13
LTM_OFF 0-63 Operator specificOffset of the local time in units of 0.5hr fromthe System time (GPS)
DAYLT 0 - 1 0 or 1Depending on whether Daylight saving isOn/Off
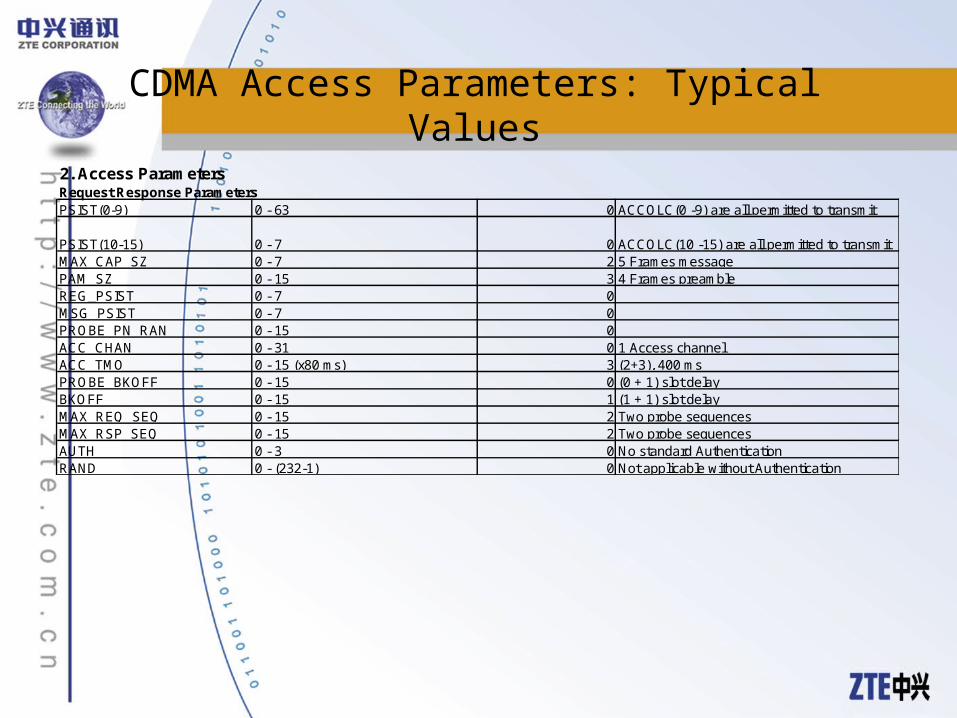
CDMA Access Parameters: Typical Values
2. Access ParametersRequest Response ParametersPSIST(0-9) 0 - 63 0 ACCOLC(0 -9) are all permitted to transmit
PSIST(10-15) 0 - 7 0 ACCOLC(10 -15) are all permitted to transmitMAX_CAP_SZ 0 - 7 2 5 Frames messagePAM_SZ 0 - 15 3 4 Frames preambleREG_PSIST 0 - 7 0MSG_PSIST 0 - 7 0PROBE_PN_RAN 0 - 15 0ACC_CHAN 0 - 31 0 1 Access channelACC_TMO 0 - 15 (x80 ms) 3 (2+3), 400 msPROBE_BKOFF 0 - 15 0 (0 + 1) slot delayBKOFF 0 - 15 1 (1 + 1) slot delayMAX_REQ_SEQ 0 - 15 2 Two probe sequencesMAX_RSP_SEQ 0 - 15 2 Two probe sequencesAUTH 0 - 3 0 No standard AuthenticationRAND 0 - (232-1) 0 Not applicable without Authentication
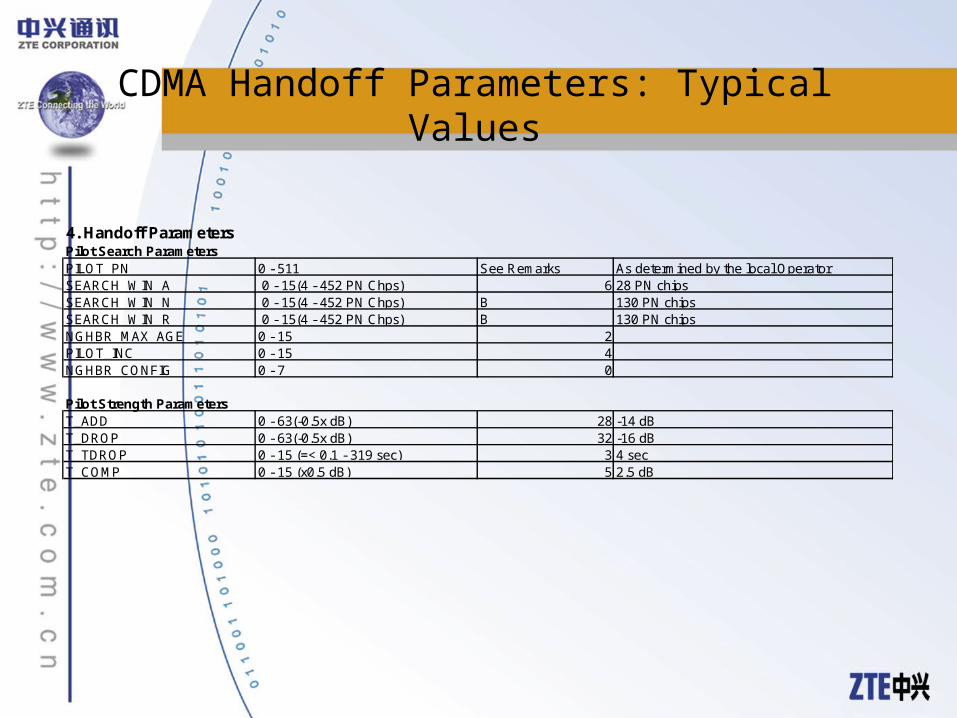
CDMA Handoff Parameters: Typical Values
4. Handoff ParametersPilot Search ParametersPILOT_PN 0 - 511 See Remarks As determined by the local OperatorSEARCH_WIN_A 0 - 15(4 - 452 PN Chps) 6 28 PN chipsSEARCH_WIN_N 0 - 15(4 - 452 PN Chps) B 130 PN chipsSEARCH_WIN_R 0 - 15(4 - 452 PN Chps) B 130 PN chipsNGHBR_MAX_AGE 0 - 15 2PILOT_INC 0 - 15 4NGHBR_CONFIG 0 - 7 0
Pilot Strength ParametersT_ADD 0 - 63(-0.5x dB) 28 -14 dBT_DROP 0 - 63(-0.5x dB) 32 -16 dBT_TDROP 0 - 15 (=< 0.1 - 319 sec) 3 4 secT_COMP 0 - 15 (x0.5 dB) 5 2.5 dB

CDMA Registration Parameters: Typical Values
Registration ParametersSID 0 - 32,767 See Remarks As determined by the local OperatorNID 0 - 65,535 See Remarks As determined by the local OperatorREG_ZONE 0 - 4095 0 Zone Registration not currently supportedTOTAL_ZONES 0 - 7 0 Zone Registration not currently supportedZONE_TIMER 0 - 7 0 Zone Registration not currently supported
MULTI_SIDS 0 - 1 1 If roaming is permitted, this should be set to 1
MULTI_NIDS 0 - 1 1If roaming or more than one NID in the Operator, set to 1
BASE_ID 0 - 65,535 Operator specificTo be clarified whether this is same as the CellId
BASE_CLASS 0 - 15 0 Public macro cellular systemPAGE_CHAN 0 - 7 1 One paging channelMAX_SLOT_CYCLE_INDEX 0 - 7 2BACAST_INDEX 0 -7 0 Broadcast paging not enabled (i.e. for SMS)HOME_REG 0 - 1 1FOR_SID_REG 0 - 1 1FOR_NID_NEG 0 - 1 1POWER_UP_REG 0 - 1 1POWER_DOWN_REG 0 - 1 1PARAMETER_REG 0 - 1 1
REG_PRD 0 - 127 0Periodic registration disabled (but can be set as required)
BASE_LAT -1296000, +1296000 See Remarks As determined by the local OperatorBASE_LONG 2592000, +2592000 See Remarks As determined by the local OperatorREG_DIST 0 No distance based registrationRESCAN 0 - 1 0PREF_MSID_TYPE 0 - 7 3 IMSI & ESN
IMSI_11_12 0 - 127 0As specified by the local Operator (MNC or 00)
MCC 0- 1023 Country specific Mobile country code of CanadaTMSI_ZONE_LEN 0 - 15 0 TMSI not currently supportedTMSI_ZONE 0 TMSI not currently supported
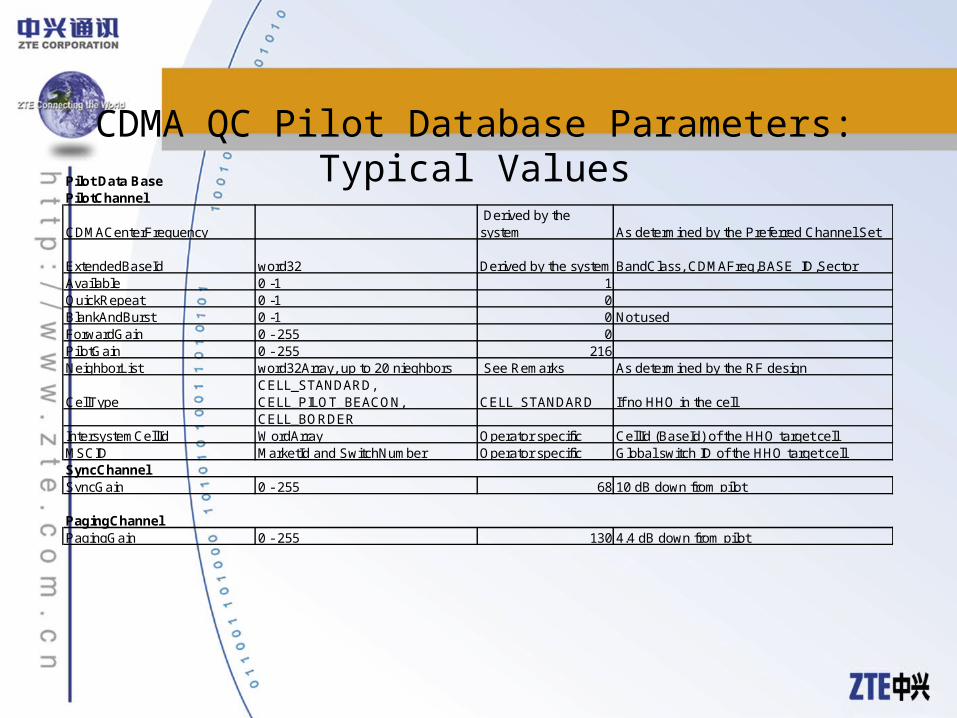
CDMA QC Pilot Database Parameters:Typical ValuesPilot Data Base
PilotChannel
CDMACenterFrequency Derived by the system As determined by the Preferred Channel Set
ExtendedBaseId word32 Derived by the system BandClass, CDMAFreq,BASE_ID,SectorAvailable 0 -1 1QuickRepeat 0 -1 0BlankAndBurst 0 -1 0 Not usedForwardGain 0 - 255 0PilotGain 0 - 255 216NeighborList word32Array, up to 20 nieghbors See Remarks As determined by the RF design
CellTypeCELL_STANDARD, CELL_PILOT_BEACON, CELL_STANDARD If no HHO in the cellCELL_BORDER
IntersystemCellId WordArray Operator specific CellId (BaseId) of the HHO target cellMSCID MarketId and SwitchNumber Operator specific Global switch ID of the HHO target cellSyncChannelSyncGain 0 - 255 68 10 dB down from pilot
PagingChannelPagingGain 0 - 255 130 4.4 dB down from pilot
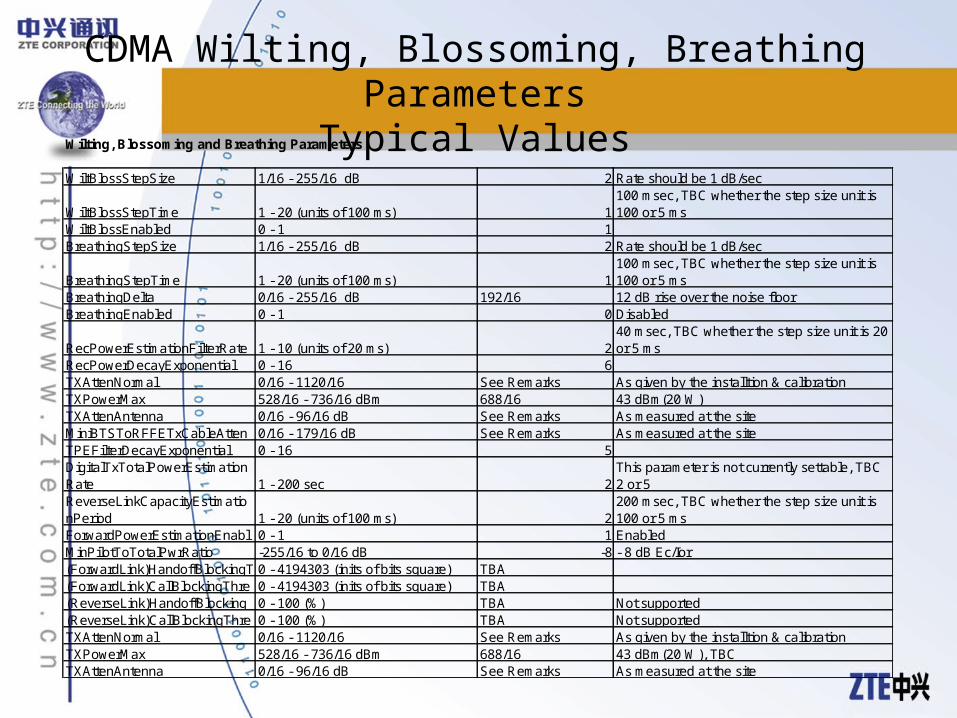
CDMA Wilting, Blossoming, Breathing ParametersTypical Values
Wilting, Blossoming and Breathing Parameters
WiltBlossStepSize 1/16 - 255/16 dB 2 Rate should be 1 dB/sec
WiltBlossStepTime 1 - 20 (units of 100 ms) 1100 msec, TBC whether the step size unit is 100 or 5 ms
WiltBlossEnabled 0 - 1 1BreathingStepSize 1/16 - 255/16 dB 2 Rate should be 1 dB/sec
BreathingStepTime 1 - 20 (units of 100 ms) 1100 msec, TBC whether the step size unit is 100 or 5 ms
BreathingDelta 0/16 - 255/16 dB 192/16 12 dB rise over the noise floorBreathingEnabled 0 - 1 0 Disabled
RecPowerEstimationFilterRate 1 - 10 (units of 20 ms) 240 msec, TBC whether the step size unit is 20 or 5 ms
RecPowerDecayExponential 0 - 16 6TXAttenNormal 0/16 - 1120/16 See Remarks As given by the installtion & calibrationTXPowerMax 528/16 - 736/16 dBm 688/16 43 dBm(20 W)TXAttenAntenna 0/16 - 96/16 dB See Remarks As measured at the siteMiniBTSToRFFETxCableAtten 0/16 - 179/16 dB See Remarks As measured at the siteTPEFilterDecayExponential 0 - 16 5DigitalTxTotalPowerEstimationRate 1 - 200 sec 2
This parameter is not currently settable, TBC 2 or 5
ReverseLinkCapacityEstimationPeriod 1 - 20 (units of 100 ms) 2
200 msec, TBC whether the step size unit is 100 or 5 ms
ForwardPowerEstimationEnabl 0 - 1 1 EnabledMinPilotToTotalPwrRatio -255/16 to 0/16 dB -8 - 8 dB Ec/Ior(ForwardLink)HandoffBlockingT 0 - 4194303 (inits of bits square) TBA(ForwardLink)CallBlockingThre 0 - 4194303 (inits of bits square) TBA(ReverseLink)HandoffBlocking 0 - 100 (%) TBA Not supported(ReverseLink)CallBlockingThre 0 - 100 (%) TBA Not supportedTXAttenNormal 0/16 - 1120/16 See Remarks As given by the installtion & calibrationTXPowerMax 528/16 - 736/16 dBm 688/16 43 dBm(20 W), TBCTXAttenAntenna 0/16 - 96/16 dB See Remarks As measured at the site

Introduction to Types of Parameters
• Types of Parameters
– IS-95/J-STD-008 vs. Qualcomm Specific
– Global/Sector Specific/BSC/BTS
The distinction between these definitions is important and not necessarily obvious:
• Global parameters apply to the whole system (one BSC/MTX)
• Sector specific parameters apply to specific sectors. If a mobile is in soft handoff with two sectors containing different values for a given parameter, there are parameter-specific rules for which value will be used:
– 1. For SRCH_WIN_A the mobile will use the widest value.
– 2. For SRCH_WIN_N the mobile will use the TBD value.
– 3. For SRCH_WIN_R the mobile will use the TBD value.
– 4. For T_ADD, T_DROP mobile will use highest (least negative).
– 5. For T_TDROP, the mobile will use the maximum value.
– 6. For T_COMP, the mobile will use the minimum value.
– 7. For ForwardGain, QuickRepeat the mobile will use TBD value
Types of Parameters: BTS, BSC
• Some values are repeated at the BTS and BSC:
– Values in the BTS datafill appear on the paging channel.
– Values at the BSC apply to the traffic channel. However, until the Traffic System Parameters Message is implemented, it is not possible to update the mobile settings during a call. Therefore, while parameters such as search windows, T_ADD, T_DROP etc. may be set per sector at the BSC, the mobile will currently only use the values it gets from the paging channel. For example, a call originated in a rural cell with a large SRCH_WIN_A that is subsequently carried into a downtown cell with a smaller window setting will not update its search window until the call is released and the mobile monitors the paging channel again.

Types of Parameters: Formation of Composite Neighbor Lists
• Neighbor lists are a special case. As with other parameters, the settings at the BTS are used on the paging channel. Since the mobile is only locked to one sector at a time during idle, its neighbor search procedure will use only the neighbor list from that sector. Once on a traffic channel, the mobile will generate a composite neighbor list (up to a maximum of 20 entries) with the following priorities:
– 1. Any pilots that have recently been dropped from the active list but have not yet exceeded NGHBR_MAX_AGE.
– 2. The neighbor list as received on the most recent Neighbor List Update Message from the BSC (although any pilots from 1. above will not be repeated).
• Note that, even if the Neighbor List Update Message contains 20 entries, the mobile will give priority to pilots defined in 1. above, so all 20 might not be used.

Types of Parameters Further Neighbor List Priorities
• The neighbor list received from the BSC is itself a composite (up to a maximum of 20 entries) of the neighbor lists of the sectors named in the most recent Handoff Completion Message. The following priorities are used:
– 1. The neighbor list of the first pilot in the Handoff Completion Message.
– 2. The neighbor list of the second pilot in the Handoff Completion Message (although any pilots from 1. above will not be repeated).
– 3. The neighbor list of the third pilot in the Handoff Completion Message (although any pilots from 1. or 2. above will not be repeated).
– 4. ...and so on until all the pilots have been used or the list has the maximum of 20 entries.

Setting Parameters
• Setting Parameters
• Some parameter changes may be made using a set script while others require a download. Beware that changes made earlier using a set script will be lost each time a download is performed. If the change needs to be made permanent, the download files also must be changed.

Generating Initial Neighbor Lists
Initial Neighbor List Generation
• The initial neighbor lists for a new system or portion of a system can be generated as follows:
– 1. In Planet, set the EIRP values in the site database to be consistent with the pilot power and generate an equal power boundaries plot.
– 2. For each sector, create a neighbor list consisting of the sectors with which it shares a common boundary.
– 3. Prioritize the list according to the boundary length (longest boundary first).
• Do not be tempted to add more distant sites to the neighbor list The objective is to keep the neighbor lists to the minimum length and hence reduce search times
PN Planning Issues SurveyCo-PN Interference
• PN Planning
– Before optimization begins, it is assumed that a PN plan has already been set up. The focus now is on possible glitches and bugs in that plan.
– The symptoms in the diagnostic data will be explained in a later section. However, we will not look at some problem mechanisms.
• 1.Co-PN
– To avoid "Co-PN" interference with the serving cell, the minimum cellsite spacing (in km) should be:
min spacing = (SRCH_WIN_A)/(2 x 3.3 x 1.2288) + 2R
– where R is average cell radius in region of interest and SRCH_WIN_A is expressed in chips.

More Co-PN Interference Mechanisms
• 2. Another possibility for "Co-PN" interference is if PN1 is in the mobile's neighbor list but some energy from a distant re-use of PN1 falls inside the neighbor search window. The "correct" local PN1 will be put in the active list. If the "false" PN1 subsequently becomes one of the 3 strongest multipaths, the mobile will center an active search window on it and try to demodulate it resulting in forward link interference.
• 3. A third "Co-PN" possibility is if "false" PN energy arrives at the mobile that matches an active set PN that is not currently being demodulated. If the "false" PN subsequently becomes one of the 3 strongest multipaths, the mobile will center an active search window on it and try to demodulate it resulting in forward link interference.
• 4.A fourth "Co-PN" possibility is if "false" PN energy arrives at the mobile that matches an active set PN that is currently being demodulated. This will only cause interference if the "false" PN energy falls inside the active window for that PN.

Adjacent PN Interference
• Adjacent PN (ie. PN-PILOT_INC)
– Problems first occur with cellsite spacings in the "ring" defined by the following distances (in km). If any distant pilot is interpreted as one of the pilots in the mobile's neighbor list, the local site will be added to the active list, even if not required.
outer radius = ((PILOT_INC x 64)/(3.3 x 1.2288)) + ((SRCH_WIN_N)/(2 x 3.3 x 1.2288)) + 2R
inner radius = ((PILOT_INC x 64)/(3.3 x 1.2288)) - ((SRCH_WIN_N)/(2 x 3.3 x 1.2288))
– However, this will not cause demodulation problems unless the "false" PN becomes one the strongest three multipaths and a rake finger is assigned to it (note that, unless the mobile has already assigned a finger to that PN from the (correct) local PN, it will center it's active window on the "false" PN. Therefore, the equations above are correct in having the SRCH_WIN_N and not SRCH_WIN_A).

Demodulation Problems fromAdjacent-PN Interference
– For the mobile to actually try and demodulate a distant "false PN" that is already being demodulated correctly from a local site, that site would have to fall inside the active search window. When considering the serving cell, the distances become:
outer radius = ((PILOT_INC x 64)/(3.3 x 1.2288)) + ((SRCH_WIN_A)/(2 x 3.3 x 1.2288)) + 2R
inner radius = ((PILOT_INC x 64)/(3.3 x 1.2288)) - ((SRCH_WIN_A)/(2 x 3.3 x 1.2288))

Categorizing System Access Failures
• If the radio link fails prior to the mobile sending the Service Connect Complete Message then it is considered a failed access attempt. Failures can be classified into one of the following categories:
– 1) Access probes exhausted (not received by system)
– 2) Access probes exhausted (seen by system but can not reaching mobile)
– 3) Ack received by mobile but Channel Assignment Message not seen
– 4) Channel Assignment Message seen at mobile but mobile does not acquire forward traffic channel
– 5) Mobile acquires forward traffic channel but system does not acquire reverse tch
– 6) System acquires reverse traffic channel but Service Connect Message is not seen at mobile.
Causes of Access Failures
• Category 1. is likely due to coverage problems while the remainder are likely due to the mobile being restricted to one pilot during access (any other pilots are effectively interferers).
– Create a file containing the latitude, longitude and some dummy value for all of the category 1. failures. Import this file into Planet as a survey and overlay on a coverage prediction. Check that this type of access failure is not happening in areas of solid coverage (suspect a problem at one of the sites if this appears to be the case).
– Create a second file containing the latitude, longitude and some dummy value for the rest of the failures. Import this file into Planet as a survey and overlay on an equal power boundaries prediction. This type of access failure is likely to happen in the handoff regions at the cell boundaries. If it seems to be happening in isolated coverage, suspect a problem at the site.
• Access Parameters can be changed to minimize access failures
– (INIT_PWR, MAX_REQ_SEQ, MAX_RSP_SEQ, PWR_STEP, NUM_STEP, MAX_CAP_SZ, PROBE BKOFF, BKOFF)
Categorizing Dropped Calls
Dropped call analysis can consume a considerable amount of time. Using the dropseek and cdmastat tools, the root cause of some of the drops can be determined without the need to use the selector logs. However, most will require deeper investigation. There is no substitute for thorough knowledge of the air interface and IS-95.
• If the radio link fails after the mobile sends the Service Connect Complete Message then it is considered a dropped call. Using the symptoms described in later, separate the dropped calls into the following categories:
– 1. Coverage related
– 2. Forward link interference
– 3. 0ptimizable e.g. slow handoff, search window, coverage control, PN plan related.
– 4. Other.
Causes of Dropped Calls
• Create a file containing the latitude, longitude and some dummy value for all of the category 1. failures. Import this file into Planet as a survey and overlay on a coverage prediction. Check that this type of dropped call is not happening in areas of solid coverage (suspect a problem at one of the sites if this appears to be the case).
• Create a second file containing the latitude, longitude and some dummy value for the category 2 failures. Import this file into Planet as a survey. Assess the call drop locations against possible interference sources (e.g. other CDMA systems on the same frequency, intermodulation from non-co-located AMPS sites, co-channel interference from AMPS sites in the CDMA channel, microwave radio links, cellsites for other PCS technologies).
• For category 3, apply the solutions described elsewhere in this chapter for the different types of dropped calls.

Handoff ProblemsRole of RF Coverage
• Controlling the coverage area of individual cells is crucial to good CDMA performance. Antenna patterns, orientations and tilts should be used to confine cells to their intended coverage area. If this is not done, the system will be prone to the following problems:
• Excessive Handoff:
– 4, 5 and 6 way handoff can be beneficial with many pilots but no dominant server, or in a rapidly changing environment. The pilots not currently being demodulated serve as hot standbys to which rake fingers can be assigned very quickly. However, in order not to compromise capacity (both forward and reverse link), this should be the exception rather than the rule.

Handoff ProblemsAdditional Failure Mechanisms
• Window dropped calls: Pilots seen some distance outside their intended coverage area may cause dropped calls for two reasons:
– 1) If distant pilot is strong enough to cause interference to a call in progress, but mobile’s timing reference is from a local cell, the distant pilot will be outside SRCH_WIN_N and hence it will not be recognized and added to the active set. The call may drop.
– 2) If the mobile originates on the distant site and hence uses it as its timing reference, the local sites will be invisible if they are outside SRCH_WIN_N and the call will drop as soon as one of the local sites becomes strong and causes interference.
• slow handoff dropped calls: Since, for a given SRCH_WIN_A setting, the number of active pilots has a big influence on search time, there is an increased chance of a new, strong pilot not being detected quickly enough.
Finding Causes of Excessive Handoff:Generating Plots to Identify Sources
• Survey data can be loaded into Planet to generate plots that will indicate which sites are candidates for antenna configuration changes. The source data used should represent one entire drive of the system/cluster:
– 1.Use the multimfa and mfa2bsv scripts to generate a strongest finger file for every sector in the system/cluster. Each of these files contains the lat/long of every location in the system/cluster where the mobile’s strongest rake finger was assigned to that sector. The value to be plotted is the Ec/Io of that finger. Use contour settings of -16 to -8 with a step of 2 and generate plots for one sector at a time.
– 2.Use the multitx script to extract the lat/long and mobile transmit power from the eva files. Use contour settings of -12 to +18 with a step of 10 and generate one plot for the entire system/cluster.
– 3.The multistat script will generate files containing lat/long and handoff state. Use contour settings of 1 to 5 with a step of 1 and generate one plot for the entire system/cluster.
Finding Causes of Excessive Handoff:Analyzing Plots to Identify Sources
• Examine the plot for each sector in turn and determine whether the coverage is excessive by drawing a curve joining the surrounding sites and assessing how often the site is seen as the strongest server outside this line. – If more than approximately 15% of the points are outside the line, a change is
required. – If the problems occur along the main beam of the antenna, a downtilt alone s
hould be sufficient. – If there are problems along the edge of the antenna beam, also consider a narr
ower beamwidth antenna and/or a re-orientation. Do not try to remove signal from areas where the mobile transmit power is above 18dBm.
– To decide on the exact changes, use single cell signal plots in Planet and experiment with antenna changes. A signal level reduction of around 8dB in offending areas is the minimum that should be considered before implementing the changes and re-driving the area.
– Beware that, as unwanted pilots are removed from an area, the Io is being reduced and so the next drive of the area may reveal new problem pilots, making this somewhat of an iterative process.
Soft Handoff Percentage: Some Precautions
• T_ADD/T_DROP parameters are usually set -14 to -16; use extreme caution if trying to reduce soft handoff percentage by changing these
• How much soft handoff is normal? 35% rule-of-thumb?
– If the reverse link coverage has been designed assuming 4dB soft handoff gain, we can calculate (for a propagation slope of 35 dB/decade) that the last 4dB of the cell radius represents an area of 42%. If this is true, roughly 42% of the cell area needs to be in soft handoff to ensure complete reverse link coverage.
– Forcibly restricting soft handoff to 35% using the handoff threshold(s) (which are forward link parameters and hence somewhat independent of reverse link coverage) could reduce reverse link performance
– This is a very simplistic calculation; the cell overlap which always occurs in the real world will help the reverse link; but it illustrates the problems that might result if soft handoff percentage is arbitrarily forced down using just T_ADD and T_DROP without watching other consequences.

Search Windows
• The search sequence for mobile that has two active pilots and a neighbor list of three PNs is as follows:
– A1, A2, N1, A1, A2, N2, A1, A2, N3, R, A1, A2, N1,
• The worst case search time to find a new neighbor therefore can be generalized as:
– Search Time = (NN x (TN + (NA x TA))) + TR
– Where NA, NN are the number of actives and neighbors respectively. TA, TN and TR are the search times for the SRCH_WIN_A/N/R windows. Minimizing the search time is crucial to CDMA performance, both to avoid dropped calls and to maximize capacity. Next, we show how to establish a minimum search window that is consistent with the propagation environment within the system/cluster.
Window Size (Chips)
14 (7)
DatafillValue
Search Time(mS)
Max Delay(uS)
4 5.7 19
20 (10) 5 8.1 15
40 (20) 7 16.3 12
60 (30) 8 24.4 18
80 (40) 9 32.6 19
100 (50) a 40.7 25
130 (65) b 52.9 30
160 (80) c 65.1 40
226 (113) d 92 54
Notice that the curve fluctuates at the lower settings and 28 chips is the smallest reasonable setting.
SEARCH TIME AS A FUNCTION OF WINDOW SIZE
Setting Search Window Size: SRCH_WIN_A
• Setting SRCH_WIN_A
– Collected .mje files contain a histogram of the maximum mobile finger separation for fingers locked to one pilot only. This is the basis for setting the optimum value for SRCH_WIN_A.
– Gather all the .mje files for one entire network/cluster run.
– Classify the areas by average cell size (two regions should be sufficient i.e. small?(dense) urban cells and average suburban/rural cells).
– Use one of the tools to generate an overall combined histogram. Evaluate the histogram against the max Delay column in the above table and choose a window size that will capture 99.9% of the finger separations.
– Check the shape of the histogram to ensure that the existing window setting is not already too small (i.e. is there a sharp cutoff at the current window setting). In this case, more data will have to be collected with a wider window setting before a proper judgment can be made.

Setting Search Window Size for other Sets
• Setting SRCH_WIN_N
– This setting should be based on the spread observed in Neighbor set records and will be much more dependent on cell size
– Three settings likely will be needed for downtown/suburban/rural areas. A good starting point would be 80/130/226 chips
• Setting SRCH_WIN_R
– This setting should be based on the spread observed in Remaining set records and will be much more dependent on cell size
– Three settings likely will be needed for downtown/suburban/rural areas. A good starting point would be 80/130/226 chips

Neighbor List Considerations
• Use the program to generate a per-site histogram of all the handoff transitions requested by the drive test mobiles over a complete drive of the system/cluster.
• For each sector, examine the statistics in conjunction with the Planet equal power boundaries plot. Consider removing any pilots that are currently in the neighbor list but have less than 1% of the handoff transitions. However, make sure that is not a consequence of the drive routes (for example, do not remove adjacent sectors of a sectored site).
• Consider adding pilots that are not currently in the neighbor list but have greater than 5% of the handoff transitions. Remember, though, that the goal is to keep neighbor lists to a minimum (see below) so avoid adding sites that are obviously not immediate neighbors of the serving cell (i.e. try to make use of the composite neighbor list as much as possible).

Neighbor List Example• Referring to the figure, even if cell C appears as a handoff
candidate in the right half of cell A (shaded), it would not be put in the neighbor list.
– The assumption is that, if C is a handoff candidate then B certainly will be (if this is not true, there are bigger problems to be addressed first).
– C will be in B neighbor list and so the composite neighbor list sent to the mobile while in the right half of A will contain C. The advantage occurs when the mobile is in the left half of cell A since the mobile will not waste search time looking for cell C.
• Obviously the above diagram is very idealistic. Due to site selection issues and the topology of a real environment, many unusual cell arrangements will be found in the field. However, it illustrates the principle that, in order to reduce the search time to find new pilots, the aim should be to minimize neighbor lists.
CBA

Per-Site Analysis
• Analysis of data while locked to a single pilot can reveal configuration or performance issues of a particular site or sector.
• The script per_cell_data calls several awk scripts that extract per-site data and outputs two files:
– A file containing the average transmit gain adjust on a per-site basis for all sites in a run. This will highlight any sites having a significantly different link balance. The file contains both the average and the number of points over which that average was calculated so that many such files can be concatenated , imported into Excel and a numerically-correct average re-calculated over many runs. A site with a high transmit gain adjust may be suffering from a poor receiver noise figure or may be in a location where forward link interference is prevalent. A site with an abnormally low transmit gain adjust may have a low transmit power.
– A file containing all lines from the eva file for which the number of pilots locked = 1. A column containing the PN is also added. This will allow additional performance analysis on a per-site basis e.g. FER, traffic channel gain, Ew/No setpoint, finger separation.
Successful Call Records
• Characteristics of data if phone originates successfully, remains in service area, completes a handoff, makes normal release:– If only mobile data is available, the eva files will show:
• Receive power > -100dBm; Transmit power < +20dBm– Normal Transmit Gain (actual value due to configuration & settings)– Low forward FER, Good Ec/Io (> -10dB)
• Messaging will be reliable. In LPAR output, a basic call (originated and released from the mobile) will contain the following elements :– Origination message (sent to MTX on Access Channel).– Channel Assignment (received from MTX on Paging Channel).– Service Connect Message (received from SBS on traffic channel).– Service Connect Complete (to SBS - if exists, origination successful)– Pilot Strength Measurement Message (sent to SBS - initiates handoff).– Extended Handoff Direction Message (from SBS - directs handoff )– Handoff Completion Message (sent to SBS - confirms receipt EHDM)– Neighbor List Update Message (from SBS - new comp. Neighbor List)– Release Order (sent to SBS, or received from SBS)
Successful Call Analysis with Selector Logs
• Using the full eva files, the following can be established:
– Receive power > -100dBm, Transmit power < +20dBm
– Normal Transmit Gain Adjust (actual value depends on site configurations, loading, NOM_PWR setting)
– Ew/No setpoint below maximum (13dB at time of writing)
– Traffic Channel gain below maximum (192 (-1dB pilot) for rate set 2 at time of writing)
– Low forward FER, Low reverse FER (either full or all rate)
– Good Ec/Io (> -12dB)
• The sorted message list for the same basic call will contain the following IS-95 and NOIS messages:
– MessageType Source Destination Logged at Purpose
– Origination IS95 Mobile MTX Mobile
Loss of Coverage: Call DropMobile Data Characteristics
• Characteristics of data when phone is taken out of the service area or taken into a coverage hole.
• If only mobile data is available, the eva files will show:
– Low receive power (<-100dBm), High transmit power (> +20dBm)
– Higher than normal Transmit Gain Adjust (actual value depends on site configurations, loading, NOM_PWR setting)
– High forward FER, Low Ec/Io (< -10dB)
Loss of Coverage: Call DropMessaging Data Characteristics
• Under these conditions, messaging will be unreliable at best and will likely be the actual cause of the drop. The LPAR output may show some or all of the following:
– Repeats of the same message (check msg seq and ack seq #s)
• If a reverse message is repeated because an ack is not received, either it is not getting to the selector (reverse link is worse) or the fwd ack is not reaching the mobile (fwd link is worse). The eva files may show which but ideally selector logs are required.
– If a fwd message is repeated then the rvs ack is not reaching the selector (reverse link is worse).
– If the mobile repeats a message 3 times without seeing the ack, it will tear the call down and will go to the sync channel.
– If the selector repeats a message 5 times without seeing the ack, it will send a forward release and the call will be torn down. If the mobile sees the release, it will respond with a reverse release and stop transmitting. Otherwise, it will timeout when no good frames are received for TBD secs.
Forward Link InterferenceAnalysis with Mobile Data Only
• Characteristics of data for phone experiencing forward link interference from a source outside the CDMA system:
– Some likely sources of interference are: intermodulation from an AMPS-only BTS, co-channel interference from an AMPS BTS that has not been cleared from the CDMA channel, an adjacent CDMA operator using the same channel (this will remain until inter-system soft handoff is available), a microwave link, raised noise floor due to the transmitter spectrum of another CDMA operator in the same market but on a different channel.
• If only mobile data is available, the eva files will show:
– Good receive power (> -100dBm), Normal transmit power (< +20dBm)
– Higher than normal Transmit Gain Adjust (actual value depends on site configurations, loading, NOM_PWR setting)
– High forward FER, Low Ec/Io (< -10dB)
Forward Link InterferenceAnalysis of Messaging
• Under these conditions, forward link messaging will be unreliable at best and may be the actual cause of the drop. The LPAR output may show some or all of the following:– Repeats of the same message (check that the msg seq and ack seq nu
mbers are the same to ensure it is the same message).– If a reverse message is repeated because an ack is not received, either
it is not getting to the selector (reverse link is worse) or the fwd ack is not reaching the mobile (fwd link is worse). The eva files may indicate which is happening but ideally selector logs are required.
– If a fwd message is repeated then the rvs ack is not reaching the selector (reverse link is worse).
– If the mobile repeats a message 3 times without seeing the ack, it will tear the call down and will go to the sync channel.
– If the selector repeats a message 5 times without seeing the ack, it will send a forward release and the call will be torn down. If the mobile sees the release, it will respond with a reverse release and stop transmitting. Otherwise, it will timeout when no good frames are received for TBD secs.

CDMA Default Channel Allocation Order
AllocationOrder
1
2
3
4
5
6
7
8
9
10
11
800 MHzSystem A
283
242
201
160
119
78
37
1019*
691
n/a
n/a
800 MHzSystem B
384
425
466
507
548
589
630
777*
736*
n/a
n/a
1900 MHzSystem A
25
50
75
100
125
150
175
200
225
250
275
1900 MHzSystem B
425
450
475
500
525
550
575
600
625
650
675
1900 MHzSystem C
925
950
975
1000
1025
1050
1075
1100
1125
1150
1175
1900 MHzSystem D
325
350
375
n/a
n/a
n/a
n/a
n/a
n/a
n/a
n/a
1900 MHzSystem E
725
750
775
n/a
n/a
n/a
n/a
n/a
n/a
n/a
n/a
1900 MHzSystem F
825
850
875
n/a
n/a
n/a
n/a
n/a
n/a
n/a
n/a
CDMA 800 MHz. channel numbers are same frequencies as AMPS/D-AMPS channel numbers.
CDMA 1900 MHz. channel numbers are spaced 50 KHz. apart starting at the lower edge of the PCS band. Channel 0 is 1850.0 MHz. on uplink, 1930.0 MHz. on downlink.


![W-CDMA/LTE Area Optimization using ML8780A/81A · W-CDMA/LTE Area Optimization using ML8780A/81A Shoji Hamao, Yuji Yoshida [Summary] Mobile phone networks in Japan are switching from](https://static.fdocuments.net/doc/165x107/5dd138a7d6be591ccb64cd5a/w-cdmalte-area-optimization-using-ml8780a81a-w-cdmalte-area-optimization-using.jpg)