INTERIM FINAN CIAL RE POR T · ANDRITZ financial report Q1 - Q3 2018 Key figures at a glance...
30
FIRST THREE QUARTERS 2018 INTERIM FINAN CIAL REPORT
Transcript of INTERIM FINAN CIAL RE POR T · ANDRITZ financial report Q1 - Q3 2018 Key figures at a glance...
FI
RS
T
TH
RE
E
QU
AR
TE
RS
2
01
8
INTERIMFINANCIAL RE PORT

A N D R I T Z f i n a n c i a l r e p o r t Q 1 - Q 3 2 0 1 8
Key figures at a glance ANDRITZ GROUP 02
Business areas 03
Management report 04
Business areas Hydro 13
Pulp & Paper 14
Metals 16
Separation 17
Consolidated financial statements of the ANDRITZ GROUP Consolidated income statement 18
Consolidated statement of comprehensive income 19
Consolidated statement of financial position 20
Consolidated statement of cash flows 21
Consolidated statement of changes in equity 23
Statement by the Executive Board 24
Share 25
Glossary 27

A N D R I T Z f i n a n c i a l r e p o r t Q 1 - Q 3 2 0 1 8 K e y f i g u r e s o f t h e A N D R I T Z G R O U P
02
Unit Q1-Q3 2018 Q1-Q3 2017 +/- Q3 2018 Q3 2017 +/- 2017
Order intake MEUR 4,738.0 4,112.5 +15.2% 1,468.7 1,341.2 +9.5% 5,579.5
Order backlog (as of end of period) MEUR 6,882.8 6,650.8 +3.5% 6,882.8 6,650.8 +3.5% 6,383.0
Sales MEUR 4,200.8 4,143.6 +1.4% 1,437.7 1,364.6 +5.4% 5,889.1
Return on sales % 5.5 6.7 - 5.3 6.6 - 6.8
EBITDA MEUR 321.2 375.2 -14.4% 109.5 121.7 -10.0% 541.7
EBITA1) MEUR 252.2 306.2 -17.6% 85.9 98.9 -13.1% 444.0
Earnings Before Interest and Taxes (EBIT) MEUR 229.3 275.9 -16.9% 76.4 90.5 -15.6% 399.3
Earnings Before Taxes (EBT) MEUR 223.5 275.1 -18.8% 80.6 86.2 -6.5% 400.6
Net income (including non-controlling interests) MEUR 156.2 191.4 -18.4% 56.3 59.6 -5.5% 265.6
Net income (without non-controlling interests) MEUR 157.0 189.8 -17.3% 56.4 59.0 -4.4% 263.0
Cash flow from operating activities MEUR -85.0 129.2 -165.8% 16.2 47.7 -66.0% 246.5
Capital expenditure MEUR 69.3 81.5 -15.0% 22.1 25.6 -13.7% 116.8
Employees (as of end of period; without apprentices) - 26,397 25,686 +2.8% 26,397 25,686 +2.8% 25,566
Non-current assets MEUR 1,884.3 1,898.4 -0.7% 1,884.3 1,898.4 -0.7% 1,860.8
Current assets MEUR 4,707.9 4,394.4 +7.1% 4,707.9 4,394.4 +7.1% 4,404.5
Total shareholders’ equity MEUR 1,264.0 1,294.2 -2.3% 1,264.0 1,294.2 -2.3% 1,325.4
Non-current liabilities MEUR 1,655.3 1,626.6 +1.8% 1,655.3 1,626.6 +1.8% 1,565.7
Current liabilities MEUR 3,672.9 3,372.0 +8.9% 3,672.9 3,372.0 +8.9% 3,374.2
Total assets MEUR 6,592.2 6,292.8 +4.8% 6,592.2 6,292.8 +4.8% 6,265.3
Equity ratio % 19.2 20.6 - 19.2 20.6 - 21.2
Liquid funds MEUR 1,894.9 1,768.8 +7.1% 1,894.9 1,768.8 +7.1% 1,772.3
Net liquidity MEUR 501.0 878.2 -43.0% 501.0 878.2 -43.0% 908.0
Net debt MEUR -123.8 -491.8 +74.8% -123.8 -491.8 +74.8% -530.6
Net working capital MEUR 114.8 -112.3 +202.2% 114.8 -112.3 +202.2% -121.0
Capital employed MEUR 1,073.7 826.5 +29.9% 1,073.7 826.5 +29.9% 801.9
Gearing % -9.8 -38.0 +74.2% -9.8 -38.0 +74.2% -40.0
EBITDA margin % 7.6 9.1 - 7.6 8.9 - 9.2
EBITA margin % 6.0 7.4 - 6.0 7.2 - 7.5
EBIT margin % 5.5 6.7 - 5.3 6.6 - 6.8
Net income/sales % 3.7 4.6 - 3.9 4.4 - 4.5
Depreciation and amortization/sales % 2.2 2.4 - 2.3 2.3 - 2.3
1) Amortization of identifiable assets acquired in a business combination and recognized separately from goodwill amounts to 22,932 TEUR (Q1-Q3 2017: 30,268 TEUR; 2017: 38,301 TEUR); impairment of goodwill amounts to 0 TEUR (Q1-Q3 2017: 0 TEUR; 2017: 6,428 TEUR). All figures according to IFRS. Due to the utilization of automatic calculation programs, differences can arise in the addition of rounded totals and percentages.
KEY FIGURES OF THE ANDRITZ GROUP

A N D R I T Z f i n a n c i a l r e p o r t Q 1 - Q 3 2 0 1 8 K e y f i g u r e s o f t h e b u s i n e s s a r e a s
03
HYDRO
Unit Q1-Q3 2018 Q1-Q3 2017 +/- Q3 2018 Q3 2017 +/- 2017
Order intake MEUR 1,056.2 939.0 +12.5% 303.1 425.0 -28.7% 1,317.2
Order backlog (as of end of period) MEUR 2,718.2 3,038.7 -10.5% 2,718.2 3,038.7 -10.5% 2,921.8
Sales MEUR 1,085.8 1,071.5 +1.3% 361.5 346.9 +4.2% 1,583.1
EBITDA MEUR 85.8 94.0 -8.7% 28.7 36.8 -22.0% 154.1
EBITDA margin % 7.9 8.8 - 7.9 10.6 - 9.7
EBITA MEUR 65.3 73.3 -10.9% 21.9 30.1 -27.2% 123.0
EBITA margin % 6.0 6.8 - 6.1 8.7 - 7.8
Employees (as of end of period; without apprentices) - 7,343 7,365 -0.3% 7,343 7,365 -0.3% 7,237
PULP & PAPER
Unit Q1-Q3 2018 Q1-Q3 2017 +/- Q3 2018 Q3 2017 +/- 2017
Order intake MEUR 1,726.4 1,552.0 +11.2% 545.5 427.1 +27.7% 2,033.4
Order backlog (as of end of period) MEUR 2,148.5 1,899.1 +13.1% 2,148.5 1,899.1 +13.1% 1,787.0
Sales MEUR 1,523.2 1,474.3 +3.3% 513.7 483.4 +6.3% 2,059.7
EBITDA MEUR 157.0 148.8 +5.5% 50.9 51.4 -1.0% 221.5
EBITDA margin % 10.3 10.1 - 9.9 10.6 - 10.8
EBITA MEUR 136.7 129.7 +5.4% 43.8 45.0 -2.7% 194.9
EBITA margin % 9.0 8.8 - 8.5 9.3 - 9.5
Employees (as of end of period; without apprentices) - 8,518 7,982 +6.7% 8,518 7,982 +6.7% 8,002
METALS
Unit Q1-Q3 2018 Q1-Q3 2017 +/- Q3 2018 Q3 2017 +/- 2017
Order intake MEUR 1,403.3 1,143.6 +22.7% 456.6 329.4 +38.6% 1,606.5
Order backlog (as of end of period) MEUR 1,556.0 1,302.8 +19.4% 1,556.0 1,302.8 +19.4% 1,309.7
Sales MEUR 1,142.7 1,185.0 -3.6% 400.3 392.7 +1.9% 1,643.5
EBITDA MEUR 51.2 106.6 -52.0% 19.1 24.2 -21.1% 129.7
EBITDA margin % 4.5 9.0 - 4.8 6.2 - 7.9
EBITA MEUR 29.4 84.0 -65.0% 11.7 16.7 -29.9% 98.6
EBITA margin % 2.6 7.1 - 2.9 4.3 - 6.0
Employees (as of end of period; without apprentices) - 7,687 7,567 +1.6% 7,687 7,567 +1.6% 7,573
SEPARATION
Unit Q1-Q3 2018 Q1-Q3 2017 +/- Q3 2018 Q3 2017 +/- 2017
Order intake MEUR 552.1 477.9 +15.5% 163.5 159.7 +2.4% 622.4
Order backlog (as of end of period) MEUR 460.1 410.2 +12.2% 460.1 410.2 +12.2% 364.5
Sales MEUR 449.1 412.8 +8.8% 162.2 141.6 +14.5% 602.8
EBITDA MEUR 27.2 25.8 +5.4% 10.8 9.3 +16.1% 36.4
EBITDA margin % 6.1 6.3 - 6.7 6.6 - 6.0
EBITA MEUR 20.8 19.2 +8.3% 8.5 7.1 +19.7% 27.5
EBITA margin % 4.6 4.7 - 5.2 5.0 - 4.6
Employees (as of end of period; without apprentices) - 2,849 2,772 +2.8% 2,849 2,772 +2.8% 2,754
KEY FIGURES OF THE BUSINESS AREAS

A N D R I T Z f i n a n c i a l r e p o r t Q 1 - Q 3 2 0 1 8 M a n a g e m e n t r e p o r t
04
GENERAL ECONOMIC CONDITIONS
The economic upswing in the world’s main economic regions continued unchanged during the reporting period.
In the USA, the economy remained strong in spite of the trade dispute with China. Growth was driven above all
by strong private consumption and company investments. The unemployment rate decreased to just under 4.0%.
The US Federal Reserve (FED) raised the key interest rate at the end of September – as expected by market
experts – for the third time this year by 0.25 percentage points to a range between 2.00 and 2.25%. It also
announced four more interest rate hikes until the end of 2019. The Trump administration decided to introduce
new import duties with a volume of another 200 billion US dollars on Chinese goods. At the end of September,
the USA, Canada and Mexico agreed on a revised version and a new name for the NAFTA agreement. The new
trade agreement is to be called the USA-Mexico-Canada Agreement (USMCA) and will replace the almost 25-
year-old NAFTA. This trilateral agreement should result in freer markets, fairer trade and stronger economic
growth in the three countries concerned.
The economy in the euro zone – supported by the continuing expansive monetary policy of the European Central
Bank (ECB) – continued its positive development during the reporting period. The ECB left the key interest rate at
its record low of 0.0% in mid-September, but aims to end its multi-billion euro bond-purchase program at the end
of the year. As from October, the volume of monthly bond-purchases will be reduced to 15 billion euros.
As a result of the USA’s tight monetary policy, the currencies of many emerging markets with a current account
deficit (among others Turkey, Argentina, Brazil, and South Africa) and high debts in foreign currencies have come
under strong pressure. In order to stop the collapse in exchange rates for these currencies, the central banks in
the emerging markets increased interest rates substantially, which will have a negative effect on the economic
development of these countries in the medium to long term. In the meantime, many economic researchers have
substantially reduced their economic growth forecast for countries like Brazil, Turkey, and South Africa.
China’s economic growth has been losing momentum since the beginning of the year. Both industrial production
and expenditure for infrastructure investments have slowed down. Furthermore, the trade dispute between China
and the USA is putting additional pressure on the economy. Regardless of this, private consumption continued its
robust development. The OECD expects Gross Domestic Product (GDP) growth of approximately 6.7% for 2018.
Source: Research reports by various banks, OECD
MANAGEMENT REPORT

A N D R I T Z f i n a n c i a l r e p o r t Q 1 - Q 3 2 0 1 8 M a n a g e m e n t r e p o r t
05
MARKET DEVELOPMENT
Hydro
Global investment and project activity for electromechanical equipment for hydropower plants again continued at
a moderate level during the third quarter of 2018, particularly in Europe. Individual projects were only awarded
selectively during the reporting period – particularly in Asia. Good project activity was noted for pumps.
Pulp & Paper
The international pulp market continued its positive development of the preceding quarters. With a continuing
high demand for pulp – particularly from Chinese paper producers – accompanied by a stable supply, the price of
short-fiber pulp (eucalyptus) was around 1,050 USD per ton at the end of September 2018 and thus unchanged
compared to the end of June 2018. In contrast, the price for NBSK (Northern Bleached Softwood Kraft Pulp)
long-fiber pulp increased slightly from around 1,200 USD per ton at the end of June 2018 to approximately
1,230 USD per ton at the end of September 2018.
Overall, the market for pulping equipment showed good project activity, particularly for modernization of existing
pulp mills. Unchanged, good project and investment activity was also noted for power generating boilers,
particularly in China and Japan.
Metals
In the Metal Forming sector for the automotive and automotive supplying industry (Schuler), the third quarter of
2018 showed satisfactory project and investment activity. Some individual orders were awarded selectively by
international car manufacturers and their suppliers. Project and investment activity in the market segment served
by Yadon in the Chinese automotive supplying industry continued to see favorable development.
Project and investment activity for equipment for the production and processing of stainless steel and carbon
steel strip continued to be satisfactory during the third quarter of 2018. The demand for stainless and carbon
steel supported by the overall good global economic environment and the related higher capacity utilization at
international steel producing companies led to numerous new and modernization projects, particularly in Asia,
Europe, and North America. The intensity of competition on the equipment market remained challenging despite
the good market environment.
Separation
The global markets for solid/liquid separation equipment continued their positive trend during the reporting
period. In particular, the environmental (municipal and industrial sewage sludge dewatering and drying) and
chemical sectors showed unchanged good project activity. Satisfactory project activity was noted in the mining
industry. Investment activity in the food industry slightly improved from the low levels of the preceding quarters.

A N D R I T Z f i n a n c i a l r e p o r t Q 1 - Q 3 2 0 1 8 M a n a g e m e n t r e p o r t
06
BUSINESS DEVELOPMENT
Sales
Sales of the ANDRITZ GROUP amounted to 1,437.7 MEUR in the third quarter of 2018 and were thus 5.4%
higher than the reference figure of the previous year (Q3 2017: 1,364.6 MEUR). All four business areas were able
to increase their sales compared to the previous year. The increase in sales is primarily due to the Pulp & Paper
business area (+6.3%) – thanks to its strong service business – and the Separation business area (+14.5%) – due
to the positive development of order intake in the preceding quarters. Sales in the Hydro (+4.2%) and Metals
(+1.9%) business areas also increased slightly compared to the previous year.
Group sales in the first three quarters of 2018 amounted to 4,200.8 MEUR, thus practically reached the same
level as the previous year’s reference figure (+1.4% versus Q1-Q3 2017: 4,143.6 MEUR). The business areas’
sales development at a glance:
Unit Q1-Q3 2018 Q1-Q3 2017 +/-
Hydro MEUR 1,085.8 1,071.5 +1.3%
Pulp & Paper MEUR 1,523.2 1,474.3 +3.3%
Metals MEUR 1,142.7 1,185.0 -3.6%
Separation MEUR 449.1 412.8 +8.8%
A
B
C
D
E
F
4120141384
(37)
(22)
(15)
(12)
(10)
(4)
E u r o p e
N o r t h A m e r i c a
C h i n a
A s i a ( w i t h o u t C h i n a )
S o u t h A m e r i c a
A f r i c a , A u s t r a l i a
A
B
C
D
26362711
(26)
(35)
(29)
(10)
H y d r o
P u l p & P a p e r
M e t a l s
S e p a r a t i o n
A
B
C
D
EF
Sales by regionQ1-Q3 2018 in %
(Q1-Q3 2017)
Sales by business areaQ1-Q3 2018 in %
(Q1-Q3 2017)
A
B
C
D

A N D R I T Z f i n a n c i a l r e p o r t Q 1 - Q 3 2 0 1 8 M a n a g e m e n t r e p o r t
07
Share of service sales for the Group and by business area in %
Q1-Q3 2018 Q1-Q3 2017 Q3 2018 Q3 2017
ANDRITZ GROUP 35 34 36 34
Hydro 28 29 28 29
Pulp & Paper 46 43 48 42
Metals 22 24 23 25
Separation 47 49 45 48
Order intake
The order intake of the Group saw a satisfactory in the third quarter of 2018 and, at 1,468.7 MEUR, was 9.5%
higher than the figure for the previous year’s reference period (Q3 2017: 1,341.2 MEUR). The business areas’
development in detail:
Hydro: In an unchanged moderate global market environment, the order intake amounted to 303.1 MEUR and
was thus significantly lower than the high figure for the previous year’s reference period (-28.7% versus Q3 2017:
425.0 MEUR), which included some medium-sized orders (including some in Canada and China).
Pulp & Paper: At 545.5 MEUR, the order intake reached a very favorable level – both for the capital and service
business – and increased significantly compared to the previous year’s reference figure (+27.7% versus Q3 2017:
427.1 MEUR).
Metals: Order intake amounted to 456.6 MEUR and was thus 38.6% higher than the level for the previous year’s
reference period (Q3 2017: 329.4 MEUR). This increase is primarily attributable to the Metals Processing sector,
which booked a medium-sized order for a hot-galvanizing line in Germany. The Metal Forming sector for the
automotive and automotive supplying industry (Schuler) noticed a stable development compared to the previous
year’s reference period.
Separation: Order intake amounted to 163.5 MEUR and was thus practically at the same level as for the
previous year’s reference period (+2.4% versus Q3 2017: 159.7 MEUR). The Feed Technologies sector saw very
positive development, with a significant increase in order intake compared to the previous year’s reference
period.
In the first three quarters of 2018, the Group’s order intake at 4,738.0 MEUR was significantly higher than the low
level of the previous year’s reference period (+15.2% versus Q1-Q3 2017: 4,112.5 MEUR). All four business areas
were able to increase their order intake significantly compared to the previous year. The business areas’ order
intake development at a glance.
Unit Q1-Q3 2018 Q1-Q3 2017 +/-
Hydro MEUR 1,056.2 939.0 +12.5%
Pulp & Paper MEUR 1,726.4 1,552.0 +11.2%
Metals MEUR 1,403.3 1,143.6 +22.7%
Separation MEUR 552.1 477.9 +15.5%

A N D R I T Z f i n a n c i a l r e p o r t Q 1 - Q 3 2 0 1 8 M a n a g e m e n t r e p o r t
08
Order backlog
As of September 30, 2018, the order backlog of the ANDRITZ GROUP amounted to 6,882.8 MEUR (+7.8%
versus December 31, 2017: 6,383.0 MEUR).
A
B
C
D
E
F
3719171656
(40)
(18)
(10)
(22)
(7)
(3)
E u r o p e
C h i n a
A s i a ( w i t h o u t C h i n a )
N o r t h A m e r i c a
S o u t h A m e r i c a
A f r i c a , A u s t r a l i a
A
B
C
D
22363012
(23)
(37)
(28)
(12)
H y d r o
P u l p & P a p e r
M e t a l s
S e p a r a t i o n
A
B
C
D
EF
Order intake by regionQ1-Q3 2018 in %
(Q1-Q3 2017)
Order intake by business areaQ1-Q3 2018 in %
(Q1-Q3 2017)
A
B
C
D
A
B
C
D
3931237
(45)
(28)
(21)
(6)
H y d r o
P u l p & P a p e r
M e t a l s
S e p a r a t i o n
A
B
C
D
E
F
3620171386
(37)
(19)
(15)
(16)
(8)
(5)
E u r o p e
A s i a ( w i t h o u t C h i n a )
C h i n a
N o r t h A m e r i c a
S o u t h A m e r i c a
A f r i c a , A u s t r a l i a
Order backlog by regionas of September 30, 2018 in %
(December 31, 2017)
Order backlog by business areaas of September 30, 2018 in %
(December 31, 2017)
A
B
C
D
A
B
C
D
EF
A N D R I T Z f i n a n c i a l r e p o r t Q 1 - Q 3 2 0 1 8 M a n a g e m e n t r e p o r t
09
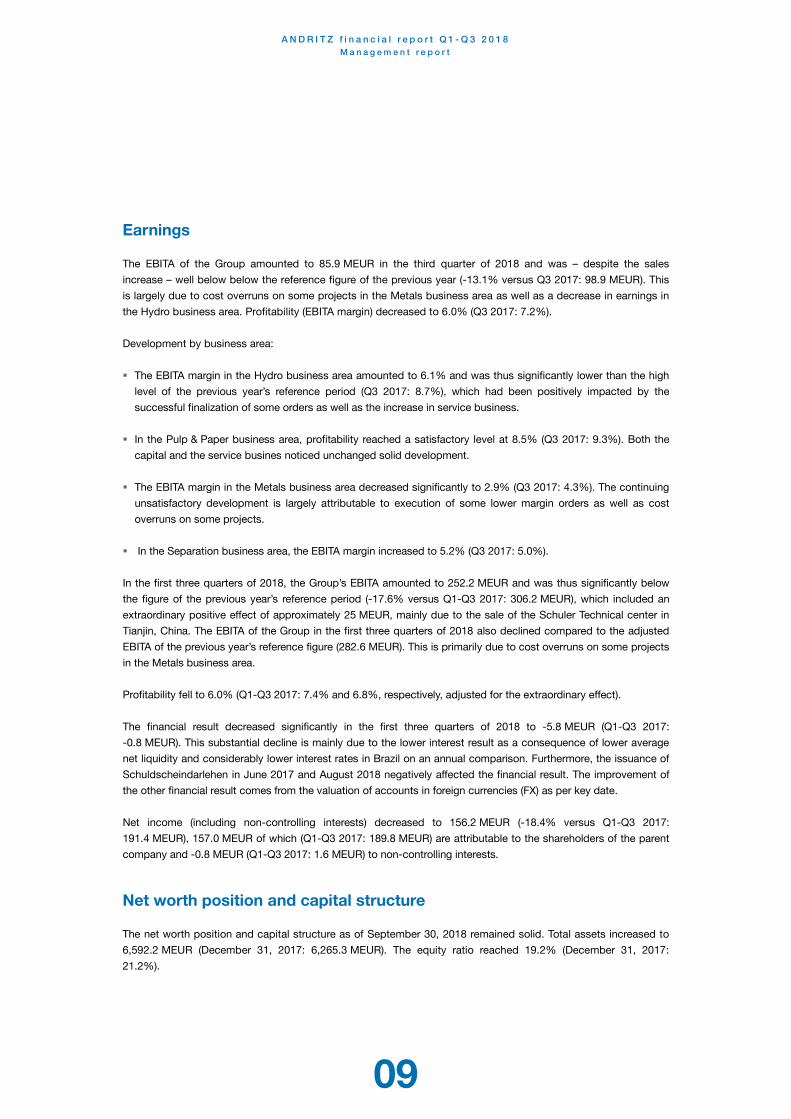
Earnings
The EBITA of the Group amounted to 85.9 MEUR in the third quarter of 2018 and was – despite the sales
increase – well below below the reference figure of the previous year (-13.1% versus Q3 2017: 98.9 MEUR). This
is largely due to cost overruns on some projects in the Metals business area as well as a decrease in earnings in
the Hydro business area. Profitability (EBITA margin) decreased to 6.0% (Q3 2017: 7.2%).
Development by business area:
The EBITA margin in the Hydro business area amounted to 6.1% and was thus significantly lower than the high
level of the previous year’s reference period (Q3 2017: 8.7%), which had been positively impacted by the
successful finalization of some orders as well as the increase in service business.
In the Pulp & Paper business area, profitability reached a satisfactory level at 8.5% (Q3 2017: 9.3%). Both the
capital and the service busines noticed unchanged solid development.
The EBITA margin in the Metals business area decreased significantly to 2.9% (Q3 2017: 4.3%). The continuing
unsatisfactory development is largely attributable to execution of some lower margin orders as well as cost
overruns on some projects.
In the Separation business area, the EBITA margin increased to 5.2% (Q3 2017: 5.0%).
In the first three quarters of 2018, the Group’s EBITA amounted to 252.2 MEUR and was thus significantly below
the figure of the previous year’s reference period (-17.6% versus Q1-Q3 2017: 306.2 MEUR), which included an
extraordinary positive effect of approximately 25 MEUR, mainly due to the sale of the Schuler Technical center in
Tianjin, China. The EBITA of the Group in the first three quarters of 2018 also declined compared to the adjusted
EBITA of the previous year’s reference figure (282.6 MEUR). This is primarily due to cost overruns on some projects
in the Metals business area.
Profitability fell to 6.0% (Q1-Q3 2017: 7.4% and 6.8%, respectively, adjusted for the extraordinary effect).
The financial result decreased significantly in the first three quarters of 2018 to -5.8 MEUR (Q1-Q3 2017:
-0.8 MEUR). This substantial decline is mainly due to the lower interest result as a consequence of lower average
net liquidity and considerably lower interest rates in Brazil on an annual comparison. Furthermore, the issuance of
Schuldscheindarlehen in June 2017 and August 2018 negatively affected the financial result. The improvement of
the other financial result comes from the valuation of accounts in foreign currencies (FX) as per key date.
Net income (including non-controlling interests) decreased to 156.2 MEUR (-18.4% versus Q1-Q3 2017:
191.4 MEUR), 157.0 MEUR of which (Q1-Q3 2017: 189.8 MEUR) are attributable to the shareholders of the parent
company and -0.8 MEUR (Q1-Q3 2017: 1.6 MEUR) to non-controlling interests.
Net worth position and capital structure
The net worth position and capital structure as of September 30, 2018 remained solid. Total assets increased to
6,592.2 MEUR (December 31, 2017: 6,265.3 MEUR). The equity ratio reached 19.2% (December 31, 2017:
21.2%).

A N D R I T Z f i n a n c i a l r e p o r t Q 1 - Q 3 2 0 1 8 M a n a g e m e n t r e p o r t
10
Liquid funds amounted to 1,894.9 MEUR (December 31, 2017: 1,772.3 MEUR), net liquidity amounted to
501.0 MEUR (December 31, 2017: 908.0 MEUR). The decrease in net liquidity mainly resulted from payments for
acquisitions, lower customer advances as well as cash outflows due to cost overruns on some projects.
In the third qarter of 2018, ANDRITZ AG issued a Schuldscheindarlehen with a volume of 500 MEUR in order to provide funds for corporate financing including refinancing and for acquisition financing.
In addition to the high liquidity, the ANDRITZ GROUP also had the following credit and surety lines for
performance of contracts, down payments, guarantees, etc. at its disposal:
Credit lines: 164 MEUR, thereof 115 MEUR utilized
Surety lines: 5,990 MEUR, thereof 2,614 MEUR utilized
Employees
As of September 30, 2018, the number of ANDRITZ GROUP employees amounted to 26,397 (December 31,
2017: 25,566 employees).
A
B
C
1 , 8 8 4 . 3 M E U R
2 , 9 6 3 . 0 M E U R
1 , 7 4 4 . 9 M E U R
L o n g - t e r m a s s e t s : 2 9 %
S h o r t - t e r m a s s e t s : 4 5 %
C a s h a n d c a s h e q u i v a l e n t s a n d i n v e s t m e n t s : 2 6 %
Assets
A B C
A
B
C
D
1 , 2 6 4 . 0 M E U R
1 , 3 9 9 . 6 M E U R
7 0 3 . 2 M E U R
3 , 2 2 5 . 4 M E U R
S h a r e h o l d e r s ' e q u i t y i n c l . n o n - c o n t r o l l i n g i n t e r e s t s : 1 9 %
F i n a n c i a l l i a b i l i t i e s : 2 1 %
O t h e r l o n g - t e r m l i a b i l i t i e s : 1 1 %
O t h e r s h o r t - t e r m l i a b i l i t i e s : 4 9 %
Shareholders' equity and liabilities
A B C D
A N D R I T Z f i n a n c i a l r e p o r t Q 1 - Q 3 2 0 1 8 M a n a g e m e n t r e p o r t
11
Major risks during the remaining months of the financial year
General risks ANDRITZ is a globally-operating company serving a large variety of industrial markets and customers. As such,
the Group is subject to certain general and industry-specific risks. The active risk management implemented by
the ANDRITZ GROUP for many years now serves both to safeguard the company’s existence in the long term as
well as to increase its value, and is thus an essential success factor for the entire Group. For the purposes of
value-oriented company management, risk management is an integral part of the business processes and
extends over all strategic and operative levels.
ANDRITZ has a Group-wide internal control and steering system (ICS) whose main task is to identify nascent
risks at an early stage and – if possible – to implement countermeasures promptly. This system is an important
element of active corporate management. However, there is no guarantee that these monitoring and control
systems are effective enough.
A detailed description of the strategic and operational risks and information on the internal control and risk
management system are available in the ANDRITZ annual financial report for 2017.
Current risks The latent trade dispute between the USA and China, Mexico, and Canada (25% import duties on steel and 10%
on aluminum) could have an appreciable negative impact on the global economy and thus on business
development of ANDRITZ. Furthermore, additional increases in interest rates by the US Federal Reserve could
lead to a widespread currency crisis in the emerging markets. However, the volume of loans in foreign currency
held by ANDRITZ subsidiaries in the emerging markets can be classified as very small.
The medium- to long-term effects that the US trade policy will have on the global economy cannot be estimated
yet. ANDRITZ has a very strong local presence in the USA, including Xerium Technologies, Inc. (now: ANDRITZ
Fabrics and Rolls) acquired in October, with approximately 30 production and service locations and
approximately 2,500 employees. All four business areas are represented in the USA. From today’s perspective,
the effects on ANDRITZ can be considered insignificant. However, if other regulatory measures are implemented
that have negative consequences for non-American companies, the effects on ANDRITZ may well be substantial.
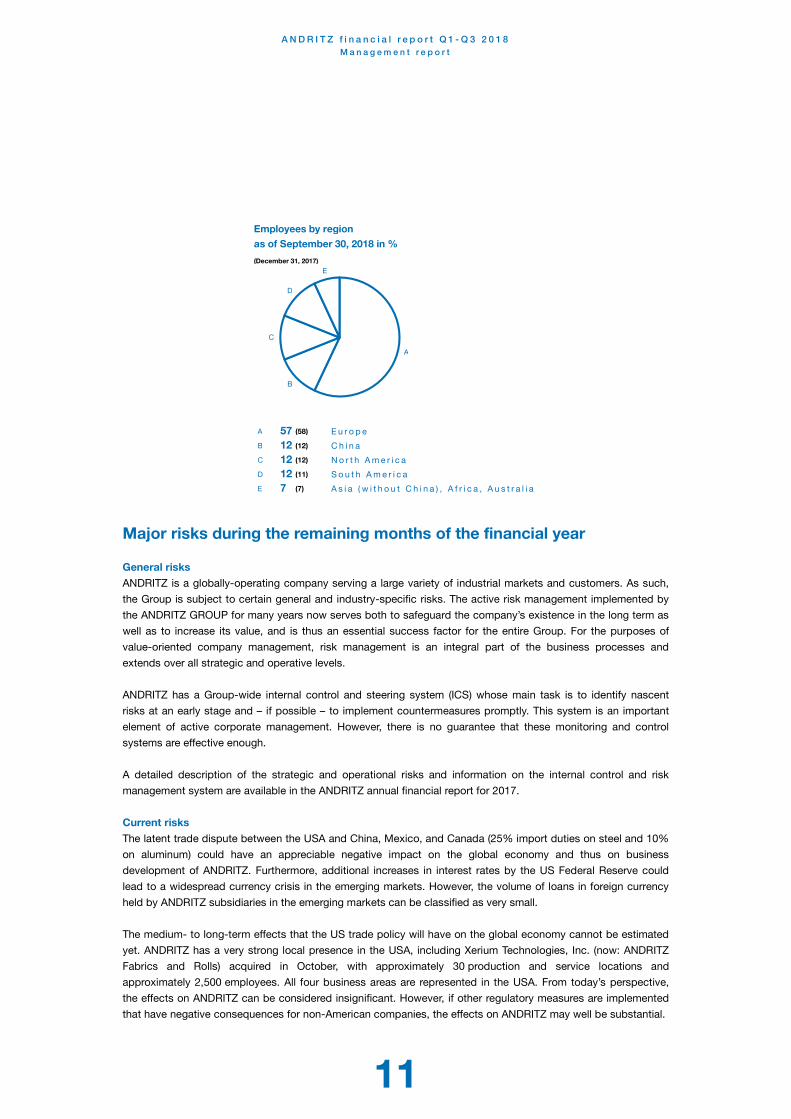
A
B
C
D
E
571212127
(58)
(12)
(12)
(11)
(7)
E u r o p e
C h i n a
N o r t h A m e r i c a
S o u t h A m e r i c a
A s i a ( w i t h o u t C h i n a ) , A f r i c a , A u s t r a l i a
Employees by regionas of September 30, 2018 in %
(December 31, 2017)
A
B
C
D
E

A N D R I T Z f i n a n c i a l r e p o r t Q 1 - Q 3 2 0 1 8 M a n a g e m e n t r e p o r t
12
The long-term economic impact of the United Kingdom leaving the European Union cannot be estimated yet.
However, its influence is expected to be low. If economic growth in Europe dropped significantly as a result, this
could have a negative impact on business development of the ANDRITZ GROUP because Europe is its most
important economic region, accounting for an average of 35-40% of its total sales. However, the ANDRITZ
GROUP’s direct business volume in the UK can be classified as very small.
Impact of exchange rate fluctuations Fluctuations in exchange rates in connection with execution of the order backlog are largely hedged by forward
exchange contracts and swaps. Net currency exposure of orders in foreign currencies is hedged by forward
contracts. Exchange rate risks resulting from the recognition of equity are not hedged.
Changes in the exchange rate of the euro against many other currencies could have both a positive and a
negative impact on the shareholders’ equity as well as on the sales and earnings development of the ANDRITZ
GROUP (translation effect).
OUTLOOK
Although economic experts are expecting unchanged positive economic development in the world’s main
economic regions for the remaining months of 2018, they anticipate a slightly negative impact on global
economic development in the coming year in view of the latent trade disputes, particularly between the USA and
China, as well as the currency devaluation in many emerging markets.
The prospects for the ANDRITZ business areas remain largely unchanged compared to the previous quarter. In
the Hydro business area, the overall moderate market development for electromechanical equipment for
hydropower plants is expected to continue. Many modernization projects are still postponed or temporarily
stopped, particularly in Europe, due to the continuing low electricity wholesale prices. Some larger, new
hydropower projects are currently in the planning phase, especially in Southeast Asia and Africa; selective award
of individual large-scale projects is likely. In the Pulp & Paper business area, unchanged good project and
investment activity is expected. Some projects to build new pulp mills are currently in the evaluation phase and
could be awarded in the medium term. Satisfactory project and investment activity is anticipated in the Metals
business area – both in the metal forming (Schuler) and metal processing (plants for production and finishing of
steel strip) sectors. A continuation of the positive market development is also expected in the Separation
business area.
The ANDRITZ GROUP expects unchanged stable development of sales in the 2018 business year as compared
to the previous year. However, the Group’s profitability (EBITA margin) will be significantly lower than the previous
year’s reference figure due to provisions – to be booked in Q4 2018 – amounting to well above 20 million euros
made for capacitive restructuring adjustments in the Metal Forming sector (Schuler) and in the Hydro business
area. Profitability excluding this extraordinary effect (EBITA margin) should however reach almost the level of the
previous year (7.1% excluding extraordinary effect; 7.5% reported).
However, if the global economy suffers a stronger setback in the coming months, this could have a negative
impact on ANDRITZ’s business development. This may lead to organizational and capacity adjustments and, as a
result, to possible financial provisions that could have a negative effect on the ANDRITZ GROUP’s earnings.

A N D R I T Z f i n a n c i a l r e p o r t Q 1 - Q 3 2 0 1 8 H y d r o
13
IMPORTANT EVENTS
In Norway, the Lysebotn II project was completed successfully and handed over the customer, Lyse Produksjon
AS, for commercial operation. The power plant was officially inaugurated in the presence of the Norwegian Prime
Minister. The order included supply and installation of turbines and generators as well as penstocks and gates for
the Lysebotn II hydropower station that replaces the older Lysebotn I power plant. In future, the new power
station will supply enough electricity to supply 75,000 Norwegian households per year.
Start-up and commissioning of the second unit at Xekaman Xanxay hydropower plant, Lao People’s Democratic
Republic, was successfully completed, and the plant was handed over to the customer, Song Da Cooperation,
Vietnam, for commercial use. The scope of supply comprised the electromechanical equipment, service, two bulb
turbines, generators, and the electrical auxiliary equipment. With 32 MW of installed power and an annual
electrical energy output of 131.2 GWh, the hydropower plant is an important part of the 300-MW-hydropower
plant Xekaman 1.
IMPORTANT ORDERS
Customer Country Scope of supply
Barki Tojik OJSC Tadzhikistan Rehabilitation and modernization of the entire electromechanical equipment, including inspection and repairs of nine penstocks for the Nurek hydropower plant The scope of supply comprises comprehensive modernization of the existing nine generating units by supplying and installing new 380 MW Francis turbines and generators. In addition, the transformers and the general electrical and mechanical auxiliary drives in the power house will be refurbished. After modernization, the installed capacity of generating units will be increased by about 12%.
AGRIMECO Vietnam Delivery of the complete electromechanical equipment for Ban Mong hydropower plant, consisting of two 22.5 MW-bulb turbine units, mechanical auxiliaries, electrical equipment and power plant automation as well as installation work and commissioning.
Dong Fang Electric Uzbekistan Delivery of the mechanical equipment for the Kamolot 18 small-scale hydropower plant.
Besalco Energia Renovables SA
Chile Delivery and installation of the complete electromechanical equipment for the Digua small-scale hydropower plant.
HYDRO

A N D R I T Z f i n a n c i a l r e p o r t Q 1 - Q 3 2 0 1 8 P u l p & P a p e r
14
IMPORTANT EVENTS
In October 2018, ANDRITZ and ARAUCO signed a contract for supply of major technologies and equipment for
the modernization and extension of the ARAUCO pulp mill in Chile. The order value for ANDRITZ is in the range
of around 300 million Euros. For the new 1.5 million tons per year bleached eucalyptus kraft (BEK) pulp line,
ANDRITZ will supply – on an EPS basis (EPS: Engineering, Procurement, Supervision) – the woodyard, fiberline,
white liquor plant, and evaporation system.
In October, ANDRITZ has successfully closed the acquisition of Xerium Technologies, Inc. (now ANDRITZ Fabrics
and Rolls). The company is a global manufacturer and supplier of machine clothing and roll covers for paper,
tissue, and board machines and expands the ANDRITZ product range in this area.
ANDRITZ successfully started-up a new PrimeLine COMPACT VI high-speed tissue machine at Bashundhara
Paper Mills, Bangladesh. The turnkey tissue production line produces high-quality facial wipes, toilet paper, and
napkins. The scope of suppy included the complete stock preparation, tissue machine, as well as complete
automation and electrification. The tissue machine has a design speed of 2,100 m/min and a paper width of
2.85°m. The 16 ft. Yankee is made entirely of steel, thus enabling high and efficient drying performance.
ANDRITZ successfully completed the upgrade and modernization project at Chelny’s PM K-28 paper
machine in Russia. The scope of supply to Narodnoye Predpriyatie Naberezhnye Chelny Paper Mill
included a new PrimeCoat Size press with a PrimeAir Glide air turn and a new PrimeReel pope reel with two new
under-the-machine pulpers. Additionally, complete new electromechanical drives for the paper machine and a
new QC system were also installed.
ANDRITZ successfully started up a new SCP (SCP: Semi Chemical Pulping) line at Shandong Sun Honghe Paper
Mill, a new stock preparation and approach flow system at Shandong Chenming Paper as well as a new stock
preparation and approach flow system at Shouguang Meilun Paper Mill in China.
ANDRITZ successfully started-up a pressurized refining system for Hunton Isolasjon AS, Gjøvik, Norway. Another
ANDRITZ pressurized refining system with a total capacity of 700 tons per day recently started-up at Kijchai
Enterprise in Thailand.
PULP & PAPER

A N D R I T Z f i n a n c i a l r e p o r t Q 1 - Q 3 2 0 1 8 P u l p & P a p e r
15
IMPORTANT ORDERS
Customer Country Scope of supply
Zellstoff Celgar Canada Replacement of the baling line for paper machine #2 (PM2).
Shanying Huazhong paper China Supply of a complete reject handling system.
La Méridionale France Delivery of a SeaSOx dry scrubber.
Kuantum Papers India Supply of a HERB recovery boiler (HERB: High Energy Recovery Boiler) and evaporation plant.
PT Fajar Surya Wisesa Indonesia Supply of two drum pulpers and a reject handling system.
PT Dayasa Aria Prima Indonesia Delivery of one new OCC-line (OCC: Old Corrugated Containers) with a capacity of 700°tons per day (tpd) for paper machine #1 (PM1) including a drum pulper; Delivery of one new OCC-line (capacity: 400 tpd) for PM2/3/5 including a drum pulper; Delivery of a reject handling system for 700 tpd and 400 tpd OCC line.
Daio Paper Japan Delivery of a HERB recovery boiler; Supply of new key equipment and services for the white liquor plant. Modernization of the fiberline including new DD-Washer (DD: Drum Displacer) and high-pressure feeder with UniGrid.
Sun Paper Holding Lao Laos Supply of refiners, MC pumps (MC: Medium Consistency), Board Machine Approach Systems and Broke Handling, and reject handling for PM1 and PM2.
JSC Ilim Group Russia Delivery of a new LMD Lime Kiln, including supervision and start up.
SAKER Slovakia Delivery of a Universal Rotary Shear UC (UC: Universal Cutter) and a Universal Granulator UG (UG: Universal Granulator).
Papelera Guipuzcoana de Zicuñaga
Spain Upgrade of recovery boiler capacity and modernization of the fiberline.

A N D R I T Z f i n a n c i a l r e p o r t Q 1 - Q 3 2 0 1 8 M e t a l s
16
IMPORTANT EVENTS
Schuler has acquired the Italian forging line manufacturer Farina Presse. In acquiring this mechanical engineering
specialist, based in Suello in Northern Italy, the Schuler Group has completed its product portfolio in the forging
and single-stroke press segment. Schuler is thus strengthening its market position in the middle price-
performance segment.
Schuler opened a new service location in Querétaro, one of the fastest growing economic regions of Mexico, with
many car manufacturing companies and their suppliers. This is now the third location in Mexico following Puebla
in the south and Saltillo in the northern part of the country.
ANDRITZ has acquired ASKO, Inc., a family-owned company headquartered in Homestead, Pennsylvania, USA.
ASKO has approximately 140 employees and generates annual sales of approximately 40 million US dollars. The
company manufactures a wide range of knives, blades, liners, wear plates, and accessories for the metals
producing, processing, and recycling industries. For ANDRITZ, the acquisition further complements the service
offerings for the metals industry.
IMPORTANT ORDERS
Customer Country Scope of supply
Volkswagen Germany Delivery of a 25,000 kilonewtons (kN) tryout press with ServoDirect technology for die testing.
LUK Mexico Delivery of a transfer press (press force: 29,000 kN) to produce structural components for the automotive industry.
PWO Czech Republic Supply of a 25,000 kN transfer press with TwinServo technology to produce structural components for the car industry.
Otto Fuchs Germany Supply of a forging press (press force: 300,000 kN) to produce aircraft landing gear, engine discs and structural components.
Zhejiang Jingu Wheel China Delivery of an 8,000 kN hot-stamping line including furnace, die cooling plant and automation for the production of wheel discs for press-hardened truck wheels made of steel.
Alfa Laval South Korea Supply of a multi-cylinder press (press force: 25,000 kN) including automation for production of heat exchanger plates.
Jiangsu Dayang PF China Delivery of a mechanical multi-station press (press force: 20,000 kN) for the production of warm-forged components.
Daimler Germany Delivery of tool sets for manufacture of car side panels.
Shougang Jingtang United Iron & Steel Co., Ltd.
China Delivery of a S6-high cold rolling mill with an annual capacity of 280,000 tons. The ANDRITZ scope of supply includes engineering work, delivery of core mechanical equipment components, electrical equipment, the automation system as well as supervision of installation and start-up of the rolling mill stand. The new plant is designed to process high-strength steel grades.
thyssenkrupp Steel Europe Germany Supply of a complete hot-dip galvanizing line including the mechanical and electrical equipment, as well as the entire process part including the furnace and also start-up of the plant. The new line has an annual capacity of 530,000 tons and is designed to produce high-strength steel grades, mainly for the automotive industry.
HBIS Group Co. Ltd. China Supply of two strip processing furnaces: Furnace #1 is for a continuous annealing line to produce the latest generation of advanced high-strength steel (AHSS) and martensitic steel. The annual capacity of the line is 825,000 tons. Furnace #2 is an L-shaped type with an ANDRITZ directly fired furnace (DFF) for a continuous hot-galvanizing line to produce hot-rolled products including dual-phase steel. The annual capacity of the line is 412,000 tons.
METALS

A N D R I T Z f i n a n c i a l r e p o r t Q 1 - Q 3 2 0 1 8 S e p a r a t i o n
17
IMPORTANT ORDERS
Customer / Industry Country Scope of supply
K L Ballantyne Pty Ltd / Food
Australia Two vacuum drum dryers.
Marine Collagen ehf. / Food Iceland Single drum dryer.
Farabi Petrochemicals Company Jubail / Chemicals
Saudi Arabia Three siphon peeler centrifuges; two paddle dryer and auxiliary equipment.
Cas. La Contadina / Food Italy Separator with Crematic Skimmer.
Poppels Bryggeri / Food Sweden Separator.
SEPARATION

A N D R I T Z f i n a n c i a l r e p o r t Q 1 - Q 3 2 0 1 8 C o n s o l i d a t e d i n c o m e s t a t e m e n t
18
For the first three quarters of 2018 (unaudited)
(in TEUR) Q1-Q3 2018 Q1-Q3 2017 Q3 2018 Q3 2017
Sales 4,200,767 4,143,619 1,437,685 1,364,621
Changes in inventories of finished goods and work in progress 105,266 99,019 20,656 10,403
Capitalized cost of self-constructed assets 2,005 6,063 328 1,257
4,308,038 4,248,701 1,458,669 1,376,281
Other operating income 56,698 127,893 19,097 32,012
Cost of materials -2,159,211 -2,126,523 -748,315 -704,780
Personnel expenses -1,292,400 -1,273,492 -420,168 -410,213
Other operating expenses -591,965 -601,371 -199,834 -171,594
Earnings Before Interest, Taxes, Depreciation, and Amortization (EBITDA) 321,160 375,208 109,449 121,706
Depreciation, amortization, and impairment of intangible assets and of property, plant, and equipment -91,897 -99,283 -33,128 -31,220
Earnings Before Interest and Taxes (EBIT) 229,263 275,925 76,321 90,486
Result from associated companies 6 -649 59 -334
Interest income 15,970 26,350 4,881 6,914
Interest expenses -28,000 -31,068 -10,757 -12,246
Other financial result 6,249 4,542 10,047 1,413
Financial result -5,775 -825 4,230 -4,253
Earnings Before Taxes (EBT) 223,488 275,100 80,551 86,233
Income taxes -67,251 -83,732 -24,198 -26,705
NET INCOME 156,237 191,368 56,353 59,528
Thereof attributable to:
Shareholders of the parent 157,014 189,796 56,392 58,990
Non-controlling interests -777 1,572 -39 538
Weighted average number of no-par value shares 101,019,457 102,008,137 100,974,858 101,926,058
Basic earnings per no-par value share (in EUR) 1.55 1.86 0.55 0.58
Effect of potential dilution of share options 0 112,014 9,398 88,734
Weighted average number of no-par value shares and share options 101,019,457 102,120,151 100,984,256 102,014,792
Diluted earnings per no-par value share (in EUR) 1.55 1.86 0.55 0.58
CONSOLIDATED INCOME STATEMENT

A N D R I T Z f i n a n c i a l r e p o r t Q 1 - Q 3 2 0 1 8 C o n s o l i d a t e d s t a t e m e n t o f c o m p r e h e n s i v e i n c o m e
19
For the first three quarters of 2018 (condensed, unaudited)
(in TEUR) Q1-Q3 2018 Q1-Q3 2017 Q3 2018 Q3 2017
NET INCOME 156,237 191,368 56,353 59,528
Items that may be reclassified to profit or loss:
Currency translation adjustments of foreign operations -23,097 -55,069 -14,801 -14,646
Result from available-for-sale financial assets, net of tax -36 -8,599 0 -2,742
Result from cash flow hedges, net of tax 963 1,048 963 659
Result from associated companies, accounted for using the equity method, net of tax -99 -441 -172 -83
Items that will not be reclassified to profit or loss:
Actuarial gains/losses, net of tax 0 0 0 0
Result from fair value valuation of financial assets, net of tax -20,065 0 -7,048 0
Result from associated companies, accounted for using the equity method, net of tax 0 0 0 0
OTHER COMPREHENSIVE INCOME -42,334 -63,061 -21,058 -16,812
TOTAL COMPREHENSIVE INCOME 113,903 128,307 35,295 42,716
Thereof attributable to:
Shareholders of the parent 115,035 127,653 35,715 42,409
Non-controlling interests -1,132 654 -421 307
CONSOLIDATED STATEMENT OF COMPREHENSIVE INCOME

A N D R I T Z f i n a n c i a l r e p o r t Q 1 - Q 3 2 0 1 8 C o n s o l i d a t e d s t a t e m e n t o f f i n a n c i a l p o s i t i o n
20
As of September 30, 2018 (unaudited)
(in TEUR) September 30, 2018 December 31, 2017
ASSETS
Intangible assets 183,216 160,701
Goodwill 597,969 547,637
Property, plant, and equipment 775,692 762,267
Shares in associated companies 0 6,407
Investments and other financial assets 171,386 170,471
Other receivables and assets 24,713 60,714
Deferred tax assets 131,340 152,647
Non-current assets 1,884,316 1,860,844
Inventories 906,617 761,013
Advance payments made 123,684 99,264
Trade accounts receivable 785,764 891,980
Cost and earnings of projects under construction in excess of billings 0 599,550
Contract assets from contracts with customers 785,088 0
Receivables from current taxes 29,788 54,741
Other receivables and assets 332,026 341,183
Investments 341,787 565,780
Cash and cash equivalents 1,403,113 1,071,478
Assets held for sale 0 19,515
Current assets 4,707,867 4,404,504
TOTAL ASSETS 6,592,183 6,265,348
SHAREHOLDERS’ EQUITY AND LIABILITIES
Share capital 104,000 104,000
Capital reserves 36,476 36,476
Retained earnings 1,106,677 1,160,334
Equity attributable to shareholders of the parent 1,247,153 1,300,810
Non-controlling interests 16,894 24,600
Total shareholders’ equity 1,264,047 1,325,410
Bonds 0 349,759
Bank loans and other financial liabilities 936,530 424,851
Obligations under finance leases 15,578 17,196
Provisions 561,851 582,058
Other liabilities 62,184 103,941
Deferred tax liabilities 79,092 87,892
Non-current liabilities 1,655,235 1,565,697
Bonds 345,268 0
Bank loans and other financial liabilities 101,103 80,890
Obligations under finance leases 1,151 1,138
Trade accounts payable 478,481 461,239
Billings in excess of cost and earnings of projects under construction 0 1,052,571
Contract liabilities from contracts with customers 1,016,090 0
Advance payments received 308,246 277,219
Provisions 434,647 484,079
Liabilities for current taxes 32,891 71,515
Other liabilities 955,024 942,979
Liabilities relating to assets held for sale 0 2,611
Current liabilities 3,672,901 3,374,241
TOTAL SHAREHOLDERS’ EQUITY AND LIABILITIES 6,592,183 6,265,348
CONSOLIDATED STATEMENT OF FINANCIAL POSITION

A N D R I T Z f i n a n c i a l r e p o r t Q 1 - Q 3 2 0 1 8 C o n s o l i d a t e d s t a t e m e n t o f c a s h f l o w s
21
For the first three quarters of 2018 (unaudited)
(in TEUR) Q1-Q3 2018 Q1-Q3 2017
Earnings Before Taxes (EBT) 223,488 275,100
Interest result 12,030 4,718
Depreciation, amortization, and impairment of intangible assets and of property, plant, and equipment 91,897 99,283
Result from associated companies -6 649
Changes in provisions -52,289 -15,439
Gains/losses from the disposal of fixed and financial assets -7,060 -59,883
Other non-cash income/expenses -3,881 -3,245
Gross cash flow 264,179 301,183
Changes in inventories -127,053 -114,227
Changes in advance payments made -25,940 -21,012
Changes in receivables 130,440 42,223
Changes in cost and earnings of projects under construction in excess of billings and changes in contract assets from contracts with customers -163,408 41,024
Changes in advance payments received 18,277 57,539
Changes in liabilities -53,183 -49,745
Changes in billings in excess of cost and earnings of projects under construction and changes in contract liabilities from contracts with customers -44,753 -281
Change in net working capital -265,620 -44,479
Interest received 14,861 27,080
Interest paid -22,568 -24,972
Dividends received 584 181
Income taxes paid -76,450 -129,767
CASH FLOW FROM OPERATING ACTIVITIES -85,014 129,226
Payments received for asset disposals (including financial assets) 4,813 57,606
Payments received from associated companies (including disposals) -6,308 0
Payments made for intangible assets and for property, plant, and equipment -69,909 -82,898
Payments made for non-current financial assets -19,181 -83,517
Net cash flow from company acquisitions -72,305 -13,435
Net cash flow from sale of subsidiaries 25,347 23,966
Payments received for investments and other current financial assets 409,524 105,273
Payments made for investments and other current financial assets -185,328 -46,098
CASH FLOW FROM INVESTING ACTIVITIES 86,653 -39,103
Payments received from issuance of Schuldscheindarlehen 500,000 400,000
Payments received from other financial liabilities 44,283 28,511
Payments made for other financial liabilities -27,633 -69,855
Dividends paid by ANDRITZ AG -156,642 -153,090
Dividends paid to non-controlling interest holders -2,385 -2,095
Purchase of own corporate bonds 0 -4,019
Purchase of non-controlling interests and payments to former shareholders -290 -816
Purchase of treasury shares -4,922 -25,058
CASH FLOW FROM FINANCING ACTIVITIES 352,411 173,578
CONSOLIDATED STATEMENT OF CASH FLOWS

A N D R I T Z f i n a n c i a l r e p o r t Q 1 - Q 3 2 0 1 8 C o n s o l i d a t e d s t a t e m e n t o f c a s h f l o w s
22
(in TEUR) Q1-Q3 2018 Q1-Q3 2017
CHANGES IN CASH AND CASH EQUIVALENTS 354,050 263,701
Currency translation adjustments -22,360 -40,861
Changes in consolidation scope 111 1,096
Change in accounting policies -166 0
Cash and cash equivalents at the beginning of the period 1,071,478 1,296,336
Cash and cash equivalents at the end of the period 1,403,113 1,520,272

A N D R I T Z f i n a n c i a l r e p o r t Q 1 - Q 3 2 0 1 8 C o n s o l i d a t e d s t a t e m e n t o f c h a n g e s i n e q u i t y
23
For the first three quarters of 2018 (unaudited)
Attributable to shareholders of the parent
Non-controlling interests
Total share-holders’ equity
(in TEUR)
Share capital Capital reserves Other retained
earnings IAS 39 reserve Fair value
reserve Actuarial gains/
losses
Currency trans-lation adjust-
ments Treasury shares Total
BALANCE AS OF JANUARY 1, 2017 104,000 36,476 1,287,232 47,685 -82,133 14,416 -80,173 1,327,503 16,728 1,344,231
Net income 189,796 189,796 1,572 191,368
Other comprehensive income -7,579 -54,564 -62,143 -918 -63,061
Total comprehensive income 189,796 -7,579 -54,564 127,653 654 128,307
Dividends -153,090 -153,090 -2,095 -155,185
Changes in treasury shares 172 -23,990 -23,818 -23,818
Changes concerning share option programs 2,592 2,592 2,592
Transactions with non-controlling interests -4,015 -3,150 -7,165 6,346 -819
Changes in consolidation type -1,147 -1,147 -7 -1,154
BALANCE AS OF SEPTEMBER 30, 2017 104,000 36,476 1,321,540 40,106 -82,133 -43,298 -104,163 1,272,528 21,626 1,294,154
BALANCE AS OF DECEMBER 31, 2017 104,000 36,476 1,387,743 28,252 -75,980 -52,397 -127,284 1,300,810 24,600 1,325,410
Change in accounting policies -9,315 -28,252 28,423 620 -8,524 -167 -8,691
BALANCE AS OF JANUARY 1, 2018 104,000 36,476 1,378,428 28,423 -75,980 -51,777 -127,284 1,292,286 24,433 1,316,719
Net income 157,014 157,014 -777 156,237
Other comprehensive income -19,138 -22,841 -41,979 -355 -42,334
Total comprehensive income 157,014 -19,138 -22,841 115,035 -1,132 113,903
Dividends -156,642 -156,642 -2,385 -159,027
Changes in treasury shares 95 -3,650 -3,555 -3,555
Changes concerning share option programs 2,016 2,016 2,016
Transactions with non-controlling interests -2,022 -2,022 2,022
Changes in consolidation type 35 35 -6,044 -6,009
Other changes 816 44 -860 0
BALANCE AS OF SEPTEMBER 30, 2018 104,000 36,476 1,379,740 9,329 -75,980 -75,478 -130,934 1,247,153 16,894 1,264,047
CONSOLIDATED STATEMENT OF CHANGES IN EQUITY
A N D R I T Z f i n a n c i a l r e p o r t Q 1 - Q 3 2 0 1 8 S t a t e m e n t b y t h e E x e c u t i v e B o a r d
24
Statement by the Executive Board, pursuant to section 125 paragraph 1 of the (Austrian) Stock Exchange Act
We hereby confirm that, to the best of our knowledge, the condensed interim financial statements of the
ANDRITZ GROUP drawn up in compliance with the applicable accounting standards provide a true and fair view
of the asset, financial, and earnings positions of the ANDRITZ GROUP, and that the management report provides
a true and fair view of the asset, financial, and earnings positions of the ANDRITZ GROUP with regard to the
important events of the first nine months of the financial year and their impact on the condensed interim financial
statements of the ANDRITZ GROUP, and with regard to the major risks and uncertainties during the remaining
three months of the financial year, and also with regard to the major business transactions subject to disclosure
and concluded with related persons and companies.
Graz, November 2018
The Executive Board of ANDRITZ AG
Wolfgang Leitner Humbert Köfler Joachim Schönbeck Wolfgang Semper Mark von Laer
President and CEO Pulp & Paper (Service & Units),
Separation
Pulp & Paper (Capital Systems),
Metals
Hydro
CFO
STATEMENT BY THE EXECUTIVE BOARD

A N D R I T Z f i n a n c i a l r e p o r t Q 1 - Q 3 2 0 1 8 S h a r e
25
RELATIVE PRICE PERFORMANCE OF THE ANDRITZ SHARE COMPARED TO THE ATX (OCTOBER 1, 2017 - SEPTEMBER 30, 2018)
Share price development
The development of the international financial markets was impacted by continued uncertainty during the first
three quarters of 2018. Above all, escalation of the trade dispute between the USA and China, but also the
forthcoming Brexit, concerns about Italy’s future development, and the monetary crisis in some of the emerging
markets resulted in increasing uncertainty on the international stock exchanges. In this very volatile stock market
environment, the price of the ANDRITZ share increased by 6.7% in the first three quarters of 2018. The ATX, the
Vienna Stock Exchange’s leading share index, decreased by 2.2% during the same period. The highest closing
price of the ANDRITZ share was 53.50 EUR (September 21, 2018), and the lowest closing price was 42.24 EUR
(June 6, 2018).
Trading volume
The average daily trading volume of the ANDRITZ share (double count, as published by the Vienna Stock
Exchange) was 343,148 shares in the first three quarters of 2018 (Q1-Q3 2017: 302,782 shares). The highest daily
trading volume was noted on June 15, 2018 (2,207,746 shares) and the lowest trading volume on August 27,
2018 (65,500 shares).
Investor Relations
During the third quarter of 2018, meetings were held with institutional investors and financial analysts in London,
Los Angeles, Munich, New York, San Diego, Vienna, and Zurich.
O c t . ' 1 7 N o v . ' 1 7 D e c . ' 1 7 J a n . ' 1 8 F e b . ' 1 8M a r c h ' 1 8 A p r i l ' 1 8 M a y ' 1 8 J u n e ' 1 8 J u l y ' 1 8 A u g . ' 1 8 S e p t . ' 1 8
5 0 %
7 5 %
1 0 0 %
1 2 5 %
1 5 0 %
A N D R I T Z A T X
SHARE

A N D R I T Z f i n a n c i a l r e p o r t Q 1 - Q 3 2 0 1 8 S h a r e
26
Key figures of the ANDRITZ share
Unit Q1-Q3 2018 Q1-Q3 2017 Q3 2018 Q3 2017 2017
Highest closing price EUR 53.50 54.87 53.50 54.63 54.87
Lowest closing price EUR 42.24 44.32 44.70 44.32 44.32
Closing price (as of end of period) EUR 50.25 48.91 50.25 48.91 47.09
Market capitalization (as of end of period) MEUR 5,226.0 5,086.1 5,226.0 5,086.1 4,896.8
Performance % +6.7 +2.5 +10.5 -7.3 -1.3
ATX weighting (as of end of period) % 7.3239 6.8867 7.3239 6.8867 6.2680
Average daily number of shares traded Share unit 343,148 302,782 272,963 330,346 306,296
Basic data of the ANDRITZ share
ISIN code AT0000730007
First listing day June 25, 2001
Types of shares no-par value shares, bearer shares
Total number of shares 104 million
Authorized capital none
Free float < 70%
Stock exchange Vienna (Prime Market)
Ticker symbols Reuters: ANDR.VI; Bloomberg: ANDR, AV
Stock exchange indices ATX, ATX five, ATX Global Players, ATX Prime, WBI
Financial calendar 2019
March 6, 2019 Results for the 2018 business year
March 17, 2019 Record date Annual General Meeting
March 27, 2019 Annual General Meeting
March 29, 2019 Ex-dividend
April 1, 2019 Record date dividend
April 2, 2019 Dividend payment
May 2, 2019 Results for the first quarter of 2019
August 2, 2019 Results for the first half of 2019
November 6, 2019 Results for the first three quarters of 2019
The financial calendar with updates, as well as information on the ANDRITZ share, can be found on the Investor
Relations page at the ANDRITZ web site: andritz.com/share.

A N D R I T Z f i n a n c i a l r e p o r t Q 1 - Q 3 2 0 1 8 G l o s s a r y
27
ATX
Austrian Traded Index, the leading stock market
index of the Vienna stock exchange.
ATX-weighting
Weighting of the ANDRITZ share according to
calculation of the Vienna Stock Exchange. This
weighting is based on the market capitalization of
public free float.
Average number of shares traded
Number of shares which is on average traded per
day by using the double count method as
published by the Vienna Stock Exchange.
Capital employed
Net working capital plus intangible assets and
property, plant, and equipment.
Capital expenditure
Additions to intangible assets and property, plant,
and equipment.
Dividend per share
Part of earnings per share which is distributed to
shareholders.
Earnings per share
Net income (without non-controlling inter-
ests)/weighted average number of no-par value
shares.
EBIT
Earnings before interest and taxes.
EBITA
Earnings before interest, taxes, amortization of
identifiable assets acquired in a business
combination and recognized separately from
goodwill and impairment of goodwill.
EBITDA
Earnings before interest, taxes, depreciation, and
amortization.
EBT
Earnings before taxes.
Employees
Number of employees without apprentices.
Equity attributable to shareholders per share
Equity attributable to shareholders of the
parent/weighted average number of no-par value
shares.
Equity ratio
Total shareholders’ equity/total assets.
EV
Enterprise Value: market capitalization as of end of
year minus net liquidity.
Free cash flow
Cash flow from operating activities minus capital
expenditure plus payments from the sale of
intangible assets and property, plant, and
equipment.
Free cash flow per share
Free cash flow/total number of shares.
FVTOCI
Fair Value through other comprehensive income.
FVTPL
Fair Value through profit and loss.
Gearing
Net debt/total shareholders’ equity.
HY
Hydro business area.
Liquid funds
Cash and cash equivalents plus investments plus
Schuldscheindarlehen.
Market capitalization
Number of shares outstanding multiplied by the
closing price.
ME
Metals business area.
MEUR
Million euros.
MUSD
Million United States Dollars.
GLOSSARY

A N D R I T Z f i n a n c i a l r e p o r t Q 1 - Q 3 2 0 1 8 G l o s s a r y
28
Net debt
Interest bearing liabilities including provisions for
severance payments, pensions, and jubilee
payments less liquid funds.
Net liquidity
Liquid funds plus fair value of interest rate swaps
less financial liabilities.
Net working capital
Non-current receivables plus current assets
(excluding cash as well as Schuldscheindarlehen)
less other non-current liabilities and current
liabilities (excluding financial liabilities and
provisions).
Order backlog
The order backlog consists of present customer
orders at the balance sheet date. Basically, it is
calculated by the order backlog at the beginning of
the period plus new order intake during the period
less sales during the period.
Order intake
The order intake is the estimated order sales which
have already been put into effect considering
changes and corrections of the order value; letter of
intents are not part of the order intake.
Payout ratio
Part of net income which is distributed to
shareholders. It is calculated as dividend per share/
earnings per share.
Performance of the ANDRITZ share
Relative change of the ANDRITZ share within a
defined time period.
PP
Pulp & Paper business area.
Price-earnings-ratio
Share price/earnings per share.
Return on equity
Earnings before taxes/total shareholder’s equity.
Return on investment
Earnings before interest and taxes/total assets.
Return on sales
Earnings before interest and taxes/sales.
ROE
Return on equity: net income/total shareholder’s
equity.
SE
Separation business area.
Sureties
These contain bid bonds, contract performance
guarantees, downpayment guarantees as well as
performance and warranty bonds at the expense of
the ANDRITZ GROUP.
TEUR
Thousand euros.
Total shareholders’ equity
Total shareholders’ equity including non-controlling
interests.

A N D R I T Z f i n a n c i a l r e p o r t Q 1 - Q 3 2 0 1 8
29
Contact and publisher’s note ANDRITZ AG
Stattegger Strasse 18
8045 Graz, Austria
Produced in-house using firesys
Disclaimer: Certain statements contained in this report constitute ‘forward-looking statements’. These statements, which contain the words “believe”, “intend”, “expect”, and words of a similar meaning, reflect the Executive Board’s beliefs and expectations and are subject to risks and uncertainties that may cause actual results to differ materially. As a result, readers are cautioned not to place undue reliance on such forward-looking statements. The company disclaims any obligation to publicly announce the result of any revisions to the forward-looking statements made herein, except where it would be required to do so under applicable law.