Interim consolidated financial statement - 3rd quarter ... · Interim condensed consolidated...
42
TTRATNSLATION 1 I I I N N N T T T E E E R R R I I I M M M C C C O O O N N N D D D E E E N N N S S S E E E D D D C C C O O O N N N S S S O O O L L L I I I D D D A A A T T T E E E D D D F F F I I I N N N A A A N N N C C C I I I A A A L L L S S S T T T A A A T T T E E E M M M E E E N N N T T T S S S O O O F F F T T T H H H E E E C C C A A A P P P I I I T T T A A A L L L G G G R R R O O O U U U P P P O O O F F F B B B A A A N N N K K K H H H A A A N N N D D D L L L O O O W W W Y Y Y W W W W W W A A A R R R S S S Z Z Z A A A W W W I I I E E E S S S . . . A A A . . . F F F O O O R R R T T T H H H E E E T T T H H H I I I R R R D D D Q Q Q U U U A A A R R R T T T E E E R R R 2 2 2 0 0 0 1 1 1 2 2 2 N N N O O O V V V E E E M M M B B B E E E R R R 2 2 2 0 0 0 1 1 1 2 2 2
Transcript of Interim consolidated financial statement - 3rd quarter ... · Interim condensed consolidated...

TTRATNSLATION
1
IIINNNTTTEEERRRIIIMMM CCCOOONNNDDDEEENNNSSSEEEDDD CCCOOONNNSSSOOOLLLIIIDDDAAATTTEEEDDD FFFIIINNNAAANNNCCCIIIAAALLL
SSSTTTAAATTTEEEMMMEEENNNTTTSSS
OOOFFF TTTHHHEEE CCCAAAPPPIIITTTAAALLL GGGRRROOOUUUPPP OOOFFF
BBBAAANNNKKK HHHAAANNNDDDLLLOOOWWWYYY WWW WWWAAARRRSSSZZZAAAWWWIIIEEE SSS...AAA...
FFFOOORRR TTTHHHEEE TTTHHHIIIRRRDDD QQQUUUAAARRRTTTEEERRR 222000111222
NNNOOOVVVEEEMMMBBBEEERRR 222000111222

Interim condensed consolidated financial statements of the Capital Group of Bank Handlowy w Warszawie S.A.
for the third quarter 2012
TRANSLATION
2
PLN ‘000 EUR ‘000***
SELECTED FINANCIAL DATA
Third quarter
accruals period from
01.01.12to 30.09.12
Third quarteraccruals
period from01.01.11
to 30.09.11
Third quarter accruals
period from01.01.12
to 30.09.12
Third quarter accruals
period from 01.01.11
to 30.09.11
Data related to the condensed consolidated financial statements
Interest income 1,579,509 1,415,660 376,540 350,298
Fee and commission income 531,506 570,310 126,706 141,120
Profit before tax 910,422 647,522 217,036 160,226
Net profit 725,564 515,333 172,967 127,517
Total income 890,746 484,035 212,345 119,772
Increase of net cash 193,213 (1,267,095) 46,060 (313,536)
Total assets* 36,502,253 42,278,198 8,873,123 9,572,133
Amounts due to banks* 2,576,528 6,011,378 626,313 1,361,026
Amounts due to customers* 20,895,986 24,095,847 5,079,485 5,455,499
Shareholders' equity 6,974,330 6,226,455 1,695,350 1,411,510
Share capital 522,638 522,638 127,045 118,480
Number of shares (in pcs) 130,659,600 130,659,600 130,659,600 130,659,600
Book value per share (PLN / EUR) 53.38 47.65 12.98 10.80
Capital adequacy ratio (%)* 17.6 16.4 17.6 16.4 Earnings per ordinary share (PLN / EUR)
5.55 3.94 1.32 0.98
Diluted net earnings per share (PLN / EUR)
5.55 3.94 1.32 0.98
Data related to the condensed unconsolidated financial statements
Interest income 1,557,340 1,391,972 371,255 344,437
Fee and commission income 494,807 497,292 117,957 123,052
Profit before tax 925,318 636,965 220,587 157,614
Net profit 745,156 508,771 177,638 125,893
Total income 912,536 474,222 217,540 117,344
Increase of net cash 182,820 (1,290,191) 43,583 (319,251)
Total assets* 35,419,775 41,542,014 8,609,990 9,405,455
Amounts due to banks* 2,182,815 5,543,891 530,608 1,255,183
Amounts due to customers* 20,958,379 24,130,225 5,094,652 5,463,282
Shareholders' equity 6,907,502 6,146,152 1,679,105 1,393,306
Share capital 522,638 522,638 127,045 118,480
Number of shares (in pcs) 130,659,600 130,659,600 130,659,600 130,659,600
Book value per share (PLN / EUR) 52.87 47.04 12.85 10.66
Capital adequacy ratio (%)* 17.4 15.8 17.4 15.8 Earnings per ordinary share (PLN / EUR)
5.70 3.89 1.36 0.96
Diluted net earnings per share (PLN / EUR)
5.70 3.89 1.36 0.96
Declared or paid dividend per share (PLN / EUR)**
2.76 5.72 0.67 1.30
* Comparable balance data according as at 31 December 2011.
** The presented ratios are related to dividend paid in 2012 from the distribution of 2011 profit and dividend paid in 2011 from the distribution of 2010 profit.
*** The following exchange rates were applied to convert PLN to EUR: for the statement of financial position - NBP average exchange rate as at 30 September 2012 - PLN 4.1138 (as at 31 December 2011: PLN 4.4168; as at 30 September 2011 – PLN 4.4112); for the income statement and cash flow statement - the arithmetic mean of NBP end-of-month exchange rates in the first, second and third quarter of 2012 - PLN 4.1948 (in the first, second and third quarter of 2011: PLN 4.0413).

Interim condensed consolidated financial statements of the Capital Group of Bank Handlowy w Warszawie S.A.
for the third quarter 2012
TRANSLATION
3
CONTENTS
Condensed consolidated income statement ____________________________________________________4
Condensed consolidated statement of comprehensive income ____________________________________5
Condensed consolidated statement of financial position _________________________________________6
Condensed consolidated statement of changes in equity_________________________________________7
Condensed consolidated statement of cash flows_______________________________________________8
Supplementary notes to the condensed consolidated financial statements __________________________8
1 General information about the Bank and the Capital Group ________________________________8
2 Declaration of conformity ____________________________________________________________9
3 Principles accepted at the composition of the report _____________________________________9
4 Macroeconomic trends and conditions prevailing on the monetary, FX and capital markets_____9
5 Situation in the banking sector_______________________________________________________11
6 Financial analysis of the results of the Capital Group of the Bank _________________________12
7 Segmental reporting________________________________________________________________19
8 Activities of the Group______________________________________________________________20
9 Rating____________________________________________________________________________31
10 Financial instruments disclosure _____________________________________________________31
11 Impairment and provisions __________________________________________________________32
12 Provisions and assets due to differed income tax _______________________________________33
13 Purchase and sale transactions of tangible assets ______________________________________33
14 Default or breach due to received credit agreement in respect of which there were no corrective action until the end of the reporting period ___________________________________33
15 Seasonality or periodicity of business activity __________________________________________33
16 Issue, redemption and repayment of debt and equity securities ___________________________33
17 Paid or declared dividends __________________________________________________________34
18 Major events after the balance sheet date not included in the financial statements ___________34
19 Changes in off-balance-sheet commitments____________________________________________34
20 Changes in Group’s structure________________________________________________________35
21 Achievement of 2012 forecast results _________________________________________________35
22 Information about shareholders ______________________________________________________35
23 Ownership of issuer’s shares by managing and supervising officers _______________________35
24 Information on pending proceedings__________________________________________________35
25 Information about significant transactions with related entities dealt on other than market terms ____________________________________________________________________________36
26 Information about guarantee agreements ______________________________________________36
27 Factors and events which could affect future financial performance of the Bank’s Capital Group____________________________________________________________________________36
Condensed interim financial statements of the Bank for the third quarter 2012______________________38

Interim condensed consolidated financial statements of the Capital Group of Bank Handlowy w Warszawie S.A.
for the third quarter 2012
TRANSLATION
4
Condensed consolidated income statement
PLN ‘000
Third quarter
period from01.07.12
to 30.09.12
Third quarter
accruals period from
01.01.12 to 30.09.12
Third quarter
period from01.07.11
to 30.09.11
Third quarteraccruals
period from01.01.11
to 30.09.11
Interest and similar income 531,596 1,579,509 486,754 1,415,660Interest expense and similar charges (161,387) (442,569) (130,233) (363,850)Net interest income 370,209 1,136,940 356,521 1,051,810 Fee and commission income 173,492 531,506 183,576 570,310Fee and commission expense (21,697) (76,365) (27,694) (77,116)Net fee and commission income 151,795 455,141 155,882 493,194 Dividend income 1,004 6,493 31 5,688
Net income on trade financial instruments and revaluation
61,389 279,406 92,183 222,862
Net gain on debt investment securities 97,844 216,912 7,600 18,934 Other operating income 6,360 27,502 6,281 28,692Other operating expenses (14,218) (40,443) (10,186) (28,669)Net other operating income (7,858) (12,941) (3,905) 23 General administrative expenses (321,246) (1,065,116) (343,812) (1,029,371)Depreciation of tangible and intangible assets (15,579) (49,892) (15,257) (44,459)Profit/(loss) on sale of non-financial assets 6 74 (153) 2,123
Profit/(loss) due to impairment of financial assets and provisions for off-balance sheet liabilities
(22,286) (57,086) (16,482) (73,795)
Operating income 315,278 909,931 232,608 647,009Share in net profits/(losses) of entities valued at equity method
226 491 197 513
Profit before tax 315,504 910,422 232,805 647,522Income tax expense (64,261) (184,858) (50,092) (132,189)Net profit 251,243 725,564 182,713 515,333
Weighted average number of ordinary shares (in pcs) 130,659,600 130,659,600Net earnings per share (in PLN) 5.55 3.94Diluted net earnings per share (in PLN) 5.55 3.94 Including:
Net profit due to shareholders of the dominant entity 725,564 515,333Net profit due to non-controlling shareholders - -

Interim condensed consolidated financial statements of the Capital Group of Bank Handlowy w Warszawie S.A.
for the third quarter 2012
TRANSLATION
5
Condensed consolidated statement of comprehensive income
PLN ‘000
Third quarter
period from 01.07.11
to 30.09.11
Third quarter accruals
period from01.01.11
to 30.09.11
Third quarter
period from01.07.12
to 30.09.12
Third quarter accruals
period from 01.01.12
to 30.09.12
Net income 251,243 725,564 182,713 515,333
Other comprehensive income: Valuation of financial assets available-for-sale (net) 48,796 167,388 (54,851) (34,316)Exchange rate differences (1,031) (2,206) 2,874 3,018
Other comprehensive income after tax 47,765 165,182 (51,977) (31,298)
Total comprehensive income 299,008 890,746 130,736 484,035
Including:
Comprehensive income due to shareholders of the dominant entity
890,746 484,035
Comprehensive income due to non-controlling shareholders
- -

Interim condensed consolidated financial statements of the Capital Group of Bank Handlowy w Warszawie S.A.
for the third quarter 2012
TRANSLATION
6
Condensed consolidated statement of financial position
State as at 30.09.2012 31.12.2011PLN ‘000
ASSETS Cash and balances with the Central Bank 937,529 979,616Amounts due from banks 2,101,907 548,256Financial assets held-for-trading 5,931,100 5,805,044Debt securities available-for-sale 8,717,294 17,625,355Capital investments valued at equity method 15,060 57,945Other capital investments 24,950 24,912Amounts due from customers 15,817,142 14,719,473Tangible fixed assets 418,117 457,929Intangible assets 1,326,367 1,292,067Income tax assets 278,029 338,757
Current 3,085 3,436Deferred 274,944 335,321
Other assets 922,204 403,182Fixed assets held-for-sale 12,554 25,662
Total assets 36,502,253 42,278,198
LIABILITIES
Amounts due to banks 2,576,528 6,011,378 Financial liabilities held-for-trading 4,657,620 4,840,447 Amounts due to customers 20,895,986 24,095,847 Liabilities due to debt securities issuance 2,038 25,336 Provisions 41,371 34,914 Income tax liabilities 33,922 72,921
Current 33,922 72,921 Other liabilities 1,320,458 752,874 Total liabilities 29,527,923 35,833,717
EQUITY
Share capital 522,638 522,638 Share premium 3,011,380 3,009,396 Revaluation reserve 85,094 (82,294) Other reserves 2,637,246 2,264,082 Retained earnings 717,972 730,659 Total equity 6,974,330 6,444,481 Total liabilities and equity 36,502,253 42,278,198

Interim condensed consolidated financial statements of the Capital Group of Bank Handlowy w Warszawie S.A.
for the third quarter 2012
TRANSLATION
7
Condensed consolidated statement of changes in equity
PLN ’000 Share
capital Share
premium Revaluation
reserve Other
reserves Retained earnings
Non-controlling
shares Total equity
Balance as at 1 January 2012 522,638 3,009,396 (82,294) 2,264,082 730,659 - 6,444,481
Total comprehensive income - - 167,388 (2,206) 725,564 - 890,746
Dividends to paid - - - - (360,897) - (360,897)
Transfer to capital - 1,984 - 375,370 (377,354) - -
Balance as at 30 September 2012 522,638 3,011,380 85,094 2,637,246 717,972 - 6,974,330
PLN ‘000 Share
capital Share
premium Revaluation
reserve Other
reserves Retained earnings
Non-controlling
shares Total equity
Balance as at 1 January 2011 522,638 3,031,149 (44,848) 2,248,707 735,289 - 6,492,935
Total comprehensive income - - (34,316) 3,018 515,333 - 484,035
Valuation of capital rewards program, including:
- - - (3,142) - - (3,142)
valuation change - - - (6,336) - - (6,336)
deferred income tax - - - 3,194 - - 3,194
Dividends paid - - - - (747,373) - (747,373)
Transfer to capital - (21,753) - 15,423 6,330 - -
Balance as at 30 September 2011 522,638 3,009,396 (79,164) 2,264,006 509,579 - 6,226,455
PLN ‘000 Share
capital Share
premium Revaluation
reserve Other
reserves Retained earnings
Non-controlling
shares Total equity
Balance as at 1 January 2011 522,638 3,031,149 (44,848) 2,248,707 735,289 - 6,492,935
Total comprehensive incomes - - (37,446) 3,094 736,413 - 702,061
Valuation of capital rewards program, including:
- - - (3,142) - - (3,142)
valuation change - - - (6,336) - - (6,336)
deferred income tax - - - 3,194 - - 3,194
Dividends paid - - - - (747,373) - (747,373)
Transfer to capital - (21,753) - 15,423 6,330 - -
Balance as at 31 December 2011 522,638 3,009,396 (82,294) 2,264,082 730,659 - 6,444,481

Interim condensed consolidated financial statements of the Capital Group of Bank Handlowy w Warszawie S.A.
for the third quarter 2012
TRANSLATION
8
Condensed consolidated statement of cash flows
PLN ‘000 Third quarter
accrualsThird quarter
accruals
period from
01.01.12to 30.09.12
period from01.01.11
to 30.09.11Cash at the beginning of the reporting period 1,044,182 3,311,780Cash flows from operating activities 663,884 (360,385)Cash flows from investing activities (6,840) (48,840)Cash flows from financing activities (463,831) (857,870)Cash at the end of the reporting period 1,237,395 2,044,685Increase / (decrease) in net cash 193,213 (1,267,095)
Supplementary notes to the condensed consolidated financial statements
1 General information about the Bank and the Capital Group
Bank Handlowy w Warszawie S.A. (“the dominant entity”, “the Bank”, “Citi Handlowy”) has its registered office in Warsaw at Senatorska 16, 00-923 Warszawa. The Bank was founded on the strength of a Notarial Deed of 13 April 1870 and is registered in the Register of Entrepreneurs in the National Court Register kept by the District Court for Warsaw, XII Commercial Department in Warsaw, under KRS number 0000001538.
The Bank was given REGON number: 000013037 and tax identification number NIP: 526-030-02-91.
The Bank and the Group were set up for unspecified period of time.
Issued capital of the Bank equals PLN 522,638,400 and is divided into 130,659,600 common shares, with nominal value of PLN 4.00 per share. The shares are quoted on the Warsaw Stock Exchange.
The Group is a member of Citigroup Inc. Citibank Overseas Investments Corporation, a subsidiary of Citibank N.A., is the parent of the Bank.
The Bank is a universal bank that offers a wide range of banking services for individuals and corporate customers on the domestic and foreign markets. Additionally, the Group conducts the following activities through its subordinated entities: brokerage operations, lease services, investment operations.
This interim consolidated report presents financial data of the Capital Group of Bank Handlowy w Warszawie S.A. (‘the Group‘), composed of Bank Handlowy w Warszawie S.A. (‘the Bank‘) as the parent and its subordinated entities.
The Group consists of the following subordinated entities:
% of votes at the General Meeting of Shareholders Subsidiaries Registered office
30.09.2012 31.12.2011
Entities fully consolidated
Dom Maklerski Banku Handlowego S.A. Warsaw 100.00 100.00
Handlowy-Leasing Sp. z o.o. Warsaw 100.00 100.00
Handlowy Investments S.A. Luxembourg 100.00 100.00 PPH Spomasz Sp. z o.o. w likwidacji Warsaw 100.00 100.00
Entities valued at equity method
Handlowy Inwestycje Sp. z o.o. Warsaw 100.00 100.00
Handlowy Investments II S.a.r.l. Luxembourg 100.00 100.00
Bank Rozwoju Cukrownictwa S.A. w likwidacji Poznań 100.00 100.00

Interim condensed consolidated financial statements of the Capital Group of Bank Handlowy w Warszawie S.A.
for the third quarter 2012
TRANSLATION
9
In the third quarter of 2012 there were no changes in the structure of Group’s entities.
2 Declaration of conformity
These condensed interim consolidated financial statements have been prepared in accordance with International Financial Reporting Standard (IFRS) IAS 34 Interim Financial Reporting adopted by European Union and with other applicable regulations. They do not include all of the information required for full annual financial statements, and should be read in conjunction with the consolidated financial statements of the Group as at and for the financial year ended 31 December 2011.
In accordance with Decree of the Ministry of Finance dated 19 February 2009 regarding current and periodic information provided by issuers of securities and the requirements for recognition of information required by the law of a non-Member State as equivalent (Official Journal from 2009, No. 33, item 259 with further changes). The Bank is obliged to publish its financial results for the 9 month period ended 30 September 2012 which is deemed to be the current interim financial reporting period.
3 Principles accepted at the composition of the report
The condensed interim consolidated financial statements of the Group for the third quarter 2012 have been prepared in accordance with accounting principles adopted and summarized in the annual consolidated financial statements of the Group for the period ended 31 December 2011.
The preparation of condensed interim consolidated financial statements of the Group with accordance to IFRS requires form the Management to make certain estimates and adopting the related assumptions that affect the amounts reported in the financial statements. This financial statement is based on the same estimation rules, which were used in the annual financial statements of the Group for the period ended 31 December 2011, including the reasons and sources of uncertainty as at the balance sheet date. The most significant estimates made for the 9 month period ended 30 September 2012, concern:
Value loss of financial assets, Valuation to the fair value of derivatives, Employee benefits.
The condensed interim consolidated financial statements of the Group have been prepared for the period from 1 January 2012 to 30 September 2012. Comparable financial data are presented for the period from 1 January 2011 to 30 September 2011 and for the statement of financial position as at 31 December 2011.
The financial statements are presented in PLN, rounded to the nearest thousand.
4 Macroeconomic trends and conditions prevailing on the monetary, FX and capital markets
Monthly macroeconomic figures indicate a further slowdown in the economic growth in Q3 2012, from 2.4% year-on-year in Q2 2012 and 3.5% year-on-year in Q1 2012, and compared to 4.3% year-on-year in 2011. The average growth in industrial production from July to September 2012 was 0.2% year-on-year, whereas the value of the Purchasing Managers Index (PMI) dropped to the lowest level since the end of 2009, pointing to a progressive decrease in both domestic and export orders. The export growth rate in July - August 2012 rose temporarily to approximately 8.7% year-on-year compared to 0.5% year-on-year in Q2 2012, while the import growth rate increased to approximately 0.7% year-on-year compared to -3.2% year-on-year in Q2 2012. Further deterioration of the economic situation and reduced activity in the eurozone have exerted a negative influence on the prospects of Polish exports and production figures. A slowdown in industrial production has been accompanied by gradual worsening of the conditions in the labor market. Although the unemployment rate in June dropped to 12.4% from 12.9% in April 2012 and remained at a similar level in July and August, unemployment figures have been among the highest since 2007. The unemployment rate is expected to stay at an elevated level in the following quarters. At the same time, the employment growth rate in the enterprise sector slowed down to 0% year-on-year in Q3 2012. Also, the average retail sales growth rate slowed down to 6.4% year-on-year in July-August 2012 (in nominal terms) compared to 6.5% in Q2 2012 and 12.9% year-on-year in Q1 2012. The above was due to deterioration of consumer sentiment, driven by poorer conditions in the labor market, a slowdown in the household loan growth rate as well as a gradual decrease in the savings rate.

Interim condensed consolidated financial statements of the Capital Group of Bank Handlowy w Warszawie S.A.
for the third quarter 2012
TRANSLATION
10
In Q3 2012, inflation decreased slightly down to 3.9% year-on-year compared to 4.0% year-on-year in Q2 2012 and 4.1% year-on-year in Q1 2012. The most rapid rises have been recorded for fuel and energy carrier prices. Following the increase in interest rates observed in May and after several months of their stabilization, increasingly more noticeable signs of the economic slowdown forced the Polish Monetary Policy Council to change slightly the informal approach to the monetary policy. Furthermore, the overtones of the announcements of the Monetary Policy Council as well as statements made by its members implied a reduction in interest rates once the economic growth slowdown is confirmed and the relatively good inflation prospects continue.
Following a slight depreciation of the Polish zloty in Q2 2012, Q3 brought another, progressive appreciation of the Polish currency, which is attributable to a gradual improvement of the risk appetite resulting from implementation of the Outright Monetary Transactions (OMT) program by the European Central Bank, FED’s introduction of the third asset purchase program (QE3) as well as less negative overtones of the statements made by the American Central Bank. Relatively high interest rates and an elevated level of foreign investors demand for Polish treasury bonds have also had a positive effect on the Polish currency. At the end of September 2012, the EUR/PLN exchange rate was 4.11 compared to 4.26 at the end of Q2 2012, whereas the USD/PLN exchange rate was 3.22 compared to 3.39 in the aforementioned period.
Despite fluctuations in the risk appetite, in Q3 2012 gradual appreciation was observed with respect to Polish treasury bonds, whose yields decreased substantially. This was due to higher market expectations concerning the Polish Monetary Council’s interest rate cutting, strong demand for bonds which continued to be created by foreign investors as well as a gradual decrease in the credit risk, which has been reflected in a drop in CDS rates. Satisfaction of most of the state budget’s loan needs (approximately 100% at the end of September), accompanied by the forecast limited supply of treasury bonds in the second half of the year, also had a positive effect on the debt market in Q3 2012. The yield on 2-year bonds dropped in Q3 2012 by 55 bps, down to 4.04% at the end of September, compared to 4.59% at the end of June, whereas that of 10-year bonds decreased by approximately 45 bps, down to 4.70% at the end of September. The 3M WIBOR rate dropped at the same time down to 4.93% from 5.13% at the end of June 2012.
Deterioration of the global economic environment has led to implementation of a number of measures by central banks. The Outright Monetary Transactions program announced by the ECB and the bond-buying plan introduced by the Central Bank of Japan, followed by the next round of quantitative easing by FED, have had a significant effect on reduction of the risk aversion and determined the economic situation both in the global and the Polish equity markets.
Out of all WSE (Warsaw Stock Exchange) indices, WIG-PL (encompassing all shares of Polish companies) recorded a rise of 7.3%, whereas the value of the widest WIG index increased by 7.2%. A lower return achieved by WIG20 (+4.2%) results from a different calculation methodology (in contrast to WIG, it is only a price index and does not include any dividend income). The results of average and low capitalization company indices were slightly worse than those of blue chips (+2.3% quarter-on-quarter and +3.5% quarter-on-quarter, respectively).
As regards sector sub-indices, WIG-Surowce (Raw Materials) and WIG-Paliwa (Fuels) need to be recognized for their increase of 19.2% and 12.8%, respectively, in Q3 2012. Double-digit growth dynamics were also recorded by the food and beverage industry, whose figures rose by 10.3% over the past three months. On the other hand, IT and media companies were the only ones to record a drop in value on a quarter-on-quarter basis (by -6.3% and -6.1%, respectively). The highest rate of return on a year-on-year basis was achieved by the chemical sector (+57.1% year-on-year), whereas the most significant decrease was experienced by construction and media companies (-30.6% year-on-year and -19.7% year-on-year, respectively) as well as property developers (-15.5% year-on-year).
Q3 2012 brought a further stock market deterioration. Over the past three months, only two new entities, whose total issue amounted to less than PLN 39 million, entered the main floor of the Warsaw Stock Exchange.
At the end of September 2012, WSE traded in the shares of 435 companies with the total capitalization of PLN 693 billion (a 3% rise compared to the end of Q2 2012). The share of Polish companies in the total WSE capitalization was 70% (compared to 71% at the end of June 2012).

Interim condensed consolidated financial statements of the Capital Group of Bank Handlowy w Warszawie S.A.
for the third quarter 2012
TRANSLATION
11
Equity market indices as of 30 September 2012
Index 30.09.2012 30.06.2012 Change (%) quarter-on-
quarter 30.09.2011
Change (%) year-on-
year WIG 43,739.81 40,810.88 7.2% 38,268.75 14.3% WIG-PL 43,697.72 40,721.39 7.3% 37,885.62 15.3% WIG-div 1,033.24 979.48 5.5% 896.37 15.3% WIG20 2,371.42 2,275.30 4.2% 2,188.73 8.3% mWIG40 2,353.20 2,300.09 2.3% 2,169.48 8.5% sWIG80 9,850.84 9,520.17 3.5% 8,806.20 11.9%
Sector sub-indices WIG-Banki (Banks) 6,279.65 6,021.14 4.3% 5,455.82 15.1% WIG-Budownictwo (Construction)
1,661.81 1,602.22 3.7% 2,393.10 (30.6%)
WIG-Chemia (Chemicals) 9,218.86 8,491.31 8.6% 5,866.50 57.1% WIG-Deweloperzy (Property Developers)
1,265.05 1,236.74 2.3% 1,496.54 (15.5%)
WIG-Energia (Power) 3,832.02 3,612.05 6.1% 3,646.17 5.1% WIG-Informatyka (IT) 1,065.91 1,137.40 (6.3%) 964.30 10.5% WIG-Media 2,276.93 2,424.63 (6.1%) 2,837.01 (19.7%) WIG-Paliwa (Fuels) 3,094.24 2,744.11 12.8% 2,675.31 15.7% WIG-Spożywczy (Food and Beverage)
3,624.45 3,284.71 10.3% 3,501.07 3.5%
WIG-Surowce (Raw Materials) 5,086.10 4,266.19 19.2% 3,809.14 33.5% WIG-Telekomunikacja (Telecommunications)
1,499.66 1,429.83 4.9% 1,396.59 7.4%
Source: WSE, Dom Maklerski Banku Handlowego S.A.
Values of shares and bonds as well as volumes of derivative instruments traded on WSE in Q3 2012
Q3 2012 Q2 2012 Change (%) quarter-on-
quarter Q3 2011
Change (%) year-on-year
Shares (PLN million)* 104,979 86,646 21.2% 143,045 (26.6%) Bonds (PLN million) 328 199 64.8% 478 (31.4%) Forward contracts (‘000) 5,079 6,050 (16.0%) 8,755 (42.0%) Options (‘000) 388 310 25.2% 531 (26.9%) * figures excluding calls Source: WSE, Dom Maklerski Banku Handlowego S.A.
In Q3 2012, the value of WSE-traded shares rose by 21.2% compared to the previous quarter. However, investor activity in this market segment was considerably lower on a year-on-year basis (a 26.6% decrease).
Similar trends were observed in the debt instrument market. In Q3 2012, the value of WSE-traded bonds (PLN 328 million) was substantially higher than in the preceding three months (an increase by 65.1%), but lower by more than 31% on a year-on-year basis.
Investor activity in the forward contract market, measured by the trading volume, was less than 5.1 million contracts in Q3 2012, which denotes a drop by 16% quarter-on-quarter and by 42% year-on-year.
The option trading volume increased in Q3 2012 by approximately one-fourth compared to the second quarter, that is to the level of 388,000 contracts. Nonetheless, it was considerably lower than the volume recorded in Q3 2011 (531,000 contracts).
5 Situation in the banking sector
Figures published by the National Bank of Poland indicate an increase in the volume of corporate loans by 8% year-on-year in 3Q 2012. At the end of September 2012, their balance was almost PLN

Interim condensed consolidated financial statements of the Capital Group of Bank Handlowy w Warszawie S.A.
for the third quarter 2012
TRANSLATION
12
255 billion. It is a relatively significant slowdown in the annual dynamics growth continuing at a double digit level since September 2011. This should be treated as a negative sign for the sector, resulting from the expected economic slowdown. Considering the tenor structure of the corporate loan portfolio, the fastest growth was recorded with respect to loans granted for a tenor of more than five years (10% year-on-year), while those with a tenor of up to one year increased at the rate of 4% year-on-year. As regards the type structure analysis of the portfolio, the most substantial growth was observed in investment loans (10% year-on-year). Overdraft facilities rose by 8% year-on-year, real estate loans by 6% year-on-year and the volume of other credit facilities and loans decreased by 4% year-on-year. In annual terms, the corporate loan portfolio quality, measured by the ratio of non-performing loans, has significantly deteriorated (NPL ratio increase by 0.6 p.p. from 10.7% in September 2011 to 11.3% at the end of September 2012). The reason for this is a difficult situation in the large enterprise segment (mainly in the construction sector). The increase in the NPL ratio for this portfolio reached 2 p.p. (to the level of 9.7%). For SMEs the ratio dropped to 12.3% at the end of September from 12.6% in the previous year.
At the end of September 2012, the balance of household loans increased to almost PLN 524 billion (1% year-on-year, or PLN 6 billion) due to mortgage loans (2% year-on-year, or + PLN 7 billion). The increase in the volume of mortgage loans was mainly driven by loans originated in the Polish currency, whose balance rose by 18% year-on-year (PLN 22 billion), while the volume of foreign currency denominated loans dropped at the end of September 2012 by 8% (PLN 15 billion) year-on-year, down to the level of than PLN 179 billion. Appreciation of the Polish currency compared to the Swiss franc (6% year-on-year) and Euro (7% year-on-year), as well as significant limitations imposed by banks with respect to granting of foreign currency loans have had a crucial importance for the value of the above portfolio. The consumer loan portfolio has been showing negative dynamics in annual terms for 19 months (the effect of regulatory restrictions and an increased scope of the so-called shadow banking). At the end of September 2012, the portfolio value amounted to slightly above PLN 130 billion (PLN 6 billion less than in the corresponding period of the preceding year – a drop by 4% year-on-year). The quality of household loans suffered. The NPL ratio for household loans rose by 0.2 p.p. year-on-year to the level of 7.5%, with the ratio for mortgage loans growing by 0.4 p.p. year-on-year and the ratio for consumer loans decreasing by 0.3 p.p. year-on-year (to the level of 17.9%).
Corporate deposits decreased by 3% on year-on-year basis, with a balance of PLN 178 billion at the end of 3Q 2012. A negative annual growth in corporate deposits was reported at the end of July 2001 for the last time. This is another signal, after declining credit dynamics, indicating a significant economic slowdown. The rise was driven for current deposits (2% year-on-year), while term deposits showed negative dynamics at the level of 7% year-on-year (- PLN 7 billion).
An increase was recorded in household deposits. Its balance rose by PLN 45 billion (+10% year-on-year), up to the level of PLN 488 billion. Term deposits rose faster (an increase by 19% year-on-year, or PLN 42 billion), whereas current deposits recorded an increase of only 1% year-on-year (PLN 3 billion). Hence, the structure of household deposits changed to the benefit of term deposits, which at the end of 3Q 2012 accounted for 53% of all deposits, compared to 49% a year before.
The net profit of the banking sector for 3Q 2012 decreased by 5% (PLN 220 million) year-on-year and amounted to nearly PLN 4.0 billion. The decrease in net profit is attributed to a significant increase in the costs of the banking sector (+7% year-on-year) and an increase in net impairment losses (related to the deterioration of the quality of the portfolio of mortgage loans and loans to large enterprises). Revenue achieved by the banking sector in the analyzed period increased by 2% year-on-year to the level of PLN 14.8 billion, mainly due to nearly 3% increase in net interest income (+PLN 225 million year-on-year). Net fee income rose by PLN 74 million year-on-year (+2%), whereas other revenues did not change significantly (decrease by PLN 3 million year-on-year).
6 Financial analysis of the results of the Capital Group of the Bank
1. Statement of financial position
At the end of the third quarter of 2012, total assets were PLN 36.5 billion versus PLN 42.3 billion reported at the end of 2011, down by PLN 5.8 billion (i.e. 13.7%). The decline was impacted by the following factors:
decline in balance for debt securities available-for-sale by PLN 8.9 billion, i.e. 50.5%, reflecting a partial portfolio sales due to the bond yields drop in the market;

Interim condensed consolidated financial statements of the Capital Group of Bank Handlowy w Warszawie S.A.
for the third quarter 2012
TRANSLATION
13
increase of amounts due from banks by PLN 1.5 billion, i.e. 283.4%;
increase in net receivables from customers by PLN 1.1 billion, i.e. 7.5%, mainly attributable to an increase of receivables from non-financial sector by o PLN 0.9 billion, i.e. 6.8% driven by an increase in loans for corporate customers (up by PLN 0.8 billion, i.e. 9.3%) as well as loans for individual customers (increase by o PLN 0.1 billion, i.e. 2.5%). At the same time there was an increase in receivables from financial sector (by PLN 0.2 billion, i.e. 16.9%) reflecting an increase in receivables subject to repurchased agreement.
Amounts due from customers (net)
Change PLN ’000 30.09.2012 31.12.2011
PLN ‘000 %
Amounts due from financial sector entities 1,179,888 1,009,315 170,573 16.9% Amounts due from nonfinancial sector entities, including:
14,637,254 13,710,158 927,096 6.8%
Corporate clients* 9,397,840 8,598,887 798,953 9.3% Individual clients, including: 5,239,414 5,111,271 128,143 2.5%
credit cards 2,161,200 2,250,751 (89,551) (4.0%) cash loans 2,135,070 2,189,440 (54,370) (2.5%) mortgage loans 862,073 583,674 278,399 47.7%
Total net receivables from customers 15,817,142 14,719,473 1,097,669 7.5%
* Corporate clients include enterprises, public sector, public and private companies, cooperatives, individual enterprises, non-commercial institutions operating for households.
Amounts due from customers divided into not at risk / at risk of impairment
Change PLN ’000 30.09.2012 31.12.2011
PLN ‘000 %
Not at risk of impairment, including: 15,521,976 14,356,929 1,165,047 8.1%
non-financial sector entities 14,341,963 13,347,525 994,438 7.5% corporate clients* 9,183,590 8,331,622 851,968 10.2% individual clients 5,158,373 5,015,903 142,470 2.8%
With recognized impairment, including: 1,379,181 1,481,786 (102,605) (6.9%) non-financial sector entities 1,360,184 1,462,789 (102,605) (7.0%)
corporate clients* 560,033 616,513 (56,480) (9.2%) individual clients 800,151 846,276 (46,125) (5.5%)
Dues related to matured derivative transactions 115,137 116,547 (1,410) (1.2%) Total gross receivables from customers, including:
17,016,294 15,955,262 1,061,032 6.7%
non-financial sector entities 15,702,147 14,810,314 891,833 6.0% corporate clients* 9,743,623 8,948,135 795,488 8.9% individual clients 5,958,524 5,862,179 96,345 1.6%
Impairment, including: (1,199,152) (1,235,789) 36,637 (3.0%) Dues related to matured derivative transactions
(95,002) (96,063) 1,061 (1.1%)
Total net receivables from customers 15,817,142 14,719,473 1,097,669 7.5% Impairment coverage ratio with recognized impairment
80.1% 76.9%
corporate clients* 65.3% 60.0%
individual clients 89.9% 88.7%
*Corporate clients include enterprises, public sector, public and private companies, cooperatives, individual enterprises, non-commercial institutions operating for households.

Interim condensed consolidated financial statements of the Capital Group of Bank Handlowy w Warszawie S.A.
for the third quarter 2012
TRANSLATION
14
Amounts due from customers, gross, divided into performing vs. non-performing
Change PLN ’000 30.09.2012 31.12.2011
PLN ‘000 %
Performing loans, including: 15,581,559 14,425,608 1,155,951 8.0% non-financial sector entities 14,401,546 13,416,204 985,342 7.3%
corporate clients* 9,183,590 8,331,622 851,968 10.2% individual clients 5,217,956 5,084,582 133,374 2.6%
Non-performing loans, including: 1,319,598 1,413,107 (93,509) (6.6%) non-financial sector entities 1,300,601 1,394,110 (93,509) (6.7%)
corporate clients* 560,033 616,513 (56,480) (9.2%) individual clients 740,568 777,597 (37,029) (4.8%)
Dues related to matured derivative transactions 115,137 116,547 (1,410) (1.2%)
Total gross receivables from customers 17,016,294 15,955,262 1,061,032 6.7%
Non-performing loans ratio (NPL) 7.8% 8.9%
* Corporate clients include enterprises, public sector, public and private companies, cooperatives, individual enterprises, non-commercial institutions operating for households. On the liabilities side, liabilities towards banks decreased by PLN 3.4 billion, i.e. 57.1% compared to the end of 2011 and liabilities towards clients dropped by PLN 3.2 billion, i.e. 13.3%. The decline in liabilities towards clients was primarily driven by a reduction in corporate clients deposits, mainly term deposits (decline by PLN 2.7 billion, i.e. 36.3%) and, to a smaller extent, deposits held on current accounts (down by PLN 0.9 billion, i.e. 11.4%). On the other hand, retail term deposits rose by PLN 0.1 billion, mainly as a result of an increase in current accounts balance. Financial sector deposits also posted a slight increase (by PLN 0.3 billion, i.e. 15.3%), mainly attributable to an increase in balance of term deposits.
Amounts due to customers
Change PLN ’000 30.09.2012 31.12.2011
PLN ‘000 %
Customers deposits Current accounts, including: 12,438,215 13,228,771 (790,556) (6.0%) financial sector entities 288,647 267,645 21,002 7.9% non- financial sector entities, including: 12,149,568 12,961,126 (811,558) (6.3%)
Corporate clients*, including: 7,287,544 8,224,387 (936,843) (11.4%) Budgetary units 1,056,167 2,607,506 (1,551,339) (59.5%)
Individual clients 4,862,024 4,736,739 125,285 2.6% Time deposits,including 8,251,055 10,672,927 (2,421,872) (22.7%) financial sector entities 2,280,623 1,963,538 317,085 16.2% non-financial sector entities, including: 5,970,432 8,709,389 (2,738,957) (31.5%)
Corporate clients*, including: 4,752,266 7,463,779 (2,711,513) (36.3%) Budgetary units 623,736 762,883 (139,147) (18.2%)
Individual customers 1,218,166 1,245,610 (27,444) (2.2%)
Accrued interest 23,347 20,307 3,040 15.0%
Total customers deposits 20,712,617 23,922,005 (3,209,388) (13.4%)
Other amounts due to customers 183,369 173,842 9,527 5.5%
Total amounts due to customers 20,895,986 24,095,847 (3,199,861) (13.3%)
* Corporate clients include enterprises, public sector, public and private companies, cooperatives, individual enterprises, non-commercial institutions operating for households.

Interim condensed consolidated financial statements of the Capital Group of Bank Handlowy w Warszawie S.A.
for the third quarter 2012
TRANSLATION
15
2. Income statement
In the third quarter of 2012 the Group delivered a consolidated net profit of PLN 251.2 million, which represents an increase of PLN 68.5 million (i.e. 37.5%) as compared to the third quarter of 2011. The revenues of the Group rose by PLN 66.1 million (i.e. 10.9%) to PLN 674.4 million. The main determinants of the Group’s combined operating result in the third quarter of 2012 as compared to the third quarter of 2011 were as follows:
net interest income of PLN 370.2 million as compared to PLN 356.5 million in the third quarter of 2011 – up by PLN 13.7 million, i.e. 3.8%, stemming primarily from higher by PLN 15.9 million (i.e. 5.3%) interest income from customers receivables which were up by PLN 2.0 billion, i.e. 14.9% as compared to the third quarter of 2011. Additionally, there was an increase in interest income from debt securities available-for-sale (up by PLN 12.1 million, i.e. 7.9%) and from debt securities held-for-trading (up by PLN 11.8 million, i.e. 90.8%) as a result of an increase in an average portfolio balance. At the same time, the level of interest expenses in the third quarter of 2012 was higher than in the same period of the previous year, particularly in the area of liabilities towards financial sector entities and banks (increase by PLN 21.1 million, i.e. 98.2%, and PLN 10.2 million, i.e. 77.5%, respectively). A slight increase in the level of interest costs was also reported in the case of non-financial sector (up by PLN 1.8 million, i.e. 2.0%);
Interest income
Change PLN ‘000 01.07 -
30.09.2012 01.07 -
30.09.2011 PLN ‘000 %
Interest and similar income from: Balances with Central Bank 9,731 9,011 720 8.0% Amounts due from banks 16,289 11,924 4,365 36.6% Amounts due from customers, including: 316,911 301,049 15,862 5.3%
financial sector entities 6,584 7,387 (803) (10.9%) non-financial sector, including: 310,327 293,662 16,665 5.7%
credit cards 90,890 95,457 (4,567) (4.8%)
Debt securities available-for-sale 163,781 151,728 12,053 7.9%
Debt securities held-for-trading 24,884 13,042 11,842 90.8%
Total 531,596 486,754 44,842 9.2%
Interest expense and similar charges on:
Operations with Central Bank (1) - (1) . Amounts due to banks (23,298) (13,123) (10,175) 77.5% Amounts due to financial sector entities (42,519) (21,456) (21,063) 98.2% Amounts due to non-financial sector entities (94,203) (92,383) (1,820) 2.0% Loans and advances received (1,122) (3,015) 1,893 (62.8%) Debt securities issuance (244) (256) 12 (4.7%)
Total (161,387) (130,233) (31,154) 23.9%
Net interest income 370,209 356,521 13,688 3.8%
net fee and commission income of PLN 151.8 million as compared to PLN 155.9 million in the third quarter of 2011 – down by PLN 4.1 million, i.e. 2.6%, primarily due to lower commission income related to brokerage activities (among others due to a reduction in equity turnover volumes in the third quarter of 2012 – drop by 33% as compared to the same period of the previous year). A decline was also reported in the commission income from custody services, payment orders and sale of insurance and investment products. On the other hand, the net fee income from payment and credit cards improved, driven among others by higher card transaction volumes, as compared to the third quarter of 2011;

Interim condensed consolidated financial statements of the Capital Group of Bank Handlowy w Warszawie S.A.
for the third quarter 2012
TRANSLATION
16
Net fee and commission income Change
PLN ‘000 01.07 - 30.09.2012
01.07 - 30.09.2011
PLN ‘000 %
Fee and commission income Insurance and investment products 29,857 32,334 (2,477) (7.7%) Payment and credit cards 64,591 59,861 4,730 7.9%
Payment orders 26,267 28,958 (2,691) (9.3%)
Custody services 21,626 24,931 (3,305) (13.3%)
Cash loans 1,717 2,278 (561) (24.6%)
Brokerage operations 9,975 19,043 (9,068) (47.6%)
Account cash management services 6,965 7,239 (274) (3.8%)
Off-balance-sheet guarantee liabilities 3,685 3,867 (182) (4.7%)
Off-balance-sheet financial liabilities 1,463 1,699 (236) (13.9%)
Other 7,346 3,366 3,980 118.2%
Total 173,492 183,576 (10,084) (5.5%)
Fee and commission expense Payment and credit cards (8,822) (14,022) 5,200 (37.1%)
Brokerage operations (4,799) (6,015) 1,216 (20.2%) Fees paid to the National Depository for Securities (KDPW)
(4,255) (4,496) 241 (5.4%)
Brokerage fees (924) (898) (26) 2.9%
Other (2,897) (2,263) (634) 28.0%
Total (21,697) (27,694) 5,997 (21.7%)
Net fee and commission income Insurance and investment products 29,857 32,334 (2,477) (7.7%) Payment and credit cards 55,769 45,839 9,930 21.7%
Payment orders 26,267 28,958 (2,691) (9.3%)
Custody services 21,626 24,931 (3,305) (13.3%)
Cash loans 1,717 2,278 (561) (24.6%)
Brokerage operations 5,176 13,028 (7,852) (60.3%)
Account cash management services 6,965 7,239 (274) (3.8%)
Off-balance-sheet guarantee liabilities 3,685 3,867 (182) (4.7%)
Off-balance-sheet financial liabilities 1,463 1,699 (236) (13.9%) Fees paid to the National Depository for Securities (KDPW)
(4,255) (4,496) 241 (5.4%)
Brokerage fees (924) (898) (26) 2.9%
Other 4,449 1,103 3,346 303.4%
Total 151,795 155,882 (4,087) (2.6%)
net income on trade financial instruments and revaluation of PLN 61.4 million as compared to PLN 92.2 million in the third quarter of 2011, i.e. down by PLN 30.8 million, mainly as a result of lower result on the Bank’s proprietary management;
net income on debt investment securities of PLN 97.8 million as compared to PLN 7.6 million in the third quarter of 2011 – i.e. up by PLN 90.2 million due to the realized gains in the declining bond yields environment in the third quarter of 2012;
operating expenses and overheads including depreciation expenses of PLN 336.8 million as compared to PLN 359.1 million in the corresponding period of the previous year – down by PLN 22.2 million (i.e. 6.2%) due to a reduction in staff expenses by PLN 14.7 million, i.e. 8.6% (partly reflecting employment restructuring), and administrative costs by PLN 7.9 million, i.e. 4.5%, mainly as a result of lower costs of external services related to product distribution and other external services’ costs with a simultaneous increase in technological infrastructure expenses in Consumer Banking;

Interim condensed consolidated financial statements of the Capital Group of Bank Handlowy w Warszawie S.A.
for the third quarter 2012
TRANSLATION
17
General administrative expenses and depreciation expense
Change PLN ‘000 01.07 -
30.09.2012 01.07 -
30.09.2011 PLN ‘000 % Staff expenses (155,988) (170,684) 14,696 (8.6%)
Remuneration costs (131,811) (142,249) 10,438 (7.3%) Bonuses and rewards (24,177) (28,435) 4,258 (15.0%)
Administrative expenses (165,258) (173,128) 7,870 (4.5%)
Telecommunication fees and hardware purchase costs (51,180) (38,492) (12,688) 33.0% Advisory, audit, consulting and other external services’ costs (18,950) (25,050) 6,100 (24.4%)
Building maintenance and rent costs (25,026) (26,651) 1,625 (6.1%) Marketing costs (10,402) (11,971) 1,569 (13.1%) Cash management services, KIR service and other transactional costs
(11,269) (13,222) 1,953 (14.8%)
Costs of external services concerning distribution of banking products
(12,930) (18,135) 5,205 (28.7%)
Postal services, office supplies and printmaking costs (7,503) (6,961) (542) 7.8% Training and education costs (677) (2,278) 1,601 (70.3%) Banking supervision costs (2,149) 273 (2,422) (887.2%) Other costs (25,172) (30,641) 5,469 (17.8%) Depreciation/amortization of tangible and intangible assets
(15,579) (15,257) (322) 2.1%
Total (336,825) (359,069) 22,244 (6.2%)
net impairment losses of PLN 22.3 million as compared to PLN 16.5 million in the third quarter of 2011 (up by PLN 5.8 million, i.e. 35.2%). The increased net impairment losses were reported in Corporate Banking, particularly in SME segment as a result of higher risk of borrower’s failure to fulfill their obligations under loan agreements on time, mainly in the individually assessed portfolio. At the same time, retail credit losses fell significantly, mainly due to credit policy changes introduced over the past years and their positive impact on consumer loans’ and credit cards’ portfolios.
Result on impairment write-off of financial assets and provisions for off-balance sheet liabilities
Change PLN ‘000 01.07 –
30.09.201201.07 –
30.09.2011 PLN ‘000 %
Net impairment write-downs of financial assets
Impairment write-downs Amounts due from banks (269) (317) 48 (15.1%)Amounts due from customers (76,144) (81,851) 5,707 (7.0%)Dues related to matured transactions on derivative instruments
(157) (70) (87) 124.3%
Other (3,263) (3,257) (6) 0.2% (79,833) (85,495) 5,662 (6.6%)
Reversals of impairment write-downs Amounts due from banks 270 447 (177) (39.6%)Amounts due from customers 58,491 69,643 (11,152) (16.0%)Dues related to matured transactions on derivative instruments
354 161 193 119.9%
59,115 70,251 (11,136) (15.9%) (20,718) (15,244) (5,474) 35.9%

Interim condensed consolidated financial statements of the Capital Group of Bank Handlowy w Warszawie S.A.
for the third quarter 2012
TRANSLATION
18
Change PLN ‘000 01.07 –
30.09.201201.07 –
30.09.2011 PLN ‘000 %Net (charges to)/releases of provisions for off-balance-sheet commitments
Charges to provisions for off-balance-sheet commitments (6,897) (9,851) 2,954 (30.0%)
Releases of provisions for off-balance-sheet commitments 5,329 8,613 (3,284) (38.1%) (1,568) (1,238) (330) 26.7% .Net impairment losses (22,286) (16,482) (5,804) 35.2%
3. Ratios
In the third quarter of 2012 basic financial ratios were as follows:
Financial ratios Q3 2012 Q3 2011
ROE * 15.6% 12.4%
ROA** 2.3% 1.6%
Cost/Income 50% 59%
Loans to non-financial sector/Deposits from non-financial sector 81% 72%
Loans to non-financial sector/Total assets 40% 34%
Net interest income/Revenue 55% 59%
Net fee and commission income/Revenue 23% 26%
*Sum of net profit for the last four quarters to the average equity for the last four quarters (excluding net profit for the current year). ** Sum of net profit for the last four quarters to the average assets for the last four quarters.
Group employment*
Change In full time job equivalents (FTE) 01.01 – 30.09.2012
01.01 – 30.09.2011 FTEs %
Average employment in the third quarter 5,140 5,920 (780) (13.2)
Average employment in the period 5,354 5,839 (485) (8.3)
Employment at the end of quarter 4,995 5,819 (824) (14.2)
*does not include employees on parential and unpaid leave
In the third quarter 2012 the Group noted a significant drop in the employment in comparison to the corresponding period of 2011. It was a result of group layoffs started in the second quarter 2012 due to employment restructuring in connection with optimization of branch network aiming at increasing of the effectiveness in retail business and other areas of the Bank.
As at 30 September 2012, capital adequacy ratio of the Group amounted to 17.6% and was 1.2 percentage point higher comparing to the end of 2011, mainly because of the increase of the own funds of the Group due to retention of 50% of the Bank’s net profit for 2011. The total capital requirement grew by 4.6% due to increased portfolio of assets and risk-weighted off-balance sheet liabilities (up by 11.3%).
Capital adequacy ratio*
PLN ‘000 30.09.2012 31.12.2011
I Own funds in total, including: 4,906,024 4,354,853
Reduction of basic and supplementary funds investments in financial entities 15,060 57,945
intangible assets, including: 1,326,367 1,292,066
goodwill 1,245,976 1,245,976

Interim condensed consolidated financial statements of the Capital Group of Bank Handlowy w Warszawie S.A.
for the third quarter 2012
TRANSLATION
19
Capital adequacy ratio*
PLN ‘000 30.09.2012 31.12.2011
II Risk-weighted assets and off-balance-sheet commitments (bank portfolio)
20,075,006 18,042,413
III Total capital requirements, including: 2,228,679 2,130,748 credit risk capital requirements (II*8%) 1,606,000 1,443,393 counterparty risk capital requirements 100,800 133,148
capital requirements for excess of exposures’ concentration limit and large exposures’ limit
62,498 87,064
total market risk capital requirements 72,224 83,167 operational risk capital requirements 366,893 360,531 other capital requirements 20,263 23,445
Capital adequacy ratio (I/III*12,5) 17.6% 16.4%
*Capital Adequacy Ratio was calculated according to the rules stated in Resolution No 76/2010 of the Commission for Banking Supervision dated 10 March 2010 regarding the extent and detailed rules of calculation of capital requirements in respect of particular risks (KNF Official Journal No. 2. item 11 as amended).
7 Segmental reporting
Operating segment is a separable component of the Group engaged in business activity, generating income and incurring expenses (including those on intragroup transactions between segments), whose operating results are regularly reviewed by the Management Board - as chief operating decision-maker of the Group, in order to allocate resources and assess its performance.
The Group is managed at the level of two operating segments – Corporate Banking and Consumer Banking. The valuation of segment’s assets and liabilities as well as calculation of its results is based on Group’s accounting policies, including intragroup transactions between segments.
The allocation of Group’s assets, liabilities, income and expenses to operating segments was made on the basis of internal information prepared for management purposes. Transfer of funds between Group’s segments is based on prices derived from market rates. The transfer prices are calculated using the same rules for both segments and any difference results only from maturity and currency structure of assets and liabilities.
Corporate Banking
Within the Corporate Banking segment, the Group offers products and renders services to business entities, self-government units and public sector. Apart from traditional banking services consisting in credit and deposit activities, the segment provides services in the area of cash management, trade financing, leases, brokerage and custody services in respect of securities and offers treasury products on financial and commodity markets. In addition, the segment offers a wide range of investment banking services on the local and international capital markets, including advisory services as well as obtaining and underwriting financing via public and non-public issue of financial instruments. The activities also comprise proprietary transactions on the capital, debt and derivative instruments market.
Consumer Banking
Within the Consumer Banking segment the Group provides products and financial services to individuals as well as micro enterprises and individual entrepreneurs through the Citibusiness offer. Apart from keeping bank accounts and providing an extensive credit and deposit offer, it also offers cash loans, mortgage loans and credit cards, provides asset management services and acts as agent in investment and insurance products sale.
The Group conducts its operations solely on the territory of Poland.

Interim condensed consolidated financial statements of the Capital Group of Bank Handlowy w Warszawie S.A.
for the third quarter 2012
TRANSLATION
20
Consolidated income statement of the Group by business segment
For the period 01.01. – 30.09.2012 01.01. – 30.09.2011
PLN ‘000 Corporate
Banking Consumer
Banking Total Corporate
BankingConsumer
BankingTotal
Net interest income 551,498 585,442 1,136,940 483,661 568,149 1,051,810 Internal interest income, including:
(5,822) 5,822 - 7,799 (7,799) -
Internal income - 5,822 5,822 7,799 - 7,799
Internal expenses (5,822) - (5,822) - (7,799) (7,799)
Net commission income 189,947 265,194 455,141 239,128 254,066 493,194
Dividend income 2,779 3,714 6,493 1,314 4,374 5,688
Net income on trade financial instruments and revaluation
251,552 27,854 279,406 200,393 22,469 222,862
Net gain on debt investment iti
216,912 - 216,912 18,934 - 18,934 Net other operating income 7,780 (20,721) (12,941) 17,854 (17,831) 23
General administrative expenses (466,032) (599,084) (1,065,116) (442,477) (586,894) (1,029,371)
Depreciation of fixed assets and intangible assets
(23,260) (26,632) (49,892) (20,258) (24,201) (44,459)
Profit / (loss) on sale of nonfinancial assets
49 25 74 93 2,030 2,123
Result on write offs due to impairment of financial assets and provisions for off-balance sheet liabilities
(24,340) (32,746) (57,086) 12,819 (86,614) (73,795)
Operating income 706,885 203,046 909,931 511,461 135,548 647,009 Share in net profits (losses) of entities valued at equity method
491 - 491 513 - 513
Profit before tax 707,376 203,046 910,422 511,974 135,548 647,522
Income tax expense (184,858) (132,189)
Net profit 725,564 515,333
State as at 30.09.2012 31.12.2011
PLN ‘000 Corporate
Banking Consumer
Banking Total
Corporate Banking
Consumer Banking
Total
Assets, including: 30,819,745 5,682,508 36,502,253 36,666,378 5,611,820 42,278,198
Assets valued at equity method 15,060 - 15,060 57,945 - 57,945
Fixed assets held-for-sale - 12,554 12,554 15,760 9,902 25,662
Liabilities, including: 27,681,542 8,820,711 36,502,253 34,556,302 7,721,896 42,278,198
Obligations 22,608,410 6,919,513 29,527,923 29,911,099 5,922,618 35,833,717
8 Activities of the Group
1. Corporate Banking
1.1. Summary of segment results
Change PLN ‘000 Q3 2012 Q3 2011
PLN ‘000 %
Net interest income 175,147 162,293 12,854 7.9%
Net fee and commission income 58,846 72,109 (13,263) (18.4%)

Interim condensed consolidated financial statements of the Capital Group of Bank Handlowy w Warszawie S.A.
for the third quarter 2012
TRANSLATION
21
Change PLN ‘000 Q3 2012 Q3 2011
PLN ‘000 %
Dividend income 1,004 31 973 3138.7%
Net income on trade financial instruments and revaluation
52,097 83,146 (31,049) (37.3%)
Net gain on debt investment securities 97,844 7,600 90,244 1187.4%
Net other operating income 557 3,160 (2,603) (82.4%)
Total income 385,495 328,339 57,156 17.4%
General administrative expenses and depreciation (148,895) (155,900) 7,005 (4.5%)
Profit/(loss) on sales of tangible fixed assets 2 (22) 24 (109.1%)
Net impairment losses (15,770) 11,637 (27,407) (235.5%)
Share in net profits (losses) of entities valued at equity method
226 197 29 14.7%
Profit before tax 221,058 184,251 36,807 20.0% Cost / Income 39% 47%
The key highlights that impacted the gross profit of Corporate Banking for the third quarter of 2012 as compared to the corresponding period of the previous year were as follows:
increase in net interest income reflecting higher income from debt securities (due higher average balance of the securities portfolio year-on-year) and from client activities driven by higher income from loans to corporate clients, which grew by 18.8% as compared to the third quarter of 2011. At the same time, in the third quarter of 2012 interest expenses increased, mainly in the area of financial institutions;
decline in net fee and commission income, mainly in the area of brokerage activity – due to a reduction in equity turnover volumes by 33% as compared to the same period of the previous year. In the third quarter of 2012 net fee and commission income from custody services and transaction banking services also went down;
decline in net income from trade financial instruments and revaluation mainly due to lower result on the Bank’s proprietary management;
significant increase in net gain on debt investment securities - realized gains on sales of securities in favorable conditions on the domestic bond market;
decline in general administrative expenses resulting mainly from lower staff expenses affected by, among others, employment restructuring and change in accruals due to overdue leave, as well as lower marketing costs;
growth of net impairment losses (PLN -15.8 million in the third quarter of 2012 as compared to PLN +11.6 million in the corresponding period of the previous year), primarily in the area of SME, due to increased risk of borrowers’ failure to fulfill obligations under loan agreements, mainly in the individually asserted portfolio.
1.2. Corporate and Investment Bank and the Capital Markets
Corporate and Commercial Bank
Corporate banking activities of the Bank include comprehensive financial services provided to the largest Polish companies and strategic enterprises with a strong growth potential, as well as to the largest financial institutions and public sector companies.
At the end of the third quarter of 2012, the number of corporate clients (including customers of the Corporate Bank, global clients and corporate clients) was slightly below 8,000, which means a small decrease compared to the previous quarter, when the number of clients exceeded 8,000. Under the Corporate Bank (small and medium companies, large enterprises and public sector) the Bank served

Interim condensed consolidated financial statements of the Capital Group of Bank Handlowy w Warszawie S.A.
for the third quarter 2012
TRANSLATION
22
almost 6,000 clients at the end of the third quarter of 2012 (which is the stable level compared to nearly 6,000 clients served at the end of the second quarter of 2012).
What Corporate Bank clients have in common is their demand for advanced financial products and consultancy on financial services. In that area, the Bank provides coordination of investment banking, treasury and cash management products and prepares loan offers involving diverse forms of financing. The innovativeness and competitiveness of the novel financing structures on offer come from a combination of expertise and experience of the Bank and its cooperation within the global Citigroup structure.
The table below presents balances of assets and liabilities in the particular segments in the management view.
Assets PLN million Change Change
30.09.2012 30.06.2012 30.09.2011(1)/(2) (1)/(3)
(1) (2) (3) ‘000 % ‘000 %
Enterprises*, including: 3,030 2,967 2,697 63 2% 333 12%
SMEs 1,511 1,510 1,431 0 0% 79 6%
MMEs 1,519 1,457 1,266 63 4% 253 20%
Public Sector 89 129 101 (40) (31%) (11) (11%)
Global Clients 3,763 3,470 3,562 293 8% 201 6%
Corporate Clients 2,404 1,882 1,551 522 28% 854 55%
Other** 536 601 680 (65) (11%) (144) (21%)
Total Corporate and Commercial Bank 9,822 9,049 8,591 773 9% 1,231 14%
Liabilities
PLN million Change Change
30.09.2012 30.06.2012 30.09.2011
(1)/(2) (1)/(3)
(1) (2) (3) ‘000 % ‘000 %
Enterprises*, including: 2,796 2,982 2,760 (187) (6%) 36 1%
SMEs 2,130 2,231 2,094 (102) (5%) 36 2%
MMEs 666 751 666 (85) (11%) (0) (0%)
Public Sector 1,879 2,096 1,690 (217) (10%) 190 11%
Global Clients 6,621 5,924 6,213 697 12% 408 7%
Corporate Clients 2,653 3,107 3,459 (454) (15%) (806) (23%)
Other** 67 72 39 (5) (7%) 28 70%
Total Corporate and Commercial Bank 14,016 14,183 14,161 (166) (1%) (144) (1%)
* Enterprises include clients with annual turnover from PLN 8 million to PLN 150 million (SME) and over PLN 150 million (large enterprises). ** ‘Other’ include, among others, clients subject to restructuring and clients of Handlowy Leasing Sp. z o.o., who are not clients of the Bank.
31%
1%
38%
25%
5%
Structure of the Commercial and Corporate Bank assets as of 30.09.2012
Enterprises
Public Sector
Global Clients
Corporate Clients
Other
20%
13%47%
19% 1%
Structure of the Commercial and Corporate Bank liabilities as of 30.09.2012
Enterprises
Public Sector
Global Clients
Corporate Clients
Other

Interim condensed consolidated financial statements of the Capital Group of Bank Handlowy w Warszawie S.A.
for the third quarter 2012
TRANSLATION
23
Key transactions and achievements in the Corporate and Commercial Bank in the third quarter of 2012:
In September 2012 the Bank organized a subordinated bond issue and served the role of the issue dealer for one of the major banks in Poland, with the issue value of PLN 1.6 billion;
In cooperation with UBS, the Bank participated in a transaction involving the sale of shares of Bank Gospodarki Żywnościowej S.A. to Rabobank, serving the role of an adviser of the Ministry of the State Treasury. The transaction value was approximately USD 800 million;
In Q3 2012, the Bank carried out numerous financing transactions with its Commercial Bank clients, including, in particular: a trade credit for a metal structure manufacturer (PLN 40 million), an overdraft facility for an electrical household appliances wholesale sector client (PLN 30 million), an overdraft facility for a cable and conductor manufacturer (PLN 20 million), supplier financing for a meat product company (PLN 16 million), a trade credit for a high voltage secondary circuit box manufacturer (EUR 2.5 million), investment loan commitment for a commercial material printing company (PLN 9.2 million) and a multi-purpose facility for a special-purpose vehicle distributor (PLN 9 million).
Activity and Business Achievements of the Treasury Division
In Q3 2012, despite unfavorable economic conditions and a slowdown in commercial exchange in Poland, the Bank continued to maintain a significant level of foreign currency transactions with its corporate clients. The volume of electronic transactions carried out through the CitiFX Pulse platform remained unchanged compared to Q2 2012. The CitiFX Pulse electronic transaction platform retained a strong client interest, while over 70% of foreign exchange transactions were initiated through the online platform;
The trading volume of transactions in treasury bonds, entered into with financial institutions in Q3 2012, increased by 65% year-on-year;
The Bank continues to play the leading role in organizing bond and certificate of deposit issues for banks. According to the “Rating&Rynek” report produced by Fitch Ratings at the end of August 2012, the Bank’s share in the aforementioned market was 33%;
In Q3 2012, the Bank continued to hold the leading position in the 2013 Treasury Securities Dealer competition organized by the Polish Ministry of Finance.
Transactional Banking
The Bank is Poland’s leading institution offering transaction banking services. Together with a range of traditional services, the Bank offers up-to-date liquidity management services, mass payment solutions and accounts receivable management products.
Transaction banking includes the following products and services:
Funds management products: deposits and current accounts, liquidity management products, Micropayments, electronic banking;
Card products;
Payments and accounts receivable: Direct Debit, Speedcollect;
Cash products;
EU consultancy;
Trade financing products.
Services delivered to public sector clients constitute one of the strategic development areas of the Bank’s transactional banking offering. In Q3 2012, the Bank was again the winner in a tender organized by the authorities of the capital city of Warsaw and aimed at selection of an institution responsible for provision of comprehensive bank account services to the city. Selection of the Bank for the second time should be particularly emphasized considering the significant complexity of the local government structure in Warsaw. It also proves the highly advanced level of the Bank’s offering of transactional banking services for the public sector. Public sector experience brought

Interim condensed consolidated financial statements of the Capital Group of Bank Handlowy w Warszawie S.A.
for the third quarter 2012
TRANSLATION
24
further successes – in Q3 2012 the Bank won tenders concerning provision of services to the local government authorities of Elbląg and Olsztyn.
Other Transactional Banking business achievements in Q3 2012:
Electronic banking:
− The total number of transactions processed in electronic form through the CitiDirect and CitiDirect Banking Evolution systems was approximately 6 million, which denotes a 1% increase year-on-year;
− The number of corporate clients authorized to use electronic banking systems was 11,500 at the end of Q3 2012, which denotes an increase of 11% year-on-year;
− The number of active electronic banking system users increased by more than 6% in the analyzed period;
− The share of bank statements delivered to clients only in electronic form was maintained at the level of 90%.
− “CitiDirect Banking Evolution” is a new electronic banking system, dedicated to small and medium-sized enterprises. The system has been made available to clients in April 2012. The number of active users of the new system reached the level of almost 1,000 in several months (figures as of the end of Q3 2012).
Speedcollect, Direct Debit
The Bank’s clients include businesses with a broad base of customers making frequent payments. In order to ensure effective management of their settlements with counterparties, the Bank continues to enhance the offering of its receivables management products. In Q3 2012, a new technology platform was launched by the Bank to be used for SpeedCollect and Direct Debit transaction management purposes. Owing to its three-layer system architecture, system scalability and its capability of parallel and independent information processing for each client, the new platform guarantees rapid completion of even the most complex projects.
Cross-border funds transfers
In Q3 2012, the volume of cross-border funds transfers increased by almost 13% year-on-year.
Micro-deposits
− The number of clients using the Micro-deposits product rose by 15% compared to Q3 2011. The aforementioned increase in the number of clients translated into a rise in the number of active micro-accounts by almost 60% over the same period;
− The Micro-deposits offering was expanded in Q3 2012 to include a new functionality, which facilitates the reporting process related to client balances available at the Bank to a considerable degree. Although the aforementioned solution has been developed mainly for public sector clients, it may also be used by other sector entities.
Card products
− In Q3 2012, an 11% increase was recorded in the value of cash transactions in the business card segment, whereas the value of non-cash transactions remained at a virtually unchanged level compared to the corresponding period of the preceding year. In the analyzed period, the number of non-cash transactions rose by 3%, whereas the number of cash transactions by 4%;
− As regards debit cards, the Bank recorded a 2% rise in the number of non-cash and cash transactions compared to Q3 2011.
EU advisory services
− In Q3 2012, the Bank focused on promotional activities concerning the technology credit. The aforementioned initiative allowed the Bank to provide its clients with information concerning the mechanism of the above instrument in the context of the latest changes resulting from the Polish Innovation Support Act.

Interim condensed consolidated financial statements of the Capital Group of Bank Handlowy w Warszawie S.A.
for the third quarter 2012
TRANSLATION
25
− The Bank’s involvement in projects aimed at promoting EU funds among entrepreneurs translated into new EU advisory service agreements.
Trade finance products
− Trade receivables financing with full, partial or non-assumption of the debtor’s insolvency risk plays a major role among the Bank’s trade finance products. The aforementioned group also includes factoring facilities. The available offering continues to attract the clients’ interest, which allows the Bank to gradually increase the value of its assets and its market share. In Q3 2012, the value of the Bank’s trade finance assets increased by 15% year-on-year;
− The Bank carried out trade finance transactions in the oil and gas industry in the receivables discounting formula for the total amount of almost PLN 0.5 billion and continued expanding a supplier financing program for the largest chain store in Poland. The aforementioned initiatives contributed to reinforcement of the Bank’s leading position in supplier financing in the commercial industry;
− As regards the value of bank guarantees issued, in Q3 2012 the Bank recorded a 15% rise year-on-year.
Fiduciary and Custody Services
The Bank is a leader among custodian banks in Poland. It provides fiduciary services to foreign institutional investors as well as custody services to Polish financial entities, in particular pension and investment funds as well as unit-linked insurance funds.
As of 30 September 2012, the Bank maintained almost 14,000 securities accounts.
At the same time, it served the role of a custodian bank for five open-end pension funds: Amplico OFE, Aviva OFE Aviva BZ WBK, ING OFE, Pekao OFE and Nordea OFE, for four optional pension funds: MetLife Amplico DFE, Nordea DFE, ING DFE and DFE Pekao, and for two employee pension funds – Pracowniczy Fundusz Emerytalny PZU “Słoneczna Jesień” and Pracowniczy Fundusz Emerytalny Telekomunikacji Polskiej S.A. Additionally, custody services were provided to investment funds managed by the following Fund Management Companies: BZ WBK TFI S.A., PKO TFI S.A., Pioneer Pekao TFI S.A., Legg Mason TFI S.A. and Aviva Investors Poland TFI S.A.
Brokerage Activities
The Group’s brokerage activities in the capital market are carried out through Dom Maklerski Banku Handlowego S.A. (“DMBH”), where the Bank is the sole shareholder.
In Q3 2012, DMBH acted as a broker in almost 11% of secondary-market share trading (figures excluding calls), assuming the leading position in terms of its share in trading. Transactions made through DMBH in the WSE equity market amounted to PLN 11.5 billion, which denotes a 33.1% decrease year-on-year, but a 25% rise compared to Q2 2012.
The number of investment accounts maintained by DMBH at the end of Q3 2012 was almost 9,500, which denotes a 3.8% rise year-on-year.
In Q3 2012, DMBH’s activity as the WSE market maker did not undergo any major changes. As of the end of September 2012, DMBH acted as the market maker for 39 company shares and for WIG20 forward contracts, assuming a leading position among brokerage houses which serve this role at the Warsaw Stock Exchange.
DMBH’s financial performance is affected mainly by (both Polish and foreign) institutional client activity, which, in turn, depends on the inflow of funds and conditions in equity markets. The brokerage house is exposed mainly to the risk of further changes to the 2nd pillar of the pension system, aimed at reducing the level of contributions transferred to open-end pension funds. On the other hand, expected interest rate cuts, which may boost the attractiveness of more risky instruments at the expense of deposits and contribute to a shift of a portion of savings to equity funds, may exert a positive influence on the Bank’s brokerage activities.

Interim condensed consolidated financial statements of the Capital Group of Bank Handlowy w Warszawie S.A.
for the third quarter 2012
TRANSLATION
26
Summary Income Statement and Balance Sheet*
*Unaudited data
Leasing Activities
The Group’s leasing activities are carried out through Handlowy Leasing Sp. z o.o. (“Handlowy Leasing”, “HL”), where the Bank is the sole shareholder.
The value of assets leased in Q3 2012 was PLN 48.9 million, which denotes a 2% rise year-on-year, compared to PLN 47.9 million in Q3 2011.
The structure of the aforementioned assets included: vehicles (65%) and machinery and equipment (35%). A 17% increase was recorded with respect to Vehicles, whereas Machinery and Equipment saw a decrease of 17%.
Net asset value of leases Change
PLN milion Q3 2012 Q3 2011 PLN million %
Value of leases contracted in the period: 49.0 47.9 1.1 2%
for vehicles 31.7 27.0 4.7 17%
for machinery and equipment 17.3 20.9 (3.6) (17%)
Summary Income Statement and Balance Sheet*
*Unaudited data
2. Consumer Banking
2.1. Summary of the segmental results
Change PLN ’000 Q3 2012 Q3 2011
PLN ‘000 %
Net interest income 195,062 194,228 834 0.4% Net fee and commission income 92,949 83,773 9,176 11.0% Net income on trade financial instruments and revaluation 9,292 9,037 255 2.8%
Net other operating income (8,415) (7,065) (1,350) 19.1%
Total income 288,888 279,973 8,915 3.2%
General administrative expenses and depreciation (187,930) (203,169) 15,239 (7.5%) Profit/(loss) on sale of tangible fixed assets 4 (131) 135 (103.1%)
Net impairment losses (6,516) (28,119) 21,603 (76.8%)
Profit before tax 94,446 48,554 45,892 94.5%
Cost/Income 65% 73%
Company’s Name Headquarter
Participation interest of
the Bank in equity
Balance sheet as at 30.09.2012
Equity as at 30.09.2012
Net financial result for
01.01-30.09.2012
% PLN ‘000 PLN ‘000 PLN ‘000
Dom Maklerski Banku Handlowego S.A. Warszawa 100.00 818,967 94,048 7,010
Company’s Name Headquarters Participation
interest of the Bank in equity
Balance sheet as at 30.09.2012
Equity as at 30.09.2012
Net financial result for 01.01-
30.09.2012 % PLN ‘000 PLN ‘000 PLN ‘000
Handlowy-Leasing Sp. z o.o. Warszawa 100.0 643,175 155,573 5,209

Interim condensed consolidated financial statements of the Capital Group of Bank Handlowy w Warszawie S.A.
for the third quarter 2012
TRANSLATION
27
The key highlights that impacted the gross profit of Consumer Bank in the third quarter of 2012 as compared to the corresponding period of 2011 were as follows:
stable net interest income, driven by higher mortgage interest income and lower interest income from credit cards as well as by higher interest expenses due to increased deposit balances;
increase in net fee and commission income, mainly in the area of credit cards, among others due to increased value of credit card transactions. Additionally, fee expenses on credit cards include PLN 4.4 million of positive one-off related to settlements with card organizations;
operating expenses decreased as a result of branch network optimization and a year-on-year drop in expenses on direct sales channels. At the same time technological infrastructure costs in the Bank increased as compared to the corresponding period of the previous year;
net impairment losses declined, reflecting changes in the credit policy made over the past years and their positive impact on the quality of consumer loans and credit cards portfolios.
2.2. Selected business data
Q3 2012 Q2 2012 Q3 2011 Change QoQ
Change YoY
Number of individual customers 869,103 949,822 982,830 (80,719) (113,727) Number of current accounts, including: 630,403 667,390 645,735 (36,987) (15,332)
number of operating accounts* 181,211 183,642 177,712 (2,431) 3,499 Number of operating accounts newly acquired during the reported period* 19,084 19,880 28,567 (796) (9,483) Number of saving accounts 233,287 220,738 221,810 12,549 11,477 Number of credit cards, including: 806,921 819,701 864,842 (12,780) (57,921)
co-branded cards 467,659 471,434 487,954 (3,775) (20,295) Number of active credit cards* 729,150 738,517 772,850 (9,367) (43,700) Number of debit cards, including: 425,354 462,444 473,513 (37,090) (48,159)
PayPass cards 362,541 377,824 303,074 (15,283) 59,467 * The comparative data for Q3 2011 differ from the data presented in the Q3 2011 Consolidated Report due to a change in the calculation methodology. The drop in number of individual customers is driven by the Bank’s decision on the closure of non-active customers’ accounts and is not related to the optimization of the Banks’s branch network.
2.3. Business achievements
Credit Cards
The number of credit cards at the end of Q3 2012 was 806,900.
Based on figures available at the end of September 2012, the Bank maintained its leading position in the credit card market in terms of the value of credit facilities extended in the form of credit cards, holding a market share of 18.5% compared to 18.1% in the corresponding period of the preceding year. According to the data available at the end of the second quarter of 2012 the Bank’s share in the value of credit cards transactions was 22.9% and during the year it increased from 22.6% at the end of 2Q 2011.
The structure of credit cards acquisition in 3Q 2012 was dominated by multipartner Citibank Credit Card World with the share in the acquisition of 51% and Citibank Credit Card Wizz Air’s share in the acquisition of 29%.
In order to increase the number of payments made with credit cards, the Bank has undertaken a number of promotional activities and held competitions with rewards such as the Samsung Galaxy S III mobile phone. In July 2012, a new Internet website was launched for the Citibank Credit Card discount program (www.citirabaty.pl), which presents the latest discounts offered to the clients of Citi Handlowy.

Interim condensed consolidated financial statements of the Capital Group of Bank Handlowy w Warszawie S.A.
for the third quarter 2012
TRANSLATION
28
Bank Accounts
Current Accounts
In Q3 2012, the Bank maintained 630,000 current accounts (including 443,000 local currency accounts and 187,000 foreign currency accounts), which denotes a drop by 2.4% year-on-year (at the end of September 2011, the number of such accounts maintained by the Bank was 645,700). The aforementioned decrease was driven by the decision to close 70,000 inactive client accounts and it was not caused by the clients’ termination of their bank account agreements as a result of the branch network optimization project. The total account balance was PLN 2.4 billion, compared to PLN 2.1 billion at the end of Q3 2011. In order to increase the balance of personal accounts, the Bank continued implementation of its customer relationship policy and undertook initiatives aimed at encouraging active personal account use.
Savings Accounts
The number of savings accounts at the end of Q3 2012 was 194,600. The total savings account balance was PLN 2.4 billion, compared to 221,000 savings accounts with the total balance of PLN 2.5 billion in the corresponding period of the preceding year. As in the case of current accounts, the aforementioned decrease in the savings account number resulted from the Bank’s decision to close inactive accounts.
Offering Changes
In August 2012, the Bank modified its deposit product fees and charges. No changes were introduced to the Citigold and CitiForward segments, which remain the primary focus of the Bank. Although slight increases were introduced to certain fees charged on clients with income of less than PLN 5,000, the offering itself (provided that transactions are carried out individually by the client) is still very attractive.
Credit Products
Cash Loan
In Q3 2012, the Bank granted cash loans of PLN 208 million, which represents the same sales level as in Q2 2012 and denotes a 28% increase year-on-year. In August, the Bank introduced an interesting cash advance product with a low interest rate of 7.77% (limited amount, tenor and target client group), supported by a major advertising campaign. The aforementioned initiative was aimed at encouraging clients to visit our branches and obtain details of the Bank’s comprehensive product offering.
Mortgage Products
At the end of Q3 2012, the mortgage loan portfolio balance was PLN 862 million, which represents a 67% rise year-on-year and an increase of 14% compared to Q2 2012.
In Q3 2012,high acquisition of mortgage loans was continued. As sales activities were carried out both through the Bank’s internal channels (Mortgage Centers) and through its Partners (to a considerable extent), the Bank’s mortgage product offering stood out in the competitive market of financial services. At the end of Q3 2012, the Bank cooperated with 1,900 Partners offering the Citi Handlowy’s mortgage products.
Insurance and Investment Products
At the end of Q3 2012, the total value of funds managed in the form of investment and savings products (including, certificates of deposit, dual-currency deposits, investment deposits as well as unit-linked life insurance products, general endowment and child endowment insurance products) purchased by consumers through the Bank recorded a 6.1% decrease year-on-year, which was mainly due to a drop in the value of assets resulting from redemptions and payments related to expiring products;
The value of the aforementioned funds was PLN 4.5 billion at the end of Q3 2012, compared to PLN 4.8 billion at the end of Q3 2011;

Interim condensed consolidated financial statements of the Capital Group of Bank Handlowy w Warszawie S.A.
for the third quarter 2012
TRANSLATION
29
In the analyzed period, increases were recorded in the following investment product groups: structured products in the form of investment life insurance (+88%), unit-linked, regular premium life insurance (+35.3%);
The Bank’s investment product offering was enhanced in Q3 2012 to include 3 new, currency risk hedged, foreign funds in the Polish currency. The aforementioned funds increased the range of solutions offered in the debt and equity asset classes;
As regards structured products, in Q3 2012 the Bank carried out the offer of 12 structure bond subscriptions as well as 3 investment life insurance subscriptions;
In July 2012, a new, promotional offer combining investment insurance products (unit-linked life insurance as well as structured life and endowment insurance) and term deposits, was introduced by the Bank;
In August 2012, the Bank’s offering was enhanced with a new life insurance product (“Twoja Ochrona”), providing coverage against death and permanent disability. The aforementioned product is offered to credit card holders.
2.4. Development of distribution channels
Mobile Banking
In Q3 2012, the Bank continued implementation of its client acquisition strategy as well as initiatives aimed at building awareness of the services and benefits related to telephone fund management.
The number of mobile banking users has been growing gradually. At the end of Q3 2012, over 97,000 clients used the Citi Mobile banking services, out of which almost 13,000 logged on to Citi Mobile for the first time during the analyzed quarter.
Internet Banking
In Q3 2012, the Bank followed its Internet website development strategy with the objective to improve its quality and accessibility as well as increasing the number of clients actively using the service. The number of active service users in Q3 2012 was 391,800, and it rose by 12% year-on-year.
In September 2012, the Bank launched a new version of the service dedicated to its wealthy, Citigold clients. In the new version, changes were introduced to the layout of information, colors and icons, so that it suits the needs and requirements of wealthy clients. At the same time, the service complies with the requirements of Citi’s global strategy concerning visual identification of Internet websites.
In Q3 2012, the Bank continued to accomplish its strategy objectives to increase the share of Internet credit card acquisition in the total retail sales through its presence in theme websites, partners’ and group purchase websites and through electronic communications to their users. Consequently, Internet acquisition results achieved in Q3 2012 remained at the same level as in Q2 2012, while an increase of more than 85% was recorded by the Bank in the share of Internet product acquisition in total sales on a year-on-year basis.
Direct and Indirect Customer Acquisition
Citibank at Work
Citibank at Work is responsible for delivering sales services to corporate clients’ employees at their workplace, offering convenience, time saving opportunity and special terms of purchase of the Bank’s products and services.
The Bank’s strategy focused on increasing the wealthy client portfolio has already been effective. In the analyzed period, Citibank at Work acquired a record number of accounts in the CitiForward and Citigold profitable segments (a 160% and a 180% increase quarter-on-quarter in CitiForward and Citigold, respectively). Over 61% of clients opening a bank account decided to purchase another credit product from the Bank, compared to 56% in Q3 2011.
The insurance sales level also rose on a year-on-year basis. In Q3 2012, the average monthly product insurance penetration was 29%, compared to 26% in Q3 2011.

Interim condensed consolidated financial statements of the Capital Group of Bank Handlowy w Warszawie S.A.
for the third quarter 2012
TRANSLATION
30
Direct Sales
At the end of Q3 2012, the direct sales network comprised 22 points of sale, which included stands in shopping centers (16), Wizz Air World MasterCard stands at airports (5) as well as a Citibank LOT credit card stand at the Okęcie Airport in Warsaw. Additionally, the Citibank MasterCard World credit card was sold on selected days in 8 points of sale operated by the Bank’s Partner (a movie theater chain).
The Bank continues to implement projects aimed at development of its points of sale at the major Polish airports. As planned, in mid-July 2012 a stand was launched at the newly opened airport in Modlin, whereas the existing stand located at the Poznań Ławica Airport was replaced with a spacious and clearly visible point of sale, which contributed to a 135% increase in sales compared to Q2 2012.
In order to broaden the scope of its acquisition activities, during the summer the Bank’s credit card was also sold at Stena Line ferry terminals, on its ferries and at the 4th Women's Congress in Warsaw.
3. Branch network
At the end of Q3 2012, the Bank’s branch network comprised 88 branches of the L type (former corporate branches, CitiGold Wealth Management and the Investment Center) and of the M type (former multi-functional branches).
In accordance with the strategic objectives defined for 2012-2015 and a decision of the Bank’s Management Board concerning optimization of the branch network, the following activities were undertaken by the Bank in Q3 2012:
operations of 8 selected branches in Kielce, Koszalin, Piła, Płock, Słupsk, Świdnica, Wałbrzych and Tarnów were discontinued;
the scope of deposit services provided to consumers in the M-type branch located in Płock at ul. Tumska 14 (currently L-type) was extended.
Considering implementation of the Bank’s effectiveness strategy and in order to ensure efficient client services, new cash points were opened in cooperation with Billbird and Brinks. These are located in cities where the Bank’s only branch has been closed. Such efforts allowed the Bank to create a low-cost alternative for the basic Consumer and Corporate Client service. Ultimately, clients will be able to carry out basic financial and non-financial transactions through the cash points. Cash deposits and debt repayment to the Bank have been the first services offered in cooperation with the aforementioned companies.
Number of branches and other points of sale / client contact points
Q3 2012 Q2 2012 Q3 2011 Change QoQ
Change YoY
Number of branches: 88 96 149 (8) (61)
L-type 35 38 42 (3) (7)
M-type 53 58 89 (5) (36)
S-type - - 18 - (18) Other points of sale / client contact points: Points operated by financial intermediaries (Open Finance, Expander and other)
340 340 126 - 214
Airports 6 4 5 2 1 Shopping centers 16 16 19 - (3) Cash points (Billbird and Brinks) 20 12 - 8 20 Own ATMs 114 120 133 (6) (19) “Euronet” ATMs and ADMs with the Citi Handlowy logo
1,015* 1,015 833 - 182
* Figures as of 30 August 2012. As the agreement with Euronet had expired, the Bank’s logo was removed from Euronet ATMs and ADMs in September 2012.

Interim condensed consolidated financial statements of the Capital Group of Bank Handlowy w Warszawie S.A.
for the third quarter 2012
TRANSLATION
31
9 Rating
The Bank is fully rated by international rating agencies: Moody’s Investors Service (“Moody’s”) and Fitch Ratings (“Fitch”). Furthermore, Standard & Poor’s provides a free-of-charge rating service, i.e. unsolicited rating, on the basis of publicly available information.
In the third quarter of 2012, the ratings of the Bank did not change. The latest rating action was taken by Moody’s on 22 June 2012, whereas Fitch confirmed ratings at the same levels on 14 June 2012.
At the end of the third quarter of 2012, Moody’s rated the Bank as follows:
Long-term local currency deposit rating Baa3
Long-term foreign currency deposit rating Baa3
Short-term local currency deposit rating Prime-3
Short-term foreign currency deposit rating Prime-3
Bank’s financial strength rating (BFSR)
Outlook on BFSR
Outlook on long-term and short-term local currency and foreign currency deposit rating
D+
Stable
Stable
At the end of the third quarter of 2012, Fitch rated the Bank as follows:
Long-term Issuer Debt Rating A-
Short-term Issuer Debt Rating F2
Viability rating (VR)* bbb+
Support rating 1
* Viability rating is the view of the intrinsic creditworthiness of an institution, independent of external factors.
The Standard & Poor’s rating (developed on the basis of publicly available information) remained unchanged in the third quarter of 2012 at “BBBpi” (rating confirmed on 13 December 2011).
10 Financial instruments disclosure
The increase of fair value of financial instruments classified as held-for-trading at 30 September 2012 in comparison to the end of 2011 was connected with expected by the Bank changes in economic environment.
The decrease of financial instruments portfolio size classified as available-for-sale (AFS) was influenced by the sale of securities on which in the first three quarters the Bank has realized profit.
Despite persistently high volatility of market factors – including credits spreads - and expectations in decreasing interest rates, their impact on change in fair value of Bank's loans and deposits portfolios can be considered negligible - in relation to the size of the respective portfolios - due to their short term nature and relatively stable quality. The size change of the portfolios mainly resulted from the current activity of the Group customers.
In the 9 month period of 2012 the Group has not made any changes in principles of financial instruments’ classification (presented in the consolidated statement of financial position at fair value) to the separate categories of fair value establishing method used (level I, level II, level III).
In the second period of 2012 the Group has transferred assets available for sale (AFS) from that category valuated basing on significant non-market parameters ( level III) to the category valuated basing on significant market parameters (level II). The movement in the category refers to commercial debt securities and results from the valuation model change included as at 31 December 2011 in the credit risk area, currently calculated basing on market data. The value of assets available for sale, which were transferred amounted PLN 936,570 thousand as at 30 September 2012.
In the 9 month period of 2012 the Group has not made any changes in financial assets classification that may result from asset’s purpose or usage change.

Interim condensed consolidated financial statements of the Capital Group of Bank Handlowy w Warszawie S.A.
for the third quarter 2012
TRANSLATION
32
11 Impairment and provisions
Increases Decreases
PLN ‘000 As at 1 January 2012 Write down
creation Other* Write down
release
Movement of receivables
to write downs
Sale fo receivables/oth
er assets Other*
As at 30 September
2012
Impairment of financial assets
Amounts due from banks 63 674 - (468) - - (4) 265 Amounts due from customers 1,235,789 229,352 1,603 (169,178) (94,371) - (4,043) 1,199,152 1,235,852 230,026 1,603 (169,646) (94,371) - (4,047) 1,199,417 Off balance sheet liabilities reserve
11,474 16,033 - (14,678) - - - 12,829
Total financial assets and off balance sheet liabilities
1,247,326 246,059 1,603 (184,324) (94,371) - (4,047) 1,212,246
Other assets impairment Capital investment 21,575 - - - - - - 21,575 Tangible assets available for sale
2,615 1,014 - - - (2,547) 1,082
Other assets 419 5,969 - (672) (17) - - 5,699 Total other assets 24,609 6,983 - (672) (17) (2,547) - 28,356 Total impairment 1,271,935 253,042 1,603 (184,996) (94,388) (2,547) (4,047) 1,240,602
Other provisions Contentious issues 23,440 6,286 - (6,220) - - (12,813) 10,693 Restructuring - 42,208 - - - - (24,359) 17,849 Total othr provisions 23,440 48,494 - (6,220) - - (37,172) 28,542
*Position “other” mainly covers FX differences and provisions used
Increases Decreases
PLN ‘000 As ar 1 January 2011 Write down
creation Other* Write down
release
Movement of receivables
to write downs
Sale fo receivables/oth
er assets Other*
As at 31 December
2011
Impairment of financial assets
Amounts due from banks 493 1,276 13 (1,719) - - - 63 Amounts due from customers 1,358,921 365,719 8,748 (306,224) (160,792) (30,583) - 1,235,789 1,359,414 366,995 8,761 (307,943) (160,792) (30,583) - 1,235,852 Off balance sheet liabilities reserve
10,538 39,766 - (38,830) - - - 11,474
Total financial assets and off balance sheet liabilities
1,369,952 406,761 8,761 (346,773) (160,792) (30,583) - 1,247,326
Other assets impairment Capital investment 42,515 - - - - (20,940) - 21,575 Tangible assets available for sale
68 2,547 - - - - - 2,615
Other assets 1,355 1,942 - (2,356) (522) - - 419 Total other assets 43,938 4,489 - (2,356) (522) (20,940) - 24,609 Total impairment 1,413,890 411,250 8,761 (349,129) (161,314) (51,523) - 1,271,935
Other provisions Contentious issues 21,702 2,652 - (894) - - (20) 23,440
*Position “other” mainly covers FX differences and provisions used
In the period 1 January - 30 September 2012 and in 2011 the Group has not made any value actualization write downs due to value loss of tangible assets, intangible assets and write downs reversals involving this subject.

Interim condensed consolidated financial statements of the Capital Group of Bank Handlowy w Warszawie S.A.
for the third quarter 2012
TRANSLATION
33
12 Provisions and assets due to differed income tax
PLN ‘000 30.09.2012 31.12.2011 Assets due to differed income tax 898,109 921,989 Provisions due to differed income tax (623,165) (586,668) End of period balance 274,944 335,321
Provisions and assets due to differed income tax are show in the consolidated statement of financial position cumulatively.
13 Purchase and sale transactions of tangible assets
In the period 1 January - 30 September 2012 the value of purchased by the Group components of “fixed assets” equaled PLN 27,593 thousand (in 2011: PLN 55,917 thousand); the value of sold components equals PLN 2,903 thousand ( in 2011: PLN 7,757 thousand).
As at 30 September 2012 the Group does not has significant contract liabilities due to purchase of fixed assets.
14 Default or breach due to received credit agreement in respect of which there were no corrective action until the end of the reporting period
Between 1 January and 30 September 2012 in the Group has been no occurrence of default or breach due to received credit agreement.
15 Seasonality or periodicity of business activity
The business activity of the Group is not significantly influenced by seasonal or cyclical factors.
16 Issue, redemption and repayment of debt and equity securities
Within the Debt Security of the Bank Issue Program, Bank effects the issue of certificates of deposit (‘BPW’), total value of which as at 30 September 2012 was PLN 2,038 thousand (31 December 2011: PLN 25,336 thousand).
PLN ‘000
Type of debt securities issued as at 30 September 2012
Nominal value Issuance date Maturity date
Certificate of deposit 2,035 04.05.2011 30.10.2012
The movement in liabilities due to certificate of deposit issuance (nominal value)
PLN ‘000 01.01 – 30.09.2012
01.01 – 31.12.2011
As at 1 January 25,325 11,529 Increases
issuance - 62,607 Decreases
buyout 22,825 48,811 repurchace before maturity 465 -
Balance as at the end of the period 2,035 25,325
In the third quarter of 2012 the Bank has paid back BPW with nominal value of 20,959 thousand for which the maturity date was 1 August 2012, 31 August 2012, 3 September 2012 and 26 September 2012 and bought back BPW before maturity in total amount of PLN 40 thousand for which the maturity date was 30 October 2012.
Provided that BPW are held until maturity, at redemption the issuer is obliged to pay the principal, guaranteed interest and premium interest.

Interim condensed consolidated financial statements of the Capital Group of Bank Handlowy w Warszawie S.A.
for the third quarter 2012
TRANSLATION
34
17 Paid or declared dividends
Dividends paid
In accordance with General Meeting of Shareholders’ Resolution No 30/2012 of 20 June 2012, 2011 profit has been distributed, the resolution of dividend pay-out was adopted as well as dividend date and pay-out date were determined. From 2011 net profit PLN 360,620,496.00 was assigned for the pay-out, which means the pay-out for a single share was PLN 2.76. The number of shares subjected to dividend equals 130,659,600.
The date of determination the right to dividend was set on 5 July 2012 and the dividend was paid out on 31 August 2012.
18 Major events after the balance sheet date not included in the financial statements
As at 30 September 2012 there were no major events after the balance sheet date not included in the financial statement that could have a significant influence on the net result of the Group.
On 11 October 2012 the Bank’s shares of Bank Rozwoju Cukrownictwa S.A. w likwidacji representing 100% share in Capital and 100% in votes on the Shareholders General Meeting were excluded from the Group’s consolidated statement of financial position. The exclusion were made due to the cancellation of the company from KRS (National Court Registry) as a succession of the liquidation proceeding that has ended. The transfer of the liquidation amount, that is PLN 42,4 million, representing the value of shares in the Group’s consolidated statement of financial position was made in June 2012.
19 Changes in off-balance-sheet commitments
The detailed specification of off-balance-sheet commitments as at 30 September 2012 and changes in comparison with the end of 2011 are as follows:
State as at Change PLN ‘000
30.09.2012 31.12.2011 PLN ‘000 %
Contingent liabilities granted financial 12,528,818 11,358,661 1,170,157 10.3
Import letters of credit issued 106,553 132,833 (26,280) (19.8)Credit lines granted 10,836,171 10,674,678 161,493 1.5Subscription of securities granted to other issuers
1,122,550 551,150 571,400 103.7
Reverse repo transactions with future currency date
463,544 - 463,544 -
guarantees 1,843,526 2,090,982 (247,456) (11.8)Guarantees granted 1,824,297 2,054,187 (229,890) (11.2)Export letters of credit confirmed 5,103 5,385 (282) (5.2)Other 14,126 31,410 (17,284) (55.0)
14,372,344 13,449,643 922,701 6.9
Contingent liabilities received
financial (deposits to receive) 361,131 6,000 355,131 -guarantees (guarantees received) 4,856,111 3,807,088 1,049,023 27.6 5,217,242 3,813,088 1,404,154 36.8
Off-balance transactions (granted/received liabilities)
Current* 4,775,509 4,279,555 495,954 11.6Forward ** 241,369,530 249,925,420 (8,555,890) (3.4)
246,145,039 254,204,975 (8,059,936) (3.2)
*Foreign exchange and securities transactions with current value date ** Derivatives: FX, interest rate transactions and options

Interim condensed consolidated financial statements of the Capital Group of Bank Handlowy w Warszawie S.A.
for the third quarter 2012
TRANSLATION
35
20 Changes in Group’s structure
In the third quarter of 2012 the structure of the Group has not changed as a result of merger, acquisition or disposal of subsidiaries, long-term investments, division, restructuring and discontinuation of activity.
21 Achievement of 2012 forecast results
The Bank, as the dominant entity, did not disclose its forecast results for the year 2012.
22 Information about shareholders
As at the day of publishing the Interim Statement for the third quarter 2012 the list of shareholders who held at least 5% of the total number of votes at the General Meeting or at least 5% of the Bank’s share capital is as follows:
Value of shares
(PLN ‘000)
Number of shares
% shares Number of
votes at GM % votes at GM
Citibank Overseas Investment Corporation, USA 391,979 97,994,700 75.0 97,994,700 75.0 Other Shareholders 130,659 32,664,900 25.0 32,664,900 25.0
522,638 130,659,600 100.0 130,659,600 100.0
In the period between publishing the interim consolidated financial statements for the second quarter 2012 and publishing this report for the third quarter 2012 the structure of major shareholdings has not undergone any changes.
23 Ownership of issuer’s shares by managing and supervising officers
According to the best knowledge of the Bank – the dominant entity, the number of Bank’s shares held by managing and supervising officers is presented below:
Name and surname Function
Number of shares on day of publishing the Interim
Financial Statement for the third quarter 2012
Number of shares on day of publishing the Interim
Financial Statement for the second quarter 2012
Iwona Dudzińska Member of the Managing Board 600 600
Andrzej Olechowski Vice-chairman of Supervisory Board 1,200 1,200
Total 1,800 1,800
Managing and supervising officers have not declared any options for Bank’s shares.
24 Information on pending proceedings
In the third quarter of 2012 there was no single proceeding regarding receivables and liabilities of the Bank or its subsidiary pending in court, public administration authority or an arbitration authority, the value of which would equal at least 10% of Bank’s equity
The total value of all legal proceedings regarding receivables or liabilities, with the participation of the Bank and its subsidiaries, in the third quarter 2012 did not exceed 10% of the Bank’s equity.
In accordance with applicable regulations, the Group recognizes impairment losses for receivables subject to legal proceedings.
In the case of legal proceedings involving the risk of cash outflow due to fulfillment of the obligation created by the Group are adequate reserves.
As at 30 September 2012, the Bank was a party to 33 proceedings regarding derivative transactions: in 24 proceedings it acted as a defendant and in 9 - as a plaintiff. The claims and allegations in the

Interim condensed consolidated financial statements of the Capital Group of Bank Handlowy w Warszawie S.A.
for the third quarter 2012
TRANSLATION
36
individual cases against the Bank are based on various legal bases. The subject of dispute refers mainly to the validity of the derivative transactions and client’s liabilities demanded by the Bank with respect to those derivative transactions as well as potential claims regarding invalidation of such demands by court decisions. Clients try to prevent the Bank from seeking claims resulting from derivative transactions; they question the validity of the agreements, dispute their liabilities towards the Bank and, in some cases, demand payments from the Bank. As at the day of financial statement preparation, in cases regarding term financial operations, two final and positive settlement regarding the derivative transactions proceedings to which the Bank is a party was made in the court, no final settlements were made for other cases.
The Bank is a party to the proceeding initiated by the President of the Office of Competition and Consumer Protection (UOKiK) against the Visa Europay payment system operators and banks - issuers of Visa cards and Europay/ Eurocard/ Mastercard. This procedure applies to practices limiting the competition on payment-cards market in Poland, by consisting in the joint determination of ‘interchange fees’ for transactions made by cards of Visa and Europay / Eurocard / Mastercard as well as limiting the access to market for operators who do not belong to the unions of card issuers and against whom proceedings have been initiated. On 22 April 2010 the Court of Appeal overturned the verdict of the Court of Competition and Consumer Protection (SOKiK), sending the case back to the court of first instance. As at 30 June 2012 no final settlements were made in the court. In accordance with the decision from 8 May 2012, the SOKiK has stopped the proceeding until the final ending of the proceeding taking place in European Union Court regarding MasterCard’s European Commission Decision complainment (Act T 111/08). For the SOKiK decision from 8 May 2012 was made a complainment to the Court of Appeal, which as at 30 June 2012 is awaiting recognition. As at the day of signing the statement no further decisions in the Court of Appeal were made.
In the third quarter 2012 the Group has made a significant settlement of court case. In result of the final settlement the Bank has made a payment for complainer in amount PLN 14.4 million mainly included to previously created provision for disputes.
25 Information about significant transactions with related entities dealt on other than market terms
In the third quarter of 2012, the Bank and its subsidiaries entered into transactions with related entities. All transactions with related entities were dealt on market terms.
26 Information about guarantee agreements
At the end of the third quarter of 2012, the total value of sureties and guarantees given by the Bank or its subsidiaries to a single entity and its subsidiary did not exceed 10% of the Bank’s shareholders’ equity.
27 Factors and events which could affect future financial performance of the Bank’s Capital Group
Although decisive measures taken by the European Central Bank, including implementation of the OMT program, should contribute to partial stabilization of the situation in the financial markets of the eurozone, considerable uncertainty as to the economic growth in Europe and in some emerging markets still prevails. Deterioration of the economic conditions in the eurozone or in China could result in a reduction of the demand for Polish export products, thus expanding the scale of the slowdown in Poland. This could have a negative effect both on the financial performance of businesses and on the situation in the labor market. Uncertainty as to future economic growth may also lead to postponement of investment projects by Polish companies and to limited inflow of direct foreign investments.
Additionally, the economic slowdown in Poland, accompanied by a recession in the eurozone could also suppress the risk appetite of foreign portfolio investors. Any substantial changes in the rate of foreign capital inflow would entail the risk of considerable fluctuations in the PLN exchange rate, thus exerting influence on the financial position of exporters, importers and clients who have incurred debt in foreign currencies.

Interim condensed consolidated financial statements of the Capital Group of Bank Handlowy w Warszawie S.A.
for the third quarter 2012
TRANSLATION
37
Excess liquidity in international financial markets, related to the asset purchase programs launched by central banks with the objective of stimulating economic growth and alleviating anxiety in the financial markets may result in a major increase in raw material prices and continued massive inflation. A potential dynamic price rise could in turn lead to a decrease in real household income and reduced consumption, persuading the Polish Monetary Policy Council to give up the intention to relax its monetary policy and to lift the interest rates at a later time.
The above factors may affect the Group’s performance in the following reporting periods.

Interim condensed consolidated financial statements of the Capital Group of Bank Handlowy w Warszawie S.A.
for the third quarter 2012
TRANSLATION
38
Condensed interim financial statements of the Bank for the third quarter 2012
Condensed income statement
PLN ‘000
Third quarter
period from 01.07.12
to 30.09.12
Third quarter accruals
period from 01.01.12
to 30.09.12
Third quarter
period from01.07.11
to 30.09.11
Third quarter accruals
period from 01.01.11
to 30.09.11Interest and similar income 524,958 1,557,340 478,366 1,391,972Interest expense and similar charges (162,475) (444,693) (129,894) (363,556)
Net interest income 362,483 1,112,647 348,472 1,028,416
Fee and commission income 163,570 494,807 164,551 497,292Fee and commission expense (16,898) (61,714) (21,679) (55,594)
Net fee and commission income 146,672 433,093 142,872 441,698
Dividend income - 38,565 - 26,271Net income on trade financial instruments and revaluation
61,748 279,944 101,782 237,283
Net gain on debt investment securities 97,844 216,912 7,600 18,934 Other operating income 5,934 26,722 6,825 27,175Other operating expenses (14,154) (40,240) (10,267) (28,631)
Net other operating income (8,220) (13,518) (3,442) (1,456)
General administrative expenses (315,769) (1,046,124) (336,489) (1,001,434)Depreciation of fixed and intangible assets (13,328) (42,277) (13,285) (39,048)Profit/(loss) on sale of non-financial assets 6 68 (153) 2,123Result on write-off due to impairment of financial assets and provisions for off-balance sheet liabilities
(21,277) (53,992) (21,168) (75,822)
Profit before tax 310,159 925,318 226,189 636,965Income tax expense (62,828) (180,162) (48,625) (128,194)
Net profit 247,331 745,156 177,564 508,771
Weighted average number of ordinary shares (in pcs) 130,659,600 130,659,600Net earnings per share (in PLN) 5,70 3,89Diluted net earnings per share (in PLN) 5,70 3,89
Condensed statement of comprehensive income
PLN ’000
Third quarter
period from 01.07.12
to 30.09.12
Third quarter accruals
period from 01.01.12
to 30.09.12
Third quarter
period from01.07.11
to 30.09.11
Third quarter accruals
period from 01.01.11
to 30.09.11Net income 247,331 745,156 177,564 508,771Other comprehensive income: Valuation of financial assets available-for-sale (net) 48,805 167,380 (54,798) (34,549)
Total comprehensive income 296,136 912,536 122,766 474,222

Interim condensed consolidated financial statements of the Capital Group of Bank Handlowy w Warszawie S.A.
for the third quarter 2012
TRANSLATION
39
Condensed statement of financial position
State as at 30.09.2012 31.12.2011PLN ’000
ASSETS Cash and balances with the Central Bank 937,529 979,616Amounts due from banks 2,091,439 548,182Financial assets held-for-trading 5,928,388 5,801,713Debt securities available-for-sale 8,717,294 17,625,355Capital investments 263,464 303,626Amounts due from customers 15,286,340 14,049,241Tangible fixed assets 376,048 406,632Intangible assets 1,324,135 1,290,296Income tax assets 256,364 318,015
deferred 256,364 318,015Other assets 226,220 193,676Fixed assets held-for-sale 12,554 25,662
Total assets 35,419,775 41,542,014
LIABILITIES Amounts due to banks 2,182,815 5,543,891Financial liabilities held-for-trading 4,657,620 4,840,447Amounts due to customers 20,958,379 24,130,225Amounts due to debt securities issuance 2,038 25,336Provisions 41,312 34,857Income tax liabilties 31,321 72,919
current 31,321 72,919Other liabilities 638,788 538,752
Total liabilities 28,512,273 35,186,427
EQUITY
Share capital 522,638 522,638Share premium 2,944,585 2,944,585Revaluation reserve 84,895 (82,485)Other reserves 2,610,228 2,249,555Retained earnings 745,156 721,294
Total equity 6,907,502 6,355,587
Total liabilities and equity 35,419,775 41,542,014

Interim condensed consolidated financial statements of the Capital Group of Bank Handlowy w Warszawie S.A.
for the third quarter 2012
TRANSLATION
40
Condensed statement of changes in equity
PLN ’000 Share
capital Share
premium Revaluation
reserve Other
reserves Retained earnings
Total Equity
Balance as at 1 January 2012 522,638 2,944,585 (82,485) 2,249,555 721,294 6,355,587
Total comprehensive income - - 167,380 - 745,156 912,536
Dividends paid - - - - (360,621) (360,621)
Transfer to capital - - - 360,673 (360,673) -
Balance as at 30 September 2012 522,638 2,944,585 84,895 2,610,228 745,156 6,907,502
PLN ’000 Share
capital Share
premium Revaluation
reserve Other
reserves Retained earnings
Total Equity
Balance as at 1 January 2011 522,638 2,944,585 (44,848) 2,251,691 748,026 6,422,092
Total comprehensive income - - (34,549) - 508,771 474,222
Valuation of capital rewards program, including:
- - - (2,789) - (2,789)
valuation change - - - (5,900) - (5,900) deffered income tax - - - 3,111 - 3,111
Dividends paid - - - - (747,373) (747,373) Tramsfer to capital - - - 653 (653) -
Balance as at 30 September 2011 522,638 2,944,585 (79,397) 2,249,555 508,771 6,146,152
PLN ’000 Share
capital Share
premium Revaluation
reserve Other
reserves Retained earnings
Total Equity
Balance as at 1 January 2011 522,638 2,944,585 (44,848) 2,251,691 748,026 6,422,092
Total comprehensive income - - (37,637) - 721,294 683,657
Valuation of capital rewards program, including:
- - - (2,789) - (2,789)
valuation change - - - (5,900) - (5,900) deffered income tax - - - 3,111 - 3,111
Dividends paid - - - - (747,373) (747,373) Transfer to capital - - - 653 (653) -
Balance as at 31 December 2011 522,638 2,944,585 (82,485) 2,249,555 721,294 6,355,587
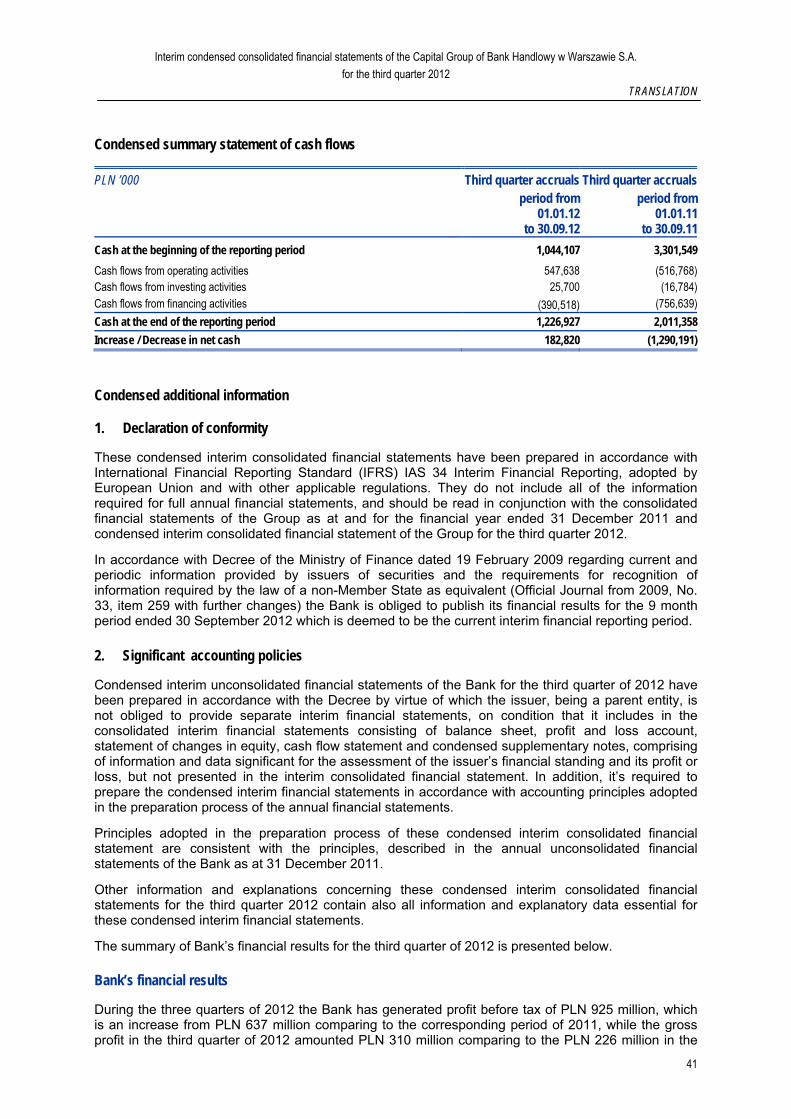
Interim condensed consolidated financial statements of the Capital Group of Bank Handlowy w Warszawie S.A.
for the third quarter 2012
TRANSLATION
41
Condensed summary statement of cash flows
PLN ’000 Third quarter accruals Third quarter accruals
period from
01.01.12to 30.09.12
period from01.01.11
to 30.09.11
Cash at the beginning of the reporting period 1,044,107 3,301,549
Cash flows from operating activities 547,638 (516,768)Cash flows from investing activities 25,700 (16,784)Cash flows from financing activities (390,518) (756,639)
Cash at the end of the reporting period 1,226,927 2,011,358
Increase / Decrease in net cash 182,820 (1,290,191)
Condensed additional information
1. Declaration of conformity
These condensed interim consolidated financial statements have been prepared in accordance with International Financial Reporting Standard (IFRS) IAS 34 Interim Financial Reporting, adopted by European Union and with other applicable regulations. They do not include all of the information required for full annual financial statements, and should be read in conjunction with the consolidated financial statements of the Group as at and for the financial year ended 31 December 2011 and condensed interim consolidated financial statement of the Group for the third quarter 2012.
In accordance with Decree of the Ministry of Finance dated 19 February 2009 regarding current and periodic information provided by issuers of securities and the requirements for recognition of information required by the law of a non-Member State as equivalent (Official Journal from 2009, No. 33, item 259 with further changes) the Bank is obliged to publish its financial results for the 9 month period ended 30 September 2012 which is deemed to be the current interim financial reporting period.
2. Significant accounting policies
Condensed interim unconsolidated financial statements of the Bank for the third quarter of 2012 have been prepared in accordance with the Decree by virtue of which the issuer, being a parent entity, is not obliged to provide separate interim financial statements, on condition that it includes in the consolidated interim financial statements consisting of balance sheet, profit and loss account, statement of changes in equity, cash flow statement and condensed supplementary notes, comprising of information and data significant for the assessment of the issuer’s financial standing and its profit or loss, but not presented in the interim consolidated financial statement. In addition, it’s required to prepare the condensed interim financial statements in accordance with accounting principles adopted in the preparation process of the annual financial statements.
Principles adopted in the preparation process of these condensed interim consolidated financial statement are consistent with the principles, described in the annual unconsolidated financial statements of the Bank as at 31 December 2011.
Other information and explanations concerning these condensed interim consolidated financial statements for the third quarter 2012 contain also all information and explanatory data essential for these condensed interim financial statements.
The summary of Bank’s financial results for the third quarter of 2012 is presented below. Bank’s financial results
During the three quarters of 2012 the Bank has generated profit before tax of PLN 925 million, which is an increase from PLN 637 million comparing to the corresponding period of 2011, while the gross profit in the third quarter of 2012 amounted PLN 310 million comparing to the PLN 226 million in the

Interim condensed consolidated financial statements of the Capital Group of Bank Handlowy w Warszawie S.A.
for the third quarter 2012
TRANSLATION
42
corresponding period of 2011.
The accrued (period from January to September) net profit was PLN 745 million, which is an increase of PLN 236 million comparing to the corresponding period of pervious year, while the net profit in the third quarter was PLN 247 million comparing to the PLN 178 million of net profit in the corresponding period of 2011.
The significant impact on the Bank net profit in the third period had the increase of financial instruments result (trade financial instruments and revaluation, debt securities) by total of PLN 50 million (45.9%), increase in interest and commission income by PLN 18 million (3.6%), decrease of financial result on other operating income and expenses as well as income on sale of non-financial assets by PLN 5 million, decrease in banking activity costs and general administrative costs and depreciation by PLN 21 million (5.9%) and higher income tax burden by PLN 14 million (29.2%).
The consolidated quarter report for the third quarter of 2012 will be available on the website of Bank Handlowy w Warszawie S.A. at www.citihandlowy.pl
Signature of the Vice Director of Signature of the Vice President of Financial Reporting and Control Department Management Board Date and signature Date and signature 05.11.2012 05.11.2012 ........................................................ .. .................................................................