Interferometers - Chemistry | University of Illinois at … · Web viewB. Interferometers (A...
24
Chem 524 Lecture notes (Sect. 7)—2009 PDF version with embedded figures, click here For HTML version form 2005, with linked figures, Click Here IV. Wavelength Discriminators (continued) B. Interferometers (A selection of old notes/handouts can be linked here ) 1. Fabry-Perot (text: Sect. 3-7, Figure 3-56) — multiple passes between partially reflecting surfaces, m large #, fit real device — if paths differ by m — constructive interference -– free spectral range: = /(m+1)~/m = 2d/m 2 = 2 /2d — normal incidence — if beam enters at angle lead to "fringes" , because spacing changes: m = 2d cos when reflected beam differs from straight through path by n/2 get minimum (destructive) or by n (get maximum - constructive), positions of fringes vary as spacing or changes 1
Transcript of Interferometers - Chemistry | University of Illinois at … · Web viewB. Interferometers (A...

Chem 524 Lecture notes (Sect. 7)—2009PDF version with embedded figures, click here
For HTML version form 2005, with linked figures, Click HereIV. Wavelength Discriminators (continued)B. Interferometers (A selection of old notes/handouts can be linked here)
1. Fabry-Perot (text: Sect. 3-7, Figure 3-56)
— multiple passes between partially reflecting surfaces, m large #, fit real device
— if paths differ by m — constructive interference
-– free spectral range: = /(m+1)~/m = 2d/m2 = 2/2d — normal incidence
— if beam enters at angle lead to "fringes" , because spacing changes: m = 2d cos
when reflected beam differs from straight through path by n/2 get minimum (destructive) or by
n (get maximum - constructive), positions of fringes vary as spacing or changes
sharpness of interference depends on reflectivity (coefficient of finesse): CF = /4(1-)2
1

see CF increase as increases, FWHH ~ (CF)-1/2
Resolution can be very high, but need another element to eliminate m+1 and m-1 waves
e.g. at = 400 nm and d = 1 mm, m~5000, so m+1 would separate by ~ 0.08 nm
use: — couple to monochromator, which can sort the m’s enhance resolution to i
— etalon in laser cavity can select mode — narrow output line, multiple ones select
2. Michaelson Interferometer (ref: see Griffiths & DeHaseth Chap 1, and/or Marshall & Verdun
–note our Textbook is a little different, tied to frequency, which is not the issue--emphasis)
encode frequency (,
wave number) by
position x) of moving
mirror,
interference at beam
splitter after
recombining beams
reflected from moving
and fixed mirrors
creates (interferogram)
signal, S(x)
x created by motion of mirrors
if move at constant speed, encode by modulation frequency
interpret: obtain spectrum, B(), by Fourier transform of intensity, S(x) (response) vs. x
2

B() = ∫S(x) cos[4x] dxa. Monochromatic light — interferogram is sine wave x = 0, maximum, both arms
same, in phase, x = /2 again in phase (recall path increase by 2x)
(x) = (0/2){1+cos[2(2x/)]} S(x) = (0/2) cos = 2(2x/) – retardation
note: factor of 2 from half the light being returned to the source
retardation — measure path difference waves: = 2(2x/) = 4 x (units—radians)
if move mirror at constant rate: = dx/dt then interference
modulation frequency will be f = = 2/c = 2modulates signal: e.g. atcm/sec for = 1600 cm-1 f = 1920 Hz
but see lower wavenumber lower mod frequency , encode spectrum
Lab instruments are built to sense the mirror position (x) but the
modulation, f, provides detection efficiency (AC detection, see next section).
Spectra can also be collected by stepping the mirror: x0 x0+x x0+2x etc.
then the detection is “DC”, works well for fast time-dependent processes
spectral response (F.T.): B() = ∫S(x) cos[4x] dx = ∫{(0/2) cos cos[4x] dx
Note: tis is real transform, more general complex: B() = ∫S(x) exp[(4ix] dx
if x went to then B() would be a delta function at 0, the laser wavelength: )
but in a real system the mirror must stop, x is finite and if truncate scan at xmax this
leads to a band/line shape for the spectrum : G() = 4xm sinc(4xm)
3

b. Polychromatic light: interference between wave different frequency leads to envelope that
decays the amplitude of interferogram oscillation with increase inx — reflect spectrum
Two frequencies–get beat pattern – amplitude decrease then increase again (echo)
Broader spectrum, must integrate over all contributions, envelop decays:
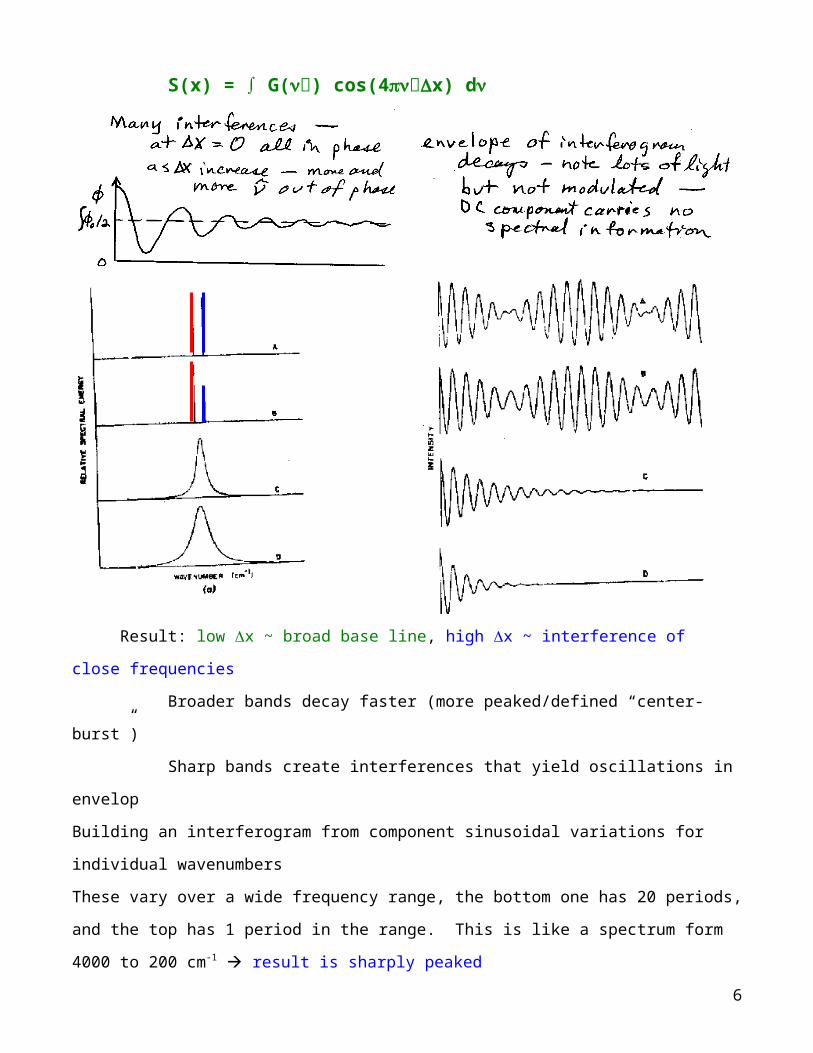
S(x) = ∫ G() cos(4x) d
Result: low x ~ broad base line, high x ~ interference of close frequencies
Broader bands decay faster (more peaked/defined “center-burst”)
Sharp bands create interferences that yield oscillations in envelop
4

Building an interferogram from component sinusoidal variations for individual wavenumbers
These vary over a wide frequency range, the bottom one has 20 periods, and the top has 1
period in the range. This is like a spectrum form 4000 to 200 cm-1 result is sharply peaked
Interferogram shape: Broader band, faster decay, narrower slower (see more large amplitude)5
frequency of oscillation due to the spectral range,
high wavenumber, near IR, faster changes in x, far-IR slower variation
See several big oscillation near centerburst, but oscillation spread, slow vary (900-500cm -1 )
Se faster oscillation, faster decay, less intensity at smaller x values (2200-1200 cm -1 )
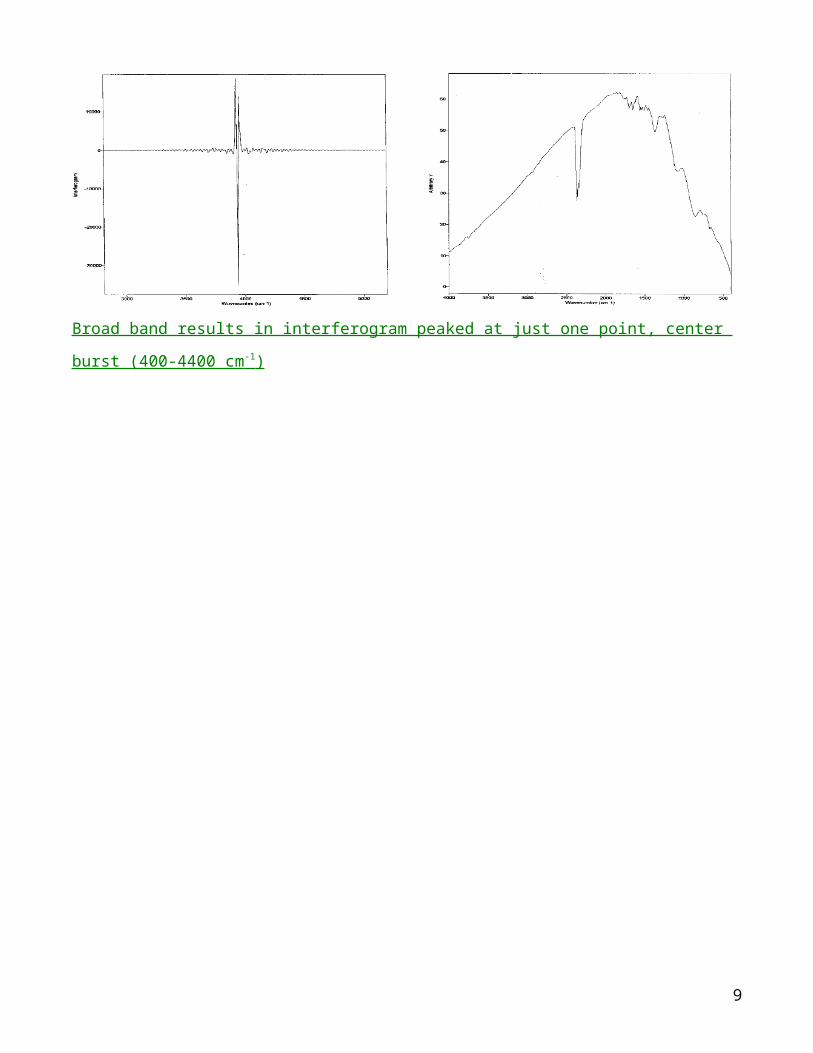
Broad band results in interferogram peaked at just one point, center burst (400-4400 cm -1 )
6

resolution of components controlled by extent of mirror displacement
Finite motion of mirror — limit resolution, gives line after FT a bandshape (see above)
resolution — ideal: = (2xm)-1 -- if xtoo small, then interference
between close lying values does not modulate the interferogram intensity
apodization — modify bandshape by convolving D(x) with S(x), lowers resolution
boxcar (no alteration, just truncation), triangular (linear ramp from x = xm 0),
others (more continuous functions, i.e. basic idea is: D(x) 0 as x xm)
--result is boxcar shape has sidebands (±), triangular makes them positive, but
broaden FWHM, other functions similar, see example
--idea is to minimize contribution at xm, since that will be singularity
c. FT Advantages
Jacquinot — no slit — throughout enhanced, but small aperture high resolution
Fellgett — multiplex — all frequencies simultaneously detected
Connes — frequency accuracy (compare/correct spectra)
Costs: lost 1/2 light back to source at Beam splitter
lack modulation depth (at large x values)–only can transform modulation –
or scanning mirror further has vanishingly small return after some point
7

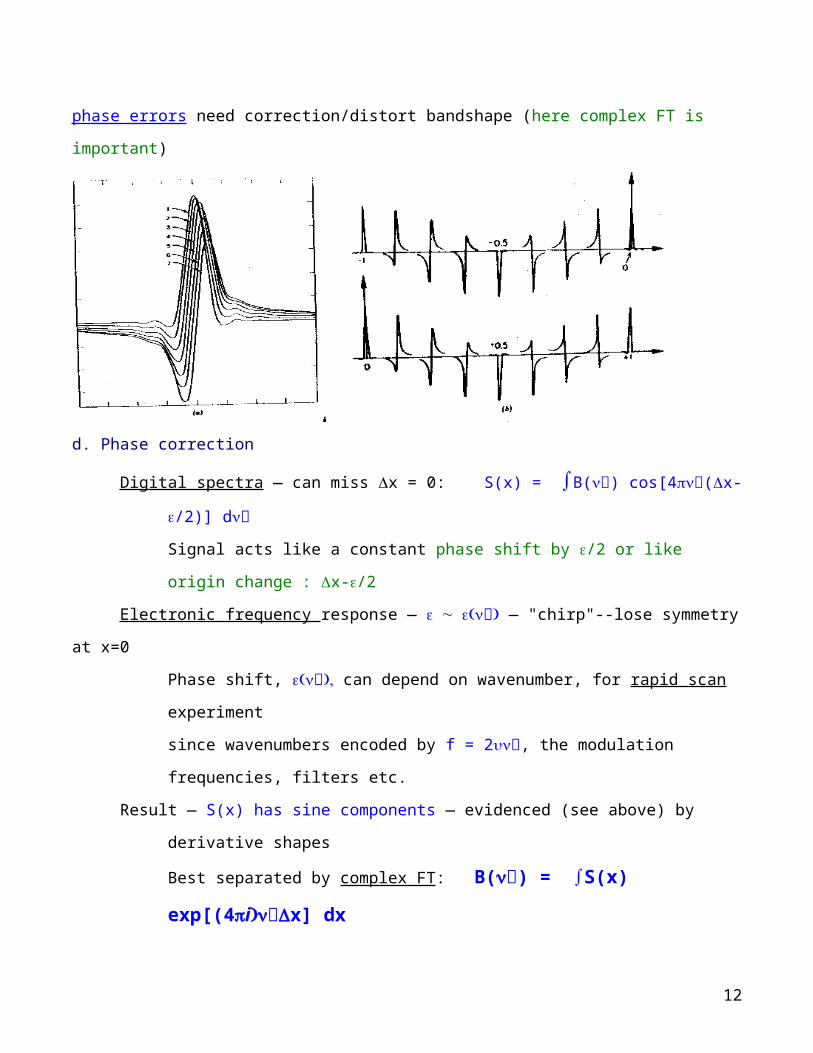
phase errors need correction/distort bandshape (here complex FT is important)
d. Phase correction
Digital spectra — can miss x = 0: S(x) = ∫B() cos[4(x-/2)] d
Signal acts like a constant phase shift by /2 or like origin change : x-/2
Electronic frequency response — — "chirp"--lose symmetry at x=0
Phase shift, can depend on wavenumber, for rapid scan experiment
since wavenumbers encoded by f = 2, the modulation frequencies, filters etc.
Result — S(x) has sine components — evidenced (see above) by derivative shapes
Best separated by complex FT: B() = ∫S(x) exp[(4ix] dxNote S(x) contains the phase error, measurement problem not spectrum, B().
Correct for phase — complex FT derive: Re ~cos( ) and Im ~sin( ) component
Mertz algorithm, determine phase correction: = tan-1 [Im B()/Re B()]
Measure interferogram over small x range (assume varies slowly with )
To carry out the complex FT, measure both sides of centerburst (note impossible in FT NMR)
Results would oversample the centerburst, so use ramp function to correct apodization
Doing properly give better measure of baseline, i.e. broad band parts of spectrum
8
e. Alignment error and Aperture — lower resolution
solid angle accepted: = 22 = 2 -- means resolution limited by
parallelism,
higher resolution need smaller which eventually means smaller aperture
causes — loss modulation at large x (result lost resolution — like apodization)
loss of frequency accuracy: ’ = [1-/4]
mirror align cause loss intensity, resolution high (favor IR applications of FT)
Diverging beams (tilt mirror or poor parallelism) lose intensity high wavenumber,
broaden spectra, and can shift wavenumbers – design in stability, smooth motion
9

Tilt of mirror can cause higher wavenumber part of spectrum to be attenuated
Simple correction (inexpensive designs) use corner-cube mirrors, self correct alignment
f. Indirect measure — need F.T. — computer must be fast, need accurate co-addition of scan
few people can interpret interferogram directly, so processing is vital step, even setup
Design issues (see at right):
Typically move mirror with a voice coil
Control position with a parallel HeNe laser
Separate detector, BeamSplitter
Source must be collected to parallel beam
Detector typically small area, fast focus
Slides follow- borrow from ABB Bomem
10

Dynamic alignment, adjust fixed mirror compensate for moving mirror
Rotation keeps mirrors fixed sliding wedges same corner cubes work most easily
Perkin-Elmer Bomem wishbone (other similar)
g. Survey of Drive systems (handouts)
1. classic 90o interferometer, with laser for tracking motion and “white light”
interferometer to get initial starting position (high frequency, broad sharp center burst)
11
12

2. Bit more modern (20 years ago!) compact design, no white light, 60o interferometer,
HeNe laser interferometer is clear aperture in center of beam splitter
13

3. Genzel spectrometer, uses small beam splitter at focus, has several on a wheel, choose
without opening (vacuum design) Also the mirror is double sided, so motion one way is
opposite for other arm, meaning retardation = 4x, need less motion for same resolution,
laser interferometer is separate, but mechanically coupled to the mirror motion
4. Application of FT-Raman spectrometer, use YAG laser to excite sample, collect scatter light,
parallel detection with FT process, that is advantage, but lose with the detector compared to
CCD and lose as I ~ 4. Result is only real advantage is looking at messy samples where lots
of fluorescence, this allows excitation in IR
14

5. mini spectrometers now a big market issue:
Bruker Alpha, 30 x 22 cm Thermo (Nicolet) S-10, variable sample chambers
Bit bigger yet compact, see inside at: http://www.mb3000ftir.com/html/quicktour.html
Homework—Sect 7 – need to create some questionsReading as described at beginning of section, minimum Chap 1, Griffiths and deHaseth
Look at handouts and links
Discussion: Consider experiments where an interferometer would be a better (or worse—goes
both ways) choice than a monochromator, why?
Problems: Chap 3 # 8, 14, 23, 24,
LinksFabry Perot—
Wikipedia Fabry-Perot tutorial
http://en.wikipedia.org/wiki/Etalon
Drexel laser course on Fabry Perot:
http://repairfaq.ece.drexel.edu/sam/CORD/leot/course10_mod05/mod10-05.html
FTIR oriented sites, Michelson interferometers:15

A variety of FTIR links, including sampling, companies, tutorials etc. from Michael Martin,
Lawrence Berkeley Lab, ALS Beamline for IR work.
http://infrared.als.lbl.gov/FTIRinfo.html
Information about use of synchrotron for IR is here:
http://infrared.als.lbl.gov/viewgraphs/
Univ. Nantes set of instructional pages on Interferometers:
http://www.sciences.univ-nantes.fr/physique/enseignement/english/theoric.html
FTIR companies
Nicolet—Thermo now owns—range of products, emphasis on analytical lab
http://www.thermo.com/com/cda/category/category_lp/1,,234,00.html
Digilab—Varian purchased after BioRad and independence—research emphasis, early
developer:
http://www.varianinc.com/cgi-bin/nav?products/spectr/ftir/index&cid=IIKJLOMMFN
Bruker—German company with wide range of instruments, including high res., time resolved,
microscopy:
http://www.brukeroptics.com/ftir/index.html
ABB-Bomem—Canadian manufacturer owned by ABB, has high res. and small rugged
designs (process)
http://www.abb.com/analytical
MIDAC—compact rugged FTIR
http://www.midac.com/
Jasco—Japanese company with wide range of analytically oriented spectroscopy instrum.,
including FTIR
http://www.jascoinc.com/products/s_ftir_raman.html
Perkin-Elmer – has long history in IR and analytical lab support
http://las.perkinelmer.com/Catalog/default.htm?CategoryID=FTIR+Systems
Many others—see LBL link above for many leading sites
http://infrared.als.lbl.gov/FTIRinfo.html
16