Interference and Diffraction of Lightphylab.yonsei.ac.kr/exp_ref/209_Light_ENG_lite.pdf ·...
7
General Physics Lab Department of PHYSICS YONSEI University Lab Manual (Lite) Interference and Diffraction of Light Ver.20181129 Interference and Diffraction of Light Setup1. Equipment Setup (1) Mount the Linear Stage on the left end of the optics bench Insert the square nut in the center hole of the Linear Stage into the T-slot located along the center of the Optics Bench. Tighten the thumbscrew to secure the Linear Stage in posi- tion. (2) Mount the Rotary Motion Sensor on the Rack of the stage. Insert the Rack into the T-slot on the side of the Rotary Mo- tion Sensor. The teeth on the Rack go through T-slot and then engage the gear that is on the shaft of the Rotary Motion Sensor. Place the Rack with the senor back onto the wide hole of the stage and tighten its thumbscrew. (3) Use the post to fasten the Light Sensor to the aperture. (4) Attach the Light Sensor to the Rotary Motion Sensor. Secure the post of the Light Sensor assembly in the clamp of the Rotary Motion Sensor. Adjust the height of the Light Sensor assembly not to touch the pulley of the Rotary Motion Sensor. NOTICE This LITE version of manual includes only experimental procedures for easier reading on your smartphone. For more information and full instructions of the experiment, see the FULL version of manual. Setup
Transcript of Interference and Diffraction of Lightphylab.yonsei.ac.kr/exp_ref/209_Light_ENG_lite.pdf ·...
General Physics Lab Department of PHYSICS YONSEI University
Lab Manual (Lite)
Interference and Diffraction of Light Ver.20181129
Interference and Diffraction of Light
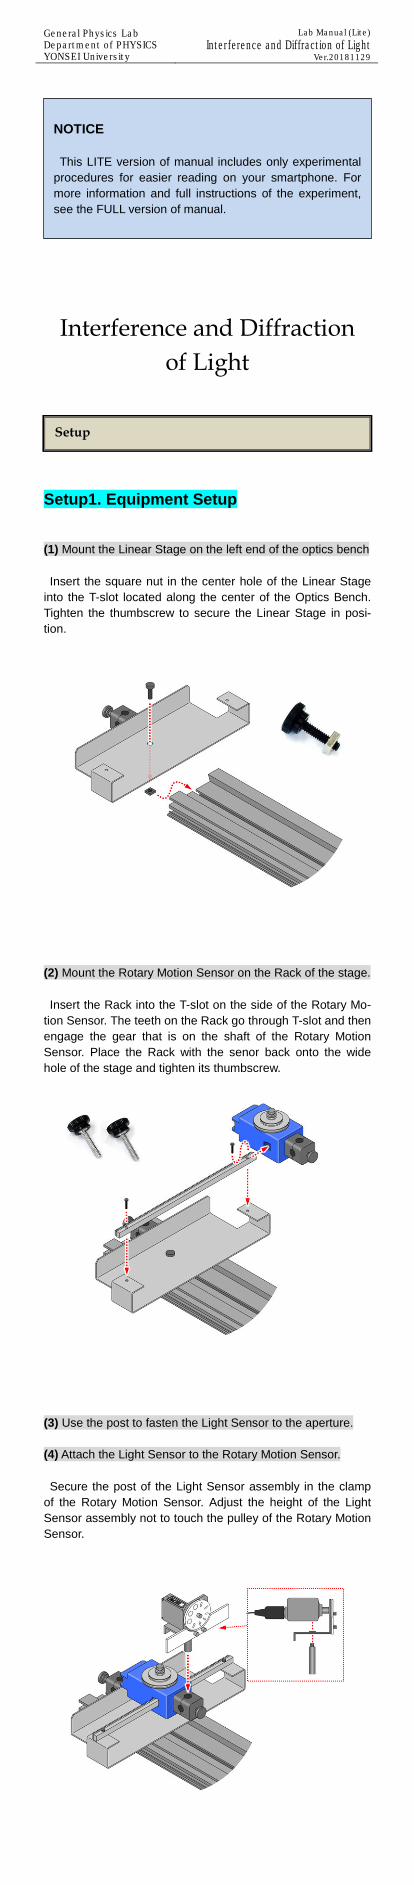
Setup1. Equipment Setup (1) Mount the Linear Stage on the left end of the optics bench Insert the square nut in the center hole of the Linear Stage into the T-slot located along the center of the Optics Bench. Tighten the thumbscrew to secure the Linear Stage in posi-tion.
(2) Mount the Rotary Motion Sensor on the Rack of the stage. Insert the Rack into the T-slot on the side of the Rotary Mo-tion Sensor. The teeth on the Rack go through T-slot and then engage the gear that is on the shaft of the Rotary Motion Sensor. Place the Rack with the senor back onto the wide hole of the stage and tighten its thumbscrew.
(3) Use the post to fasten the Light Sensor to the aperture. (4) Attach the Light Sensor to the Rotary Motion Sensor. Secure the post of the Light Sensor assembly in the clamp of the Rotary Motion Sensor. Adjust the height of the Light Sensor assembly not to touch the pulley of the Rotary Motion Sensor.
NOTICE This LITE version of manual includes only experimental procedures for easier reading on your smartphone. For more information and full instructions of the experiment, see the FULL version of manual.
Setup
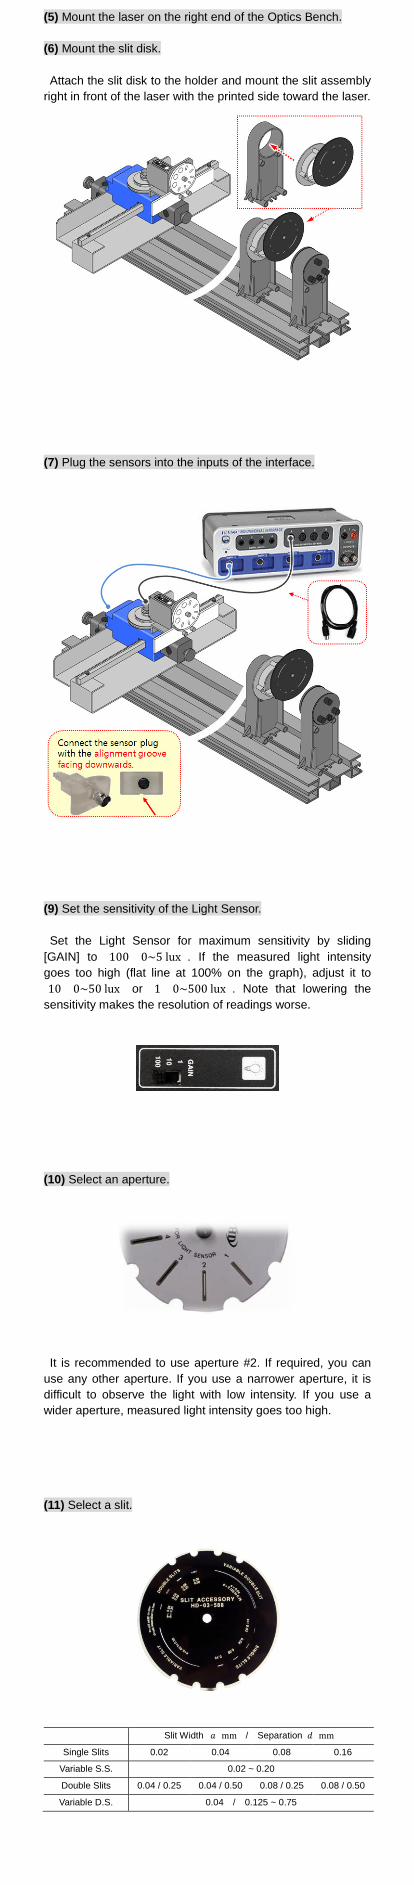
(5) Mount the laser on the right end of the Optics Bench. (6) Mount the slit disk. Attach the slit disk to the holder and mount the slit assembly right in front of the laser with the printed side toward the laser.
(7) Plug the sensors into the inputs of the interface.
(9) Set the sensitivity of the Light Sensor. Set the Light Sensor for maximum sensitivity by sliding [GAIN] to [100] (0~5 lux) . If the measured light intensity goes too high (flat line at 100% on the graph), adjust it to [10] (0~50 lux) or [1] (0~500 lux) . Note that lowering the sensitivity makes the resolution of readings worse.
(10) Select an aperture.
It is recommended to use aperture #2. If required, you can
use any other aperture. If you use a narrower aperture, it is difficult to observe the light with low intensity. If you use a wider aperture, measured light intensity goes too high. (11) Select a slit.
Slit Width 𝑎𝑎 (mm) / Separation 𝑑𝑑 (mm)
Single Slits 0.02 0.04 0.08 0.16
Variable S.S. 0.02 ~ 0.20
Double Slits 0.04 / 0.25 0.04 / 0.50 0.08 / 0.25 0.08 / 0.50
Variable D.S. 0.04 / 0.125 ~ 0.75
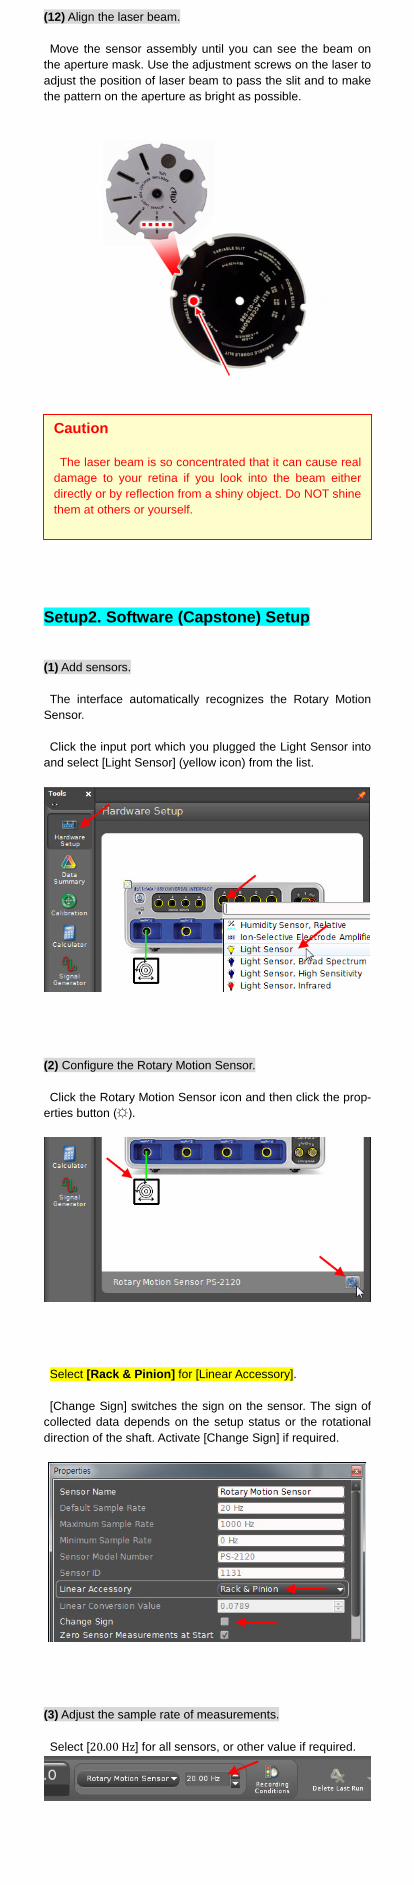
(12) Align the laser beam. Move the sensor assembly until you can see the beam on the aperture mask. Use the adjustment screws on the laser to adjust the position of laser beam to pass the slit and to make the pattern on the aperture as bright as possible.
Setup2. Software (Capstone) Setup (1) Add sensors. The interface automatically recognizes the Rotary Motion Sensor. Click the input port which you plugged the Light Sensor into
and select [Light Sensor] (yellow icon) from the list.
(2) Configure the Rotary Motion Sensor. Click the Rotary Motion Sensor icon and then click the prop-erties button (☼).
Select [Rack & Pinion] for [Linear Accessory]. [Change Sign] switches the sign on the sensor. The sign of
collected data depends on the setup status or the rotational direction of the shaft. Activate [Change Sign] if required.
(3) Adjust the sample rate of measurements. Select [20.00 Hz] for all sensors, or other value if required.
Caution The laser beam is so concentrated that it can cause real damage to your retina if you look into the beam either directly or by reflection from a shiny object. Do NOT shine them at others or yourself.
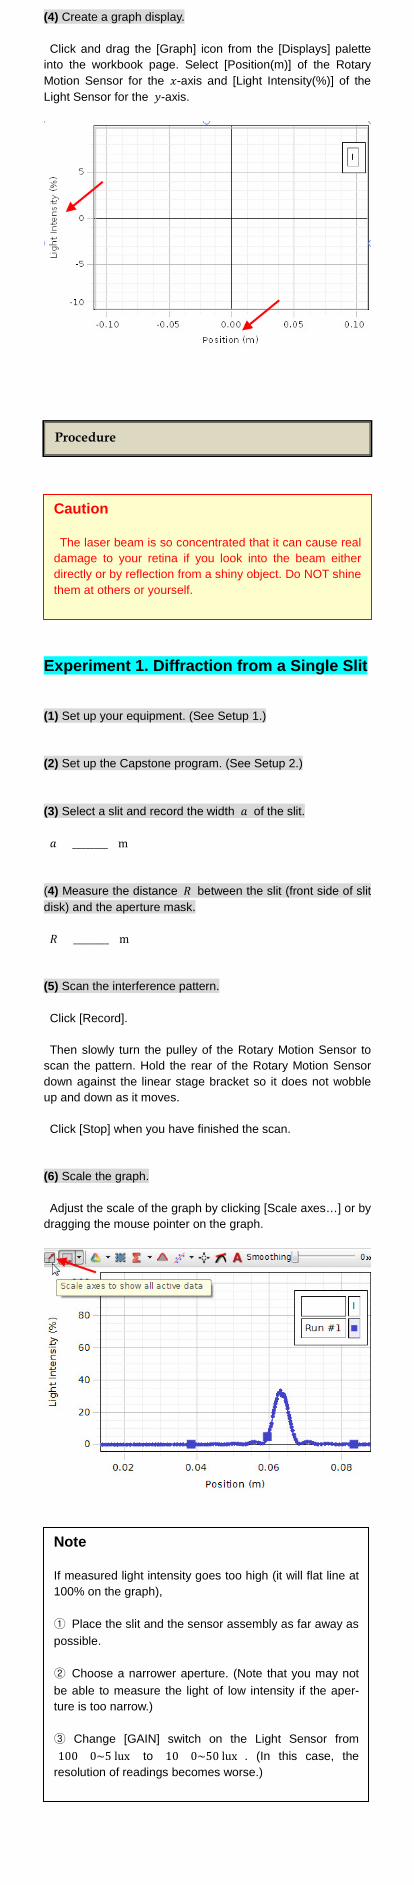
(4) Create a graph display. Click and drag the [Graph] icon from the [Displays] palette
into the workbook page. Select [Position(m)] of the Rotary Motion Sensor for the 𝑥𝑥-axis and [Light Intensity(%)] of the Light Sensor for the 𝑦𝑦-axis.
Experiment 1. Diffraction from a Single Slit (1) Set up your equipment. (See Setup 1.) (2) Set up the Capstone program. (See Setup 2.) (3) Select a slit and record the width 𝑎𝑎 of the slit. 𝑎𝑎 = ________ (m) (4) Measure the distance 𝑅𝑅 between the slit (front side of slit disk) and the aperture mask. 𝑅𝑅 = ________ (m) (5) Scan the interference pattern. Click [Record]. Then slowly turn the pulley of the Rotary Motion Sensor to
scan the pattern. Hold the rear of the Rotary Motion Sensor down against the linear stage bracket so it does not wobble up and down as it moves. Click [Stop] when you have finished the scan.
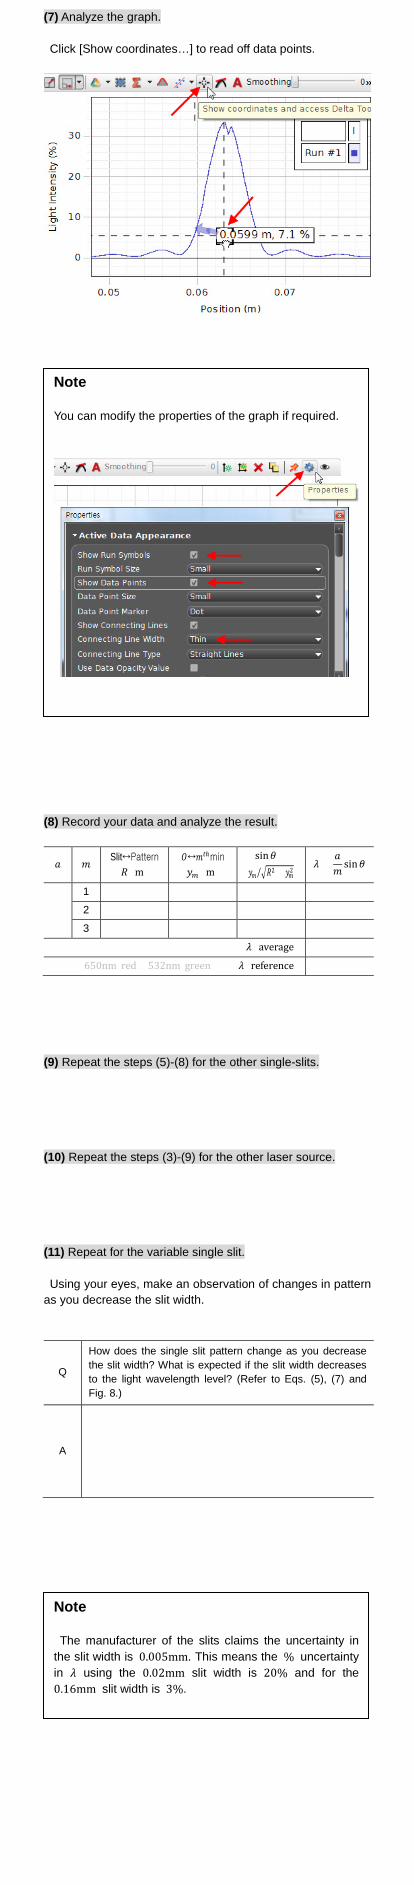
(6) Scale the graph. Adjust the scale of the graph by clicking [Scale axes…] or by dragging the mouse pointer on the graph.
Procedure
Caution The laser beam is so concentrated that it can cause real damage to your retina if you look into the beam either directly or by reflection from a shiny object. Do NOT shine them at others or yourself.
Note If measured light intensity goes too high (it will flat line at 100% on the graph), ① Place the slit and the sensor assembly as far away as possible. ② Choose a narrower aperture. (Note that you may not be able to measure the light of low intensity if the aper-ture is too narrow.) ③ Change [GAIN] switch on the Light Sensor from [100] (0~5 lux) to [10] (0~50 lux) . (In this case, the resolution of readings becomes worse.)
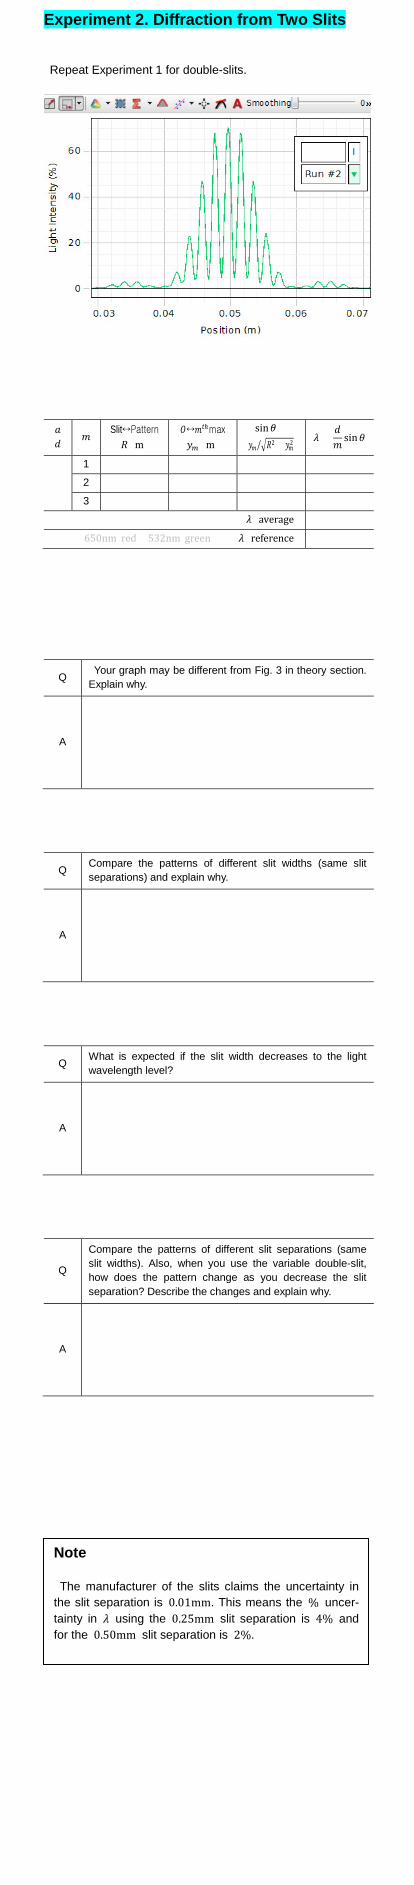
(7) Analyze the graph. Click [Show coordinates…] to read off data points.
(8) Record your data and analyze the result.
𝑎𝑎 𝑚𝑚 Slit↔Pattern 𝑅𝑅 (m)
𝑂𝑂↔𝑚𝑚𝑡𝑡ℎmin 𝑦𝑦𝑚𝑚 (m)
sin𝜃𝜃 = 𝑦𝑦𝑚𝑚 �𝑅𝑅2 + 𝑦𝑦𝑚𝑚2⁄
𝜆𝜆 =𝑎𝑎𝑚𝑚
sin𝜃𝜃
1
2
3
𝜆𝜆 (average)
650nm(red) 532nm(green) 𝜆𝜆 (reference)
(9) Repeat the steps (5)-(8) for the other single-slits. (10) Repeat the steps (3)-(9) for the other laser source. (11) Repeat for the variable single slit. Using your eyes, make an observation of changes in pattern as you decrease the slit width.
Q
How does the single slit pattern change as you decrease the slit width? What is expected if the slit width decreases to the light wavelength level? (Refer to Eqs. (5), (7) and Fig. 8.)
A
Note You can modify the properties of the graph if required.
Note The manufacturer of the slits claims the uncertainty in
the slit width is 0.005mm. This means the % uncertainty in 𝜆𝜆 using the 0.02mm slit width is 20% and for the 0.16mm slit width is 3%.
Experiment 2. Diffraction from Two Slits Repeat Experiment 1 for double-slits.
𝑎𝑎 𝑑𝑑
𝑚𝑚 Slit↔Pattern 𝑅𝑅 (m)
𝑂𝑂↔𝑚𝑚𝑡𝑡ℎmax 𝑦𝑦𝑚𝑚 (m)
sin𝜃𝜃 = 𝑦𝑦𝑚𝑚 �𝑅𝑅2 + 𝑦𝑦𝑚𝑚2⁄ 𝜆𝜆 =
𝑑𝑑𝑚𝑚
sin𝜃𝜃
1
2
3
𝜆𝜆 (average)
650nm(red) 532nm(green) 𝜆𝜆 (reference)
Q Your graph may be different from Fig. 3 in theory section. Explain why.
A
Q Compare the patterns of different slit widths (same slit separations) and explain why.
A
Q What is expected if the slit width decreases to the light wavelength level?
A
Q
Compare the patterns of different slit separations (same slit widths). Also, when you use the variable double-slit, how does the pattern change as you decrease the slit separation? Describe the changes and explain why.
A
Note The manufacturer of the slits claims the uncertainty in
the slit separation is 0.01mm. This means the % uncer-tainty in 𝜆𝜆 using the 0.25mm slit separation is 4% and for the 0.50mm slit separation is 2%.
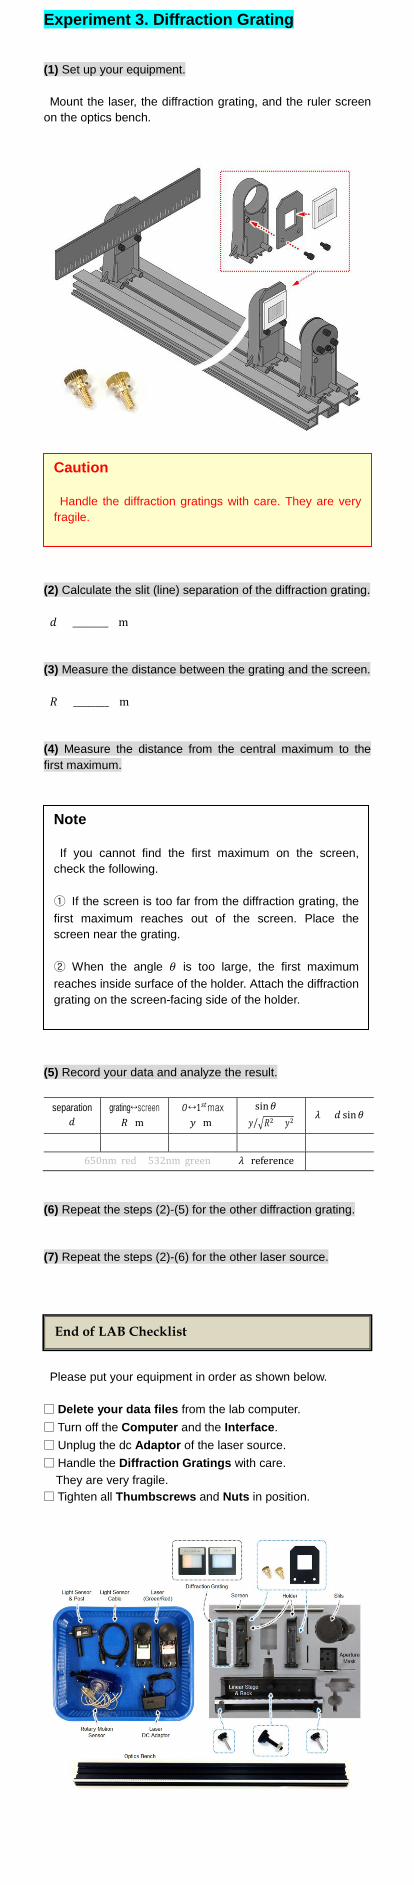
Experiment 3. Diffraction Grating (1) Set up your equipment. Mount the laser, the diffraction grating, and the ruler screen on the optics bench.
(2) Calculate the slit (line) separation of the diffraction grating. 𝑑𝑑 = ________ (m) (3) Measure the distance between the grating and the screen. 𝑅𝑅 = ________ (m) (4) Measure the distance from the central maximum to the first maximum.
(5) Record your data and analyze the result.
separation 𝑑𝑑
grating↔screen 𝑅𝑅 (m)
𝑂𝑂↔1𝑠𝑠𝑡𝑡max 𝑦𝑦 (m)
sin𝜃𝜃 = 𝑦𝑦 �𝑅𝑅2 + 𝑦𝑦2⁄
𝜆𝜆 = 𝑑𝑑 sin𝜃𝜃
650nm(red) 532nm(green) 𝜆𝜆 (reference)
(6) Repeat the steps (2)-(5) for the other diffraction grating. (7) Repeat the steps (2)-(6) for the other laser source.
Please put your equipment in order as shown below.
□ Delete your data files from the lab computer. □ Turn off the Computer and the Interface. □ Unplug the dc Adaptor of the laser source. □ Handle the Diffraction Gratings with care. They are very fragile. □ Tighten all Thumbscrews and Nuts in position.
Caution Handle the diffraction gratings with care. They are very fragile.
Note If you cannot find the first maximum on the screen, check the following. ① If the screen is too far from the diffraction grating, the first maximum reaches out of the screen. Place the screen near the grating. ② When the angle 𝜃𝜃 is too large, the first maximum reaches inside surface of the holder. Attach the diffraction grating on the screen-facing side of the holder.
End of LAB Checklist