Interdendritic Strain and Macrosegregation-Coupled ... Strain and... · Interdendritic Strain and...
22
Interdendritic Strain and Macrosegregation-Coupled Phenomena for Interdendritic Crack Formation in Direct-Chill Cast Sheet Ingots MOSTAFA OMAR EL-BEALY In a study of the early stages of dendritic solidification in the direct-chill cast sheet ingots, the coupled effect of interdendritic strain and macrosegregation on the interdendritic cracks for- mation in dendritic equiaxed structure has been investigated by the metallographic study of ingot samples and by performing a set of mathematical analyses for AA-6061 and AA-1050 aluminum alloys. The metallographic investigation contains microstructure examinations and macrosegregation measurements of collected samples from plant trials. The mathematical analysis consists of a two-dimensional (2-D) fluid flow, heat flow, interdendritic strain, and macrosegregation-coupled model. Also, a simple approach to measure interdendritic crack has been developed based on the accumulative interdendritic strain criterion, local dendritic phases, and the crystal distortion correlation factor resulting from steep positive local segregation. The model predications have clarified the effect of high positive macrosegregation on the surface and subsurface interdendritic crack formation. It has been revealed that interdendritic strain starts to generate just below the liquidus temperature, resulting from shrinkage of liquidfisolid phase transformation and contraction of dendritic solid in the incoherent mushy region. In this region, the coupled effect of the shrinkage/contraction mechanism increases the interdendritic distances between equiaxed crystals and the interdendritic crack begins to nucleate. Subsequently, in the coherent mushy region, the different interdendritic strain sources start to affect significantly the distances between equiaxed crystals in a diverse way, and therefore, the final morphology of interdendritic crack begins to form. The mechanism of interdendritic crack formation during dendritic equiaxed structure solidification and the possible solutions to this problem are discussed. DOI: 10.1007/s11663-011-9616-0 Ó The Minerals, Metals & Materials Society and ASM International 2011 I. INTRODUCTION INTERDENDRITIC crack formation during den- dritic solidification is a problem that has plagued the ferrous and nonferrous casting industries for last several decades. Although this defect in the case of an equiaxed crystal structure is intermittent and affects less than the susceptible columnar crystal structure, the problem persists and is expensive. Because the slab has surface or subsurface interdendritic cracks in the direct-chill casting process, it must be scrapped where it affects the structure morphology, mechanical properties, and there- fore, the stability of hot rolling of sheet ingots. Much effort has been made to understand the mechanism of interdendritic crack formation and several theories have been proposed in the literature. [1–8] Generally, it is believed that interdendritic crack starts to develop in the mushy zone when it is definitely coherent, but contin- uous films of interdendritic liquid still exit and tensile strain is sufficient. [1–3] Also, most interdendritic crack criteria simply consider the size of the solidification interval, stating that the solidification range is associ- ated with more interdendritic cracking susceptibility than a short range. [4,5] Pellini [3] stated that an interdendritic crack will occur if the material is subjected to high accumulated strain within the so-called vulnerable part of the solidification interval. Campbell, [1] Kinoshita et al., [6] and Guven and Hunt [7] emphasized the role of tensile stresses in the forming of interdendritic cracks. Clyne and Davies [8] formulated a more refined criteria based on the time spent in different regimes of the solidification interval. They defined a vulnerable region of the solidification interval where thermal strains are induced, the film cannot sustain the stresses, and an interdendritic crack forms. Feurer [9] focused on the pressure of the inter- dendritic liquid present between the dendrites and argued that an interdendritic crack will nucleate as a pore if the liquid no longer can fill the intergranular openings caused by the solidification shrinkage. Rappaz and co-workers [10,11] extended this approach to take into account the feeding associated with the tensile defor- mation of the solidified alloy in the direction trans- versal to the columnar dendritic growth. The reader is referred to Sigworth [12] for a more detailed review on work related to an interdendritic crack. El-Bealy and MOSTAFA OMAR EL-BEALY, Chair Professor of Materials Processing and Technology, is with Companies’ Chair of Swedish Iron Masters Association, S-100 44 Stockholm, Sweden. Contact email: [email protected] Manuscript submitted August 29, 2011. Article published online December 21, 2011. METALLURGICAL AND MATERIALS TRANSACTIONS B VOLUME 43B, JUNE 2012—635
Transcript of Interdendritic Strain and Macrosegregation-Coupled ... Strain and... · Interdendritic Strain and...

Interdendritic Strain and Macrosegregation-CoupledPhenomena for Interdendritic Crack Formationin Direct-Chill Cast Sheet Ingots
MOSTAFA OMAR EL-BEALY
In a study of the early stages of dendritic solidification in the direct-chill cast sheet ingots, thecoupled effect of interdendritic strain and macrosegregation on the interdendritic cracks for-mation in dendritic equiaxed structure has been investigated by the metallographic study ofingot samples and by performing a set of mathematical analyses for AA-6061 and AA-1050aluminum alloys. The metallographic investigation contains microstructure examinations andmacrosegregation measurements of collected samples from plant trials. The mathematicalanalysis consists of a two-dimensional (2-D) fluid flow, heat flow, interdendritic strain, andmacrosegregation-coupled model. Also, a simple approach to measure interdendritic crack hasbeen developed based on the accumulative interdendritic strain criterion, local dendritic phases,and the crystal distortion correlation factor resulting from steep positive local segregation. Themodel predications have clarified the effect of high positive macrosegregation on the surface andsubsurface interdendritic crack formation. It has been revealed that interdendritic strain startsto generate just below the liquidus temperature, resulting from shrinkage of liquidfisolid phasetransformation and contraction of dendritic solid in the incoherent mushy region. In this region,the coupled effect of the shrinkage/contraction mechanism increases the interdendritic distancesbetween equiaxed crystals and the interdendritic crack begins to nucleate. Subsequently, in thecoherent mushy region, the different interdendritic strain sources start to affect significantly thedistances between equiaxed crystals in a diverse way, and therefore, the final morphology ofinterdendritic crack begins to form. The mechanism of interdendritic crack formation duringdendritic equiaxed structure solidification and the possible solutions to this problem arediscussed.
DOI: 10.1007/s11663-011-9616-0� The Minerals, Metals & Materials Society and ASM International 2011
I. INTRODUCTION
INTERDENDRITIC crack formation during den-dritic solidification is a problem that has plagued theferrous and nonferrous casting industries for last severaldecades. Although this defect in the case of an equiaxedcrystal structure is intermittent and affects less than thesusceptible columnar crystal structure, the problempersists and is expensive. Because the slab has surfaceor subsurface interdendritic cracks in the direct-chillcasting process, it must be scrapped where it affects thestructure morphology, mechanical properties, and there-fore, the stability of hot rolling of sheet ingots. Mucheffort has been made to understand the mechanism ofinterdendritic crack formation and several theories havebeen proposed in the literature.[1–8] Generally, it isbelieved that interdendritic crack starts to develop in themushy zone when it is definitely coherent, but contin-uous films of interdendritic liquid still exit and tensilestrain is sufficient.[1–3] Also, most interdendritic crack
criteria simply consider the size of the solidificationinterval, stating that the solidification range is associ-ated with more interdendritic cracking susceptibilitythan a short range.[4,5]
Pellini[3] stated that an interdendritic crack will occurif the material is subjected to high accumulated strainwithin the so-called vulnerable part of the solidificationinterval. Campbell,[1] Kinoshita et al.,[6] and Guven andHunt[7] emphasized the role of tensile stresses in theforming of interdendritic cracks. Clyne and Davies[8]
formulated a more refined criteria based on the timespent in different regimes of the solidification interval.They defined a vulnerable region of the solidificationinterval where thermal strains are induced, the filmcannot sustain the stresses, and an interdendritic crackforms. Feurer[9] focused on the pressure of the inter-dendritic liquid present between the dendrites andargued that an interdendritic crack will nucleate as apore if the liquid no longer can fill the intergranularopenings caused by the solidification shrinkage. Rappazand co-workers[10,11] extended this approach to take intoaccount the feeding associated with the tensile defor-mation of the solidified alloy in the direction trans-versal to the columnar dendritic growth. The reader isreferred to Sigworth[12] for a more detailed review onwork related to an interdendritic crack. El-Bealy and
MOSTAFA OMAR EL-BEALY, Chair Professor of MaterialsProcessing and Technology, is with Companies’ Chair of Swedish IronMasters Association, S-100 44 Stockholm, Sweden. Contact email:[email protected]
Manuscript submitted August 29, 2011.Article published online December 21, 2011.
METALLURGICAL AND MATERIALS TRANSACTIONS B VOLUME 43B, JUNE 2012—635

Thomas[13] proposed a new criterion to define the distancebetween the dendrites as a result of the accumulatedinterdendritic strain generated in the coherent mushyregion. Recently, El-Bealy[14] extended and proposed anapproach to explain the mechanism of interdendriticcrack formation and the effect of interdendritic strain andthe steep macrosegregation on this type of crack exper-imentally and theoretically. He defined accurately themechanism of interdendritic crack formation that initi-ates during solidification of an alloy within the certainregion called the interdendritic coherent region in themushy zone.[14,15] In this region, the effect of differentsources of interdendritic strain is sufficient and affectsthe macrosegregation level. This results in a steepreduction in the solidus temperature and long coherentmushy region (or the long actual solidification time).This means that a high accumulated strain, which issubjected to dendritic structure and interdendritic crack,occurs but that the effect of shrinkage and contraction,as well as the mechanism of diffusion in dendritic solidin the region just below the liquidus temperature, is notwell understood.[14,15]
Furthermore, experimental studies of interdendriticcracking phenomena during the direct-chill castingprocess have established the effect of various processparameters. In addition to casting speed[2] parameterssuch as cast structure,[16] grain refinement,[17] type ofalloy,[18] and mold characteristics,[19] the shape andwater cooling homogeneity are also known to have aneffect on the solidification behavior, heat flow, inter-dendritic strain generation, macrosegregation level, andtherefore, the interdendritic crack tendency.[20,21]
Recent two-phase models[22] attempt to quantify theinteractions between liquid feeding and thermallyinduced deformation in the mushy zone. The otherimportant mechanism is thermally induced mushydendrite deformation or crystal distortion caused bynonuniform mold cooling conditions and the steepchange in macrosegregation level in the different mushyregions (as shown in Figures 1(a) and (b)).[15,23,24] Thisleads to modeling this phenomenon by using differentquantities based on the interdendritic strain criteria,local dendritic phases, and crystal distortion correlationfactor.[13–15]
Therefore, the purpose of the current work is toidentify, by a comparison between experimental obser-vations and computer simulations, a critical conditionwhose variation could best explain the observed trendsin the surface and subsurface interdendritic cracks inthe equiaxed crystal structure and its macrosegregationin direct chill cast sheet ingots. For this purpose, aseries of real-scale casting plant trials was carried out.The experimental work including microexaminations,grain size, crystal distortion measurements, and amacrosegregation analysis are presented in Section II,whereas the experimental results are demonstrated inSection III. The model formulation with boundary aswell as cooling conditions, numerical algorithm, andmaterials properties are described in Sections IV, V,and VI, respectively. Furthermore, the metallurgicalmeasurements and observations were accompanied bynumerical simulations using a mathematical model in
Section VII. In Section VIII, the quantities usuallyassociated with interdendritic cracks, such as solidifi-cation behaviors or metallurgical phenomena, and theireffect on the various strains generation with theexperimental results are discussed with the differentsolutions for this problem.
II. PLANT TRIALS AND METALLURGICALSTUDY
A. Plant Trials
The industrial trials were carried out during twocasting heats with a 125 9 425-mm rectangular sectionand 235-cm-long sheet ingots. The first heat was madefor AA-6061, and the second was made for AA-1050aluminum alloys. The compositions of aluminum alloysare summarized in Table I. The simulated DC caster is
Fig. 1—Photomicrographs of (a) plastic deformed dendritic structureof Fe-0.53 pct C alloy[15] with 50 times magnification and (b) distor-tion dendritic structure of Al- 0.8 pct Mg alloy with 400 times mag-nification.[23]
Table I. Composition of the Slab Samples
Al-Alloy Si Fe Cu Mn Mg Zn Ti Others
AA6061 0.4 0.7 0.15 0.15 0.8 0.05 — —AA1050 0.25 0.4 0.05 0.05 0.05 0.05 0.03 0.03
636—VOLUME 43B, JUNE 2012 METALLURGICAL AND MATERIALS TRANSACTIONS B

based on an actual industrial casting machine in use atEgyptian Copper Works (Hagar El-Nawatia, Alexan-dria, Egypt). The geometric detail of the DC caster isshown in Figure 2, whereas the slab operating condi-tions are presented in Table II.
Slices for this study were cut from the broad face ofingots as shown inFigure 3(a). Transverse slices of as-castingots were used for macrosegregation analysis and fordetermining the grain size, whereas the middle slices wereused for studying the effect of mechanical interdendriticstrain resulting from the metallostatic head on themacrosegregation distributions. The segregation mea-surements of the transverse slice are used to verify themodel, whereas the segregation measurements of themiddle slice are used to study precisely the effect ofthe different levels of surface and subsurface macrosegre-gation phenomena on the interdendritic crack formation
and itsmorphology. The dimensions of the collected sliceswere 115 9 10 9 10 mm and 125 9 150 9 50 mm, asshown in Figure 3(b), for transverse and middle slices,respectively.
B. Metallurgical Study and Measurements
This section presents the sample preparation formetallographic study and grain size measurements aswell as macrosegregation analysis. To inspect thesubsurface structure in the vicinity of ingot surfaceand interdendritic cracks at interdendritic boundaries ofequiaxed structure, transverse and middle slices were cutinto small samples based on the cutting principles takenfrom References 23 through 25, as shown in Figure 3(b).The dimensions of the samples were 10 9 10 9 5 mmfor microexaminations and 50 9 50 9 25 mm and10 9 10 9 25 mm for segregation analysis as shown inFigure 3(b) of transverse and middle slices, respectively.The sample surfaces taken from slices were machinedflat, ground, and polished. Then, the aluminum alloyswere etched in Kellers reagent (1 pct HF-1.5 pct HCl-2.5 pct HNO3-95 pct H2O) for approximately 30 sec-onds to reveal the dendritic solidification structure.[26,27]
In addition, the surrounding areas of the equiaxedcrystals in the subsurface structure of cutting samplesfrom a horizontal cross section was investigated toclarify the mechanism of high positive segregation andits effect on the interdendritic crack formation. Thesamples then were examined under a microscope, andmicrographs were taken at different magnifications of100, 200, and 400 times. The characteristics of interden-dritic crack at different locations, grain sizes, andmacrosegregation distributions were studied and mea-sured from the micrographs.Furthermore, the grain size measurements of different
slices were carried out on the longitudinal section asshown in Figures 3(a) and (b). The section then wasexamined under a microscope, and micrographs weretaken at a magnification of 400 times only within thefirst 10 mm from copper chill. The grain size wasmeasured from the micrographs by using the standardmethods illustrated in References 26 through 29.Because of the effect of a local steep macrosegregationon the multisolidification behavior associated withequiaxed dendritic crystals,[30] this results in an incon-sistent dendritic growth around the envelopes of equi-axed crystals. Therefore, it was proposed to calculate thecrystal distortion correlation factor Fc only for the
Casting direction
Bottom block
Solid
Mushy
Copper mold
Water channel
Water cooling
Fresh liquid metal
Slab
Mold inlet
Fig. 2—Schematic representation of DC casting of an aluminumsheet ingot.
Table II. Operating Conditions of the Slab Samples
Operating Conditions AA-6061 AA-1050
Mold size, mm 125 9 425 9 700 to 900 125 9 425 9 700 to 900Mold length, mm 200 200Mold material copper copperMold lubricant graphite graphiteMold water pressure bar 4 4Secondary water cooling Liquid water pool liquid water poolCasting speed mm/s 1.96 3.92Pouring temperature, K (�C) 935 (662) 952 (678.5)
METALLURGICAL AND MATERIALS TRANSACTIONS B VOLUME 43B, JUNE 2012—637

middle slice samples.[23] The template to measure thenumber of grain intercepts was applied randomly tothe test region five successive times as illustrated inFigure 3(a). From the count obtained during eachapplication, a mean and standard deviation was calcu-lated according to Eqs. [1] and [2].[29]
�X ¼P
Xi
n½1�
r ¼P
Xi � �Xð Þ2
n� 1
" #12
½2�
where it was considered that the crystal distortion cor-relation factor Fc can be calculated as follows:
Fc ¼r�x� 100 ½3�
Also, the segregation of elements in surface andsubsurface areas within 10 mm from the ingot surfacehas been determined by using spectrometry. The corre-sponding spectroscopic sample has a surface area of5 9 5 mm and extends at ±1 mm out and in the ingotsurface as shown in Figures 3(a) and (b). Sixteenspectroscopic spots are analyzed on each section. Thelayer thickness that is removed each time depends on the
(b)
Spectroscopic areas
Subsurface areas
Surface areas
(a)
x
x
yy
z
z
Middle slice
Transverse slice
Casting direction
Ingot
x
x
y
y
(c)
Transverse slice
Middle slice
Ls/2
w/2
Fig. 3—Schematic representation of (a) position of collected sample, (b) sectioning of the sample for metallurgical examinations, and (c) compu-tational slices.
638—VOLUME 43B, JUNE 2012 METALLURGICAL AND MATERIALS TRANSACTIONS B

distance from ingot surface, which may be as small as0.1 mm or less. Such an analysis comprises severalhundred spots; the results of which are evaluatedstatistically. The examination is semimacroscopic. Allelements contained in the aluminum alloys are analyzedat the same time, and the segregation ratios of magne-sium and silicon for AA-6061 and AA-1050 alloysystems, respectively, are represented as
Sj ¼actual composition of j element Smeaj
� �
nominal composition of j element Soj
� � ½4�
where Sj in Eq. [4] is the macrosegregation ratio ofelement j.
III. EXPERIMENTAL RESULTS
A. Metallographic Analysis
The microetched surfaces for the middle slice displayan equiaxed dendritic structure as well as surfaceand subsurface interdendritic cracks as shown inFigures 4(a) and (b) and 5(a) and (b) for AA-6061and AA-1050 alloy systems, respectively. In thesemicrographs, the crack morphologies exhibit two com-mon crack categories. The first morphology involvessurface cracks at (x = 0), which are thin and branched,high-positive segregated cracks. These cracks continuelongitudinally in the x-x direction (Figure 3(a) and runperpendicular to the ingot surface in the y-y direction(Figure 4(a)). This micrograph reveals also that thesecracks surround the distorted equiaxed crystals. How-ever, the subsurface cracks concerning this morphologycan be classified into two crack categories. The first ishigh-segregated longitudinal channels running roughlyperpendicular to the ingot surface through the grainboundaries of equiaxed crystals demonstrated inFigure 4(b) (at x = 1 mm) and Figure 5(a) (at x =3 mm). This is caused by a high shrinkage associatedwith a high cooling rate during the incoherent mushyregion.[23,31–33] This process is followed by tensilethermometallurgical and mechanical strains generatedin the coherent mushy region caused by air gapformation and metallostatic head as illustrated inFigures 6(a) through (c).[23,24] The second morphologyof crack category is a high-segregated circle areasurrounding by equiaxed crystals as a result of thedifficulties in interdendritic liquid feed illustrated inFigure 5(b) (at x = 8 mm).[34,35]
Figures 4(a) and (b) and Figure 5(a) also show thatthe level of solute-rich solidified liquid in the interden-dritic areas is higher than the level in the crystalsurfaces. But in the case of Figure 5(b), the results showthat the level of crystal surfaces is higher than the levelof the interdendritic circular cracking area. Anotherinteresting phenomenon arises from the visual exami-nation of these figures, where the equiaxed crystals aredistorted shapely by different levels based on theirlocations, the segregation level, and the type of alloy. Inthe case of the AA 6061 alloy, the figures reveal the highdistortion of the surface equiaxed crystals (Figure 4(a)),
which is caused by a steep change in the positivemacrosegregation.[23,35] However, in the case of a slightchanging of the segregation in the interior areas, themicrograph exhibits a slight distortion of equiaxedcrystals (Figure 4(b)). This observation is consistentwith observation of Thevik et al.[36] that some aluminumalloys, such as AA-5182 ingots with a nominal magne-sium concentration of 4.7 wt pct ingots cast by direct-chill technology, the extruded segregated layer can bemore than 1 mm thick and can have an average surfacemagnesium concentration of up to approximately10 wt pct.[36] Also, the distorted equiaxed crystals giveanother explanation of the increasing interdendriticareas that result in a steep increase in the positivesegregation and, therefore, an increase in the interden-dritic cracking susceptibility. However, this phenome-non is not observed clearly in the case of AA-1050 alloyas shown in Figures 5(a) and (b).
B. Grain Size Distribution
This section presents the results of grain size mea-surements for different views of the slices. The measure-ments of the grain size of the exterior and interior areas
Fig. 4—Micrographs of crack morphology at (a) surface and (b) atx = 1 mm from the ingot surface for the 6061 aluminum alloy,magnification 400 times.
METALLURGICAL AND MATERIALS TRANSACTIONS B VOLUME 43B, JUNE 2012—639

only within 10 mm from ingot surface of transverseslices samples are presented in Figures 7(a) and (b) forAA-6061 and AA-1050 aluminum alloys, respectively.These measurements exhibit a general trend that thegrain size increases with the distance from ingot surfacefor all the samples of different aluminum alloy systems.Another interesting phenomenon arises from thesemeasurements where the effect of crystal distortion ismore significant in the case of AA-6061 alloy than in thecase of AA-1050 alloy. This appears at ingot surface andwithin 5 mm from ingot surface of AA-6061 alloy ingotwhere the difference in the grain sizes between x = 0,and x = 5 mm and x = 10 mm is observed as shown inFigure 6(a). This is caused by the steep change in themacrosegregation field around the dendritic equiaxedcrystals in the early stages of solidification in the moldzone as shown in Figures 4(a) and (b) and 5(a).
Figures 8(a) through (c) depict the result of the meangrain size, standard deviation, and crystal distortioncorrelation factor Fc, respectively, of the equiaxeddendritic structure for only the middle slice of the crosssection of the slab broad face (shown in Figure 3(a))with different aluminum alloy systems. Figure 8(a)
illustrates that the grain size of equiaxed crystalsincreases with the distance from the ingot surface ofdifferent aluminum alloy systems. It is interesting tonote the surface grain size of AA-6061alloy (/1 = 8.6lm) is much smaller than AA-1050 (/1 = 87 lm). Thisdifference decreases with the distance from the slabsurface as shown in Figure 8(a). This results from thedifference in the macrosegregation between the surfaceand subsurface areas due to interdendritic strainassociated with solidification process.[23] This reflectson the standard deviation r shown in Figure 8(b)where the standard deviation of AA-6061 is small andapproximately constant until x = 8 mm, and then itincreases slightly until x = 10 mm. In the case of AA-1050, the standard deviation is constant untilx = 2 mm, and then it increases steeply and fluctuatesuntil x = 10 mm. Figure 8(c) demonstrates the crystaldistortion correlation factor Fc where the effect of highpositive surface segregation of the AA-6061 alloy isobserved and also the effect of fluctuated macrosegre-gation of AA-1050 is materialized clearly. In general,the crystal distortion phenomenon depends signifi-cantly on the macrosegregation field surrounding ofequiaxed crystals and, therefore, on the composition ofaluminum alloy as shown in Figures 4(a) and (b) and5(a).[23,24,31,32]
C. Macrosegregation Analysis
This section presents and discusses the measuredresults of the macrosegregation on samples of aluminumalloy ingot slices. The variation of the magnesium
SMg ¼ MgMg0
and silicon SSi ¼ SiSi0
segregation ratios in the
transverse andmiddle slices are shown inFigures 9(a) and(b) and 10(a) and (b), respectively for different aluminumalloys. These measurements of transverse slices revealthat the macrosegregation ratio decreases generally withthe distance from the ingot center as shown in Fig-ures 9(a) and (b) for AA-6061 and AA1050 alloys,respectively. These reductions may be associated withsome fluctuations in the macrosegregation especially inthe interior areas of ingots. This observation is the resultof changes in the interdendritic liquid flow under differentconditions of cooling, structure morphology, type ofinterdendritic strain, and mushy permeability.[23,24,39]
However, the variation of the segregation ratios ofmagnesium and silicon with the distance from ingotsurface for the middle ingot slice are shown inFigures 10(a) and (b) of the AA-6061 and AA-1050alloys, respectively. Figure 10(a) indicates that thesegregation ratio of Mg is a high positive value at theingot surface and reduces gradually with the distancefrom the surface associated with a slight fluctuationbetween small positive (SMg > 1) and negative segrega-tions (SMg < 1) within 10 mm from the surface. Thisresults agree well with the observations of Hove et al.[37]
and the explanation by El-Bealy.[23,24] This might give amore complete explanation of why the extruded surfacesegregation layer is always found in aluminum direct-chill ingots by different degree levels.[23,24] Although thedensity of silicon is close to that of aluminum, the
Fig. 5—Micrographs of crack morphology at (a) surface and (b) atx = 8 mm from the ingot surface for the 1050 aluminum alloy,magnification 400 times.
640—VOLUME 43B, JUNE 2012 METALLURGICAL AND MATERIALS TRANSACTIONS B

segregation ratio of Si is a slight positive segregation atthe surface and fluctuates with the distance from sur-face mostly as a positive segregation as shown inFigure 10(b). This results from the coupled effect ofhigh shrinkage/contraction mechanism and its effect onthe movement of silicon crystals as well as the convec-tion streams especially in the surface and subsurfaceareas. This occurs because the temperature gradients arerelatively high in these areas especially during the earlystages of solidification. Therefore, a narrow mushy zonewith a high mushy permeability allows movement of thesilicon crystals onto the surface.[24] Then, this movementaffects the mushy permeability and may resist themovement of the solute interdendritic liquid beneaththe ingot surface.[24,38]
From these figures, it is interesting to note that thepositive segregation distribution has a significant effecton the location of interdendritic crack and its morphol-ogy as shown in Figures 10(a) and (b) even in thecompressed dendritic areas, as illustrated in Figures 4(a)and (b) and 5(a) and (b). Another result arises from thedistribution of crystal distortion correlation factormeasurements shown in Figure 8(c), where this phe-nomenon is considered as an additional measurement todefine the location and morphology of interdendriticcracks as demonstrated in Figures 8(c) and 10(a).
Liquid zoneSolid zone
Mushy zone
Incoherent mushy regioncoherent mushy regionSolid shell thickness
TliqTcohTsolT
IDECIDEC
(a)
(b)(c)
Fig. 6—Schematic representation of (a) different phase zones, (b) incoherent mushy region, and (c) coherent mushy region.
0
50
100
150
200
250
300
0 25 50 75 100 125 150 175 200
Gra
in s
ize,
(μm
)
x=0 x=5 x=10
0
50
100
150
200
250
300
0 25 50 75 100 125 150 175 200
Gri
an s
ize,
(μm
)
Distance from ingot center, (mm)
(b)
(a)
Fig. 7—Variations of measured grain size distributions for the (a)AA-6061 and (b) AA-1050 aluminum alloys.
METALLURGICAL AND MATERIALS TRANSACTIONS B VOLUME 43B, JUNE 2012—641

IV. MODEL FORMULATION
In this work, the mathematical model computes two-dimensional (2-D) transient fluid flow, heat flow, solid-ification, interdendritic stain, and macrosegregationthrough the mushy zone and the solidifying shell. This
050
100150200250300
0 2 4 6 8 10
Gra
in s
ize,
(μm
)
Distance from surface, (mm)
AA-6061 AA-1050
05
1015202530
0 2 4 6 8 10Stan
dard
dev
iatio
n, (
μm)
Distance from surface, (mm)
AA-6061 AA-1050
05
1015202530
0 2 4 6 8 10
F c%
Distance from surface, (mm)
AA-6061 AA-1050
(c)
(a) (b)
Fig. 8—Variations of (a) grain size, (b) standard deviation, and (c) crystal distortion correlation factor for different aluminum alloys.
00.5
11.5
22.5
33.5
0 25 50 75 100 125 150 175 200Segr
egat
ion
ratio
of
Mg x=0 x=5 mm x=10 mm
0.50.75
11.25
1.51.75
22.25
2.5
0 50 100 150 200Segr
egat
ion
ratio
of
Si
Distance from ingot center, (mm)
(b)
(a)
Fig. 9—Variations of measured segregation ratios of the (a) AA-6061 and (b) AA-1050 aluminum alloys.
0.8
1
1.2
1.4
1.6
1.8
2
0 2 4 6 8 10
Mac
rose
greg
atio
n, S
j
Distance from surface, (mm)
Mg-measured Mg-calculated
Si-measured Si-calculated
CracksCracksCracks
(a)
(b)
-6
-4
-2
0
2
4
6
0 2 4 6 8 10
Ave
rage
err
or, (
%)
Distance from surface, (mm)
AA-6061 AA-1050
Fig. 10—Variations of (a) macrosegregation ratios and (b) averageerrors for different aluminum alloys.
642—VOLUME 43B, JUNE 2012 METALLURGICAL AND MATERIALS TRANSACTIONS B

model has been developed based on the general frame-work for governing equations as presented byMortensen[39]
of fluid flow fields, Poirier et al. of thermal analysis,[40]
El-Bealy[23,41] of interdendritic thermometallurgicalstrain distributions, and by El-Bealy[23] of macrosegrega-tion analysis. Also, El-Bealy[14,15,23] proposed newapproaches to evaluate qualitatively and quantitativelythe interdendritic crack formed during dendritic solidifi-cation. These approaches are based on the interdendriticstrain criterion, dendritic solidification phases, and crys-tal distortion correlation factor Fc.
A. Solution Domain
The mathematical model problem for sheet ingot isalways a three-dimensional problem, but because ofhigh casting speeds and heat flow by conduction, thedirection of casting (z) is small compared with the heattransferred by the bulk motion of the ingot. Therefore,the peclet number is not small in this direct-chill castingprocess (PeAl-Mg = 143.4) and (PeAl-Si = 266.13) forAl-Mg and Al-Si alloy systems, respectively. PeAl-Sj isthe peclet number of the alloy system (m ZslqCp/k), wherem is the casting speed of alloy (m/s), Zsl is the ingotlength (Table II), q is the density of the alloy (Kg/m3),Cp is the alloy specific heat (J/kg K), and k is the thermalconductivity of the alloy (W/mK). Thus, the 3-Dproblem can be reduced to a 2-D problem.[23,42]
Because of the symmetry, only one horizontal quarter ofingot was selected as a model domain as shown inFigure 3(c). This is because of the vertical cross sectionuses only enough ingot to study the effect of convectionstreamson the cast structure or stress generation during thestart up phase.[43,44] This horizontal transverse sectionmoves down with steel isotherms at the casting speeds asshown in Figure 3(c). Therefore, the casting speed has nosignificant effect on the convection streams or on interden-dritic fluid flow in the current horizontal model domain.
B. Fluid Flow Equations
One important issue taken into modeling consider-ations is calculating the fluid flow in the liquid andmushy zones. Therefore, the first step was to develop aseparate fluid flow model to obtain the superheat fluxdistribution and interdendritic fluid flow between theequiaxed crystals. The governing equations of fluidflow are based on Mortensen’s approach discussed inReference 39. Therefore, the mass and momentumconversion equations to be solved for horizontal planare to be solved as follows:
@q@tþ@ quli� �
@xi¼ 0 ½5�
q@uli@tþ qulj
@ uli� �
@xj¼ � @P
@xiþ @
@xjmþ mtð Þ @u
li
@xjþ Si �
2@j3@xi
½6�
where uli is the volume-averaged velocity of the liquidphase, Al is the fraction of interdendritic liquid, SV is
the dendrite surface area per unit volume computedfrom grain size measurements, and kC is a constantthat depends on the characteristic of the porous med-ium. kC was found to be 5.[45–47] Also, P, m, and jare the pressure, turbulent kinematic viscosity, andturbulent energy, respectively. Generally, turbulencewill be induced from the feeding system such as anozzle distributor. In the current study, it was foundthat there are no turbulences because of the smoothnature of the feeding system. Subsequently, the effectof thermal convection streams is feeble to move theequiaxed crystals in the horizontal plane or to forcethe mixture flow field to the solid velocity in the so-lid region (usi= 0). Therefore, the effects of turbu-lence flow and gravity in the horizontal plane areneglected, and Eq. [6] can be reformulated as fol-lows:
q@uli@tþ qulj
@ uli� �
@xj¼ � @P
@xiþ @
@xjm@uli@xjþ Si ½7a�
where Si in Eq. [7a] is a Darcy force and is given by
Si ¼o for T � T
vK ð�uiÞ for Ts � T � Tl
�
½7b�
where the mushy permeability of the equiaxed den-dritic structure K can be formulated as follows[45,46]:
K ¼ A3l =S
2vkc 1� /2� �
½8�
All symbols are defined in the list of symbols in theend of this article.
C. Heat Transfer and Solidification Equations
The model then solves the 2-D transient energybalance equation developed by Poirier et al., and thefollowing equation was used in these computations[40]:For the mushy region
�q@ �Hs
@tþ Alql
@L
@t� L
@
@tAsqsð Þ
¼ keff@2T
@x2þ @
2T
@y2
� �
� qlAluli
@ �Hs
@xþ @
�Hs
@y
� �
þ @L
@xþ @L@y
� �� �
½9�
For the liquid region
@Hl
@t¼ kl
ql
@2T
@x2þ @
2T
@y2
� �
� uli@Hl
@xþ @Hl
@y
� �
½10�
For the solid region
@
@tqs
�Hsð Þ ¼ ks@2T
@x2þ @
2T
@y2
� �
½11�
These equations distinguish the heat transfer in themushy, liquid, and solid zones while taking into accountthe effects of the heat of mixing in both the dendriticsolid and the interdendritic liquid in the mushy zone.
METALLURGICAL AND MATERIALS TRANSACTIONS B VOLUME 43B, JUNE 2012—643

Also, these equations include the effects of heat changesof the different solid-phase transformations in the solidzone. Therefore, the intensive enthalpy �Hs is writtenwith an overbar to emphasize that there is microsegre-gation of solute in the local dendritic solid, so that itsintensive enthalpy is an average in Eqs. [9] through [11].
To simulate the solid fraction during dendritic solid-ification of aluminum alloys systems, Scheil’s equationwas used as follows[48]:
As ¼ 1� T� Tm
Tl � Tm
� � 1Ke�1ð Þ
½12�
where Tl and Tm are liquidus temperature of multial-loying elements and melting temperature of pure alu-minum, respectively, whereas Ke is the equilibriumpartition coefficient of the binary aluminum alloysystem.[49]
D. Interdendritic Strain Equations
The interdendritic strain equations have been formu-lated to obtain a time history of the average straindistribution of the control volume element CV in twodifferent mushy regions as shown in Figures 6(a)through (c).[24,41] The first region is just below a liquidusisotherm called an incoherent mushy region, whereas thesecond one is defined as a coherent mushy region and isjust below an isotherm at a certain critical temperaturecalled the coherence temperature Tcoh (Figure 6(a)),which can be calculated by
Tcoh ¼ Ts þ fcoh Tl � Tsð Þ ½13�
where fcoh can be calculated by using the sameapproach by Chai et al.[50] as follows:
fcoh ¼ a� bVa
Rd
� ��
½14�
where a and b are constants and are equal to 0.8269and –0.1091, respectively, whereas Rd is equal to halfof the grain size /1
2 , and it can be calculated by usingthe same approach used by Flemings in Reference 51.The total interdendritic strain has been calculated asthe effect of the thermoviscoelastic strain componentsand the total strain can be computed based on the fol-lowing equation[14,25]:
etot ¼ ee þ eTph þ ec þ em ½15�
where etot in Eq. [15] is the total strain and ee is a pureelastic component computed by using Hooke’s law
with temperature-dependent Young’s modulus E(T) asgiven in the following equation:
ee ¼ sE Tð Þ ½16�
However, interdendritic thermometallurgical straineTph in Eq. [15] has been calculated based on El-Bealy’s[23,41] approach where it has been assumed thatthe strain calculated during the early stages of solidifica-tion for a purely elastic material is approximately thesame as the sum of elastic and inelastic strains calculatedwhen the creep is included.[52] El-Bealy computed thestrain as thermometallurgical (ITM) strain based on theconcept of thermal storage energy and the changes involumes caused by shrinkage and thermal contractionduring solidification and solid phase transformation. Thefollowing equation was used in the computations[23,41] :
The interdendritic thermometallurgical strain equationas represented byEq. [17] contains twomain parts that areoften neglected or treated inappropriately. They are thestorage energy strain represented as the part I of Eq. [17]and the volume change strain of solidified control volumeelement CV denoted as part II of the same equation.[41]
The storage energy part consists of three main parame-ters. Two main parameters illustrate in the numerator ofEq. [17], whereas one parameter appears in the domina-tor.[23,41] The numerator’s parameters are transportedenergy Etr and the second parameter is the inner energygenerated during solidification Ein. However, the averageenergy capacity �E of control volume element ‘‘CV’’appears in the dominator of Eq. [17]. The second part ofEq. [17] represents the volume change strain rate associ-ated with the shrinkage or thermal dendritic solid
contraction V Tð Þ=V Tcohð Þ �1
3�1=dt.[23,41]
Therefore, Eq. [17] can be rewritten for incoherentmushy region as[13,23,41]
deTph
dt¼ þ
VðTÞVðTcohÞ
�13�1
dtPart II
½18a�
and for the coherent mushy region, Eq. [17] can bereformulated[13,23,52]
deTph
dt¼
a keff @2T@x2þ @2T
@y2
�h iþ @@t ESþELþEPð Þ
E�
PartI
�VðTÞ
VðTcohÞ
�13�1
dtPartII
½18b�
_eTph þ _ec ¼ deTph
dtPart I
¼a div k grad Tð Þ½ � þ @
@t
Pg Eg
�E�
V Tð ÞV Tcohð Þ
�13�1
dtPart II
½17�
644—VOLUME 43B, JUNE 2012 METALLURGICAL AND MATERIALS TRANSACTIONS B
where ES, EL, and EP are the volumetric energiesgenerated caused by the changes in enthalpy of dendriticsolid, latent heat of fusion, and solid-state phasetransformation, respectively. In the case of solid zone,EL = 0, whereas in the case of no phase transformationor any metallurgical reaction, EP = 0.[23,41] The detailsof the energies in Eq. [18b] are illustrated in Reference41.
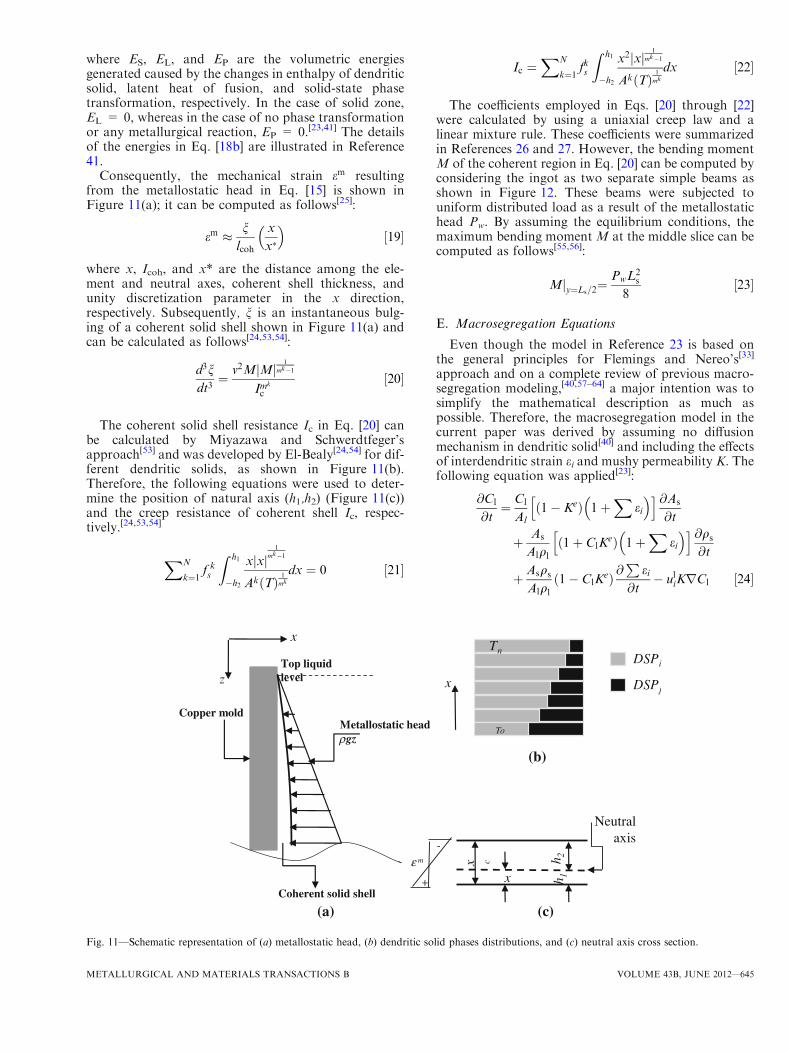
Consequently, the mechanical strain em resultingfrom the metallostatic head in Eq. [15] is shown inFigure 11(a); it can be computed as follows[25]:
em � nlcoh
x
x
�½19�
where x, Icoh, and x* are the distance among the ele-ment and neutral axes, coherent shell thickness, andunity discretization parameter in the x direction,respectively. Subsequently, n is an instantaneous bulg-ing of a coherent solid shell shown in Figure 11(a) andcan be calculated as follows[24,53,54]:
d3ndt3¼ v2M Mj j
1
mk�1
Imk
c
½20�
The coherent solid shell resistance Ic in Eq. [20] canbe calculated by Miyazawa and Schwerdtfeger’sapproach[53] and was developed by El-Bealy[24,54] for dif-ferent dendritic solids, as shown in Figure 11(b).Therefore, the following equations were used to deter-mine the position of natural axis (h1,h2) (Figure 11(c))and the creep resistance of coherent shell Ic, respec-tively.[24,53,54]
XN
k¼1 fks
Z h1
�h2
x xj j1
mk�1
Ak Tð Þ1
mk
dx ¼ 0 ½21�
Ic ¼XN
k¼1 fks
Z h1
�h2
x2 xj j1
mk�1
Ak Tð Þ1
mk
dx ½22�
The coefficients employed in Eqs. [20] through [22]were calculated by using a uniaxial creep law and alinear mixture rule. These coefficients were summarizedin References 26 and 27. However, the bending momentM of the coherent region in Eq. [20] can be computed byconsidering the ingot as two separate simple beams asshown in Figure 12. These beams were subjected touniform distributed load as a result of the metallostatichead Pw. By assuming the equilibrium conditions, themaximum bending moment M at the middle slice can becomputed as follows[55,56]:
Mjy¼Ls=2¼ PwL
2s
8½23�
E. Macrosegregation Equations
Even though the model in Reference 23 is based onthe general principles for Flemings and Nereo’s[33]
approach and on a complete review of previous macro-segregation modeling,[40,57–64] a major intention was tosimplify the mathematical description as much aspossible. Therefore, the macrosegregation model in thecurrent paper was derived by assuming no diffusionmechanism in dendritic solid[40] and including the effectsof interdendritic strain ei and mushy permeability K. Thefollowing equation was applied[23]:
@Cl
@t¼ Cl
Al1� Keð Þ 1þ
Xei
�h i @As
@t
þ As
Alql
1þ ClKeð Þ 1þ
Xei
�h i @qs
@t
þ Asqs
Alql
1� ClKeð Þ @
Pei
@t� uliKrCl ½24�
Top liquid level
Metallostatic headgz
Copper mold
Coherent solid shell
(a)
x
z x
(b)
Tn
To
DSPi
DSPj
x c
x
Neutral axis
h 2h 1
(c)
-
+
m
ρ
ε
Fig. 11—Schematic representation of (a) metallostatic head, (b) dendritic solid phases distributions, and (c) neutral axis cross section.
METALLURGICAL AND MATERIALS TRANSACTIONS B VOLUME 43B, JUNE 2012—645

Equation [24] illustrates that the change of segrega-tion of the interdendritic solute liquid depends mainlyon the four parameters that appear on the right-handside of this equation. The first parameter is the growththe elementary dendritic solid area @As
@t : The effect ofthis parameter depends also on its products thatappeared as a ratio between Cl
Alwith the equilibrium
partition coefficient 1� Keð Þ and the total interdendrit-ic strain 1þ
Peið Þ: This parameter has a small effect in
the incoherent mushy region especially close to theliquidus isotherm, and this effect increases significantlywhen the solidification continues and Al decreases. Thesecond parameter on the right-hand side of Eq. [24] isthe change in the density of the dendritic solid duringsolidification @qs
@t . The effect of the second parameteralso depends on the equilibrium partition coefficientfactor 1þ ClK
eð Þ with the influence of concentration ofinterdendritic solute liquid and also on the totalinterdendritic strain 1þ
Peið Þ. The effect of this part
on the segregation criterion seems insignificant becauseof the slight change in microsegregation distributionchanges associated with the mechanism of no diffusionin the dendritic solid during solidification. The thirdparameter in this equation is the strain rate of theelementary dendritic solid area
@P
ei@t . Its effect depends
on the ratio between the product of elementarydendritic solid area As and its density qs with elemen-tary interdendritic liquid area Al and its density ql (
Asqs
Alql).
The effect of this parameter is considered permanent indifferent mushy regions because of the natural ofinterdendritic strain in the mushy regions (Figures 6(a)through (c). The final parameter is the velocity ofinterdendritic liquid flow uli through the mushy perme-ability K. The effect of this parameter is vital in theincoherent region because of the small mushy perme-ability and constrained mushy coherent region resultingfrom the significant increase in mushy permeability andits effect on the interdendritic liquid flow. Therefore,Eq. [24] can be reformulated in 2-D situation asfollows:
@Cl
@t¼ Cl
Al1� Keð Þ 1þ
Xei
�h i @As
@t
þ As
Alql
1þ ClKeð Þ 1þ
Xei
�h i @qs
@t
þ Asqs
Alql
1� ClKeð Þ @
Pei
@t� ulij
@Cl
@xþ @Cl
@y
� �
½25�
The local velocities of the interdendritic fluid flow rela-tive to the dendritic solid only within the coherent mushyregion for x and y directions (Figures 6(a) through (c)are obtained by integrating the following conservation ofthe total mass described in Reference 65.
@
@tAlql þ Asqs þ Asqs
Xei
�¼ �r Alqlu
liK
� �½26a�
Consequently, the following equation was used tocompute ui
l(x, y, t) in these computations:
uli ¼1
AlqlK
Z i
is
@
@tAlql þ Asqs 1þ eið Þð Þdi ½26b�
F. Interdendritic Crack Equations
To predict the interdendritic crack formation accu-rately, two new criteria were proposed byEl-Bealy[14,15,23]
to simulate (1) the susceptibility of interdendritic crackqualitatively at different locations in the ingots and (2) itsmorphology quantitatively.[15,23,41] The first criterion isthe interdendritic cracking susceptibility function (ICSF)to measure qualitatively the susceptibility of interden-dritic cracking at different locations during solidificationin the different mushy regions, and it can be calculated asfollows[14,15,23]:
if T � Tl ICSF ¼ eacc
As½27�
and eacc* can be defined as;
x
y
FF
FF
SB
SN
Ls
Ls/2x=0
Pw
B
B/2
F
F
Fig. 12—Schematic representation of ingot force analysis.
646—VOLUME 43B, JUNE 2012 METALLURGICAL AND MATERIALS TRANSACTIONS B

eacc ¼XT¼Ts
T¼Tl
ðetot � eeÞ ½28�
Equation [29] simulates a simple function of openingdisplacement between the crystals quantitatively calledthe elementary interdendritic area (EIA).
EIA ¼ Al 1þ Fcð Þ þ eacc ½29�
where eacc is the accumulative interdendritic strainassociated with the solidification of the alloy.[41] Thisfunction helps to simulate the size of interdendriticcrack nucleation and its propagation quantitatively.Depending on the propagation of the interdendriticcrack, its morphology can be classified and is definedas the effect of macrosegregation on this crack. Conse-quently, this function can be reformulated as the inter-dendritic distance between two equiaxed crystals(IDEC) (Figures 6(b) and (c), and it can be computedas follows:
IDEC ¼ EIA� /1 ½30�
where is /1 is the grain size.
G. Initial, Boundary, and Cooling Conditions
The initial conditions used in these computations forthe model domain described previously and representedin a 2-D mathematical model for the slices shown inFigure 3(c) are as follows: When t = 0 at the top metallevel (z = 0), the initial temperature T/ is equal to thepouring temperature Tpour. At z = 0, Tpour is assumeduniformly throughout the ingot thickness, and thechemical species are also assumed to be distributedconsistently and set to their initial values.
Heat transfer at the ingot surface was assumed tofollow a generalized Newtonian law in two differentdirections.[39] Thus, it was assumed that the heat fluxacross the ingot surface is uniform and proportional tothe difference between ingot surfaces and constant watercooling temperatures as defined in the following equa-tion[14,24,39]:
Q/ ¼ h tð Þ T/ � Tw
� �½31�
Therefore, for the surface boundary conditions ofx = 0 and y = l/2, the surface’s heat flux can becomputed as represented in Eq. [19a] as follows[14,24]:
keff@T
@x
� �
x¼0¼ h tð Þ T/ � Tw
� �½32a�
For boundary conditions at x = 62.5 mm, the heatflux can be calculated as follows[14,24]:
Qxð Þx¼ 62:5¼ 0 ½32b�
Consequently, the details for the mold cooling con-ditions of the different cooling regions applied in thisstudy are described in the next section.
Because the complex mechanisms controlled the heattransfer in the different mold cooling regions,[66–70] anaccurate determination of the mold cooling conditions isextremely difficult experimentally and is currentlyimpossible from a first principles viewpoint. Therefore,the mechanisms by which these occur and the time inter-vals of their occurrence are not well understood.[66–70]
In the light of these facts, previous investigations thatdealt with heat transfer in a direct-chill mold and itscooling conditions have assumed either a constant valueof heat transfer coefficient over a certain value[17,36,46] ora discontinuous function of heat transfer coefficient thatis time dependent and varies with the distance from themold inlet.[39,43] Unfortunately, both of the constant anddiscontinuous functions cannot be used to evaluate themold heat transfer, as this did not give a good agreementwith different heats.In this study, the fluctuated mold cooling conditions
approach proposed by El-Bealy and Fredriksson[71] wasmodified by El-Bealy[23,24,72] by using the fluctuatedmacrosegregation distribution as a verification of themold heat transfer history. Therefore, the mold heat fluxas a function of the distance from the mold inlet used inthese computations is plotted in Figures 13(a) and (b).In this approach, the mold cooling conditions weredivided into two main mold-cooling regions. The firstcooling region can be defined as before air gap forma-tion (BAGF) and the second is after air gap formation(AAGF), as shown in Figures 13(a) and (b). The modelpredications of heat-transfer coefficients in Figures 13(a)and (b) agree well with the predications by Williamset al.[43] and with the calculations by Mortensen[39]
qualitatively and quantitatively.
V. SOLUTION ALGORITHM
The solution algorithm is based on the numericalintegration technique where the governing equations inthe preceding model have been transformed into dis-cretization equations. This transformation technique isbased on the finite-difference method (FDM) proposedby Rung Kutta and described in Reference 73. Theseequations were solved by using a fine mesh of Dx,Dy = 0.1 mm and small time step Dt = 0.001 toachieve accurate solutions.[73] The new temperature ofthe control element of computation at time t in RungKutta FDM was obtained through the interpolation ofold temperature, which was calculated previously by thesame method. The calculation of the new temperaturewas based on the following criterion:For a small time interval Dt �� 1,
@T
@t
����new
� @T@t
����old
½33a�
For the convergence of fluid flow and temperaturefields, the following aspect was employed as follows:
X unewi � uoldi
unewi
����
���� � 1� 10�4 ½33b�
METALLURGICAL AND MATERIALS TRANSACTIONS B VOLUME 43B, JUNE 2012—647

X Tnew � Told
Tnew
����
���� � 1� 10�3 ½33c�
However, the strategy for the full solution computa-tion steps of fluid flow, heat transfer, solidificationbehaviors, interdendritic strain, macrosegregation, andinterdendritic crack criteria during dendritic solidifica-tion processes is used as follows:
(a) Read the input file.(b) Estimate the new casting temperature distribution.(c) Calculate the thermophysical properties of the alloy.(d) Calculate the fluid flow fields.
(e) Repeat steps (b) through (d) until the convergedsolutions are obtained.
(f) Calculate the dendritic solid and interdendriticliquid phase fractions.
(g) Estimate the initial Newtonian heat transfer coef-ficient.
(h) Analyze the thermal fields and their temperaturegradients.
(i) Repeat steps (g) and (h) until the converged solu-tions are obtained.
(j) Calculate the thermomechanical properties of thealloy.
(k) Calculate the interdendritic strain fields.(l) Calculate the macrosegregation distribution.(m) Calculate the macrosegregation error between the
measured and predicted results.(n) Repeat steps (g) through (m) until the minimum
macrosegregation error is reached.(o) Calculate the ICSF, EIA, and IDEC functions.(p) Go to step (b) and repeat steps (b) through (o).
VI. MATERIALS PROPERTIES
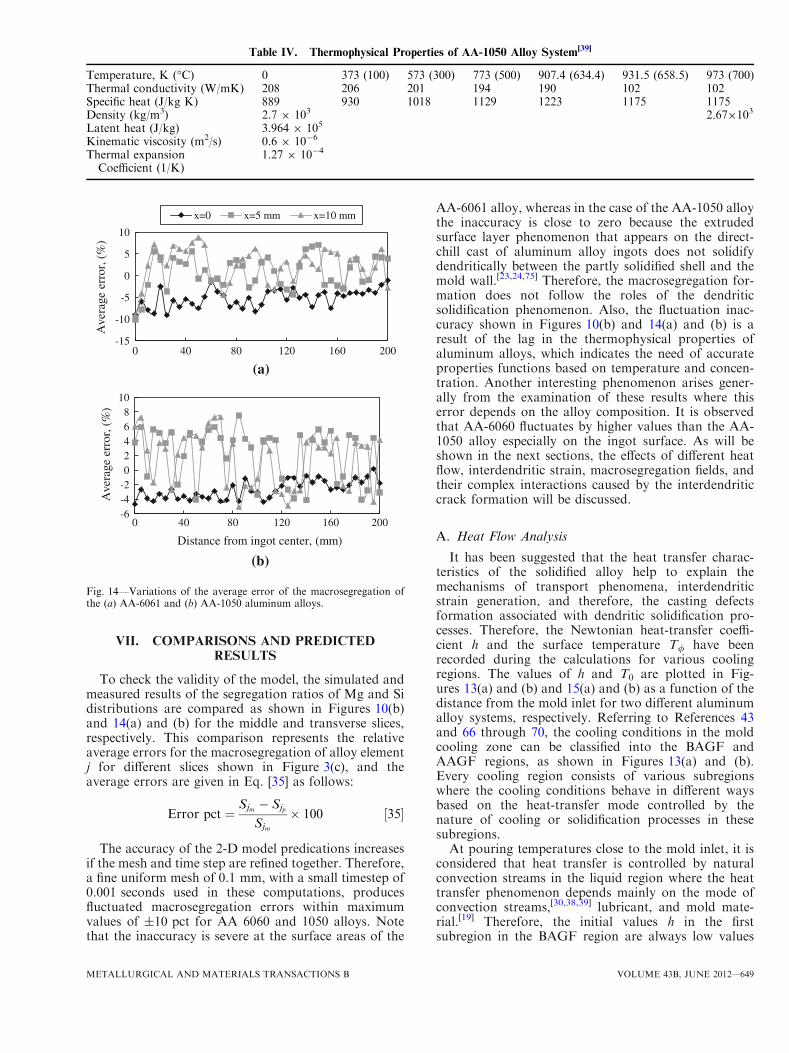
The industrial alloys AA-6061 and AA1050 investi-gated in this article are commercial purity aluminumalloys, and their exact compositions are given in Table I.The thermophysical properties of these alloys are takenfrom References 26, 27, 39, and 44. In this study, thedependence of both liquidus Tliq and solidus Tsol
temperatures on the alloying elements is described bya linear mixture rule as illustrated in Reference 41.Subsequently, the thermophysical properties used inthese computations are tabulated in Tables III and IVfor the AA-6061 and AA1050 alloys, respec-tively,[26,27,39,44] whereas the thermomechanical proper-ties are summarized in References 26 and 27.In the mushy zone, the latent heat is released through
the path given by Scheil’s approximation[48] where thespecific heat has been averaged over the solid and liquidphases. Thus, the equivalent specific heat was given bythe following equation[11,74]:
qCeffp ¼qsC
spAs þ qlC
lp 1� Alð Þ
þ L
Tl � Tsu Tl � Tð Þ � u Ts � Tð Þ½ � ½34�
where u is the Heaviside function.[73]
0250500750
10001250150017502000225025002750
0 25 50 75 100 125 150 175 200
Distance from mold inlet, (mm)
(b)
0
300
600
900
1200
1500
0 25 50 75 100 125 150 175 200
Hea
t tra
nsfe
r. c
oeff
., (W
/m2
K)
Hea
t tra
nsfe
r. c
oeff
., (W
/m2
K)
Distance from mold inlet, (mm)
(a)
BAGF
AAGF
BAGF
AAGF
Fig. 13—Variations of Newtonian heat transfer coefficient for the (a)AA-6061 and (b) AA-1050 aluminum alloys.
Table III. Thermophysical Properties of AA-6061 Alloy System[44]
Temperature, K (�C) 928.0 (655.0) 927.2 (654.2) 928.1 (653.1) 924.6 (651.6) 917.4 (644.4) 873 (600) 828.3 (555.3)Solid fraction 0 0.15 0.30 0.45 0.75 0.95 1Thermal conductivity(W/mK)
101.9 115.1 128.3 141.5 168.0 185.6 190.0
Specific heat (J/kg K) 1175 1165Density (kg/m3) 2.65 9 103 2.79103
Latent heat (J/kg) 3.99 9 105
Kinematic viscosity (m2/s) 0.6 9 10�6
Thermal expansioncoefficient (1/K)
1.2 9 10�4
648—VOLUME 43B, JUNE 2012 METALLURGICAL AND MATERIALS TRANSACTIONS B
VII. COMPARISONS AND PREDICTEDRESULTS
To check the validity of the model, the simulated andmeasured results of the segregation ratios of Mg and Sidistributions are compared as shown in Figures 10(b)and 14(a) and (b) for the middle and transverse slices,respectively. This comparison represents the relativeaverage errors for the macrosegregation of alloy elementj for different slices shown in Figure 3(c), and theaverage errors are given in Eq. [35] as follows:
Error pct ¼Sjm � Sjp
Sjm
� 100 ½35�
The accuracy of the 2-D model predications increasesif the mesh and time step are refined together. Therefore,a fine uniform mesh of 0.1 mm, with a small timestep of0.001 seconds used in these computations, producesfluctuated macrosegregation errors within maximumvalues of ±10 pct for AA 6060 and 1050 alloys. Notethat the inaccuracy is severe at the surface areas of the
AA-6061 alloy, whereas in the case of the AA-1050 alloythe inaccuracy is close to zero because the extrudedsurface layer phenomenon that appears on the direct-chill cast of aluminum alloy ingots does not solidifydendritically between the partly solidified shell and themold wall.[23,24,75] Therefore, the macrosegregation for-mation does not follow the roles of the dendriticsolidification phenomenon. Also, the fluctuation inac-curacy shown in Figures 10(b) and 14(a) and (b) is aresult of the lag in the thermophysical properties ofaluminum alloys, which indicates the need of accurateproperties functions based on temperature and concen-tration. Another interesting phenomenon arises gener-ally from the examination of these results where thiserror depends on the alloy composition. It is observedthat AA-6060 fluctuates by higher values than the AA-1050 alloy especially on the ingot surface. As will beshown in the next sections, the effects of different heatflow, interdendritic strain, macrosegregation fields, andtheir complex interactions caused by the interdendriticcrack formation will be discussed.
A. Heat Flow Analysis
It has been suggested that the heat transfer charac-teristics of the solidified alloy help to explain themechanisms of transport phenomena, interdendriticstrain generation, and therefore, the casting defectsformation associated with dendritic solidification pro-cesses. Therefore, the Newtonian heat-transfer coeffi-cient h and the surface temperature T/ have beenrecorded during the calculations for various coolingregions. The values of h and T0 are plotted in Fig-ures 13(a) and (b) and 15(a) and (b) as a function of thedistance from the mold inlet for two different aluminumalloy systems, respectively. Referring to References 43and 66 through 70, the cooling conditions in the moldcooling zone can be classified into the BAGF andAAGF regions, as shown in Figures 13(a) and (b).Every cooling region consists of various subregionswhere the cooling conditions behave in different waysbased on the heat-transfer mode controlled by thenature of cooling or solidification processes in thesesubregions.At pouring temperatures close to the mold inlet, it is
considered that heat transfer is controlled by naturalconvection streams in the liquid region where the heattransfer phenomenon depends mainly on the mode ofconvection streams,[30,38,39] lubricant, and mold mate-rial.[19] Therefore, the initial values h in the firstsubregion in the BAGF region are always low values
Table IV. Thermophysical Properties of AA-1050 Alloy System[39]
Temperature, K (�C) 0 373 (100) 573 (300) 773 (500) 907.4 (634.4) 931.5 (658.5) 973 (700)Thermal conductivity (W/mK) 208 206 201 194 190 102 102Specific heat (J/kg K) 889 930 1018 1129 1223 1175 1175Density (kg/m3) 2.7 9 103 2.679103
Latent heat (J/kg) 3.964 9 105
Kinematic viscosity (m2/s) 0.6 9 10�6
Thermal expansionCoefficient (1/K)
1.27 9 10�4
-15
-10
-5
0
5
10
0 40 80 120 160 200
Ave
rage
err
or, (
%)
x=0 x=5 mm x=10 mm
(a)
-6-4-202468
10
0 40 80 120 160 200
Ave
rage
err
or, (
%)
Distance from ingot center, (mm)
(b)
Fig. 14—Variations of the average error of the macrosegregation ofthe (a) AA-6061 and (b) AA-1050 aluminum alloys.
METALLURGICAL AND MATERIALS TRANSACTIONS B VOLUME 43B, JUNE 2012—649

of approximately 50 W/m2K for different aluminumalloys as shown in Figures 13(a) and (b). These valuesincrease slightly by different small rates based on thevalue of superheat and, therefore, on the magnitude anddirection of natural convection velocities until theliquidus temperature.[19,38] Subsequently, h increasesgradually into 52 (z = 4 mm) and 61 (z = 8 mm) W/m2K for AA-6061 and AA-1050 alloys, respectively.Because of the different casting speeds and superheats, hbehaves differently with these alloys.[38,75] As coolingcontinues and when the shell becomes coherently, hincreases rapidly from the initial contact values of 52 W/m2K until the peak value of 1349 W/m2K for the AA-6061 alloy within 10 mm as illustrated in Figure 13(a).In the case of the AA-1050 alloy shown in Figure 13(b),h increases by a higher rate after starting the solidifica-tion process to 313 W/m2K at 16 mm followed by arapid increase into a peak value of 2288 W/m2K at27.5 mm from mold inlet. This result agrees reasonablywith the typical values proposed by Mortensen[39] forAA-1050, and the increasing differences are a result ofthe validation function and calibration method. Oncethe solidifying shell becomes self-supporting, it contractsin accordance with the thermomechanical and shrinkageproperties of casting, whereas the chill surface mayexpand. The relative magnitude of the contract/shrink-age mechanism and the chill expansion, together withany pressure acting on the interface, determines the typeof contact between the chill and ingot, and therefore, itcontrols the heat transfer coefficient in the AAGFregion. Subsequently, the peak values drop sharply bydifferent ways to 300 and 761 W/m2K for AA-6061 and
1050 aluminum alloys as shown in Figures 13(a) and (b),respectively. This is followed by generally a gradualdecrease in h associated with small fluctuations of h atdifferent distances from mold inlet. This is a result of theair gap/contact mechanism proposed by Mortensen[39]
and by Warmeatlas.[76] However, this agrees well withthe air gap/contact mechanism and may explain theingot cross-deformation defect in the early stages of thealuminum direct-chill casting process.[77] Also, this mayexplain the effect of mechanical strain resulting from themetallostatic head[77] and dendritic structure on thisdefect. h continues to decrease gradually with thedistance from the mold inlet until the minimum valuesof 243.5 and 450 W/m2K are reached at the mold exitfor AA-6061 and AA-1050 aluminum alloys as shown inFigures 13(a) and (b), respectively.The effect of the mold cooling conditions shown in
Figures 13(a) and (b) on the surface temperature profilesT/ of the simulated slice mentioned previously fordifferent aluminum ingots are plotted in Figures 15(a)and (b). These figures show that a rapid surface coolingoccurs in the BAGF cooling zone. This cooling is aresult of the effect of different superheats or theirconvection streams on the surface cooling.[19,38,78] Thisdifference appears in the small difference between thebehaviors and the lengths of this cooling zone with thesolidification process of different aluminum alloys. Thelengths of this zone are 21 and 29 mm for AA-6061 andAA-1050 alloys, respectively, which agrees well with themeasurements performed by Hamdi et al.[44] and byDrezet and Rappaz[74] of direct cast aluminum ingotsfor AA-6060 and AA-1201 alloys, respectively. Also, thelaboratory experiments performed by Muojekwuet al.[19] of for Al-Si alloys show the same trend, whichmight help to avoid surface defects especially theextruded surface segregation layer and interdendriticcracks where the mold caster may have an insulatedzone on the top of the mold.[17] The initial surfacecooling rate is reduced, which results in a decrease in theinterdendritic surface tensile strain in the incoherent andcoherent regions in the mushy zone where the sources ofinterdendritic strain behave in a different ways.[33,41,51]
Then, the cooling on the ingot surface slows down asshown in Figure 15(a) or fluctuates between the coolingand reheating processes in the AAGF cooling zone asshown in Figure 15(b) until the mold exit. This is aresult of the dynamics of the air gap of differentaluminum alloys and its effect on the heat-transfermode. Therefore, the dendritic solidification process isaffected, particularly the cast structure and solidificationdefects.[32–34,75]
B. Interdendritic Strain Analysis
The interdendritic strain and accumulative straindistributions are used often as criteria related to thenucleation and propagation mechanisms of interden-dritic crack formation during dendritic solidificationprocesses.[51,65] To check the validity of these criteria,the interdendritic strain distribution and its accumula-tive strain in the dendritic solid in the vulnerable stagebetween the fractions of dendritic solid between
620625630635640645650655660
0 25 50 75 100 125 150 175 200Surf
ace
tem
pera
ture
, (°C
)Su
rfac
e te
mpe
ratu
re, (
°C)
Distance from meniscus, (mm)
580
600
620
640
660
680
0 25 50 75 100 125 150 175 200
Distance from mold inlet, (mm)
(b)
(a)
Fig. 15—Variations of the ingot surface temperatures for the (a)AA-6061 and (b) AA-1050 aluminum alloys.
650—VOLUME 43B, JUNE 2012 METALLURGICAL AND MATERIALS TRANSACTIONS B

As = 0.65 to 1 and between As = 0.67 to 1 in themushy zone has been simulated for the AA-6061 andAA-1050 alloys, respectively. The values of these twocriteria along the middle slice mentioned previously arerecorded and plotted in Figures 16(a) and (b) as afunction of the distance from the ingot surface atdifferent distances from the mold inlet.
From these figures, the ingot surface cools rapidly asshown in Figures 15(a) and (b). This rapid coolingimposes an interdendritic tensile strain that generatesfrom the shrinkage/contraction mechanism associatedwith dendritic solidification in the incoherent mushyregion. This results in an increase of the interdendriticdistances between the equiaxed crystals in the ingotsurface and subsurface areas, and therefore, it increasesthe segregation level in these areas.[15,23,79] The rapidsurface cooling continues in the case of the AA-6060alloy in the coherent mushy zone and generates inter-dendritic tensile strain on the surface. This strainreduces gradually with the distance from the ingotsurface and then changes into interdendritic compressivestrain in the areas close to the coherent isotherm asillustrated in Figure 16(a) at position Z1 = 40 mm fromthe mold inlet. However, in the case of the AA-1050alloy, a rapid cooling does not continue at 12 mm fromthe mold inlet and a gradual reduction in the surfacecooling is observed in Figure 15(b). This drop in thesurface cooling causes the ingot surface to compress.This scenario continuous for several millimeters and is
followed by the rapid surface cooling again as shownFigure 16(b). This results in an interdendritic compres-sive strain not only on the ingot surface but also beneaththe surface as illustrated in Figure 16(a) for the AA-1050 alloy. As evidence of this result, the ingot surfacereveals a small, positive segregation as shown inFigure 5(a). This may result from segregation becausethe shrinkage/contraction mechanism occurs in theincoherent mushy region above the coherent tempera-ture. Then, the effect of the compressive strain generatedin the coherent region appears in the morphology of thesqueezing segregation in interdendritic areas close to theinterdendritic distance between the equiaxed crystals asshown in Figure 5(a). Consequently, the surface coolingfollows the same trend for different aluminum alloyswhere the surface cooling fluctuates between a gradualcooling and reheating of ingot surface and gradualcooling by different rates until the mold exit as shown inFigures 16(a) and (b). This causes a gradual decrease inthe interdendritic tensile strain with the distance fromthe ingot surface as shown in Figure 16(a) in the case ofAA-6060 alloy, whereas in the case of the AA-1050alloy, interdendritic strain fluctuates between a com-pressive strain on the ingot surface and the tensile strainat 3 mm.However, Figure 16(b) shows the interdendritic accu-
mulated strain eacc at various distances from the moldinlet for different alloys. In the case of the AA-6060alloy, the tensile eacc increases slightly within 2 to 3 mmfollowed by a gradual decrease in tensile eacc until itreaches 10 mm at a distance of Z1 = 40 mm from themold inlet. This trend continues and interdendritictensile strain accumulates significantly within 2 mmfrom the ingot surface at position Z1 = 100 mm asshown in Figure 16(b). Then, this eacc decreases gradu-ally from the same position until 10 mm from the ingotsurface. This result agrees with the micrographs shownin Figures 4(a) and (b), in which the interdendriticaccumulated surface tensile strain at Z1 = 40 mm(Figure 16(b)) reveals that the interdendritic filled cracksformed as the thin channels between the equiaxedcrystals as illustrated in Figure 4(a) at the ingot surface.However, the accumulated interdendritic surface tensilestrain at Z1 = 100 mm (Figure 16(b)) exhibits inter-dendritic-filled cracks with a large width between theequiaxed crystals as shown in Figure 4(b). In the case ofthe AA-1050 alloy, eacc fluctuates between a small,accumulated surface compressive strain and a tensilestrain at 3 mm from the surface as shown in Fig-ure 16(b). This is followed by a compressive strain againat 4 mm from the ingot surface. Then, it fluctuates backinto a small interdendritic, accumulated tensile strainuntil 10 mm from the ingot surface. This behavior of theinterdendritic accumulated strain distribution continuesat different positions, and the quantitative difference ofeacc between the different positions Z2 = 82 and180 mm from mold inlet seems small as shown inFigure 16(b). These results and an examination ofFigures 5(a) and (b) show the mechanism of squeezingup rich solute liquid in interdendritic areas between theequiaxed crystals at the ingot surface (Figure 5(a)).However, in the subsurface areas shown in Figure 5(b),
-0.04
-0.02
0
0.02
0.04
0 2 4 6 8 10
Inte
rden
driti
c st
rain
Distance from surafce, (mm)
Z1=40 mm Z1=100 mm
Z2=82 mm Z2=180 mm
-0.10
0.10.20.30.40.50.60.70.8
0 2 4 6 8 10
Acc
umul
ated
str
ain
Distance from surface, (mm)(b)
(a)
Fig. 16—Variations of (a) interdendritic strain and (b) accumulatedstrain distributions with distance mold inlet for different aluminumalloys.
METALLURGICAL AND MATERIALS TRANSACTIONS B VOLUME 43B, JUNE 2012—651

this mechanism is small. It is interesting also to note thatthe development of eacc distributions is similar with thedistributions of the crystal distortion correlation factorshown in Figure 6(c).
C. Interdendritic Crack Formation
It has also been suggested that the susceptibility of thenucleation and propagation of interdendritic cracks canbe determined qualitatively and quantitatively by usingsome critical solidifying/straining criteria of the materialwhen it is still in the mushy zone.[14,15] El-Bealyproposed and formulated these solidifying/strainingcriteria in two concepts. The first is ICSF, which ispresented in Eq. [27]. This concept measures qualita-tively the susceptibility of interdendritic cracking duringthe coherent mushy region.[14] The second concept isEIA, which is presented in Eq. [29]. This concept is tomeasure quantitatively the width of the interdendriticcrack where it simulates the development interdendriticcrack during the coherent mushy region.[15] Also, theIDEC is calculated from the EIA concept and ispresented in Eq. [30]. These criteria have been recordedinstantaneously during the calculations, and their resultsare shown in Figures 17, 18(a) and (b), and 19(a) and (b)under various conditions and for ICSF, EIA, andIDEC, respectively, of different aluminum alloys.[14,15]
Figure 17 illustrates ICSF for different aluminumalloys at different distances from the mold inlet. In thecase of AA-6060, the predicted results point outgenerally that there is an opportunity for interdendriticcracking at Z1 = 40 mm from the mold inlet whereICSF> 0 as shown in Figure 17. This positive oppor-tunity fluctuates at Z1 = 100 mm from the mold inlet.This cracking susceptibility increases within the distancefrom x = 0 to x = 4 mm from surface. Consequently,the positive cracking susceptibility reaches its maximumvalue at x = 6 mm from the surface followed by agradual decrease until 10 mm (Figure 17). These resultsagree qualitatively with the micrographs shown inFigures 4(a) and (b) and with the measured segregationdistributions shown in Figure 10(a) of the AA-6061alloy. However, in the case of the AA-1050 alloy shown
in Figure 17 at different locations from the mold inlet,no opportunity appeared for interdendritic cracking inmost surface and subsurface areas where it becomesICSF< 0. But at distances x = 3 mm and x = 6 mmuntil x = 10 mm from surface, the interdendritic crack-ing susceptibility changes dramatically where it becomesICSF> 0. These results agree qualitatively with themicrographs shown in Figures 5(a) and (b) and with thesegregation measurements illustrated in Figure 10(a) forthe AA-1050 alloy. Therefore, the macrosegregationlevel and its distribution is considered an important toolto predicate the susceptibility of crack nucleation andits morphology as a filled or unfilled crack.[14,15,23]
Also, these predications concur qualitatively withEl-Bealy’s[77] measurements of slab cross-section defor-mation for this alloy and might give an explanation oflarge slab cross-section deformation in the ingot thick-ness and width associated with solidification of the 1050aluminum alloy system.The results shown in Figures 18(a) and (b) demon-
strate EIA distributions at various locations from themold inlet for different aluminum alloys without andwith the crystal distortion correlation factor Fc shown inFigure 8(c), respectively. These figures show the sametrend of EIA distributions without and with the crystaldistortion correlation factor, and the difference betweenthe two aluminum alloys is small. In the case of the AA-6060 alloy, the model predications at Z1 = 100 mmfrom the mold inlet reveal that a thin crack exists at
-1
-0.75
-0.5
-0.25
0
0.25
0.5
0 2 4 6 8 10
ICSF
Distance from surface, (mm)
Z1 = 40 mm Z1 = 100 mm
Z2 = 82 mm Z2 = 180 mm
Fig. 17—Variations of interdendritic cracking susceptibility functionwith distance from the mold inlet for different aluminum alloys.
-1
-0.5
0
0.5
1
0 2 4 6 8 10
EIA
Distance from surface, (mm)
Z1 = 40 mm Z1 = 100 mm
Z2 = 82 mm Z2 = 180 mm
(a)
(b)
-1
-0.5
0
0.5
1
0 2 4 6 8 10
EIA
Distance from surface, (mm)
Fig. 18—Variations of elementary interdendritic area for (a) withoutand (b) with crystal distortion correlation factor of different alumi-num alloys.
652—VOLUME 43B, JUNE 2012 METALLURGICAL AND MATERIALS TRANSACTIONS B

ingot surface areas, and this width increases until themaximum width at x = 2 mm from the ingot surface.This situation changes and the width decreases gradu-ally with the distance from the surface until x = 5 mm.Then, the width increases again slightly at x = 6 mmfollowed a gradual decrease in the crack width untilx = 10 mm. This crack width fluctuation is a result ofvariations in the accumulated interdendritic straingenerated during different cooling regions in the moldzone. These results concur with the different crackwidths shown in Figures 4(a) and (b). However, in thecase of the AA-1050 alloy, EIA is less than zero andshows the same trend with different locations from themold inlet. These results point out that the interdendriticdistances form during the incoherent mushy zone, andthe compressive strain generated in the coherent mushyregion shown in Figures 16(a) and (b) squeezes richsolute liquid up in the interdendritic areas betweenequiaxed crystals as demonstrated in Figure 5(a). Also,this phenomenon is not observed clearly at x = 8 mmwhere EIA> 0 because the increase of the interdendriticdistances between the equiaxed crystals forms as a resultof the shrinkage/contraction mechanism during den-dritic solidification in the incoherent mushy region.Then, the interdendritic compressive strain starts togenerate because of the change in the nature of theinterdendritic strain within the coherent mushy region,which affects the effect of interdendritic strain generatedby different way as shown in Figure 6(b).[41] But this
interdendritic compressive strain is not enough to closethe interdendritic cracks because of the resistance ofsolute liquid, which is squeezed up as shown inFigure 5(b).Finally, Figures 19(a) and (b) illustrate the IDEC
without and with the crystal distortion correlationfactor Fc shown in Figure 8(c), respectively. Generally,the results show the same trend with different aluminumalloys in which IDEC increases with an increase of thedistance from the ingot surface for different aluminumalloys and under various Fc calculating conditions. Also,the results show that this concept differs based on thealloy composition, solidification time, and therefore, onthe grain size. This result agrees well with observationsof Spittle and Cushway[4] as well as Warrington andMcCartney[5] and may give an explanation of theincrease in the susceptibility of interdendritic crackformation with an increase in the solidification time.[4,5]
These figures point out that IDEC varies from 1 lm atx = 0 to 70 lm at x = 10 mm from surface of the AA-6061 alloy, whereas IDEC changes from compressedinterdendritic areas at x = 0 until 42 lm at x = 10 mmfrom the ingot surface for the AA-1050 alloy.
VIII. GENERAL DISCUSSION AND SOLUTIONS
A. Mechanism of Interdendritic Crack Formation
The simulated results of the mathematical modelshown in Figures 13 through 19 combined with ametallographic analysis of crack morphology led to aconsistent mechanism of the formation of interdendriticsurface and subsurface cracks illustrated in Figures 4(a)and (b) and 5(a) and (b). All the aluminum alloysinvestigated exhibit similar behavior in this respect butdiffer in the formation details where the experimentalresults and model predications reveal two approachesfor interdendritic crack formation based on the behaviorof segregation in incoherent mushy region above thecoherent isotherm.In the incoherent mushy region shown in Figure 6(a),
the crystals begin to form and the interdendritic liquidseparates the individual crystals. Based on the operatingconditions, solidification behavior, and thermomechan-ical properties of the alloy, the shrinkage/solid contrac-tion mechanism controls the interdendritic straingeneration.[23,41] Also, the mechanism of no diffusionin a dendritic solid affects the segregation behavior of aninterdendritic solute liquid significantly.[23] These crite-ria result in a sufficient positive segregation for the firstapproach, which is caused by sucking a rich solute liquidfrom hotter regions of the incoherent mushy region.This high segregation reduces the growth rate ofequiaxed crystals and may form a steep change in thesegregation field surrounded by equiaxed crystals in acertain area. This causes the equiaxed crystal distor-tions, which yield an increase in the interdendriticdistance between the crystals as illustrated inFigures 4(a) and (b), 5(a), and 6(b). Therefore, theinterdendritic crack begins to nucleate. Evidence of thismechanism can be found in the etched sample in
0
20
40
60
80
0 2 4 6 8 10
Distance from surface, (mm)
AA-6061 AA-1050
0
20
40
60
80
0 2 4 6 8 10
IDE
C, (
μm)
IDE
C, (
μm)
Distance from surface, (mm)
(a)
(b)
Fig. 19—Variations of interdendritic distances between a pair ofequiaxed crystals for (a) without and (b) with crystal distortion cor-relation factor of different aluminum alloys.
METALLURGICAL AND MATERIALS TRANSACTIONS B VOLUME 43B, JUNE 2012—653

Figures 4(a) and (b) of the AA-6061 alloy where thedifferent interdendritic crack morphologies are identifiedfrequently by their orientation, morphology, and loca-tion. Then, the nature of the interdendritic strain startsto change as shown in Figure 6(c). Consequently, theinterdendritic tensile strain generated by a continuouscooling on the ingot surface shown in Figures 15(a) and(b) continues to increase the distance between thecrystals, which causes increases in the positive macro-segregation. Also, this results in a reduction of theactual solidus temperature and then enlarges the widthof the coherent mushy region. Then, the small interden-dritic compressive strain generates a steep reduction inthe surface cooling or in the increase surface reheatingshown in Figures 15(a) and (b) associated with the airgap dynamics between the ingot surface and the moldwall. This small compressive strain reduces the distancebetween the equiaxed crystals gradually as shown inFigure 6(c). As reheating continues on the ingot surface,the small interdendritic compressive strain maintainsclose to the interdendritic distance and pushes theinterdendritic solute liquid up to form a thin, interden-dritic-filled interdendritic crack in the surface as illus-trated in Figure 4(a) and a wide, interdendritic filledinterdendritic crack beneath the ingot surface as shownin Figure 4(b).
The observations of etched sample shown inFigure 5(a) and the interdendritic strain model predica-tions illustrated in Figures 16(a) and (b) suggest anothermechanism of interdendritic crack formation with thesolidification of the AA-1050 alloy. In this approach, thepositive segregation forms only by the shrinkage/solidcontraction mechanism in the early stages of solidifica-tion in incoherent mushy region (Figures 6(a) and (b).This positive segregation increases the interdendriticdistance between the crystals slightly, but it is notsufficient to distort the crystal shape because the surfacecooling is not continuous as shown in Figure 15(b),which means that the cooling rate decreases signifi-cantly. This reduction prevents an increase in theinterdendritic distance between crystals and, therefore,decreases the change in segregation of the interdendriticsolute liquid. This gives crystals a chance to grownormally under conditions close to those grown underequilibrium conditions. This agrees well with micro-graphs shown in Figures 5(a) and (b). Then, the highinterdendritic compressive strain begins to generate(Figure 16(a)) and closes the interdendritic distancebetween the crystals, which results in squeezing the richsolute liquid up and forming thin, interdendritic com-pressed cracks. These experimental observations andmodel predications agree well with most hypotheses andfindings of previous researchers.[2–5,8,14,16,80]
B. Solutions
This mechanism suggests several different methods foravoiding and preventing the formation of surface andsubsurface cracks. The first of these is to prevent theingot surface from high and continuous cooling withinthe distance of 100 to 150 mm from mold inlet. Thus, itavoids the large increase in interdendritic distance
between the crystals, which is associated with theshrinkage/solid contraction mechanism in the incoher-ent mushy region. To ensure that subsurface cracks alsodo not form, it would be preferable to prevent the ingotsurface from a steep fluctuation in the surface coolingconditions because of the air gap dynamics. This couldbe achieved by controlling the operating conditions bychoosing suitable casting speed,[2] selecting the moldmaterial,[81] and controlling the mold cooling conditionswithin this critical distance.[19]
Alternatively, slow, controlled cooling through thecritical distance in the mold zone might alleviate theproblem by delaying and reducing the magnitude ofthe shrinkage/solid contraction of the solidified alloy.This process agrees with the mold designs of previouswork by Finn et al.[17] They used the insulation part onthe mold top to reduce the initial surface cooling rateduring early stages of solidification, which reduces theinterdendritic thermometallurgical tensile strain genera-tion by shrinkage and contracting strains in the inco-herent mushy region. It is interesting to note that thecooling rate experienced by the length of mold insulatingmaterial to define when the surface starts to reheat. Thiswould again reduce the magnitude of the tensile peaksexperienced by the length of the insulating part andreduce the likelihood of interdendritic crack formationbeneath the ingot surface.
IX. CONCLUDING REMARKS
The mathematical model predications of temperature,interdendritic strain, and macrosegregation, in combi-nation with metallographic observations and measure-ments from collected samples of plant trials, clearlyreveal the mechanism of the formation of surface andsubsurface cracks in an equiaxed crystal structure. Theresults of this work suggest several different tools tomeasure and simulate interdendritic cracks as follows:
1. ICSF measures qualitatively the susceptibility of theinterdendritic crack if ICSF> 0 and defines itslocation.
2. EIA simulates quantitatively an interdendritic crackwidth and its morphology.
3. Macrosegregation distribution plays a major role todetermine the location, size, and morphology of theinterdendritic crack.
Also, the key findings of this study suggest severalsolutions to prevent these interdendritic cracks, whichare summarized in the following:
1. Select the suitable operating conditions, mold mate-rial, and mold cooling conditions.
2. Prevent the surface cooling rate during early stages ofthe mold cooling zone by insulating the mold top part.
ACKNOWLEDGMENTS
The author wishes to express his sincere gratitude toProf. Merton Flemings, former Head of the Depart-ment of Materials Science and Engineering, Massachu-setts Institute of Technology (MIT), Cambridge, MA,
654—VOLUME 43B, JUNE 2012 METALLURGICAL AND MATERIALS TRANSACTIONS B

for his early pioneering work in the fields of segrega-tion and solidification cracks, which guided the authorto several facts in these fields. Also, he offers his sin-cere gratitude to Prof. Hasse Fredriksson, Departmentof Materials Science and Engineering, Royal Instituteof Technology, Institute of Materials Processing,Stockholm, Sweden, for his considerable supervision,guidance, helpful discussions throughout the work,and valuable assistance. The author aspirates the pre-vious help and useful discussions from Prof. MichaelRappaz, Laboratoire de Metallurgie Physique, EcolePolytechnique Federale de Lausanne, Lausanne, Swit-zerland, and Prof. David Poirier, Department ofMaterials Science and Engineering, University of Ari-zona, Tucson, AZ. The author is also especially grate-ful for the financial support of Companies’ Chair ofthe Swedish Iron Masters Association, Stockholm,Sweden. He is also grateful to Egyptian CopperWorks, Hagar El-Nawatia, Alexandria, Egypt, whokindly supplied him with ingot samples. The author’ssincere gratitude is due to the assistances in metallurgi-cal laboratories, Faculty of Engineering, Ain ShamsUniversity, Cairo, Egypt.
NOMENCLATURE
A elementary area (m2)a, b constants in Eq. [10]Cp specific heat (kJ/kgK)Eg volumetric energy (W/s m3)E modulus of elasticity (N/m2)Fc crystal distortion correlation factorh(t) heat transfer coefficient at time t (W/m2K)H enthalpy (kJ/kg)�H average enthalpy (kJ/kg)kc coefficient in Eq. [8]Ke equilibrium partition coefficientlcoh coherent solid shell thickness (mm)Ls slab width (mm)L latent heat of fusion (kJ/kg)M bending moment (Nm)n number of measured fieldsP pressure (N/m2)Q/, Qx surface and x isotherm heat fluxes (kW/m2)Pw ferrostatic pressure (N/m2)Rd radius of equiaxed crystal (m)Sj macrosegregation ratio of element jSmeaj actual measured composition of j element
(wt pct)Soj nominal composition of j element (wt pct)Spj predicted composition of element j (wt pct)Sv grain boundary surface area per unit volume
(1/m)t time (s)tf solidification time (s)T temperature (�C)T/, Tw ingot surface and cooling fluid temperature
(�C)u local interdendritic liquid velocity (m/s)V volume (m3)
Va dendritic growth rate (m/s)x, y, z Cartesian coordinates (m)�X mean measurements value (lm)Xi individual measurement value (lm)
GREEK SYMBOLS
a thermal expansion coefficient (1/�C)a instantaneous diffusion parameter (m2/s)e strainP
ei total strain per unit volume i/1 grain size (lm)K mushy permeabilityg coordinate for local energyk thermal conductivity (W/m2K)q density (kg/m3)�q average density (kg/m3)r standard deviation (lm)s stress (N/m2)n bulging (mm)D infinitesimal element of length or time
SUPERSCRIPTS
acc accumulativeacc* interdendritic accumulativec creepeff effectivee elasticl liquidm mechanicalmk exponent in Eqs. [20] and [21] of solid phase kTph thermometallurgicaltot total
SUBSCRIPTS
coh coherentconv convection streameff effectiveInt interdendritic liquidl liquidm meltings solid
REFERENCES1. J. Campbell: Castings, Butterworth Heinemann, London, UK,
1991.2. M.L. Nerberg: Ph.D. Dissertation, University of Oslo, Oslo,
Norway, 1991.3. W.S Pellini: Foundry, 1952, vol. 80, pp. 125–33, 192–99.4. J.A. Spittle and A.A. Cushway: Met. Technol., 1983, vol. 10,
pp. 6–13.5. D. Warrington and D.G. McCartney: Cast Met., 1989, vol. 2,
pp. 134–43.6. K. Kinoshita, G. Kasai, and T. Emi: Proc. Solidification and
Casting of Metals, TMS, Warrendale, PA, 1979, pp. 268–74.
METALLURGICAL AND MATERIALS TRANSACTIONS B VOLUME 43B, JUNE 2012—655

7. Y.F. Guven and J.D. Hunt: Cast. Met., 1988, vol. 1, pp. 104–11.8. T.W. Clyne and G.J. Davies: Br. Foundrymen, 1981, vol. 74,
pp. 65–73.9. U. Feurer: Gieberei-Forschung, 1976, vol. 28, pp. 75–80.10. M. Rappaz, J.-M. Drezet, and M. Gremaud:Metall. Mater. Trans.
A, 1999, vol. 30A, pp. 449–55.11. J.-M. Drezet and M. Rappaz: 1st ESAFORM Conf. on Material
Froming, J.L. Chenot, J.F. Agassant, P. Montmitonnet,B. Vergnes, and N. Billon, eds., ESAFORM, Sophia Antipolis,France, 1998, pp. 49–52.
12. G.K. Sigworth: AFS Trans., 1999, vol. 106, pp. 1053–69.13. M. El-Bealy and B.G. Thomas: Proc. 54th Electric Furnace Conf.,
1996, Dallas, TX, pp. 565–79.14. M.O. El-Bealy:Proc. TMSConf., 2001, SanDiego, CA, pp. 683–92.15. M. El-Bealy: Metall. Mater. Trans. B, 2000, vol. 31B, pp. 331–43,
345–55.16. M.O. El-Bealy and H.A. El-Emairy: Proc. ‘‘Light Metals’’ TMS-
AnnualMeeting ‘‘Cast Shop Technology’’, 2007, Orlando, FL, pp.765–74.
17. T.L. Finn, M.G. Chu, and W.D. Bennon: Micro/Macro ScalePhenomena in Solidification, C. Beckermann, L.A. Bertram, S.J.Pien, and R.E. Smelser, eds., ASME, New York, NY, 1992, HTD-vol. 218/AMD-vol. 139, pp. 17–26.
18. K. Buxmann and E. Gold: J. Metals, 1982, vol. 4, pp. 28–34.19. C.A. Muojekwu, I.V. Samarasekera, and J.K. Brimacombe:
Metall. Mater. Trans. B, 1995, vol. 26B, pp. 316–82.20. W. Schneider and E.K. Jensen: Light Metals, C.M. Bickert, ed.,
TMS-AIME,Warrendale, PA, 1990, pp. 931–36.21. E.K. Jensen and W. Schneider: Light Metals, C.M. Bickert, ed.,
TMS-AIME, Warrendale, PA, 1990, pp. 937–43.22. J. Ni and C. Beckermann: Metal. Trans. B, 1991, vol. 22B,
pp. 349–61.23. M.O. El-Bealy: Light Metals, M. Cross, J.W. Evans, and C.
Bailey, eds., TMS-AIME, Warrendale, PA, 2010, pp. 683–88.24. M.O. El-Bealy: Can. Metall. Q., 2010, vol. 49, pp. 47–62.25. M.El-Bealy: Scand. J.Metall., 1995, vol. 24 (1, 2), pp. 63–80, 106–20.26. L.H. Van Vlack: A Textbook of Materials Technology, Addison-
Wesley, Boston, MA, 1973.27. Metals Handbook, ASM International, Materials Park, OH, 1990,
vol. 2, pp. 152–77.28. R. DeHoff and F. Rhines: Mater. Sci. Eng., McGraw-Hill,
Columbus, OH, 1968.29. ASTM Grain size: Metallography, 1987, vol. 35, pp. 18–19.30. C.Y. Wang and C. Beckermann: Metal. Trans. A, 1993, vol. 24A,
pp. 2787–2802.31. D.J. Lahaie and M. Bouchard: Metall. Mater. Trans. B, 2001,
vol. 32B, pp. 697–705.32. C. Charbon and M. Rappaz: Acta Mater, 1996, vol. 44, pp. 2663–
68.33. M.C. Flemings and G.E. Nereo: Trans. TMS-AIME, 1967,
vol. 239, pp. 1449–61.34. S. Vernede and M. Rappaz: Phil. Mag, 2006, vol. 86 (23),
pp. 3779–94.35. V. Mathier, A. Jacot, and M. Rappaz: Mod. Sim. Mat. Sci. Eng.,
2004, vol. 12, pp. 479–90.36. H.J. Thevik, A. Mo, and T. Rusten:Metall. Mater. Trans. B, 1999,
vol. 30B, pp. 135–42.37. I.H. Hove, B. Andersson, and D. Voss: Proc. 3rd Conf. on
Aluminum Alloys-TheirPhysical and Mechanical Properties,L. Arnberg, O. Lohne, E. Nes, and N. Ryum, eds., Trondheim,Norway, 1992, vol. 2, pp. 264–69.
38. M.O. El-Bealy and R.M. Hammouda: Steel Res. Int., 2007,vol. 78, pp. 602–11.
39. D. Mortensen: Metall. Mater. Trans. B, 1999, vol. 30B, pp. 119–33.
40. D.R. Poirier, P.J. Nandapurkar, and S. Ganesan:Metall. Trans. B,1991, vol. 22B, pp. 889–900.
41. M.O. El-Bealy: Metall. Mater. Trans. B, 2011, vol. 43B, pp. 1–17.42. C. Li and B.G. Thomas: Metall. Mater. Trans. B, 2004, vol. 35B,
pp. 1151–72.43. A.J. Williams, T.N. Croft, and M. Cross: Metall. Mater. Trans. B,
2003, vol. 34B, pp. 727–34.
44. M.M. Hamdi, S. Benum, D. Mortensen, H.G. Fjaer, and J.M.Drezet: Metall. Mater. Trans.A, 2003, vol. 34A, pp. 1941–52.
45. T.S. Piwonka and M.C. Flemings: Trans. AIME, 1966, vol. 236,pp. 1157–65.
46. A.V. Reddy and C. Beckermann: Metall. Mater. Trans. B, 1997,vol. 28B, pp. 479–89.
47. G.H. Geiger and D.R. Poirier: Transport Phenomena in Metal-lurgy, Addision-Wesley, Reading, MA, 1973, p. 92.
48. E. Scheil: Metallforschung, 1947, vol. 2, p. 69.49. A. Mo, T.E. Johnsen, B.R. Henriksen, E.K. Jensen, and O.R.
Myhr: Proc. ‘‘Light Metals’’ TMS-Annual Meeting ‘‘Cast ShopTechnology’’, 1994, U. Mannweiler, ed., TMS-AIME, pp. 889–96.
50. G. Chai, L. Backnart, T. R/lland, and L. Arnberg: Metall. Mater.Trans. A., 1995, vol. 26A, pp. 965–70.
51. M.C. Flemings: Solidification Processing, M.B. Bever, M.E.Shank, C.V. Wert, and R.F. Mehl, eds., McGraw-Hill, New York,NY, 1974, pp. 154–57.
52. J.O. Kristiansson: J. Thermal Stresses, 1982, vol. 5, pp. 315–30.53. K. Miyazawa and K. Schwerdedteger: Ironmaking Steelmaking,
1979, vol. 6, pp. 68–74.54. M.O. El-Bealy: Can. Metall. Q., 1997, vol. 36 (1), pp. 49–56.55. M. Chakraborti: Strength of Materials, 2001, S.K. Kataria & Sons,
Nai Sarak, Delhi.56. M.F. Spotts and T.E. Shoup: Design of Machine Elements, 7th ed.,
Prentice-Hall, Upper Saddle River, NJ, 1998.57. W.D. Bennon and F.P. Incropera: Int. J. Heat Trans Mass Trans.,
1987, vol. 30 (10), pp. 2161–70.58. W.D. Bennon and F.P. Incropera: Metall. Trans. B., 1987,
vol. 18B, pp. 611–16.59. V.R. Voller, A.D. Brent, and C. Prakash: Int. J. Heat Mass Trans.,
1989, vol. 32, pp. 1719–32.60. S. Gansesan and D.R. Poirier: Metall. Trans. B, 1990, vol. 21B,
pp. 173–81.61. R. Viskanta: JSME International J., 1990, vol. 33 (3), pp. 409–23.62. P.J. Prescott, F.P. Incropera, and W.D. Bennon: Int. J. Heat
Trans. Mass Trans., 1991, vol. 34 (9), pp. 2351–59.63. J. Ni and C. Beckermann: Metall. Trans. B, 1991, vol. 22B,
pp. 349–61.64. Q.Z. Diao and H.L. Tsai: Metall. Trans. A, 1993, vol. 24A,
pp. 963–73.65. M.O. El-Bealy: Ph.D Dissertation, Royal Institute of Technology,
Stockholm, Sweden, 1995.66. M. Bamberger, B.Z. Weiss, and M.M. Stupel: Mater. Sci. Tech-
nol., 1987, vol. 3, pp. 49–56.67. K. Ho and R.D. Pehlke:Metall. Trans. B, 1985, vol. 16B, pp. 585–
94.68. L.D.J. Sully: AFS Trans., 1976, vol. 84, pp. 735–44.69. N.A. Shah and J.J. Moore: Metall. Trans. B, 1989, vol. 20B,
pp. 893–910.70. T.S. Prasanna Kumar and K. Narayan Prabhu: Metall. Trans. B,
1991, vol. 22B, pp. 717–27.71. M. El-Bealy and H. Fredriksson: Scand. J. Metall., 1994, vol. 23,
pp. 140–50.72. M.O. El-Bealy: Proc. 6th European Conference on Continuous
Casting, 2008, Riccione, Italy.73. G. Dahlquist and A. Bjorck: Numerical Methods, Prentice-Hall
Inc., Englewood Cliffs, NJ, 1974, p. 277.74. J.-M. Drezet and M. Rappaz: Metall. Mater. Trans. A, 1996,
vol. 27A, pp. 3214–25.75. L. Ohm and S. Engler: Metall. Trans., 1989, vol. 43, pp. 520–24.76. VDI-Warmeatlas, 4. Auflage, VDI Verlag GmbH, Dusseldorf,
1984.77. M.O. El-Bealy: Proc. Aluminum Two Thousand Congress Alumi-
num 2000-2011 Conference, Bologna, Italy.78. N.A. El-Mahallawy and A.M. Assar: J. Mater. Sci., 1991, vol. 26,
pp. 1729–33.79. S. Vernede, P. Jarry, and M. Rappaz: Acta Metall., 2006, vol. 54,
pp. 4023–34.80. L. Erickson: Scand. J. Metall., 1977, vol. 6, pp. 116–24.81. T. Bourgeois: Private Communications, Alcan International
Limited, Arivda R & D Centre, September 6th, 1996, Jonquere,Quebec, Canada.
656—VOLUME 43B, JUNE 2012 METALLURGICAL AND MATERIALS TRANSACTIONS B